Article

Effects of Glomalin-Related Soil Protein Driven by Root on Forest Soil Aggregate Stability and Carbon Sequestration during Urbanization in Nanchang, China

1
Jiangxi Provincial Key Laboratory of Silviculture, Jiangxi Agricultural University, Nanchang 330045, China
2
College of Forestry, Jiangxi Agricultural University, Nanchang 330045, China
*
Authors to whom correspondence should be addressed.
Plants 2023, 12(9), 1847; https://doi.org/10.3390/plants12091847
Submission received: 17 March 2023 / Revised: 21 April 2023 / Accepted: 29 April 2023 / Published: 30 April 2023
(This article belongs to the Special Issue Plant-Soil Interaction Response to Global Change)

Abstract

:
Glomalin-related soil protein (GRSP) is a hydrophobic protein released by arbuscular mycorrhizal fungi. It is an important component of the soil carbon pool, and it improves the soil aggregate structure; however, it remains unclear whether GRSP can enhance soil carbon sequestration and improve soil quality during rapid urbanization. The built-up area in Nanchang, China was the study area, and the proportion of impervious surface area was the parameter of urbanization intensity. A total of 184 plots (400 m2) were set up to collect soil samples (0–20 cm) for analysis. Aggregates of five particle sizes were sieved, and the percentage amounts of soil organic carbon (SOC) and GRSP for them were determined. The results showed that the easily extractable GRSP (EE-GRSP) and total GRSP (T-GRSP) contents of the four aggregates of <2 mm were 22–46% higher in low urbanization areas than those in high urbanization areas (p < 0.05), indicating that the higher urbanization intensity was associated with the lower GRSP content of different aggregates. The GRSP was significantly positively correlated with SOC (p < 0.05). Moreover, the contribution of GRSP to the SOC pool in the <0.25 mm aggregate was significantly higher than that in other aggregates. In addition, the EE-GRSP content was significantly positively correlated with mean weight diameter (MWD) and geometric mean diameter (GMD) in the four aggregates of <2 mm, whereas it was negatively correlated with fractal dimension (D) in the >2 mm, 1–2 mm and <0.053 mm aggregates. The T-GRSP content showed significant correlations only with MWD, GMD, and D in the 1–2 mm aggregate. This study revealed that increasing urbanization intensity can significantly reduce the GRSP content of different sized aggregates. Moreover, the GRSP content significantly promoted SOC sequestration, and the EE-GRSP content more significantly promoted soil aggregate stability than that of the T-GRSP. These findings provide new ideas for exploring the improvement of soil quality during the process of urbanization.

1. Introduction

Urbanization is an inevitable process in human social progress and development. Although urban areas account for only 1% of the global land area, they host more than 50% of the global population [1], and are continuing to expand rapidly [2]. The urban population is predicted to reach 67% of the total global population by 2025 [3], and thus urban area will be three times larger in 2030 than in 2000 [4]. With the rapid urbanization of China, rapid economic development will bring about unprecedented expansion of urban land and population [5,6]. China has mainly focused on old urban areas for urban expansion, which shows an obvious spatial distribution form of “urban–suburban–rural” [7]. Natural land has been gradually covered by gray infrastructure, such as roads and houses, and rapidly accelerating urbanization is bound to have a significant impact on urban soil ecosystems [8]. Soils are essential for human survival and development, providing important ecosystem services to humans, such as the regulation of water, carbon cycle, and greenhouse gas emissions [9]. However, severe human disturbances in cities have led to a general decline in urban soil quality, such as higher electrical conductivity, higher bulk density and compaction, lower porosity and infiltration rates, and poorer aeration and water storage capacity. All these factors degrade the soil structure [10]. Moreover, urban soil sealing can cause a significant decrease in the soil organic carbon (SOC) content, which affects the urban ecosystem carbon cycle and the global carbon cycle process, negatively impacting the soil carbon pool [2,11].
A beautiful city should be rooted in healthy soils; however, the current status of soil degradation often severely limits the healthy growth of plants. Therefore, a detailed study of changes that occur in soil structure and carbon content during urbanization is important in order to improve soil quality and promote soil carbon sequestration [12]. Soil aggregates are the basic units of the soil structure. The particle size composition and stability of soil aggregates are important evaluation indicators of soil structure [13], which affects soil porosity, erosion resistance, and nutrient cycling. Furthermore, this is an important basis for soil water and fertilizer conservation and supply functions [14]. In recent years, many studies have confirmed that soil aggregate stability has a significant positive correlation with SOC content [15,16]. On the one hand, soil aggregates are the main site of soil organic carbon fixation, which can protect SOC and weaken the decomposition and mineralization of microorganisms. On the other hand, SOC is an important binding material in forming soil aggregates. Its content level is the key to forming a good soil structure and improving soil resistance to oxygenolysis [17,18]. The formation of soil aggregates is influenced by several factors, such as plant root growth, changes in the soil physical and chemical properties (e.g., pH and bulk density), the activities of soil animals and microorganisms, and human disturbance. In particular, plant roots can effectively control soil erosion and thus stabilize soil structure, playing a crucial role in the formation of soil aggregates and sequestration of SOC [19]. However, the urban environment with its high human disturbance is more complex than the natural environment; therefore, it is necessary to study the changes in SOC and soil aggregate stability during the urbanization process.
Arbuscular mycorrhizal fungi (AMF) are widely distributed plant symbiotic organisms that form symbiotic relationships with the roots of more than 80% of higher plants [20]. The AM symbiont could significantly improve the ability of the host plant to absorb mineral nutrients (especially phosphorus) and enhance the ability of the host plant to resist disease, drought, and salt damage [21]. At the same time, AMF not only promote the formation of soil aggregates and the fixation of organic carbon, but also improve the ability of plants to absorb nutrients and withstand plant stress [22]. The AMF can spread through the soil through growth of the mycelium using a hydrophobic and stable protein called the glomalin-related soil protein (GRSP). It was first extracted successfully in 1996 by Wright et al. [23] at 121 ℃ with 20 mmol/L sodium citrate solution. The GRSP is classified into easily extractable GRSP (EE-GRSP) and total GRSP (T-GRSP) according to their extractability [24]. The GRSP content is an important indicator of soil quality [25]. First, GRSP enhances the stability of soil aggregates. Furthermore, GRSP is known as “super glue” because of its bonding ability, which is three to ten times stronger than that of common carbohydrates [24]. The GRSP can bond fine and unstable soil particles into larger and more stable aggregates, which improves the soil water permeability, soil stability, and porous structure [26], making soil organic matter less susceptible to decomposition and increasing SOC accumulation [27]. Second, GRSP is an important component of SOC and a major source of soil carbon pools [28]. The fixation of the SOC by GRSP plays an important role in ecological cycles, and the contribution of GRSP to the soil carbon pool is much larger than that of active microorganisms in the soil [29]. However, it is unclear how GRSP distribution during urbanization affects the structural stability of soil aggregates and soil carbon sequestration.
Nanchang is the capital city of Jiangxi Province in China, and is highly urbanized and its main soil type is red soil [30]. The population size reached 5.06 million at the end of 2021, and the proportion of impervious surface area was up to 78.64% (Nanchang Municipal Government, China). The special characteristics of red soil include it being acidic, impoverished, and cohesive. Inadequate and unreasonable exploitation has occurred during the rapid urbanization process. Increasingly compacted soils, reduced porosity, loss of organic matter, and the degradation of water and fertilizer storage capacity seriously affect the sustainability of the urban ecological environment [31]. Consequently, this study was undertaken to (1) analyze the distribution characteristics of the GRSP and SOC contents in different urbanization intensity areas in Nanchang city, (2) elucidate the contribution of GRSP to SOC, and (3) reveal the relationship between GRSP and soil structural stability. It was hypothesized that the distribution characteristics of GRSP would differ in soil aggregates from areas of different degrees of urbanization due to different levels of human interference. The results should benefit the evaluation of the effects of GRSP on soil aggregate stability and carbon sequestration during urbanization in Nanchang, China, and should help in providing a scientific basis and methods for the improvement of urban soil quality.

2. Results

2.1. Effect of the Urbanization Intensity on the Soil Aggregate Composition

Table 1 shows the differences in the percentage content of stable aggregates in soil water from areas of different urbanization intensities as indicated by the proportion of impervious surface area. The percentage values of the particle size range 0.053–0.25 mm were significantly lower at sites of low urbanization intensity than those from sites of high urbanization intensity (p < 0.05). Taking into consideration the stable aggregates distribution in water, regardless of the urbanization intensity, the 0.25–1 mm aggregates showed the highest values, while the >1 mm aggregates showed the lowest ones. Moreover, the values of the 0.25–1 mm aggregates were significantly higher than those of the aggregates > 1 mm (p < 0.05).
The differences in the stability of aggregates in water from areas of different urbanization intensities are shown in Table 2. Values of both the MWD and GMD indicators were the highest in samples from the low urbanization intensity region, whereas those of both the D and UAI indicators were the lowest in samples from the low urbanization intensity region, indicating that the aggregates in soil water were relatively stable in the samples from the low urbanization region.

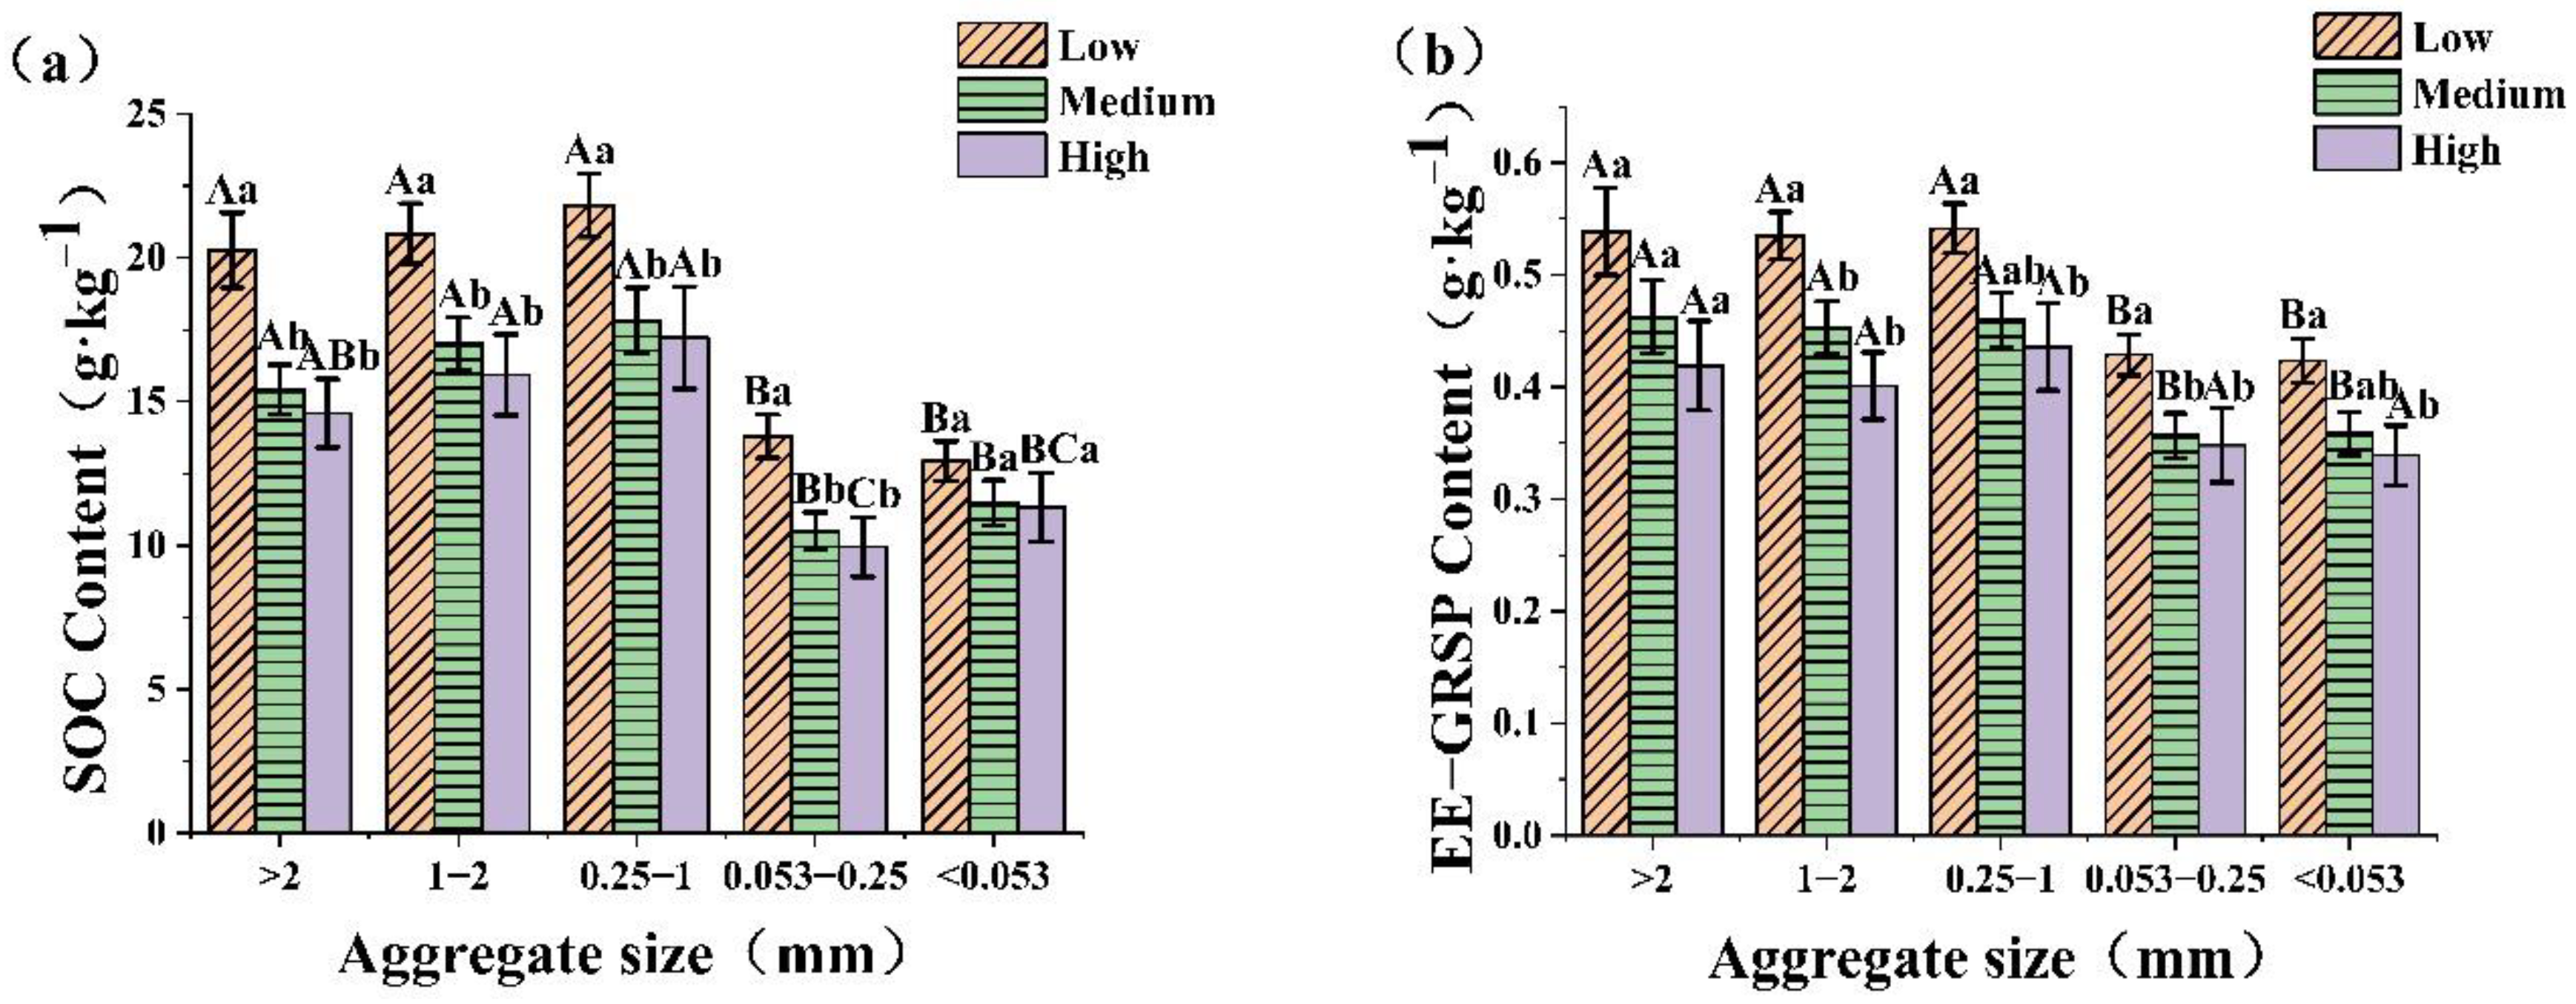
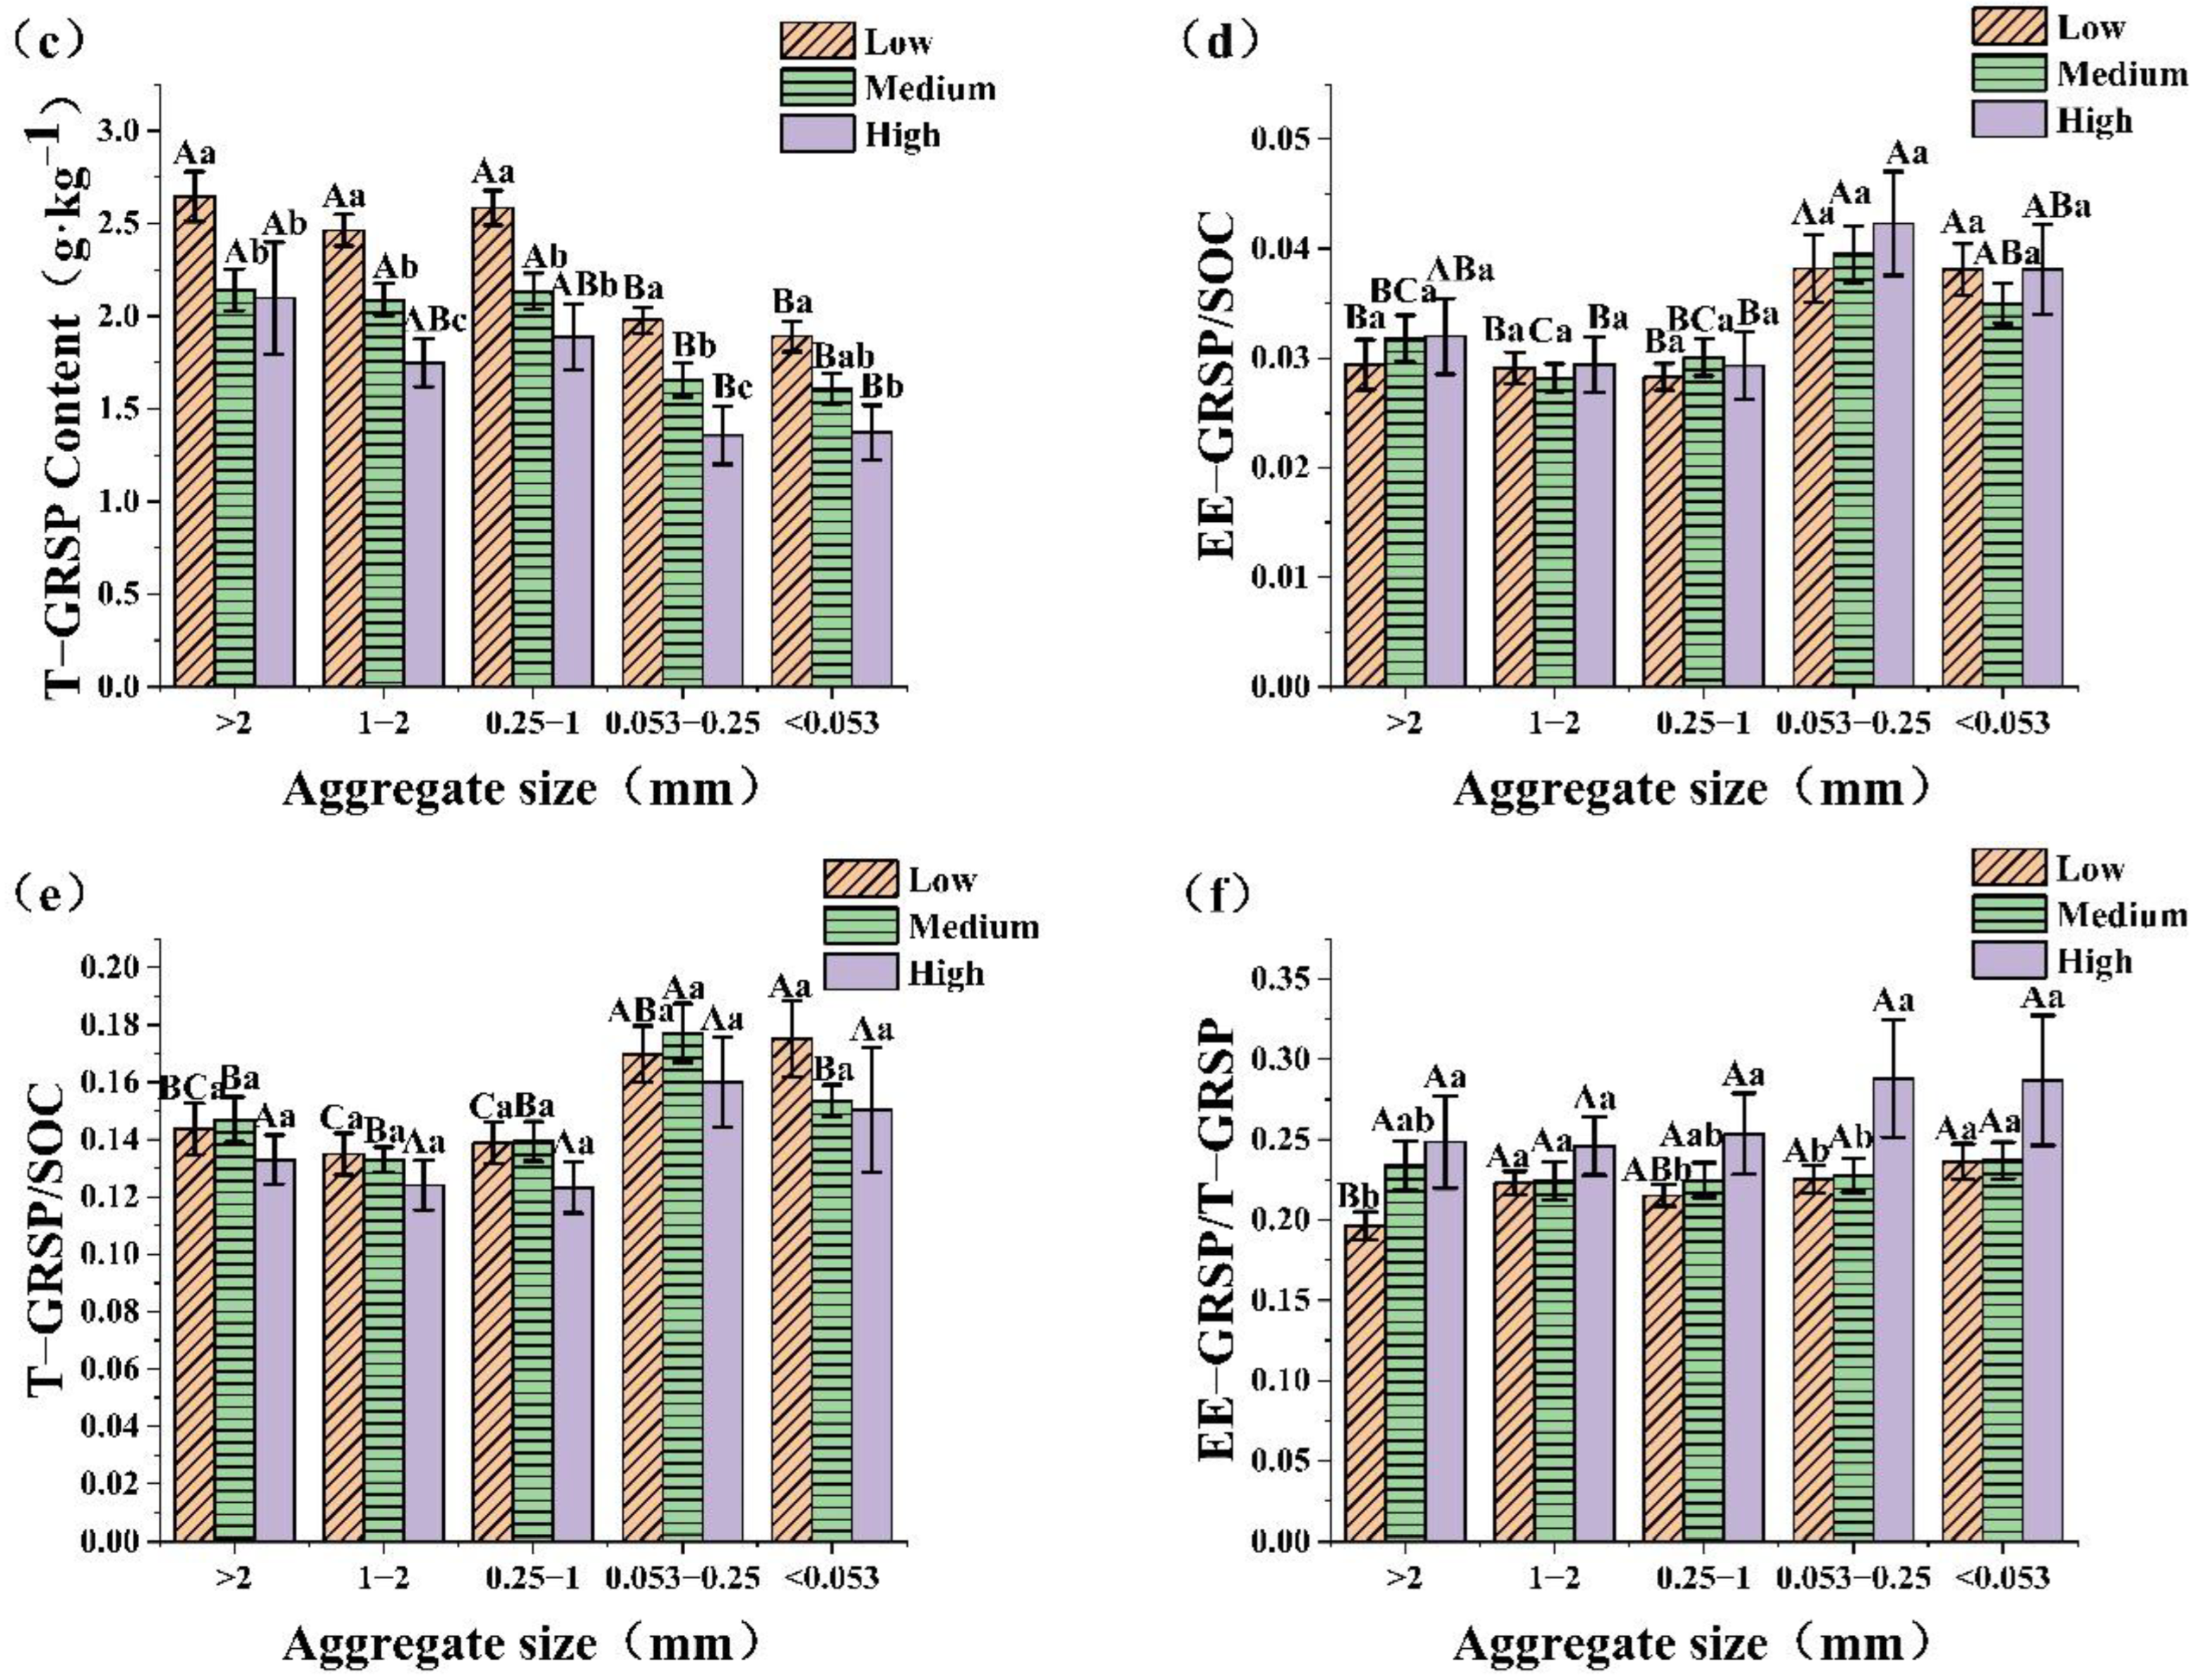
2.2. Effect of Urbanization Intensity on SOC and GRSP in Different Soil Aggregates

The distributions of SOC, EE-GRSP, and T-GRSP content in soil aggregates of different particle size are shown in Figure 1a–c. The SOC, EE-GRSP, and T-GRSP contents in most soil aggregates showed significant decreasing trends (p < 0.05) with an increasing urbanization intensity. However, only SOC in the <0.053 mm aggregate and EE-GRSP in the > 2 mm aggregate showed no significant difference among the different urbanization intensities. The T-GRSP in the five aggregates was significantly higher at a low urbanization intensity than at high urbanization intensity with 26–46%. Moreover, the SOC, EE-GRSP, and T-GRSP contents in the >0.25 mm particles were significantly higher than in the <0.25 mm particle sizes at low–medium urbanization intensities (p < 0.05).
There was no significant difference in the ratio of EE-GRSP/SOC and T-GRSP/SOC in soil aggregates with different urbanization intensities. However, for the same urbanization intensities (Figure 1d,e), the GRSP/SOC ratio of particle sizes >2 mm, 1–2 mm, and 0.25–1 mm was significantly lower than that of 0.053–0.25 mm and <0.053 mm (p < 0.05). The ratio of EE-GRSP/T-GRSP in the three particle sizes of >2 mm, 0.25–1 mm, and 0.053–0.25 mm showed a significant upward trend with the increase in urbanization intensity (p < 0.05) (Figure 1f). In the low urbanization intensity, the EE-GRSP/T-GRSP ratio in aggregates of >2 mm was significantly lower than that of 1–2 mm, 0.053–0.25 mm and <0.053 mm (p < 0.05).

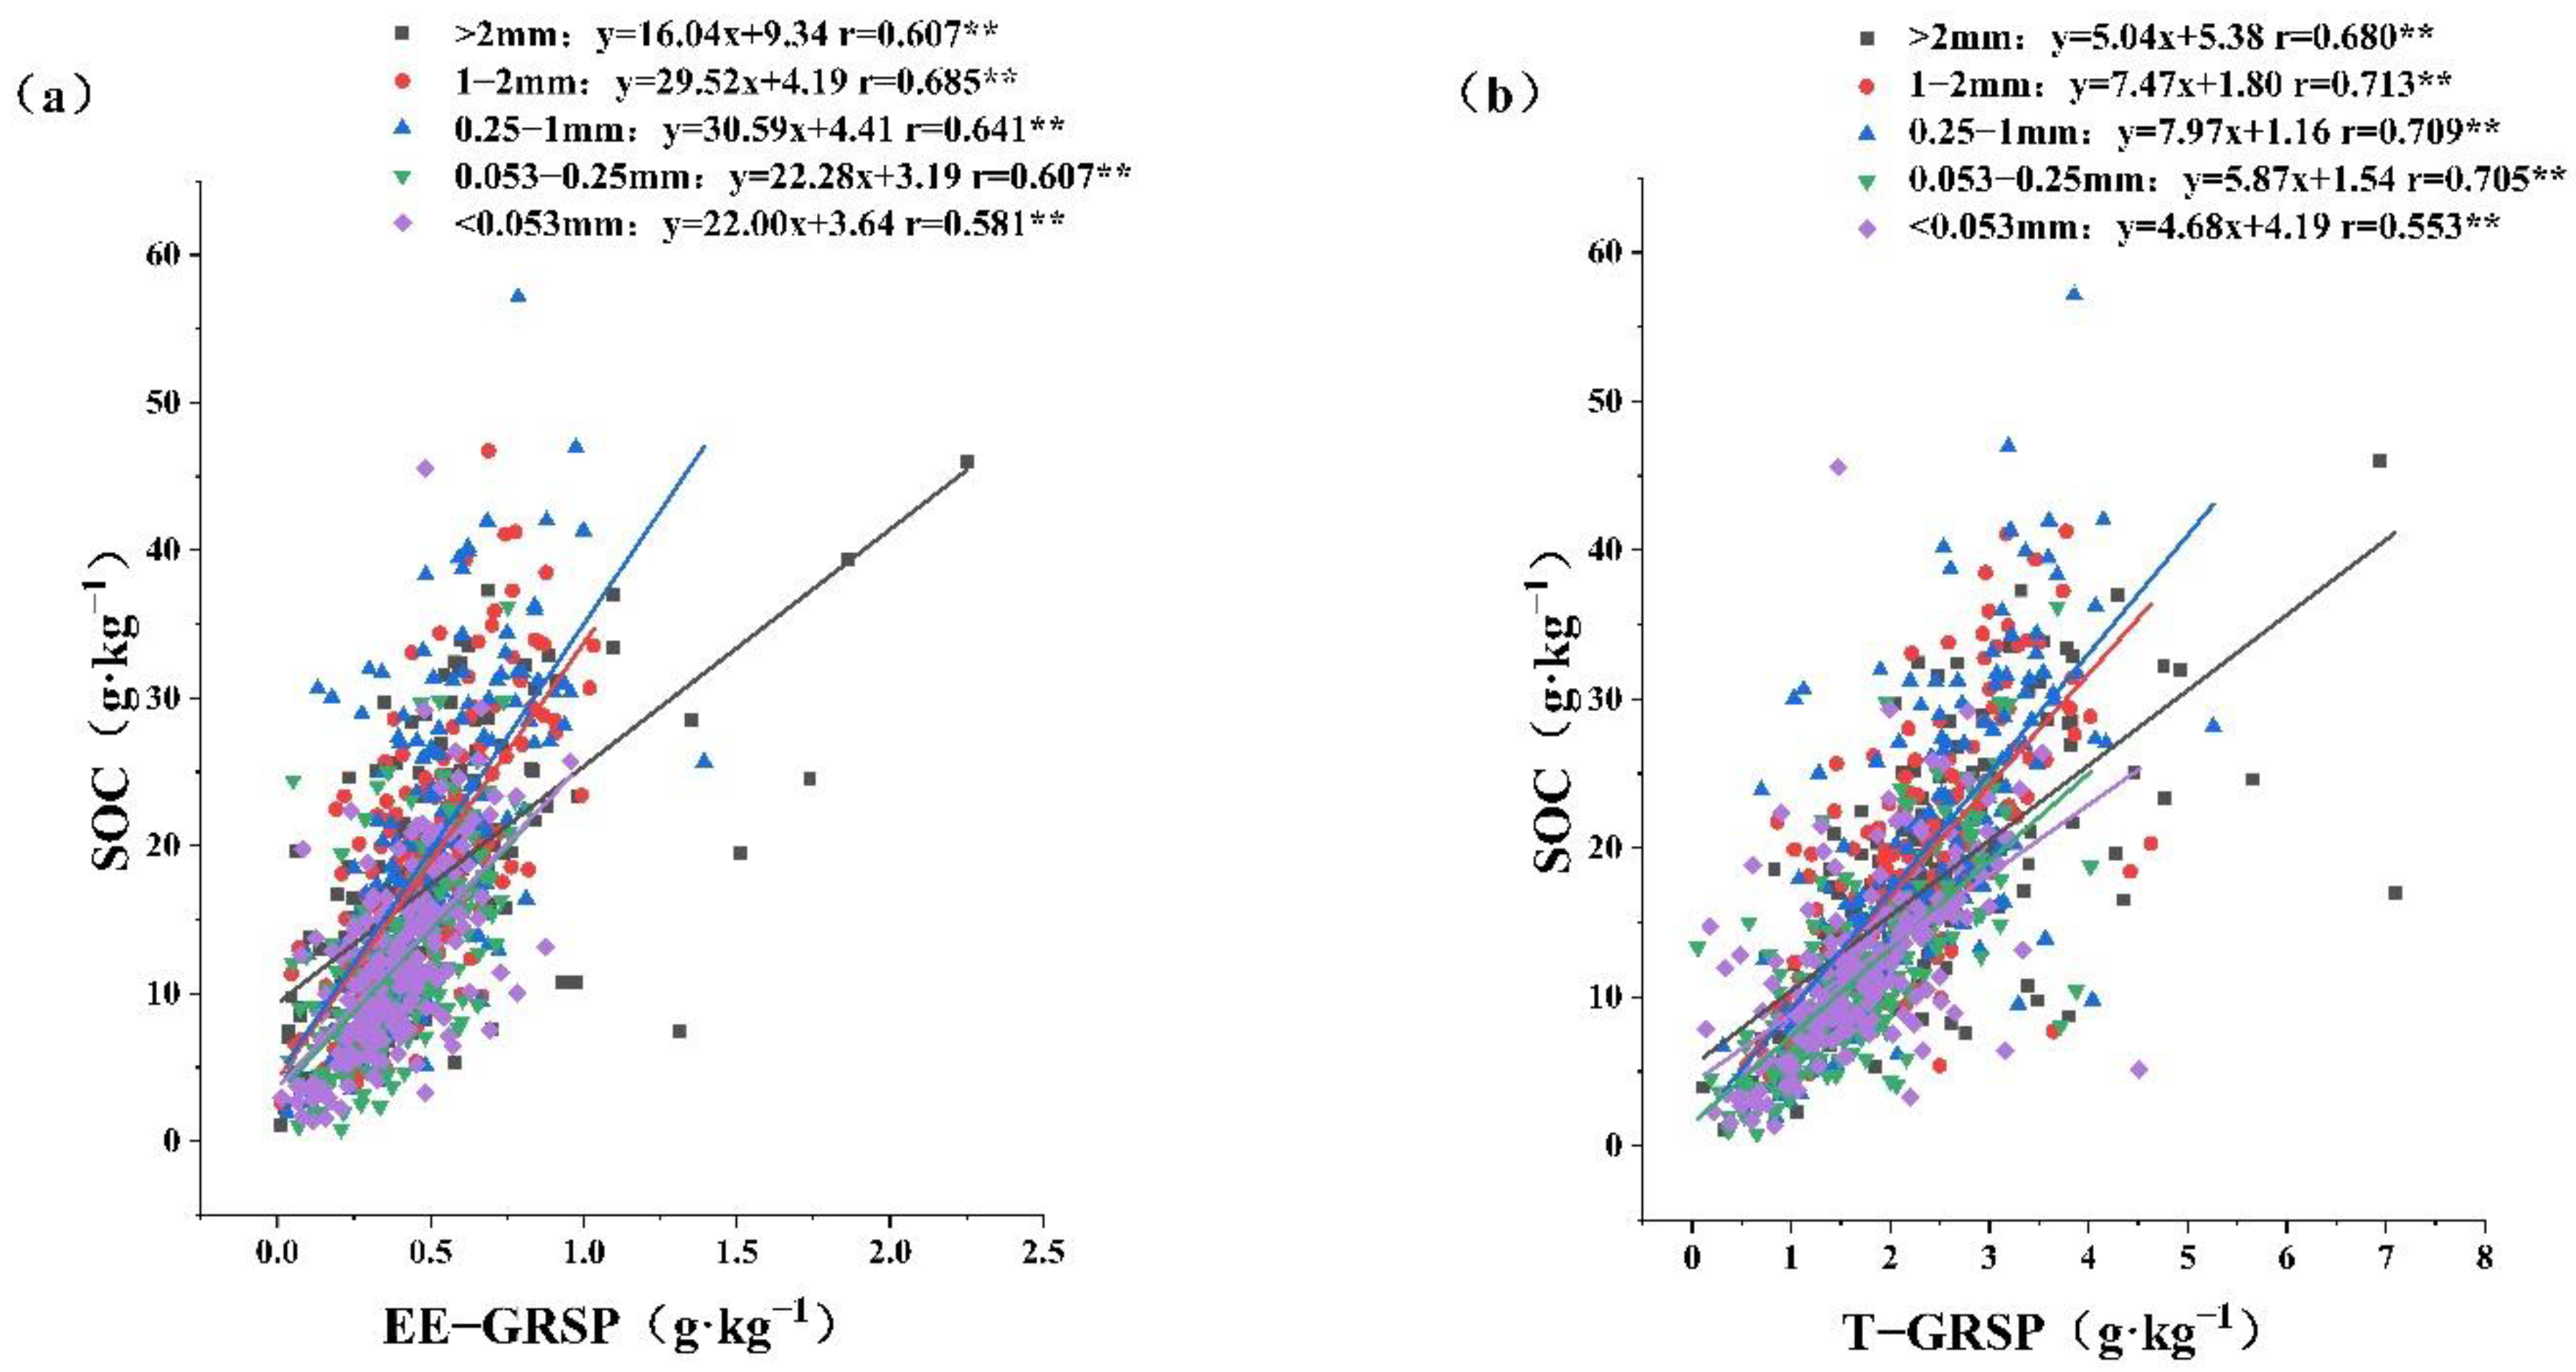
2.3. Relationships between GRSP and SOC

The significant correlations between GRSP (T-GRSP and EE-GRSP) and SOC in each aggregate type are shown in Figure 2 (p < 0.01). The strongest correlation was found in the 1–2 mm aggregate with the highest r value (0.685, 0.713), and the weakest correlation in the <0.053 mm aggregate with the lowest r value (0.581, 0.553). These results suggest that the GRSP content in the aggregates of larger particles promoted SOC storage more than that in the aggregates of smaller particles.

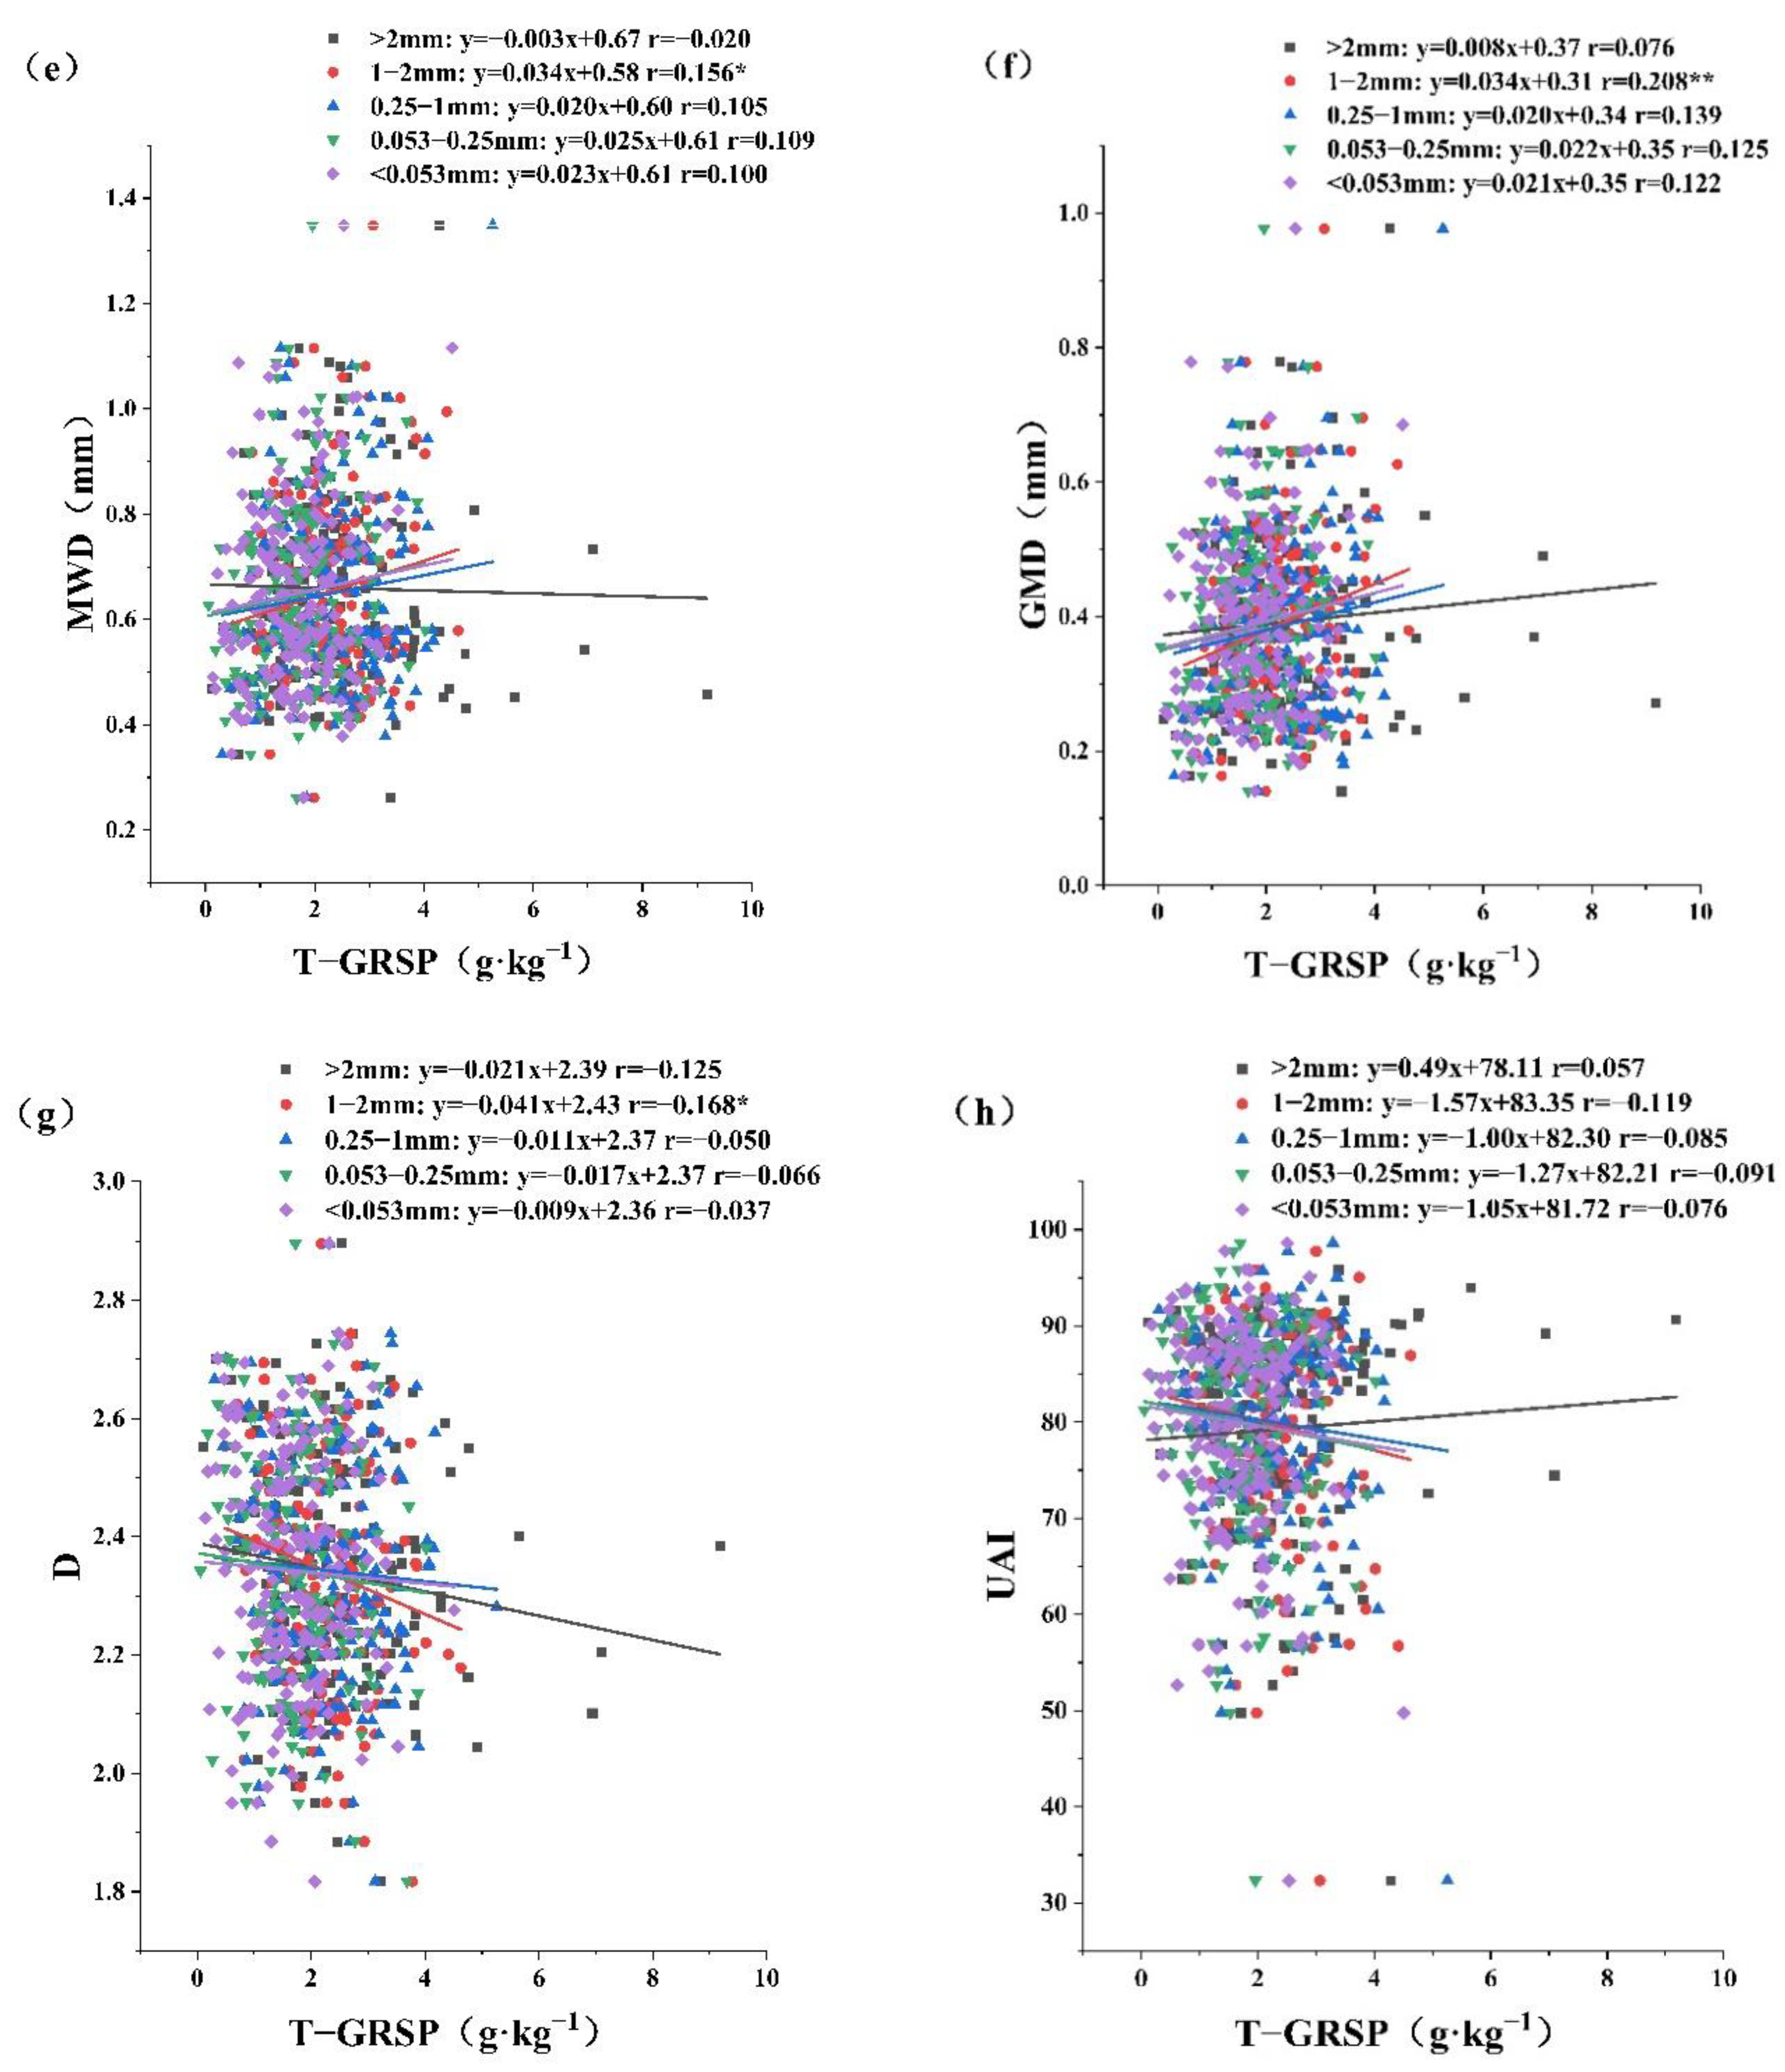
2.4. Relationships between GRSP and Soil Aggregate Stability

The correlations between GRSP and the different soil aggregate stability indicators are shown in Figure 3. The four aggregates of particles <2 mm showed significant positive correlations between EE-GRSP and MWD and GMD (p < 0.05); the correlation coefficient was the largest for the <0.053 mm particle size (Figure 3a,b). The most significant correlation between EE-GRSP and the D value was found for the 1–2 mm aggregate (p < 0.05) (Figure 3c). The EE-GRSP in the 1–2 mm, 0.053–0.25 mm and <0.053 mm particle size aggregates showed significant negative correlations with UAI (p < 0.05) (Figure 3d). Figure 3e–g showed that T-GRSP in the 1–2 mm aggregate was significantly correlated with MWD, GMD, and D (p < 0.05).

2.5. Relationships between GRSP and Soil Properties

The correlations between GRSP and soil properties are shown in Table 3. We found that soil pH was negatively correlated with EE-GRSP in the >2 mm, 1–2 mm, 0.053–0.25 mm and <0.053 mm aggregates (p < 0.05). There was a significant negative correlation between bulk density and GRSP (T-GRSP and EE-GRSP) for the < 2 mm aggregates (p < 0.05). Soil moisture was positively correlated with GRSP (T-GRSP and EE-GRSP) for the 0.053–0.25 mm aggregate (p < 0.05).

3. Discussion

3.1. Increasing Urbanization Intensity Significantly Reduced the GRSP Content in the Different Soil Aggregates

The variation in GRSP content in the different aggregates showed clear spatial heterogeneity related to the intensity of urbanization. Both the EE-GRSP and T-GRSP contents showed the highest values in areas with a low urbanization intensity. Meanwhile, except for the >2 mm aggregates, the EE-GRSP content of the other four soil aggregate size classes were significantly higher (22–46%) in low urbanization intensity sites than in high urbanization intensity sites, indicating that severe anthropogenic disturbance areas were not conducive to GRSP secretion and accumulation. The results of this study are consistent with the findings of Jin et al. [32], in which increasing urbanization intensity was found to be associated with significantly reduced GRSP content. When compared to the low urbanization intensity areas, the GRSP content was significantly less by ~40% in the 1–2 mm aggregate from a high urbanization intensity area, indicating that the 1–2 mm aggregate mainly contributed to the reduced values of GRSP. The results of this study indicated that the 1–2 mm aggregate was more sensitive to the storage of GRSP, and it was also more susceptible to anthropogenic interference. Xiao et al. [33] also found that the T-GRSP content in 1–2 mm grain size aggregates in less anthropogenically disturbed soils was significantly higher than that in more anthropogenically disturbed soils. The values for 1–2 mm aggregates are most sensitive to changes in external factors over a short period of time [34]. This phenomenon can be attributed to the fact that artificial disturbance destroys soil structure, leading to the loss of soil organic matter, whereas no disturbance promotes the maintenance of soil organic matter [26]. When comparing the contribution of EE-GRSP to the T-GRSP content in different soil aggregates, the EE-GRSP/T-GRSP ratio showed an increasing trend with increased levels of urbanization, indicating that the ratio was higher in the large anthropogenically disturbed soils. Human disturbance factors can reduce the richness and activity of AMF, decrease the production of GRSP, and accelerate the decomposition of GRSP [35]. The EE-GRSP is a fresh GRSP produced by the symbiotic fungi and is not yet tightly bound to the soil particles [36], while the T-GRSP is derived by conversion of EE-GRSP [37]. These results indicate that although both T-GRSP and EE-GRSP contents decrease in poor or degraded soil, the decrease of T-GRSP is more rapid than EE-GRSP, resulting in an increase in the ratio.
First, changes in soil properties are an important factor affecting changes in GRSP values [38]. Soil pH was negatively correlated with EE-GRSP values in most aggregates, suggesting pH was one of the key factors for affecting EE-GRSP secretion. Neutral to slightly acidic soils have been suggested to be more suitable for plant root development and soil microbial colonization, allowing for more efficient accumulation of GRSP [39,40]. Moreover, a significant negative correlation between soil bulk density and the GRSP content has been reported [39]. The higher soil bulk density and pH in the high urbanization intensity area in this study (Table 3) led to the low GRSP content. Second, from a carbon stock perspective, the soil nutrient cycle in urban green spaces is altered by human living factors [41]. Similar to the results of this study, the carbon content of soils in suburban areas was found to be significantly higher than that in urban areas [42], indicating that anthropogenic disturbance factors should not be neglected in regards to the variation in GRSP content. Therefore, the effect of urbanization on the GRSP content of different aggregates must be integrated with intricate environmental factors in cities.

3.2. Carbon Sequestration Potential of GRSP in Different Soil Aggregates during Urbanization

Soil aggregate formation is an important process for SOC stabilization, and GRSP, an important component of SOC, has been found to play a key role in soil aggregate formation and stability enhancement [24,43,44]. In the process of urbanization, soil structure is becoming poor due to the anthropogenic disturbances of construction, trampling, rolling, and pollution (industry and life) [31]. Interestingly, the SOC and GRSP contents almost always showed significant differences among areas of different urbanization intensities, that is, a low urbanization intensity area was significantly higher than the high urbanization intensity area, indicating that anthropogenic disturbances caused significant perturbations to the GRSP pools and soil carbon pools. Because of the intense human activities in urban areas, the material exchange between humans and soil is more frequent. Rapid urbanization increases the area of enclosed soil, such as buildings, roads, and city squares, which changes the supply and demand cycle of soil organic matter, and thus causes a change in the carbon cycle of urban ecosystems [45]. Soil with less human disturbance has more abundant carbon sources, resulting in a much higher SOC content. The AMF needs to rely on the photosynthetic products of host plants to provide carbon sources for their growth and development [46]. Organic matter provided by the host plants enters the soil in the form of GRSP, thus, GRSP plays an important role in SOC fixation and cycling [47]. However, the contributions of EE-GRSP and T-GRSP to SOC pools did not differ significantly among areas of different urbanization intensities, and significant differences were found in different sized soil aggregates. Therefore, the contribution of GRSP to the SOC pool may not be affected by urbanization in Nanchang.
For the different sized soil aggregates, the contribution of GRSP to SOC for the >0.25 mm aggregate was significantly lower than that of the <0.25 mm aggregate, indicating that the SOC of smaller aggregates was more stored in the soil as GRSP. This phenomenon may be attributed to the high clay content and large surface area of the micro-aggregates (<0.25 mm aggregate) [48]; the GRSP has strong adhesion and decomposition resistance, which can be combined into stable organic–inorganic compounds [49]. The SOC decomposition rate is slower because the larger aggregates (>0.25 mm) can provide better physical protection for the SOC [48]. In contrast, SOC decomposed more rapidly in smaller aggregates; therefore, more carbon existed in the soil in the form of GRSP, resulting in a higher GRSP/SOC value.
The results showed that GRSP content was significantly positively correlated with SOC in all the soil aggregates, which again verified that GRSP is an important component of the SOC pool. Studies have shown that GRSP can contribute about 27% of SOC; as soil humus only contributes about 8% of carbon, the carbon contribution capacity of GRSP is 2–24 times that of soil humus [29]. Although there are many differences between EE-GRSP and T-GRSP, both when correlated with SOC showed an increasing trend and then decreased with decreasing particle size. Jing et al. [50] found the strongest correlation between SOC and T-GRSP for the >0.25 mm aggregate. Wilson et al. [51] showed that only aggregates with a >0.25 mm particle size showed a significant reduction in SOC after fungicide application to the soil, whereas aggregates with a <0.25 mm particle size were not significantly affected, indicating that SOC in a larger particle size had a more significant correlation with GRSP. Based on the forementioned results, this study reveals the correlation between SOC and GRSP in the three larger particle aggregates of >2 mm, 1–2 mm, and 0.25–1 mm. The strongest correlation between SOC and GRSP in the larger particle aggregates was found for the 1–2 mm particle size, indicating that GRSP is most favorable for SOC fixation in the 1–2 mm aggregate. Studies have shown that soil microorganisms, especially fungi, play an important role in the formation and stability of large aggregates [52]. The AMF, as important microorganisms in most ecosystems, are beneficial to promote the SOC sequestration [22]. These findings provide a theoretical basis for further exploration.

3.3. Effect of GRSP on Soil Aggregate Stability during the Process of Urbanization

Interestingly, we found that the correlation coefficient between the EE-GRSP content and the aggregate stability index was much higher than that between T-GRSP and the aggregate stability index. It is now widely accepted that both the T-GRSP and EE-GRSP play important roles in the adhesion and stability of aggregates. Because the EE-GRSP has an efficient bonding efficiency and the T-GRSP has more stable properties [28], it was thought that the role of EE-GRSP might be more focused on the formation of soil aggregates, whereas that of T-GRSP is more focused on the structural stabilization of soil aggregates. However, our study found that the effect of the EE-GRSP on aggregate stability may be much greater than that of T-GRSP. The reason for this result is that the EE-GRSP is the most recently produced material and is more active, whereas the T-GRSP is relatively older and not easily produced [53].
In addition, a significant correlation between T-GRSP values and the aggregates was found only for the 1–2 mm grain size. A similar result was found by Wu et al. [54] under different inoculation conditions. This not only indicates that T-GRSP is not the main binder of aggregates [55], but also further suggests that the 1–2 mm grain size aggregates may be most closely correlated with GRSP in soils and are the best grain size for GRSP to contribute to the enhanced stability of aggregates.

4. Materials and Methods

4.1. Study Site Description

The study area was located in Nanchang City, in the northern part of Jiangxi Province, East China (28°09′–29°11′ N, 115°27′–116°35′ E), with an average elevation of ~30 m. It has a typical subtropical monsoon climate with four distinct seasons, abundant rainfall, and a total area of 7159 km2. Among the different land use patterns, vegetation coverage accounts for 4703.69 km2, or 63.37% of the total area of Nanchang. Impervious surface is the second largest land use type with 1553.68 km2, accounting for 20.93% of the total area, while water and naked land use types account for 13.08% and 2.63%, respectively [31].

4.2. Urbanization Intensity Description

The built-up area of Nanchang (505 km2) was used as the study area (Figure 4). The study area was divided into several 100 m × 100 m grids, and the proportion of impervious area was calculated for each grid. According to the proportion of impervious area, the grids were divided into three levels: low urbanization intensity (<50%), medium urbanization intensity (50% ≤ impervious area proportion < 80%), and high urbanization intensity (≥80%). Finally, 184 sampling plots (400 m2) from urban roadside forests, affiliated forests, landscape forests, and ecological and public welfare forests were set up in different urbanization areas. To reduce errors caused by plant species, forest plots were placed where the city’s official tree, camphor, was the dominant species, with a minimum spacing of 1 km between samples.

4.3. Soil Sampling

Soil sampling was conducted during the summer of 2020. Each sample plot was set up with five sampling points, and 0–20 cm column of soil was collected using a cutting ring (100 cm3). Soil from each sample plot was mixed and weighed immediately, and then taken back to the laboratory to air dry to a constant weight and this value recorded. The soil samples were divided into two parts after removal of impurities (plant roots, stones, plastics, plant litter, etc.): one for determination of soil physical and chemical properties [42,56] (Table 4), and the other for separation of soil aggregate fractions. The soil bulk density was calculated as the ratio of soil dry weight (105 °C) to soil volume. Soil (<2 mm) pH was determined using a soil-water ratio of 1:2.5, potentiometric method. Soil moisture content was determined using a drying method at 105 °C. The soil texture (<2 mm) was determined using a laser diffraction particle size analyzer (MS3000, Malvern, UK).

4.4. Soil Water Stable Aggregates Determination and Stability Index Calculation

Soil aggregates were separated by the wet sieve method [57]. Briefly, 100 g of air-dried soil samples were weighed to separate into five different particle size aggregates: >2 mm, 1–2 mm, 0.25–1 mm, 0.053–0.25 mm, and <0.053 mm. The soil aggregate stability was described using four indices: mean weight diameter (MWD), geometric mean diameter (GMD), unstable aggregate index (UAI), and fractal dimension (D). These indices were calculated using the following equations [58,59].
MWD = n i = 1 x i ω i
GMD = e x p ( n i = 1 ω i ln x i )
where x i is the mean diameter of ith sieve and ω i is the proportion of the total weight in the ith fraction.
UAI = W 0 W r > 0.25 W 0 × 100 %
where W 0 is the sum of the masses of each particle class of the soil; W r > 0.25 is the sum of the masses of particle size aggregates >0.25 mm after wet sieving.
Fractal dimension (D) was adopted from the soil particle fractal model proposed by Yang et al. [60].
D = 3 lg ( W i / W 0 ) lg ( d i / d m a x )
where d m a x is the mean diameter of the largest particle size, W (δ< d i ) is the accumulated mass of soil particles with a diameter less than d i ; W 0 is the sum of the mass of each particle size of the soil.

4.5. Soil Organic Carbon and Glomalin-Related Soil Protein Determination

The collected aggregates of each particle size were finely ground and passed through a 0.149 mm sieve. The SOC was determined using the potassium dichromate heating method [56]. The EE-GRSP and T-GRSP were extracted in accordance with the method described by Wright et al. [23,61]. Specifically, EE-GRSP was extracted using sodium citrate solution (20 mmol·L−1, pH = 7.0). Soil samples of 0.500 g and 4 mL of sodium citrate solution were mixed and put into an autoclave and sterilized at 121 ℃ for 30 min, followed by centrifugation at 4000 r·min−1 for 6 min in a high-speed centrifuge, and then the supernatant was collected. The T-GRSP was extracted using a sodium citrate solution of 50 mmol·L−1 (pH = 8.0) and an autoclaving time of 1 h. The above procedure was repeated until the supernatant no longer showed a typical red–brown color. Finally, the supernatant was colored using the Coomassie brilliant blue method, and the standard curve was plotted using bovine serum protein as the standard solution to calculate the EE-GRSP and T-GRSP contents.

4.6. Statistical Analysis

After testing the data for normal distribution, an ANOVA was performed using the Duncan’s multiple comparison method (SPSS 22) to explore the differences in the distribution and stability of aggregates of each particle size and the changes in SOC and GRSP content at sites of different urbanization intensities. Pearson’s correlation analysis was used to reveal the correlations among aggregate stability, SOC content, and GRSP content.

5. Conclusions

The GRSP participates in the formation of soil aggregates, and it also plays an important role in soil carbon pooling and cycling. An increasing urbanization intensity can significantly reduce the GRSP content of different soil aggregates. Although the carbon sequestration potential of GRSP in soil aggregates is apparently unrelated to urbanization, it is actually due to the degradation of soil quality caused by anthropogenic disturbance factors. This makes it more difficult to visualize the relationship of carbon sequestration potential of GRSP in soil aggregates with urbanization and this topic needs to be further explored. The EE-GRSP played a more critical role than the T-GRSP in enhancing soil aggregate stability. The GRSP is a component of the SOC pool and has a significant positive correlation, especially in the 1–2 mm grain size range. The T-GRSP also shows a significant contribution to the enhancement of aggregate stability in the 1–2 mm grain size range. Therefore, soil aggregates with a 1–2 mm particle size may be the best for GRSP-contributed aggregate stability enhancement in urban soils. This provides a new research direction for future in-depth investigations. This study fully reveals and explores the potential of GRSP to enhance soil aggregate formation and carbon storage in the context of rapid urbanization.

Author Contributions

Conceptualization, Q.W. and W.L.; methodology, Q.W., C.C. and W.L.; software, F.H.; validation, Q.W. and W.L.; formal analysis, C.C. and S.Y.; investigation, C.C., Y.Y., S.W. and Y.F.; data curation, C.C.; writing—original draft preparation, C.C., F.H. and Q.W.; writing—review and editing, Q.W. and W.L.; visualization, C.C.; funding acquisition, Q.W. and W.L. All authors have read and agreed to the published version of the manuscript.

Funding

This study was supported by National Natural Science Foundation of China (42007042, 31960302).

Data Availability Statement

Data available on request due to restrictions eg privacy or ethical.

Conflicts of Interest

The authors declare no conflict of interest.

References

  1. Schneider, A.; Friedl, M.A.; Potere, D. Mapping global urban areas using MODIS 500-m data: New methods and datasets based on ‘urban ecoregions. Remote Sens. Environ. 2010, 114, 1733–1746. [Google Scholar] [CrossRef]
  2. Pouyat, R.; Groffman, P.; Yesilonis, I.; Hernandez, L. Soil carbon pools and fluxes in urban ecosystems. Env. Pollut. 2002, 116 (Suppl. 1), S107–S118. [Google Scholar] [CrossRef]
  3. Brockerhoff, M.P. An Urbanizing World. Popul. Bull. 2000, 55, 3–44. [Google Scholar]
  4. Seto, K.C.; Guneralp, B.; Hutyra, L.R. Global forecasts of urban expansion to 2030 and direct impacts on biodiversity and carbon pools. Proc. Natl. Acad. Sci. USA 2012, 109, 16083–16088. [Google Scholar] [CrossRef] [PubMed]
  5. Seto, K.C.; Shepherd, J.M. Global urban land-use trends and climate impacts. Curr. Opin. Environ. Sustain. 2009, 1, 89–95. [Google Scholar] [CrossRef]
  6. Liu, J.; Kuang, W.; Zhang, Z.; Xu, X.; Qin, Y.; Ning, J.; Zhou, W.; Zhang, S.; Li, R.; Yan, C.; et al. Spatiotemporal characteristics, patterns, and causes of land-use changes in China since the late 1980s. J. Geogr. Sci. 2014, 24, 195–210. [Google Scholar] [CrossRef]
  7. Fu, Y.; Yang, X.; Wang, J. Stoichiometric characteristics of soil C, N and P of green space along an urban-suburb-rural gradient in Nanchong. Chin. J. Ecol. 2020, 39, 4038–4047. [Google Scholar]
  8. Grimm, N.B.; Faeth, S.H.; Redman, C.L.; Wu, J.; Bai, X.; Briggs, J.; Golubiewski, N.E. Global Change and the Ecology of Cities. Sci. (Am. Assoc. Adv. Sci.) 2008, 319, 756–760. [Google Scholar] [CrossRef]
  9. Waring, B.G.; Sulman, B.N.; Reed, S.; Smith, A.P.; Averill, C.; Creamer, C.A.; Cusack, D.F.; Hall, S.J.; Jastrow, J.D.; Jilling, A.; et al. From pools to flow: The PROMISE framework for new insights on soil carbon cycling in a changing world. Glob. Chang. Biol. 2020, 26, 6631–6643. [Google Scholar] [CrossRef]
  10. Ferreira, C.S.S.; Walsh, R.P.D.; Ferreira, A.J.D. Degradation in urban areas. Curr. Opin. Environ. Sci. Health 2018, 5, 19–25. [Google Scholar] [CrossRef]
  11. Raciti, S.M.; Hutyra, L.R.; Finzi, A.C. Depleted soil carbon and nitrogen pools beneath impervious surfaces. Environ. Pollut. 2012, 164, 248–251. [Google Scholar] [CrossRef] [PubMed]
  12. Lal, R. Soil carbon sequestration in China through agricultural intensification, and restoration of degraded and desertified ecosystems. Land Degrad. Dev. 2002, 13, 469–478. [Google Scholar] [CrossRef]
  13. Das, B.; Chakraborty, D.; Singh, V.K.; Aggarwal, P.; Singh, R.; Dwivedi, B.S.; Mishra, R.P. Effect of integrated nutrient management practice on soil aggregate properties, its stability and aggregate-associated carbon content in an intensive rice–wheat system. Soil Tillage Res. 2014, 136, 9–18. [Google Scholar] [CrossRef]
  14. Vogel, H.J.; Balseiro Romero, M.; Kravchenko, A.; Otten, W. A holistic perspective on soil architecture is needed as a key to soil functions. Eur. J. Soil Sci. 2022, 73, e13152. [Google Scholar] [CrossRef]
  15. Okolo, C.C.; Gebresamuel, G.; Zenebe, A.; Haile, M.; Eze, P.N. Accumulation of organic carbon in various soil aggregate sizes under different land use systems in a semi-arid environment. Agric. Ecosyst. Environ. 2020, 297, 106924. [Google Scholar] [CrossRef]
  16. Bucka, F.B.; Kölbl, A.; Uteau, D.; Peth, S. Organic matter input determines structure development and aggregate formation in artificial soils. Geoderma 2019, 354, 113881. [Google Scholar] [CrossRef]
  17. Zhang, S.; Li, Q.; Zhang, X.; Wei, K. Effects of conservation tillage on soil aggregation and aggregate binding agents in black soil of Northeast China. Soil Tillage Res. 2012, 124, 196–202. [Google Scholar] [CrossRef]
  18. Yoo, G.; Yang, X.; Wander, M.M. Influence of soil aggregation on SOC sequestration: A preliminary model of SOC protection by aggregate dynamics. Ecol. Eng. 2011, 37, 487–495. [Google Scholar] [CrossRef]
  19. Tisdal, J.M.; Tisdall, J.M. Formation of soil aggregates and accumulation of soil organic matter. In Structure and Organic Matter Storage in Agricultural Soils; CRC Press: Boca Raton, FL, USA, 2020. [Google Scholar]
  20. Wang, B.; Qiu, Y.L. Phylogenetic distribution and evolution of mycorrhizas in land plants. Mycorrhiza 2006, 16, 299–363. [Google Scholar] [CrossRef]
  21. Jeffries, P.; Gianinazzi, S.; Perotto, S.; Turnau, K. The contribution of arbuscular mycorrhizal fungi in sustainable maintenance of plant health and soil fertility. Biol. Fertil. Soils 2003, 37, 1–16. [Google Scholar] [CrossRef]
  22. Smith, S.E.; Read, D.J. Mycorrhizal Symbiosis. Q. Rev. Biol. 2008, 3, 273–281. [Google Scholar]
  23. Wright, S.F.; Upadhyaya, A. Extraction of an abundant and unusual protein from soil and comparison with hyphal protein of arbuscular mycorrhizal fungi. Soil Sci. 1996, 161, 575–586. [Google Scholar] [CrossRef]
  24. Wright, S.F.; Upadhyaya, A. A survey of soils for aggregate stability and glomalin, a glycoprotein produced by hyphae of arbuscular mycorrhizal fungi. Plant Soil 1998, 198, 97–107. [Google Scholar] [CrossRef]
  25. Šarapatka, B.; Alvarado-Solano, D.P.; Čižmár, D. Can glomalin content be used as an indicator for erosion damage to soil and related changes in organic matter characteristics and nutrients? CATENA 2019, 181, 104078. [Google Scholar] [CrossRef]
  26. Sekaran, U.; Sagar, K.L.; Kumar, S. Soil aggregates, aggregate-associated carbon and nitrogen, and water retention as influenced by short and long-term no-till systems. Soil Tillage Res. 2021, 208, 104885. [Google Scholar] [CrossRef]
  27. Bothe, H.; Turnau, K.; Regvar, M. The potential role of arbuscular mycorrhizal fungi in protecting endangered plants and habitats. Mycorrhiza 2010, 20, 445–457. [Google Scholar] [CrossRef]
  28. Matthias, C.; Rillig, M.C. Arbuscular mycorrhizae, glomalin, and soil aggregation. Can. J. Soil Sci. 2004, 84, 355–363. [Google Scholar]
  29. Rillig, M.C.; Wright, S.F.; Nichols, K.A.; Schmidt, W.F.; Torn, M.S. Large contribution of arbuscular mycorrhizal fungi to soil carbon pools in tropical forest soils. Plant Soil 2001, 233, 167–177. [Google Scholar] [CrossRef]
  30. Zhao, Q.G. The problems about the red soil degradation in china. Soils 1995, 6, 281–285. [Google Scholar]
  31. Chen, F.; Yavitt, J.; Hu, X. Phosphorus enrichment helps increase soil carbon mineralization in vegetation along an urban-to-rural gradient, Nanchang, China. Appl. Soil Ecol. 2014, 75, 181–188. [Google Scholar] [CrossRef]
  32. Jin, T.; Liu, W.; Wang, Y.; Zhao, M.; Fu, Y.; Dong, Y.; Luo, T.; Fu, H.; Wang, Q. Effects of urbanization intensity on glomalin-related soil protein in Nanchang, China: Influencing factors and implications for greenspace soil improvement. J. Environ. Manag. 2022, 318, 115611. [Google Scholar] [CrossRef] [PubMed]
  33. Xiao, L.; Yao, K.; Li, P.; Liu, Y. Increased soil aggregate stability is strongly correlated with root and soil properties along a gradient of secondary succession on the Loess Plateau. Ecol. Eng. 2020, 143, 105671. [Google Scholar] [CrossRef]
  34. Kemper, W.D.; Rosenau, R.C. Aggregate stability and size distribution. In Methods of Soil Analysis; Wiley: Hoboken, NJ, USA, 1986. [Google Scholar]
  35. Que, H.; Ge, Y.; Kang, F.; Ling, W. Content and distribution of glomalin-related soil protein in soils of Nanjing under different land use types. Soils 2015, 47, 719–724. [Google Scholar]
  36. Lovelock, C.E.; Wright, S.F.; Clark, D.A.; Ruess, R.W. Soil stocks of glomalin produced by arbuscular mycorrhizal fungi across a tropical rain forest landscape. J. Ecol. 2004, 92, 278–287. [Google Scholar] [CrossRef]
  37. Koide, R.T.; Peoples, M.S. Behavior of Bradford-reactive substances is consistent with predictions for glomalin. Appl. Soil Ecol. 2013, 63, 8–14. [Google Scholar] [CrossRef]
  38. Wang, Q.; Wang, W.; Zhong, Z.; Wang, H. Variation in glomalin in soil profiles and its association with climatic conditions, shelterbelt characteristics, and soil properties in poplar shelterbelts of Northeast China. J. For. Res. 2020, 31, 279–290. [Google Scholar] [CrossRef]
  39. Wang, Q.; Wang, W.; He, X.; Zhang, W.; Song, K.; Han, S. Role and variation of the amount and composition of glomalin in soil properties in farmland and adjacent plantations with reference to a primary forest in North-Eastern China. PLoS ONE 2015, 10, e139623. [Google Scholar] [CrossRef]
  40. Zhong, Z.; Wang, W.; Wang, Q.; Wu, Y.; Wang, H.; Pei, Z. Glomalin amount and compositional variation, and their associations with soil properties in farmland, northeastern China. J. Plant Nutr. Soil Sci. 2017, 180, 563–575. [Google Scholar] [CrossRef]
  41. Yu, M.Q.; Yuan, P.C.; Chen, F.S.; Hu, X.F.; Du, T.Z. Effects of urbanization on soil nitrogen supply in Pinus elliottii in plantations. Chin. J. Appl. Ecol. 2009, 20, 531–536. [Google Scholar]
  42. He, J.J.; Chen, X.M.; Feng, S.H.; Yao, T.Y.; Liang, Q.W.; Fu, J.M. Stoichiometric characteristics of soil C, N and P in subtropical forests along an urban-to-suburb gradient. Chin. J. Ecol. 2016, 35, 591–596. [Google Scholar]
  43. Rillig, M.C.; Wright, S.F.; Eviner, V.T. The role of arbuscular mycorrhizal fungi and glomalin in soil aggregation: Comparing effects of five plant species. Plant Soil 2002, 238, 325–333. [Google Scholar] [CrossRef]
  44. Fokom, R.; Adamou, S.; Teugwa, M.C.; Begoude, D. Glomalin related soil protein, carbon, nitrogen and soil aggregate stability as affected by land use variation in the humid forest zone of south Cameroon. Soil Tillage Res. 2012, 120, 69–75. [Google Scholar] [CrossRef]
  45. Wong, C.; Li, X.; Thornton, I. Urban environmental geochemistry of trace metals. Environ. Pollut. 2006, 142, 1–16. [Google Scholar] [CrossRef] [PubMed]
  46. Averill, C.; Turner, B.L.; Finzi, A.C. Mycorrhiza-mediated competition between plants and decomposers drives soil carbon storage. Nature 2014, 505, 543–545. [Google Scholar] [CrossRef]
  47. Singh, A.K.; Rai, A.; Pandey, V.; Singh, N. Contribution of glomalin to dissolve organic carbon under different land uses and seasonality in dry tropics. J. Environ. Manag. 2017, 192, 142–149. [Google Scholar] [CrossRef]
  48. Pan, G.X.; Zhou, P.; Li, L.Q. Core issues and research progress of soil science of C sequestration. Acta Pedol. Sin. 2007, 2, 327–337. [Google Scholar]
  49. Ma, J.H.; Ye, X.H.; Han, C.D. Effects of different irrigation control limits of drip irrigation under mulch on soil aggregate nutrients, enzyme activities and coccomycin content in greenhouse. Chin. J. Appl. Ecol. 2018, 29, 2713–2720. [Google Scholar]
  50. Jing, H.; Shi, J.Y.; Wang, G.L. Distribution of the glomalin-related soil protein and aggregate fractions in different restoration communities after clear-cutting Pinus tabulaeformis plantation. China Environ. Sci. 2017, 37, 3056–3063. [Google Scholar]
  51. Wilson, G.W.T.; Rice, C.W.; Rillig, M.C.; Springer, A.; Hartnett, D.C. Soil aggregation and carbon sequestration are tightly correlated with the abundance of arbuscular mycorrhizal fungi: Results from long-term field experiments. Ecol. Lett. 2009, 12, 452–461. [Google Scholar] [CrossRef]
  52. Guggenberger, G.; Elliott, E.T.; Frey, S.D.; Six, J.; Paustian, K. Microbial contributions to the aggregation of a cultivated grassland soil amended with starch. Soil Biol. Biochem. 1999, 31, 407–419. [Google Scholar] [CrossRef]
  53. Liang, T.; Shi, X.; Guo, T.; Peng, S. Arbuscular mycorrhizal fungus mediate changes in mycorrhizosphere soil aggregates. Agric. Sci. 2015, 6, 1455–1463. [Google Scholar] [CrossRef]
  54. Wu, Q.S.; Cao, M.Q.; Zou, Y.N.; He, X.H. Direct and indirect effects of glomalin, mycorrhizal hyphae, and roots on aggregate stability in rhizosphere of trifoliate orange. Sci. Rep. 2014, 4, 5823. [Google Scholar] [CrossRef] [PubMed]
  55. Rillig, M.C.; Maestre, F.T.; Lamit, L.J. Microsite differences in fungal hyphal length, glomalin, and soil aggregate stability in semiarid Mediterranean steppes. Soil Biol. Biochem. 2003, 35, 1257–1260. [Google Scholar] [CrossRef]
  56. Bao, S.D. Agrochemical Analysis of Soil; China Agricultural Press: Beijing, China, 2000. [Google Scholar]
  57. Wang, X.Y.; Gao, X.F.; Liu, H.P. Review of analytical methods for aggregate size distribution and water-stability of soil macro-aggregates. Sci. Soil Water Conserv. 2011, 9, 106–113. [Google Scholar]
  58. Jiang, M.; Liu, Y.; Liu, C. Study on the stability and fractal characteristics of soil aggregates under different land use patterns in the Danjiangkou reservoir. J. Soil Water Conserv. 2016, 6, 265–270. [Google Scholar]
  59. Huang, S.J.; Chen, J.P.; Chen, T. Effects of different coverage modes on aggregates and carbon and nitrogen of soil in Cherry Orchard. Res. Soil Water Conserv. 2022, 29, 44–50. [Google Scholar]
  60. Yang, P.L.; Luo, Y.; Shi, Y.C. Fractal characteristics of soil characterized by weight distribution of particle size. Chin. Sci. Bull. 1993, 38, 1896–1899. [Google Scholar]
  61. Wright, S.F.; Upadhyaya, A.; Buyer, J.S. Comparison of N-linked oligosaccharides of glomalin from arbuscular mycorrhizal fungi and soils by capillary electrophoresis. Soil Biol. Biochem. 1998, 30, 1853–1857. [Google Scholar] [CrossRef]
Figure 1. Characteristics of the GRSP and SOC contents of soil water stable aggregates with different urbanization intensities. Note: Different capital letters indicate significant differences among different aggregates at the same urbanization intensity (p < 0.05). Different lowercase letters indicate differences among different urbanization intensities in the same aggregate (p < 0.05). Soil organic carbon (SOC), easily extractable glomalin-related soil protein (EE-GRSP), total glomalin-related soil protein (T-GRSP). Effect of urbanization intensity on SOC (a), EE-GRSP (b), T-GRSP (c), EE-GRSP/SOC (d), T-GRSP/SOC (e), and EE-GRSP/T-GRSP (f) in different soil aggregates.
Plants 12 01847 g001aPlants 12 01847 g001b
Figure 2. Correlations between SOC and GRSP in different aggregates. Note: *: p < 0.05, **: p < 0.01. Soil organic carbon (SOC), easily extractable glomalin-related soil protein (EE-GRSP), total glomalin-related soil protein (T-GRSP). Relationships between EE-GRSP and SOC (a), and between T-GRSP and SOC (b).
Plants 12 01847 g002
Figure 3. Correlations between GRSP and aggregate stability for different aggregates. Note: *: p < 0.05, **: p < 0.01. Easily extractable glomalin-related soil protein (EE-GRSP), total glomalin-related soil protein (T-GRSP), mean weight diameter (MWD), geometric mean diameter (GMD), fractal dimension (D), unstable aggregate index (UAI). Relationships between EE-GRSP and MWD (a), GMD (b), D (c), UAI (d), and relationships between T-GRSP and MWD (e), GMD (f), D (g), UAI (h).
Plants 12 01847 g003aPlants 12 01847 g003b
Figure 4. Overview of the Study Area.
Plants 12 01847 g004
Table 1. Percentage of soil water stable aggregates at different urbanization intensities.
Urbanization
Intensity
>2 mm1–2 mm0.25–1 mm0.053–0.25 mm<0.053 mm
Low10.11 ± 0.97 Ca10.99 ± 0.51 Ca43.03 ± 1.06 Aa16.86 ± 0.65 Bb19.01 ± 1.06 Ba
Medium8.93 ± 0.73 Ca9.88 ± 0.51 Ca41.79 ± 1.31 Aa19.46 ± 0.83 Ba19.94 ± 1.22 Ba
High8.86 ± 1.14 Ca11.02 ± 0.78 Ca40.85 ± 1.38 Aa20.40 ± 1.15 Ba18.87 ± 1.66 Ba
Note: Data (mean ± SE). Different capital letters indicate significant differences within the row (p < 0.05), while different lowercase letters indicate significant differences within the column (p < 0.05).
Table 2. Stability differences of the soil water stable aggregates at different urbanization intensities.
Urbanization IntensityMWDGMDDUAI
Low0.67 ± 0.02 a0.40 ± 0.02 a2.33 ± 0.02 a78.90 ± 1.31 a
Medium0.63 ± 0.02 a0.37 ± 0.01 a2.36 ± 0.02 a81.19 ± 1.06 a
High0.64 ± 0.03 a0.37 ± 0.02 a2.33 ± 0.03 a80.11 ± 1.90 a
Note: Data (mean ± SE). Different lowercase letters indicate significant differences within the column (p < 0.05). Mean weight diameter (MWD), geometric mean diameter (GMD), fractal dimension (D), unstable aggregate index (UAI).
Table 3. Relationships between GRSP and soil properties in different soil aggregates.
Soil AggregatespHBulk DensitySoil Moisture
EE-GRSP>2 mm−0.15 *−0.10−0.10
1–2 mm−0.30 **−0.34 **0.08
0.25–1 mm−0.12−0.28 **0.09
0.053–0.25 mm−0.29 **−0.33 **0.15 *
<0.053 mm−0.25 **−0.35 **0.09
T-GRSP>2 mm0.01−0.14−0.04
1–2 mm−0.05−0.21 **0.06
0.25–1 mm0.02−0.29 **0.16 *
0.053–0.25 mm0.03−0.21 **0.18 *
<0.053 mm−0.04−0.20 **0.06
Note: *: p < 0.05, **: p < 0.01. Easily extractable glomalin-related soil protein (EE-GRSP), total glomalin-related soil protein (T-GRSP).
Table 4. Soil physical and chemical properties in different urbanization intensity.
Urbanization
Intensity
Bulk Density (g/cm3)pHMoisture Content (%)Soil Texture
Low1.31 ± 0.016.76 ± 0.0921.77 ± 0.77Silty loam
Medium1.35 ± 0.017.09 ± 0.0919.17 ± 0.81Sandy loam
High1.39 ± 0.027.29 ± 0.1618.14 ± 0.89Sandy loam
Note: Data (means ± SE).
Disclaimer/Publisher’s Note: The statements, opinions and data contained in all publications are solely those of the individual author(s) and contributor(s) and not of MDPI and/or the editor(s). MDPI and/or the editor(s) disclaim responsibility for any injury to people or property resulting from any ideas, methods, instructions or products referred to in the content.

