Article

Simplified Genomic Data Revealing the Decline of Aleuritopteris grevilleoides Population Accompanied by the Uplift of Dry-Hot Valley in Yunnan, China

1
College of Life Sciences, Anhui Normal University, Wuhu 241000, China
2
Key Laboratory of National Forestry and Grassland Administration for Orchid Conservation and Utilization, The Orchid Conservation and Research Center of Shenzhen, Shenzhen 518114, China
3
Anhui Key Laboratory of Biological Resources Conservation and Utilization, Anhui Normal University, Wuhu 241000, China
4
Yunnan Academy of Biodiversity, Southwest Forestry University, Kunming 650224, China
5
Eastern China Conservation Centre for Wild Endangered Plant Resources, Shanghai Chenshan Botanical Garden, Shanghai 201602, China
*
Authors to whom correspondence should be addressed.
Plants 2023, 12(7), 1579; https://doi.org/10.3390/plants12071579
Submission received: 9 February 2023 / Revised: 16 March 2023 / Accepted: 21 March 2023 / Published: 6 April 2023
(This article belongs to the Special Issue Mapping Asia Plants)

Abstract

:
Understanding the evolutionary history of endangered species is crucial for identifying the main reasons for species endangerment in the past and predicting the changing trends and evolutionary directions of their future distribution. In order to study the impact of environmental changes caused by deep valley incision after the uplift of the Qinghai-Tibet Plateau on endangered species, we collected 23 samples belonging to four populations of Aleuritopteris grevilleoides, an endangered fern endemic to the dry-hot valleys (DHV) of Yunnan. Single-nucleotide variation sites (SNPs) were obtained by the genotyping-by-sequencing (GBS) method, and approximately 8085 SNP loci were identified. Through the reconstruction and analysis of genetic diversity, population structure, population dynamics, evolution time, and ancestral geographical distribution, combined with geological historical events such as the formation of dry-hot valleys, this study explores the formation history, current situation, reasons for endangerment and scientifically sound measures for the protection of A. grevilleoides. In our study, A. grevilleoides had low genetic diversity (Obs_Het = 0.16, Exp_Het = 0.32, Pi = 0.33) and a high inbreeding coefficient (Fis = 0.45). The differentiation events were 0.18 Mya, 0.16 Mya, and 0.11 Mya in the A. grevilleoides and may have been related to the formation of terraces within the dry-hot valleys. The history of population dynamics results shows that the diversion of the river resulted in a small amount of gene flow between the two clades, accompanied by a rapid increase in the population at 0.8 Mya. After that, the effective population sizes of A. grevilleoides began to contract continuously due to topographic changes resulting from the continuous expansion of dry-hot valleys. In conclusion, we found that the environmental changes caused by geological events might be the main reason for the changing population size of A. grevilleoides.

1. Introduction

Tectonic collisions and climate change are important factors that affect the evolution of species [1]. Geological events have continuously uplifted mountains because of the collision of the Indian plate and the Eurasian plate, such as the formation of the Qinghai-Tibet Plateau in China, which is described as the “cradle of evolution”. This has created rich topography and changeable climatic conditions, providing an important driving force for species differentiation [2,3]. For example, for Quasipaa boulengeri Guenter, because of the complex orogenesis, its genetic structure differentiated along geographical units [4]. Wu et al. proved that the two increases in the diversification rate of Oreocnide Miq. plants were affected by climate change [5].
The Tibet Plateau is an important natural landscape with a special ecosystem and has the highest species diversity in the northern hemisphere. At least 12,000 species of vascular plants are found on the Chinese part (Yunnan, Xizhang, Sichuan provinces, and so on) of the Tibet Plateau; these species belong to over 1500 genera, and approximately 20% of the species are endemic [6,7]. Due to the uplift of the plateau and the descent of the river valley, the special landform of “dry-hot valley” was born [8,9]. Dry-hot valleys have peculiar climates. Their formation depends on a complex geographical environment and the resulting local microclimates [10]. When the water vapor condenses in the valley, it causes heat release, reduces the water availability, and increases the air temperature, forming a warm and dry environment. This environment became a refuge for ancient plants and their descendants on the ancient southern continent during the Pleistocene period [11,12]. A total of 163 families, 1038 genera, and 3217 species and varieties of native seed plants have been recorded in the dry-hot valleys (DHVs) of southwest China [9], accounting for about a quarter of all vascular plants on the Qinghai-Tibet Plateau.
During the Miocene (23–5.3 Mya), the uplifted terrain and the deep incision of river valleys of Yunnan province changed the distribution of biological and geological zonality. Dry-hot valleys with extreme hydrothermal conditions lead to excessive water loss and make forest vegetation difficult to restore; thus, large areas of land are barren, forming savannah-like vegetation and arid shrubs [8,9,13]. The savanna-like vegetation in Yunnan is morphologically similar to that of the savannas in India and Myanmar, and the geological events in Yunnan may be an important factor affecting the flora and differentiation of the savanna-like vegetation in these dry-hot valleys [9]. This special geological background also created a special biological evolutionary history of local plants.
The study of the evolutionary history of biological groups can help elucidate the reasons for the formation and endangerment of species in special habitats. It can also provide additional sources of evidence to clarify the nature and timing of geological and climatic events in specific regions [14,15,16]. At present, approximately 748 species of wild plants inhabit the dry-hot valleys of the Jinsha River Basin in Yunnan; these species belong to 111 families and 427 genera [11]. Among them, 78 endemic plant species are dominant in various types of vegetation, including Terminalia franchetii Gagnep., Ziziphus yunnanensis C.K. Schneid., Vitex negundo L., and Andropogon yunnanensis Hack. [11]. Zhang and Sun analyzed the genetic structure of T. franchetii populations in the Jinsha River Basin and concluded that historical drainage capture events led to the modern distribution and related genetic structure patterns [17]. Other researchers have used genetic methods to explore the relationships between species and geographic locations in dry-hot valleys [17,18]. Many studies have investigated the conservation of species’ genetic diversity through simplified genome and population genetics; however, research on the genetic differentiation and conservation of species living in special habitats, such as hot and dry river valleys, is relatively limited.
Aleuritopteris grevilleoides (Christ) G. M. Zhang ex X. C. Zhang is a threatened species [19,20] endemic to dry-hot river valleys, and several populations spread to other arid rocky areas in Yunnan. Before it was categorized as a member of Aleuritopteris Fee, it was considered an endemic genus in China and known as Sinopteris Christensen and Chink [21]. Therefore, this species was included on the national key protected wild plants list in 1999 but removed from the list in 2021 because of changes in its taxonomic position [22,23]. Wang et al. studied the reproduction of A. grevilleoides and found that the growing development of gametophytes and young sporophytes are quite different in various soil substrates. Among them, it grows best in the substrate of 1:1 mixed soil of original soil and humus soil [24,25]. Field investigation and prediction analysis of potential distribution suggested that human disturbances, such as hydropower station construction and road expansion, were one of the main reasons for the destruction of A. grevilleoides wild populations [26]. Some researchers have proposed that the endangerment of dry-hot valley vegetation is due to the long-term interference of human activities, which have led to land degradation and extensive soil erosion [10,27]. However, others hold a different view, arguing that dry-hot valley vegetation is mainly affected by the uplift of the Qinghai-Tibet Plateau, river diversion, and other geological events caused by climate and environmental changes [9,17].
Recently, with the rapid development of high-throughput sequencing, conservation genomics studies have successfully explained the internal causes of species endangerment and helped to develop protection strategies. In this study, we analyzed genetic diversity and structure, reconstructed demographic history and ancestral states, and estimated the population divergence time of A. grevilleoides in a dry-hot valley. A variety of analytical methods were used here to provide robust data and combined with geological historical events to identify the reasons for the sharp decline in the number of species and re-evaluate the status of A. grevilleoides reasonably and accurately.

2. Results

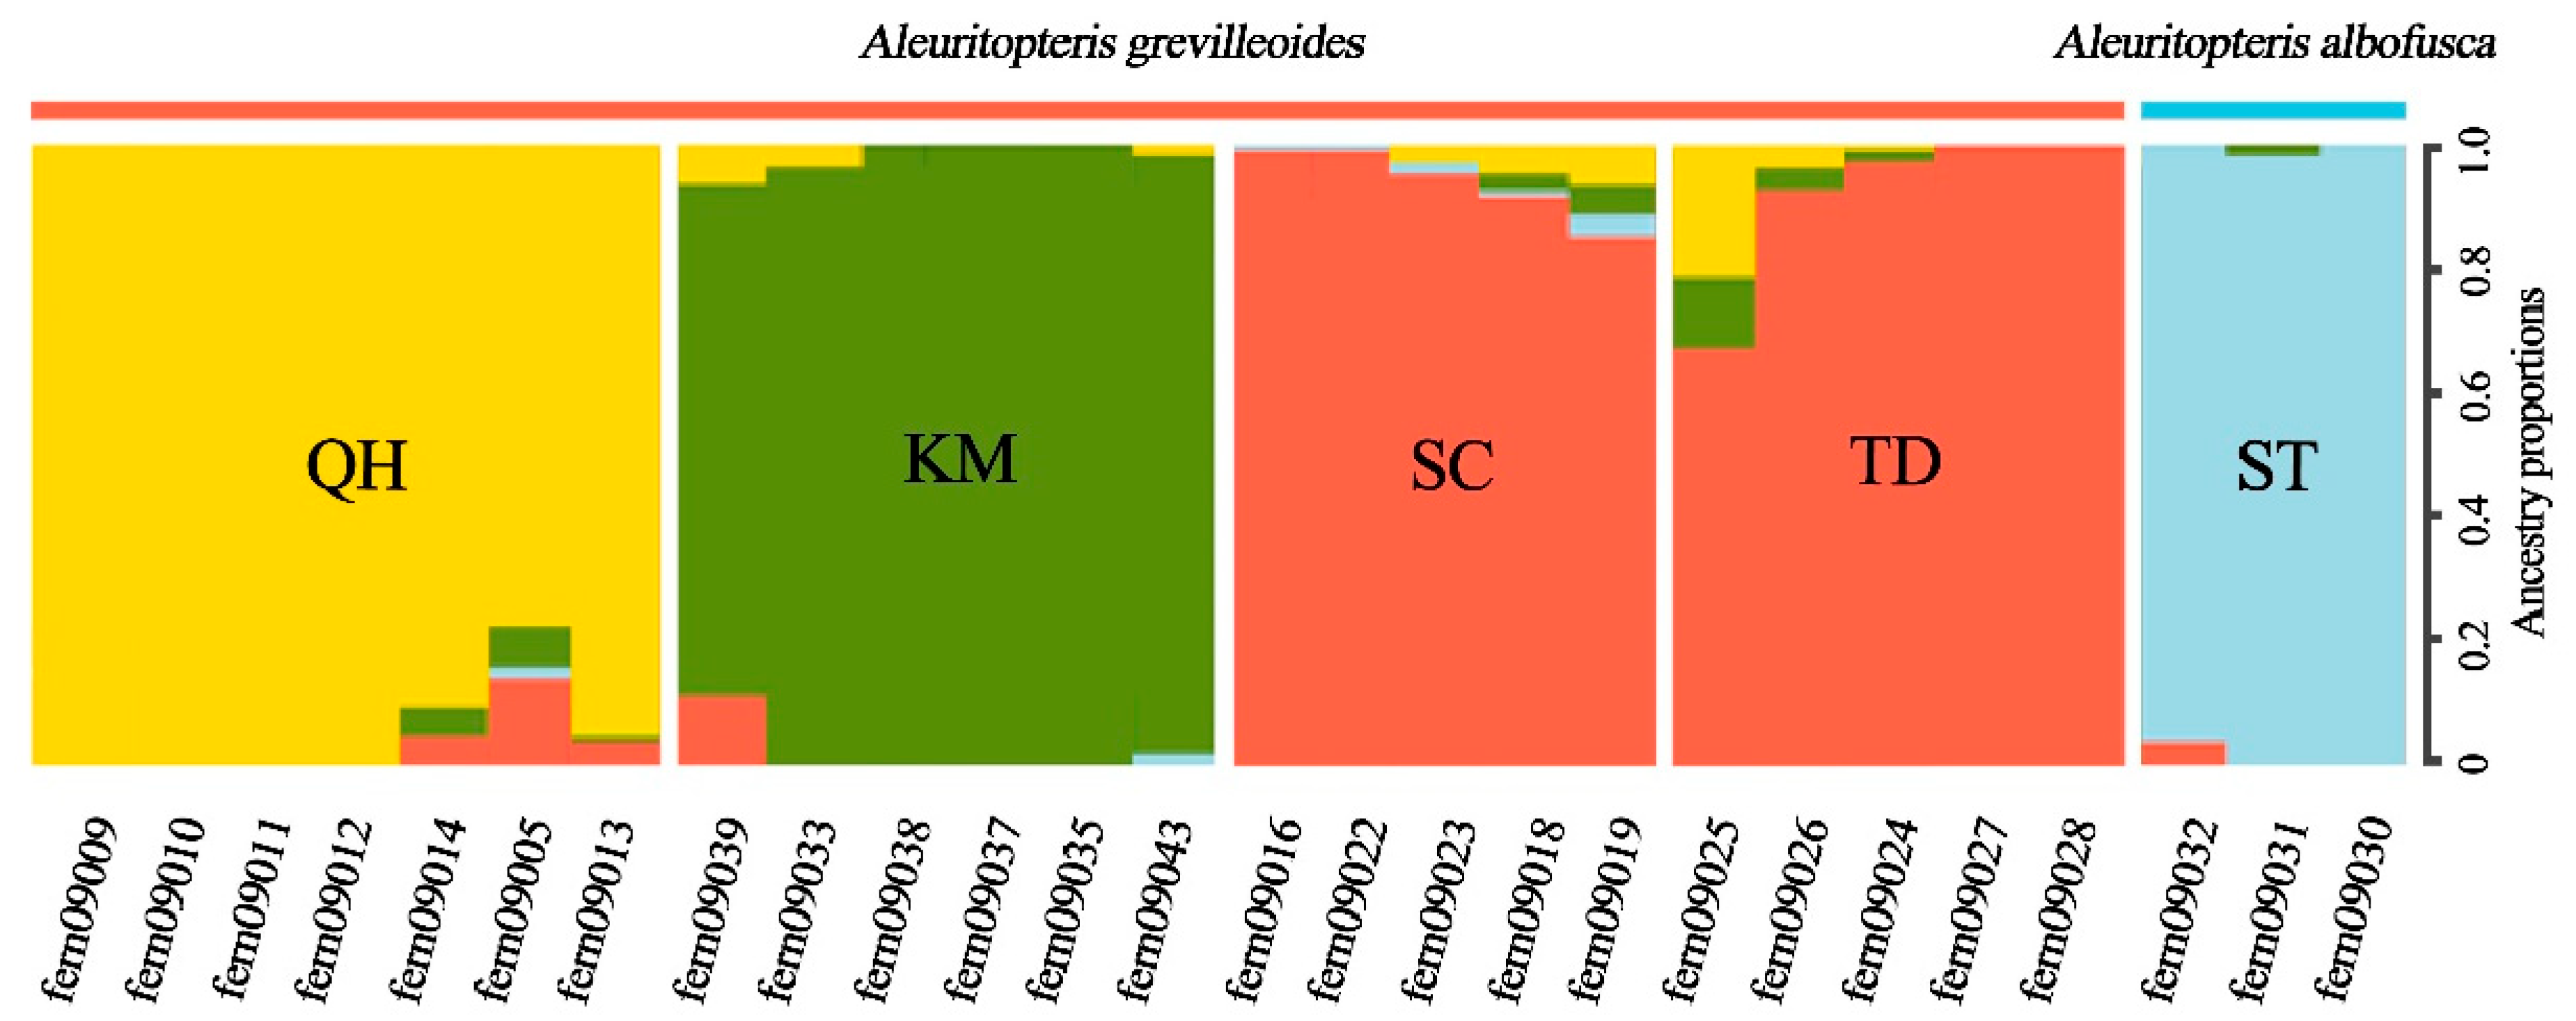
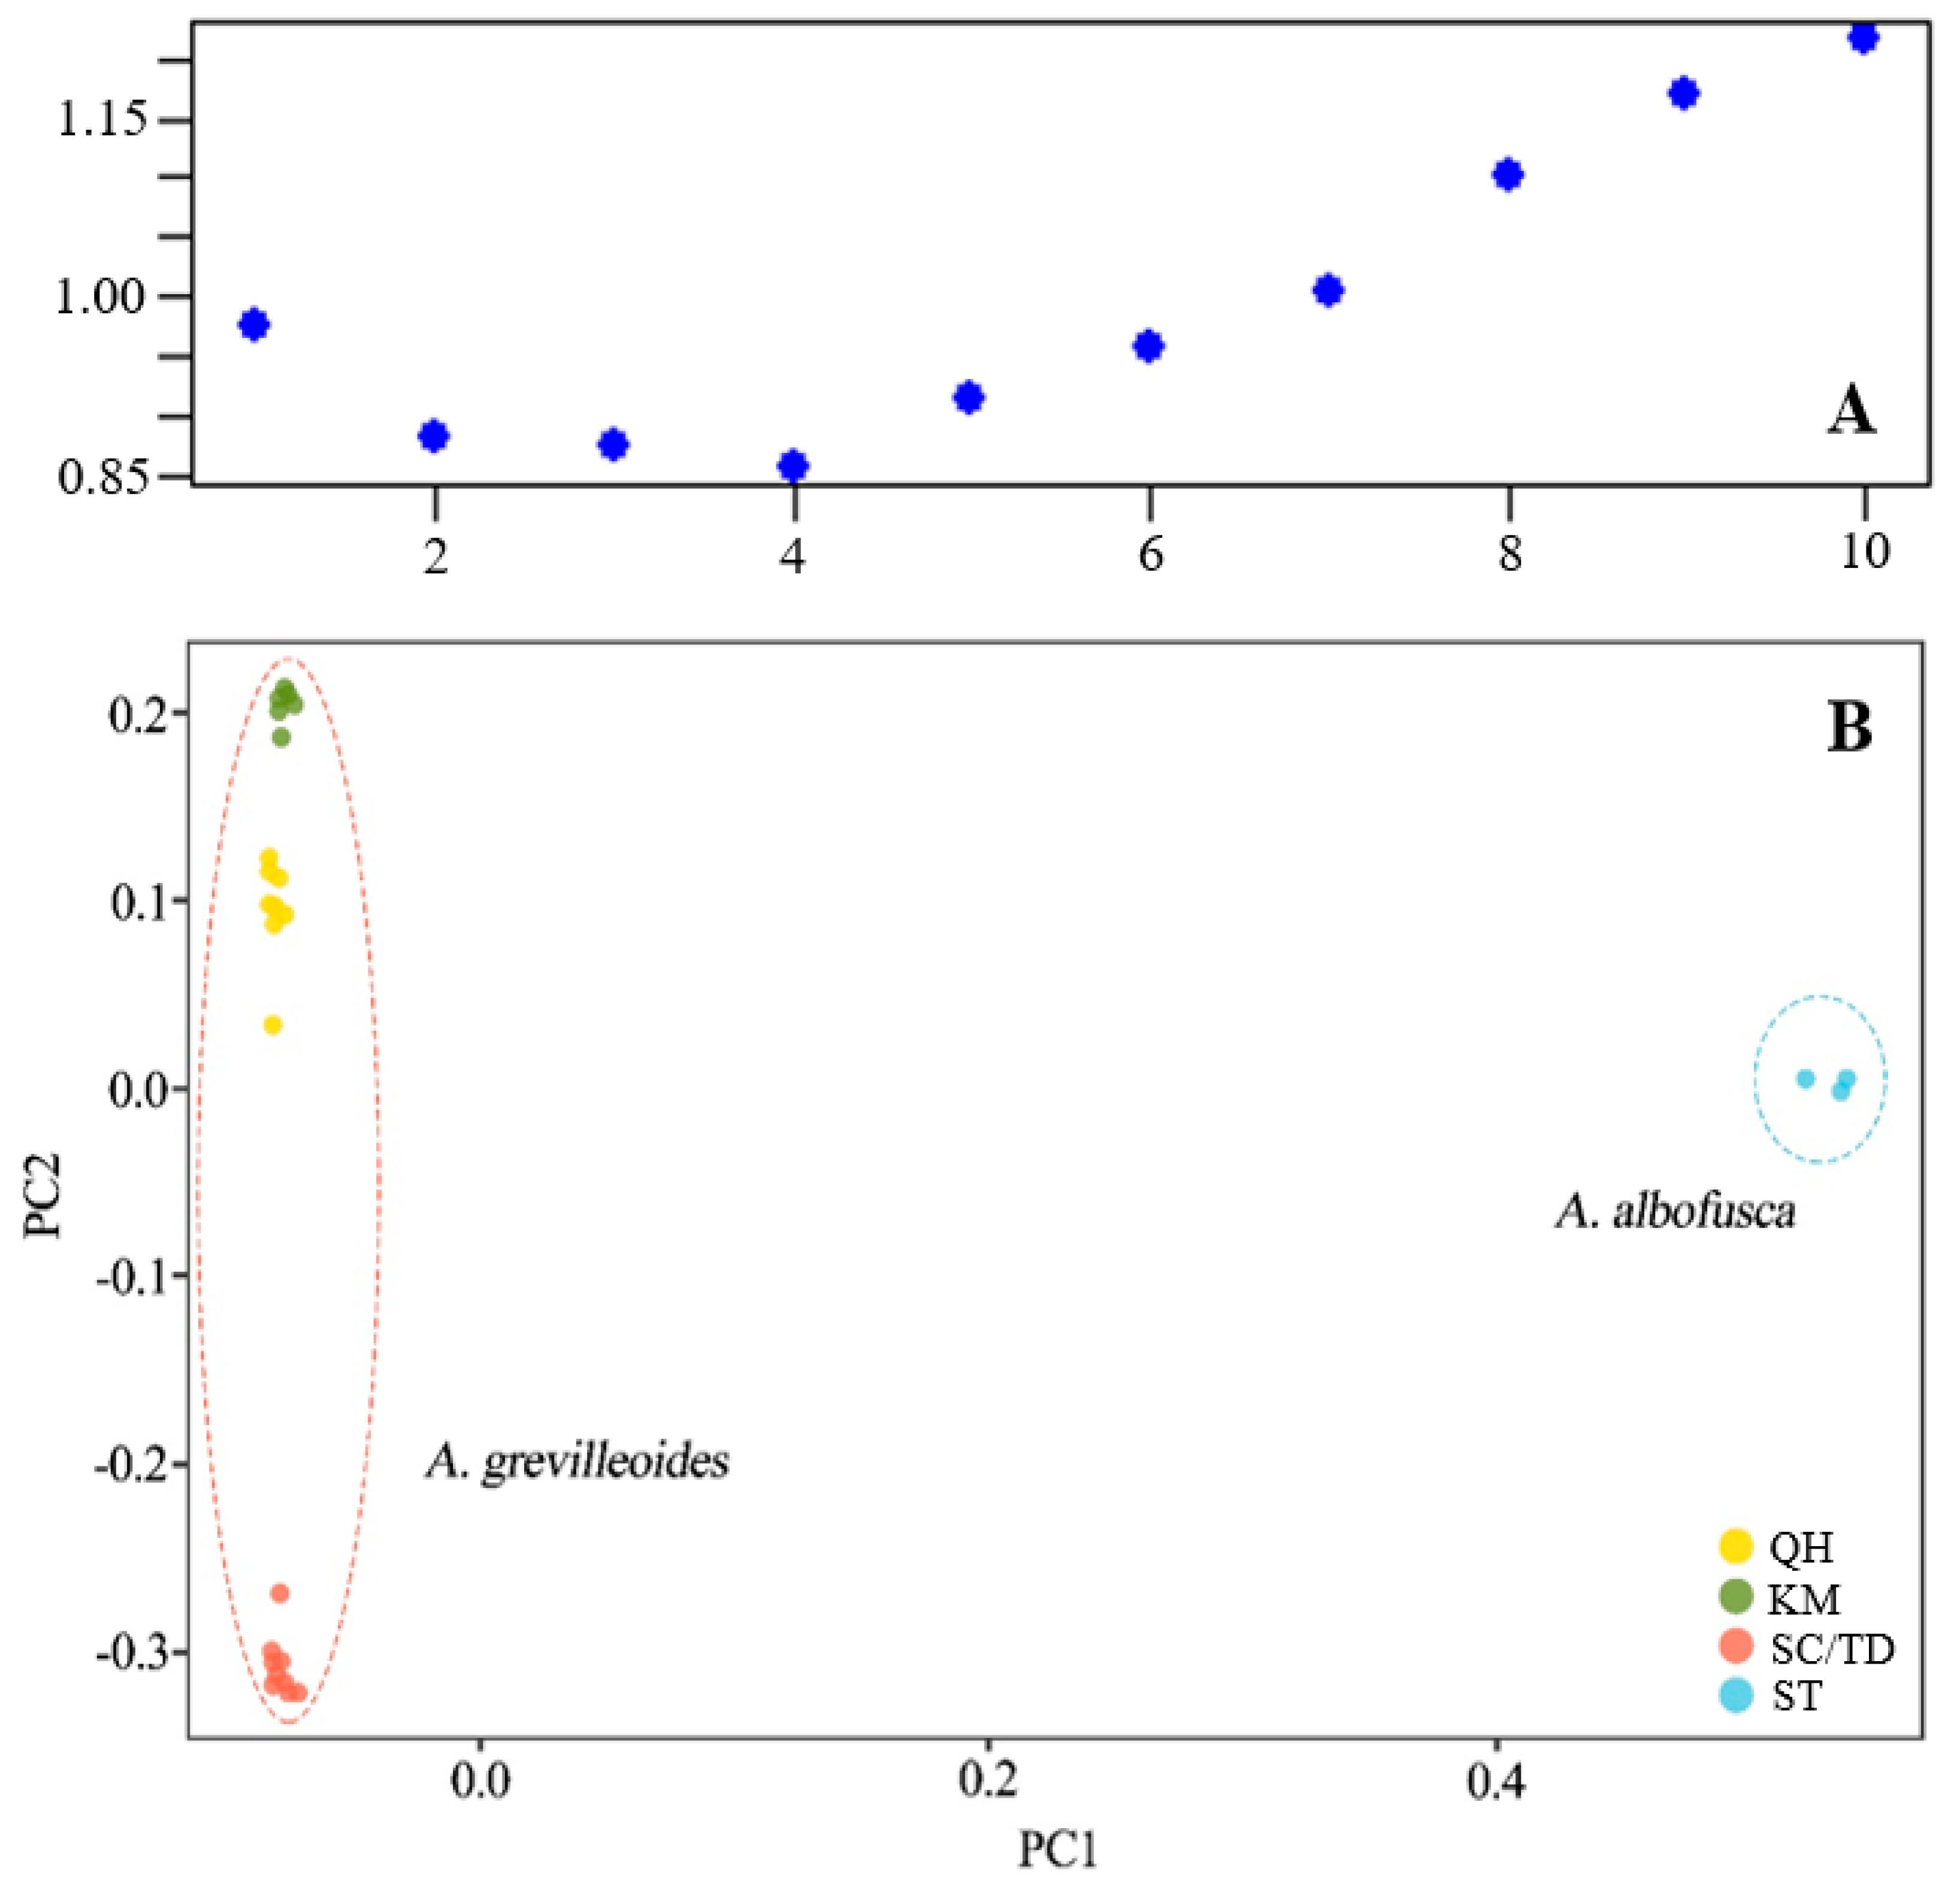
2.1. Genetic Structure

Based on the clustering of 8085 SNP loci after filtering, the CV value of genetic structure analysis was the smallest when K was 4 (Figure 1 and Figure 2A). When the best grouping value (K) of 4 was selected, 26 studied individuals were grouped into four clusters, and A. grevilleoides samples were divided into three genotypes (Figure 1). A small amount of introgression was observed between the three genetic groups of A. grevilleoides (QH, KM, and SC; Figure 1). The KM population was far away from other populations and had less gene exchange (Figure 1), and the QH group was similar to the KM group. Principal component analysis (PCA) also revealed four genetic groups of studied individuals (Figure 2B): the A. albofusca and A. grevilleoides were clearly separated and three genetic groups in A. grevilleoides, which was consistent with the results of the structural analysis.
The genetic differentiation coefficient (Fst) values among the 26 samples (Table 1) range from 0.031 to 0.684. The Fst values between the A. grevilleoides populations were all less than 0.250. The Fst values between the four populations of A. grevilleoides and A. albofusca range from 0.543 to 0.684, indicating that the two species were well differentiated. The SC and TD groups had an Fst of only 0.031 and had the same genotype. KM group also had a large differentiation from the other two groups. The degree of genotype differentiation between the KM group and the SC group was much lower than that between the QH group and the SC group.

2.2. Genetic Diversity

The statistical analysis of the genetic diversity information for the four populations of A. grevilleoides (Table 2) revealed that the QH group had the highest number of private alleles. Nucleic acid diversity Pi ranged from 0.159–0.268, and the SC (Pi = 0.251) and TD (Pi = 0.268) groups had higher genetic diversity. The Fis value can be used as an index of the degree of inbreeding among individuals within a population. Table 2 shows that the Fis value was greater than 0 in each population, indicating that inbreeding existed in all populations within the A. grevilleoides populations. The number of private alleles in the SC and TD groups was nearly 50% lower than that in the KM group, indicating that the two groups were less differentiated than the KM group.

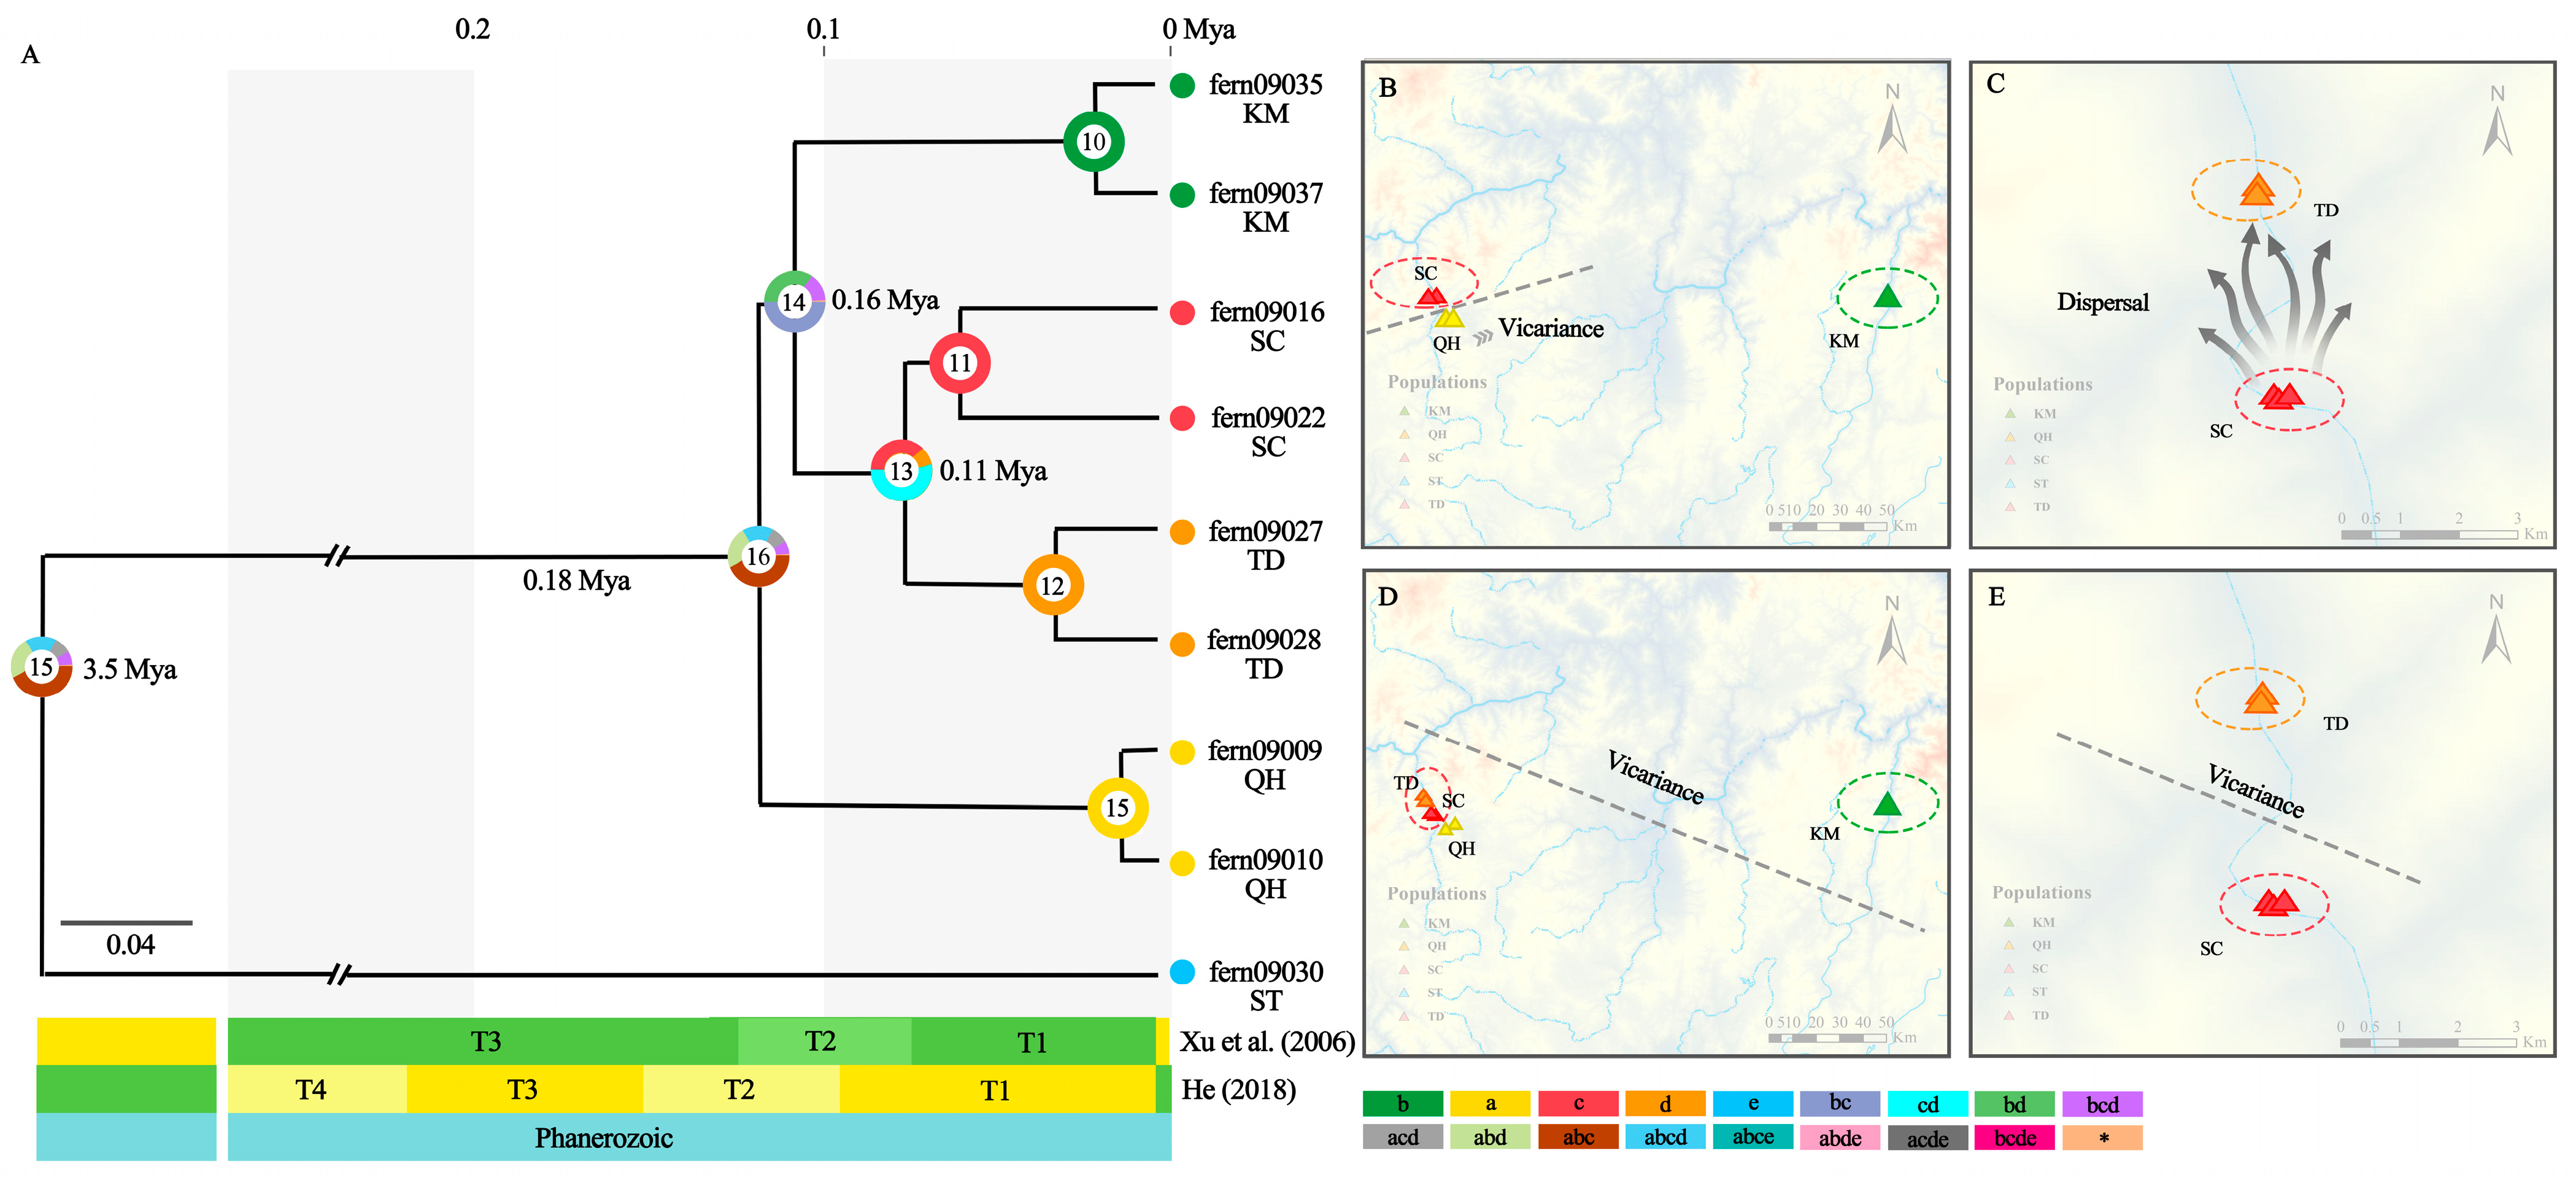
2.3. Divergence Time Estimation and Reconstruction of Ancestral State

RASP was used to simulate the ancestral distribution of A. grevilleoides, and the results (Figure 3A) indicated that an event of vicariance may have occurred in node 16 (Figure 3B). A. grevilleoides was probably widely distributed in the ABC area after the differentiation at 3.5 Mya. Subsequently, a vicariance event likely occurred in area A at 0.18 Mya. Two events, dispersal and vicariance, may have occurred at node 14 (Figure 3C,D). The original distribution area was BC, and the distribution then spread to D, after B vicariance occurred. The KM group, which had high homozygosity, was more closely related to the TD and SC groups at 0.16 Mya. This is consistent with the results of genetic differentiation. Node 13 shows that the CD area was the original distribution area, and it is highly likely that a geographical separation (vicariance) between C and D has occurred at 0.11 Mya (Figure 3E). The three differentiations of A. grevilleoides (Figure 3A) were both related to the formation of the dry-hot valleys.

2.4. Historical Fluctuation of Effective Population Size

The demographic history of the A. grevilleoides population was inferred on the basis of 23 individuals using Stairway Plot 2 with folded SFSs and masking singletons. The results based on the 95% confidence interval indicate that A. grevilleoides was in danger of extinction between 0.002 and 0.004 Kya. According to the standard line (Figure 4), the population size of A. grevilleoides fluctuated between 700 and 800 Kya, rapidly decreasing and then increasing rapidly, which may be related to the historical drainage capture events between the Luquan Wudongde and Jinpingzi Canyon in the dry-hot valley approximately 800 Kya. Then, the population decreased in a stepwise manner at 30–40 Kya, 5–6 Kya, 0.8–1 Kya, 0.15–0.2 Kya, 0.04–0.06 Kya, and 0.01–0.015 Kya. Notably, the six sharp declines and one fluctuation observed in the A. grevilleoides population, two were directly related to geographic events of dry-hot valleys.

3. Material and Methods
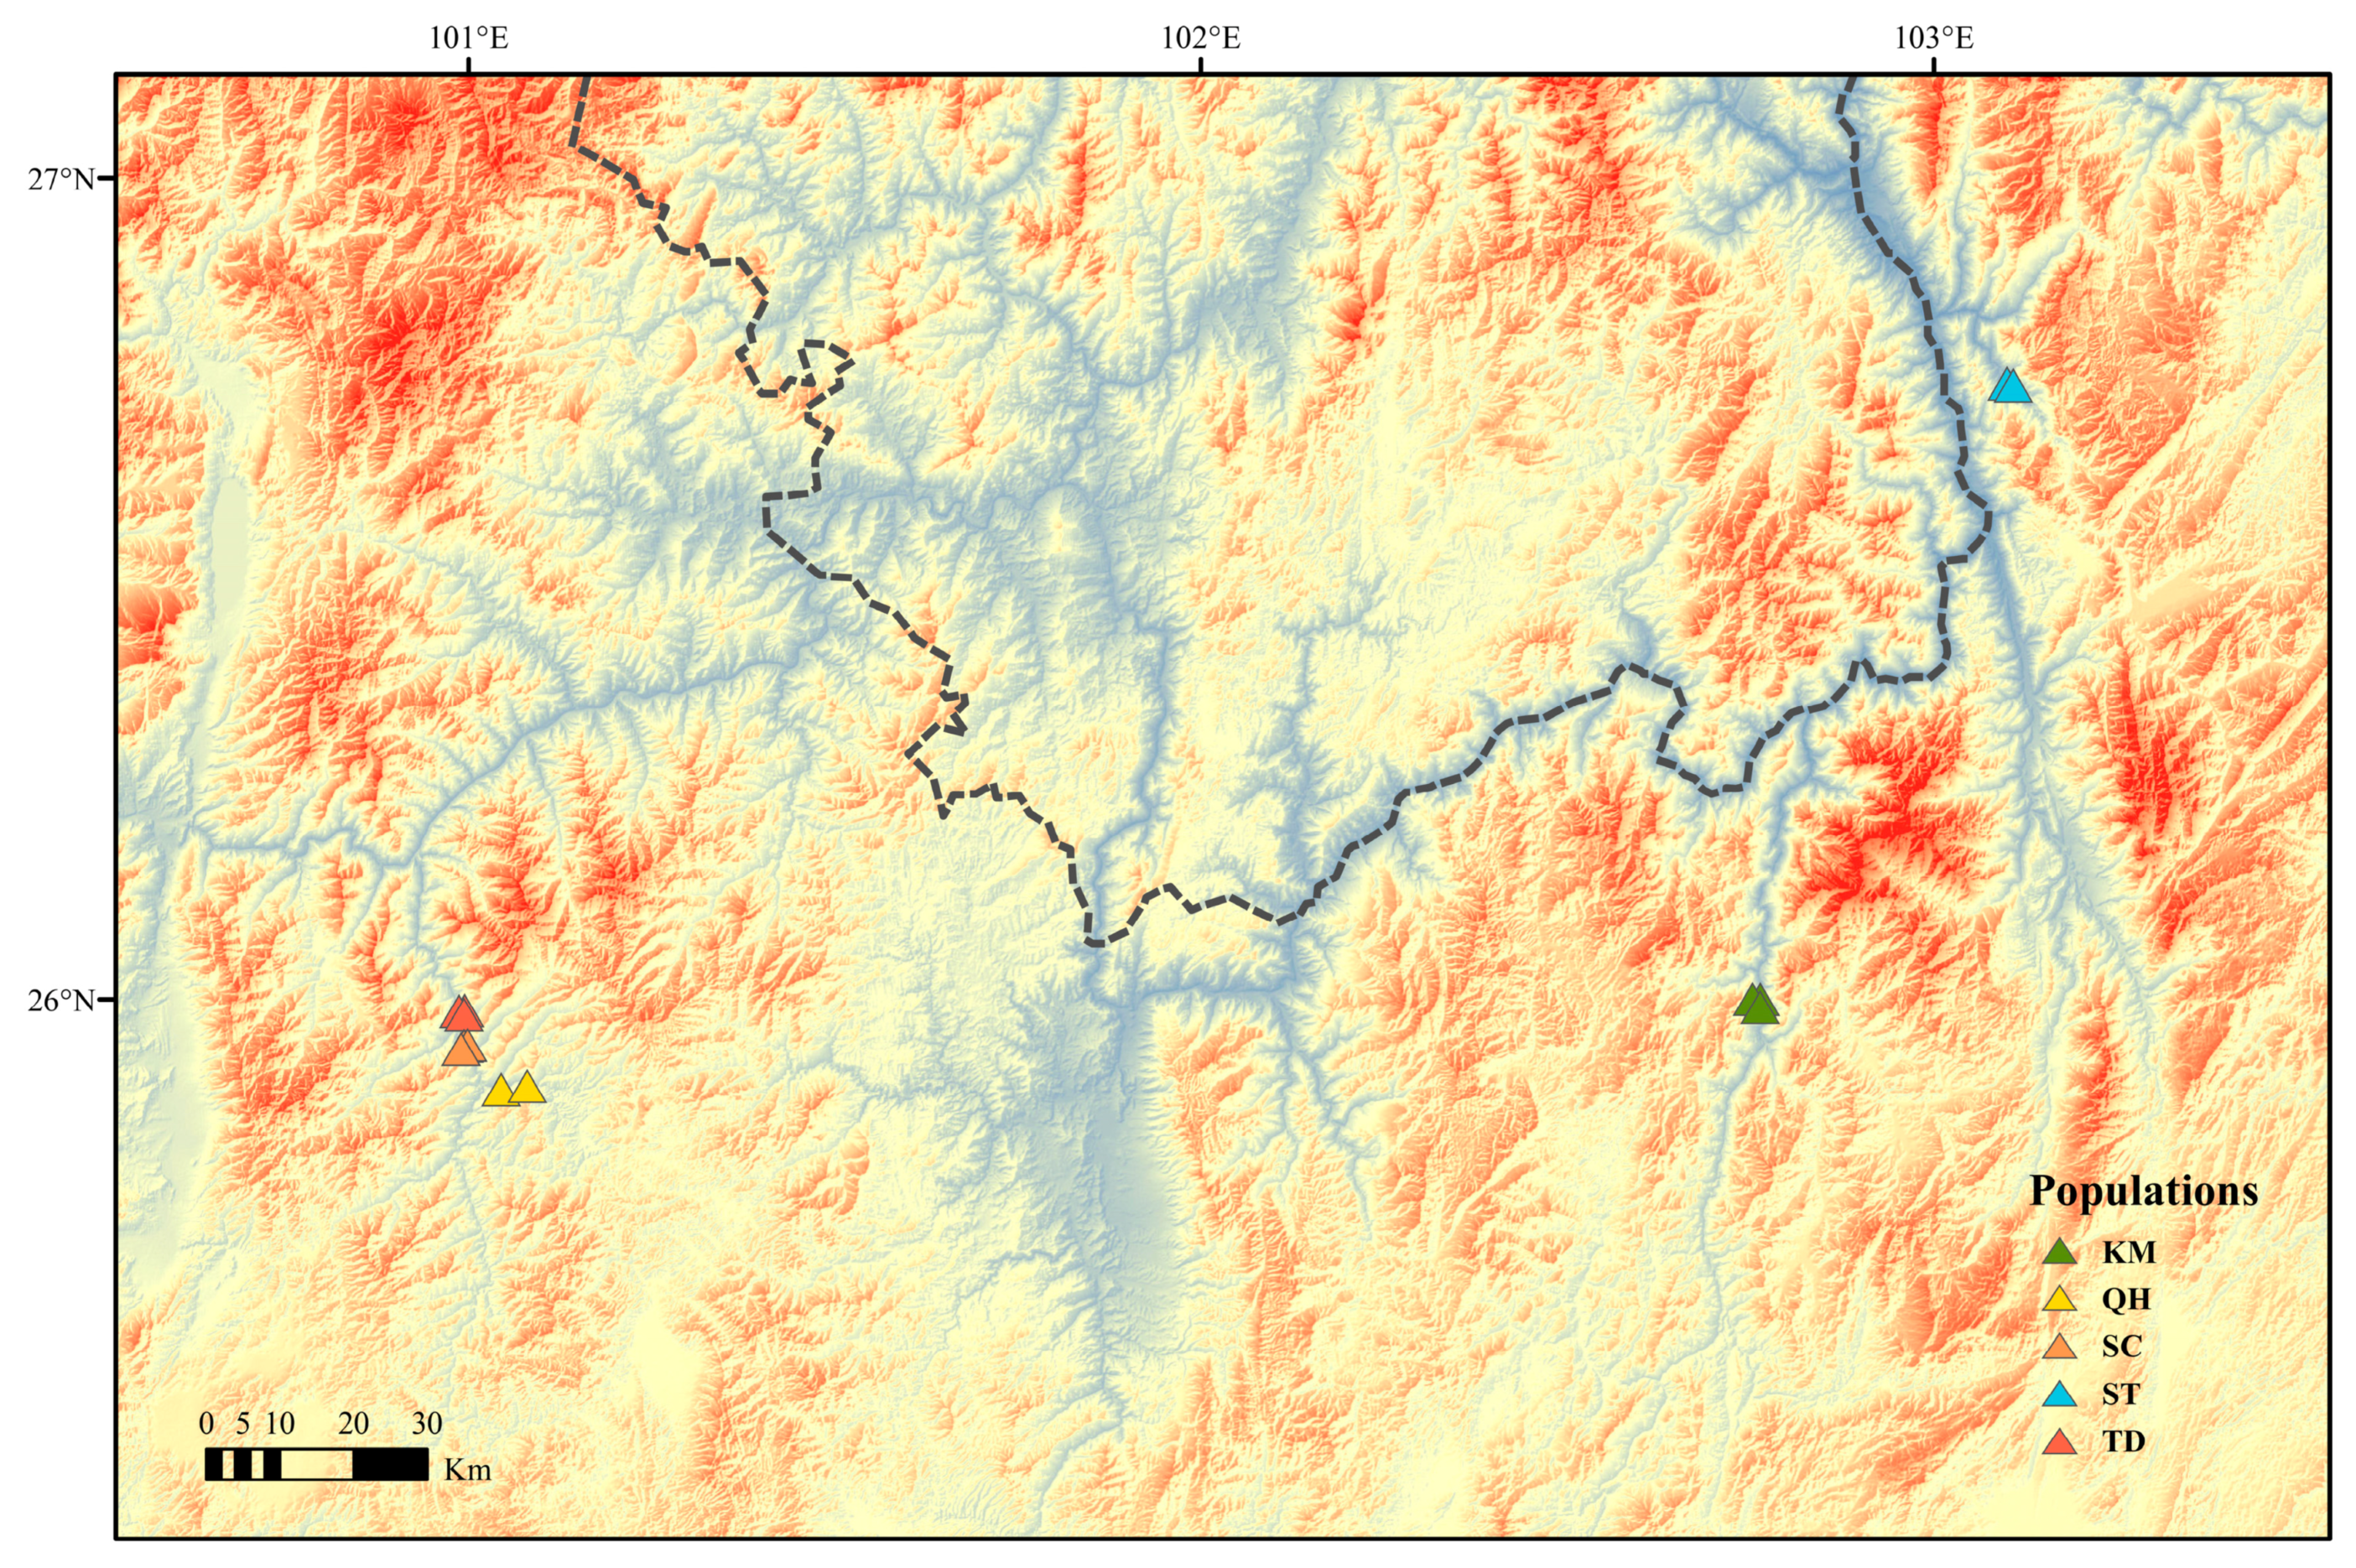
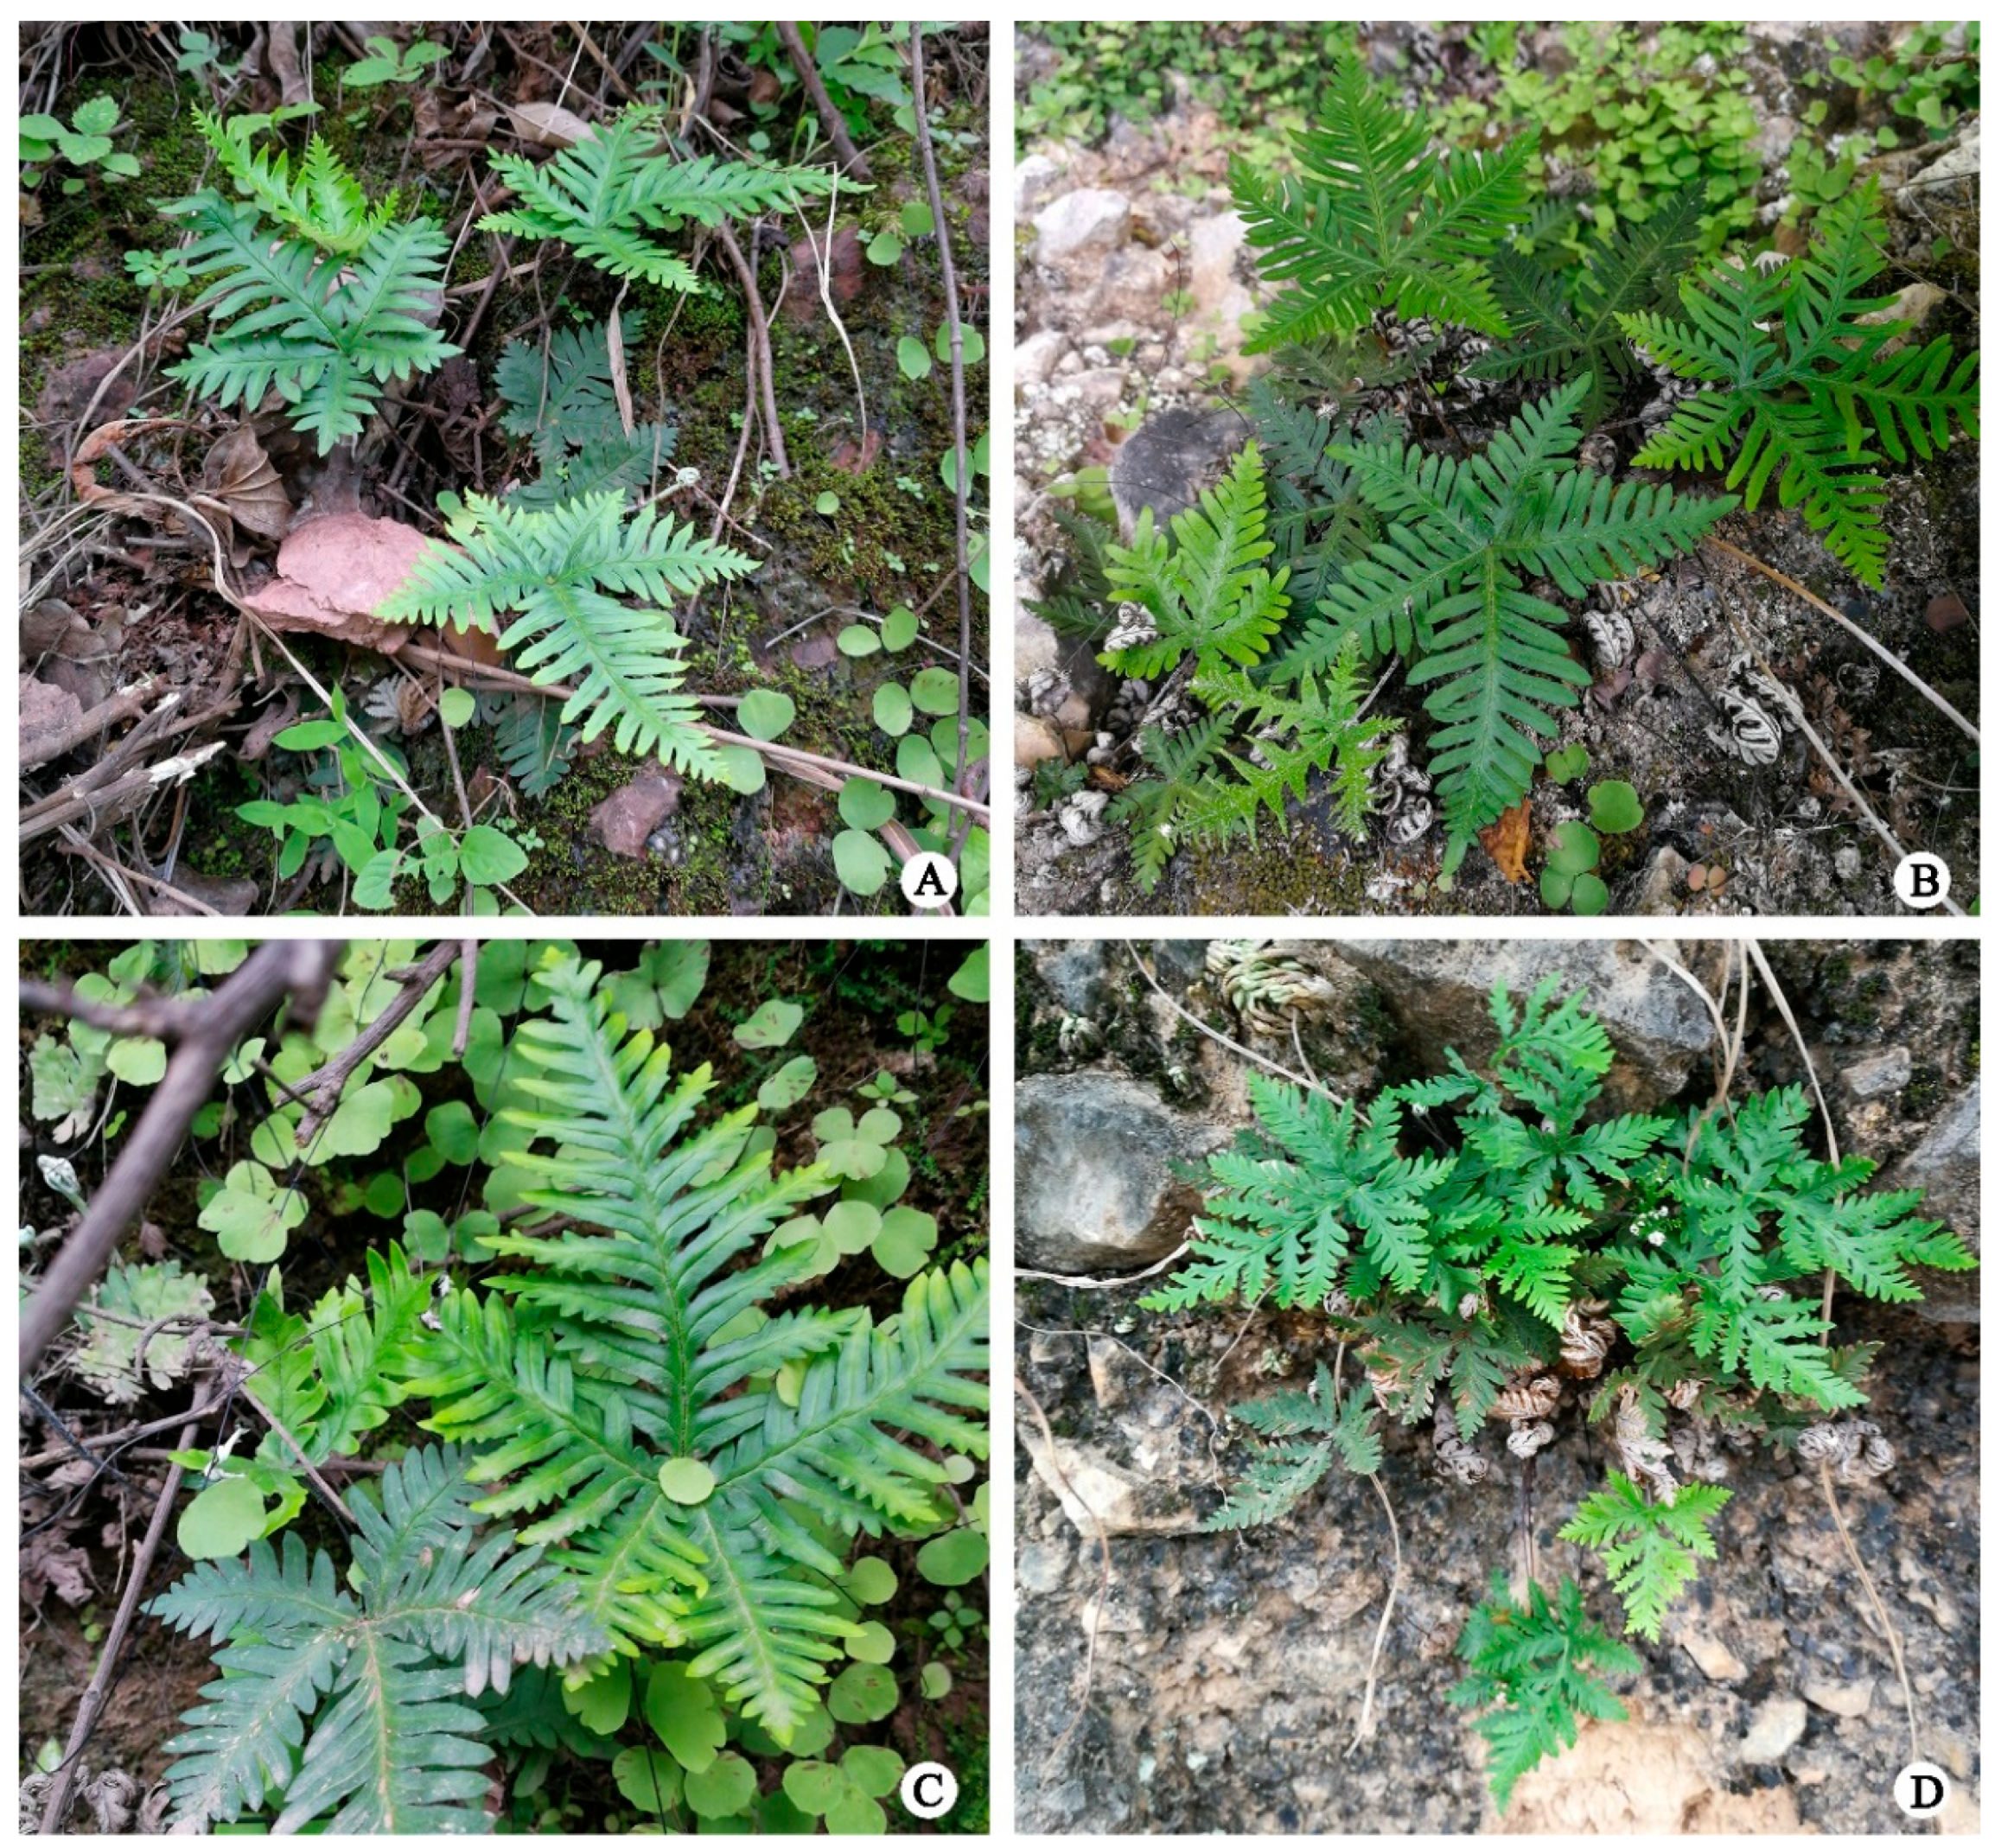
3.1. Plant Material

Aleuritopteris grevilleoides is mainly distributed in the west of Yunnan Province (Binchuan and Dayao) and the north of Sichuan Province (Qingchuan) in China, according to documentation records [30]. During the field investigation, no wild populations of A. grevilleoides were found in Sichuan, and only four populations (Figure 5) were found in Dayao County (SC, TD, and QH) and Kunming (KM), Yunnan. Twenty-three individuals from four wild populations (A. grevilleoides) and three individuals from the wild population of its closely related species (Aleuritopteris albofusca (Baker) Pic.Serm.) were collected. The collection scope covered the distribution areas found in the field of A. grevilleoides. The samples were grouped according to regional distribution (Figure 5). The sample materials for sequencing are all from fresh pinnae, and the whole plant was selected for pressing voucher specimens, dried in an oven, and stored in the herbarium of Shanghai Chenshan Botanical Garden (CSH). The detailed sample information is shown in Table 3.

3.2. DNA Extraction and Genotyping by Sequencing Library Construction

Total DNA was isolated from the samples using the Plant Genomic DNA Rapid Extraction Kit (Biomed Gene Technology, London, UK). DNA integrity was tested on 1% agarose gel. High-quality DNA was used to construct sequencing libraries for the genotyping by sequencing (GBS) method [31] (Beijing Novogene Co., Ltd., Beijing, China). Mse I and EcoR I were used for enzyme digestion. Adapters were added to both ends of the fragments, and the tag sequences containing the adapters were amplified by polymerase chain reaction (PCR). After mixing the samples, the DNA bands were recovered by electrophoresis, and the purified products were sequenced on the Illumina HiSeq platform.

3.3. Determine Single Nucleotide Polymorphisms (SNPs)

The raw reads obtained by machine sequencing were quality-controlled using FastQC 0.11.9 software, sequencing adapters and primer sequences were removed, and bases with a quality value lower than 20 were cut off. The fern09027 sample was selected for Stacks 2.54 [32] clustering and a pseudo-reference sequence was constructed, and the clean reads after filtering the sample were compared with the reference genome using BWA 0.7.17 [33]. Samtools 1.14 software was used to add headers and remove duplicates, and GATK 4.0 was run for variant detection. Individual sample variation sites and genotype information were extracted to generate vcf format files to obtain SNP markers.
The denovo_map.pl script in Stacks v2.54 [32] was used to perform de novo assembly and mutation detection on the GBS data of A. grevilleoides. To ensure the reliability of the downstream analysis, two parameters “--max-missing 0.5” and “--mac 3” in Plink 2 [34] were used to filter the SNPs. Further use Plink 2 to filter Hardy–Weinberg equilibrium (HWE) and linkage disequilibrium (LD), and filter according to p < 0.001, r2 < 0.001; The remaining high-quality SNPs after filtering were used for population structure.

3.4. Genetic Diversity and Structure

The 8085 remaining high-quality SNPs were applied in the sNMF function of R package LEA [35] to analyze the genetic structure of the 26 individuals. The sNMF settings were iterations = 200 and repetitions = 10 with other arguments set to defaults and the best K evaluated by minimal cross-entropy (CE). Principal component analysis (PCA) was performed by Plink 2 [36], and the resulting graph was drawn using the ggplot2 package in R.
The fixation index (Fst), based on genetic polymorphism data, estimates the difference between the average heterozygosity of a population and the average heterozygosity of the entire population. The observed heterozygosity (Ho), expected heterozygosity (He), nucleotide diversity (Pi), and fixation index (Fst) of all populations were calculated with Stacks v2.54 [37].

3.5. Divergence Time and Ancestral State

Biallelic SNPs were extracted from the SNP data by BCFtools, and each pair of SNPs was required to be more than 100 bp [38]. Stange used approximately 1000 SNPs to obtain accurate and strongly supported species [39]. Hybrid species cannot be used for the construction of multispecies coalescent models, which adversely affects the accuracy of the phylogenetic tree. After eliminating the hybrids of each population according to the results of the structure analysis, one to two species were selected from each population for tree construction. The python script snapp_prep.rb was used to set the parameters to “-m 1000” and “-l 100000” (https://raw.githubuserco-tent.com/mmatschiner/snapp_prep/master/snapp_prep.rb (accessed on 30 September 2022) to convert the variant call format (VCF) file into SNAPP format. Using the parameter “-threads”, the additional SNAPP package BEAST2 was used to construct the divergence time estimation tree according to the Bayesian principle; the graphs of the results were displayed using the windows of Tracer and BEAST2 [39]. The differentiation time (2.8−4.42 Mya) of A. albofusca and A. grevilleoides was obtained [40,41]. The Bayesian tree generated in the above process was imported into Reconstruct Ancestral State in Phylogenies (RASP) [42], and the ancestral distribution area was reconstructed with the statistical dispersal-vicariance analysis (S-DIVA) method [43].

3.6. Population Demographic History

Stairway Plot v2 is a nonparametric or flexible model method that can be applied to low-depth sequencing and restriction site-associated DNA sequencing (RADseq) [44,45,46]. After filtering the obtained SNP data, an SNP data set with no deletions or LD was generated. The VCF file containing the SNP dataset was used to create a one-dimensional site frequency spectrum (SFS) with the python script easySFS (https://github.com/isaacovercast/easySFS (accessed on 13 October 2022)). The SFS status was designated as folded to count the SFS of minor alleles. The maximum possible number of projection values was selected to output the SFS information, and the SFS information was input into the blueprint file required for Stairway Plot to run. A total of 200 bootstraps were used to calculate the median Ne and 95% confidence intervals. The effective size of the Ne variation of the A. grevilleoides population was determined.

4. Discussion

4.1. Genetic Diversity of Aleuritopteris Grevilleoides

Genetic diversity assessment is one of the most effective means to understand the survival of current populations and threatened or narrowly distributed species generally have low levels of genetic diversity [47]. In this study, SNP molecular markers revealed that A. grevilleoides had a low level of genetic diversity (Obs_Het = 0.166, Exp_Het = 0.322, Pi = 0.333, Table 2), similar to the threatened species Adiantum nelumboides X.C.Zhang, Ectopistes migratorius L., and Puma concolor L. [48,49,50]. Both inbreeding and drift can reduce genetic diversity [51]. Notably, the high inbreeding coefficient of A. grevilleoides, Fis = 0.45, far exceeds the normal level for natural species and threatened species [48]. Population genetics theory and data from previous studies suggest that a reduction in Ne (Figure 4) leads to a loss of genetic diversity, and species with declining populations have lower genetic diversity than species with increasing or stable populations [50,51,52]. The effective population historical dynamics predicted by Ne (Figure 4) showed that the population size continued to decline and the genetic diversity of A. grevilleoides continued to contract; these results were consistent with the results of the genetic diversity analysis. The structure analysis (Figure 1) divided the four natural populations of A. grevilleoides into three genetic groups. The genetic diversity of each population of A. grevilleoides was lower than the overall genetic diversity, and the inbreeding coefficient was high, which will cause the genetic diversity of A. grevilleoides to decrease. The loss of genetic diversity can lead to the endangerment or even extinction of species [49,50].
According to these results, the genetic diversity level of A. grevilleoides reflects the characteristics of threatened species; this indicates that the threatened level of A. grevilleoides may need to be reassessed. The possible reason for the inaccurate assessment is misidentification. Figure 6A–C show the phenotypes corresponding to the genotypes of A. grevilleoides. For example, transitional morphology with A. albofusca (Figure 6D) was observed in the TD and SC populations. Yuan also found that many specimens identified as A. grevilleoides in the China Digital Herbarium and the National Specimen Platform were actually specimens of closely related species, such as A. albofusca [26].

4.2. Dry-Hot Valleys Are Refuges after A. grevilleoides Population Size Decreases

During the Quaternary Pleistocene, the dry-hot valley experienced several large-scale glacial periods beginning in the Tertiary Pleistocene. The dry and warm climatic conditions made the local environment a refuge for ancient plants and their descendants on the ancient southern continent, such as Musella lasiocarpa (Franch.) C.Y.Wu ex H.W.Li, Dodonaea viscosa subsp. angustifolia (L.f.) J.G.West, Quercus cocciferoides Hand.-Mazz., and Quercus aquifolioides Rehder and E.H.Wilson [11,12]. Based on ancestral geographic reconstruction and evolutionary time, A. grevilleoides was formed after the uplift of the Qinghai-Tibet Plateau (Figure 3) and three differentiations occurred with the formation of the second and third terraces of the dry-hot valley [28,29]. An ancestral population differentiated to form two branches of QH and SC/KM/TD, then, because of the changes in the environment caused by the terrace of the dry-hot valley, the population at SC/TD(C/D) and KM(B) became vicariance (Figure 3D). At the same time, the A. grevilleoides in Dayao County spread from SC (C) to the warmer TD (D). Previous studies have found that the main ecological factor affecting the distribution of A. grevilleoides is temperature, which is consistent with our results [26]. The dry-hot valleys provided a cradle for the survival and proliferation of A. grevilleoides, which has survived to this day.
Although dry-hot valleys provided the cradle for the spread of A. grevilleoides, historical events such as topographical changes have also led to its population decline. Yuan believed that environmental changes caused by human damage, such as the construction of hydropower stations and roads and slope hardening, may be the main reason for the endangerment of A. grevilleoides [26]. However, human activities began to affect the climate and ecosystems after the onset of the Anthropocene in 7000 BC [53]. Our research results show that the population history and size changes of A. grevilleoides are closely related to geo-historical events, rather than human disturbance. Therefore, human disturbances may have accelerated the process of large-scale degradation of flora in dry-hot valleys, but it is not the main cause. The time differentiation results (Figure 3A) indicated that the two differentiations of A. grevilleoides were closely related to the topography changes in dry-hot valley [29,54]. The results of the population dynamics analysis (Figure 4) showed that the population of A. grevilleoides increased once at 0.6−0.8 Mya. A. grevilleoides also experienced an increase in population which may have been related to the historical drainage capture events between the Luquan Wudongde and Jinpingzi Canyon 0.8 Mya. The river allowed the dispersal of the divergent A. grevilleoides populations in Dayao and Lukou Counties and the emergence of gene exchange events (Figure 1). The A. grevilleoides population decreased from 30 Kya to 40 Kya, which may be related to the latest topographic change in the dry-hot valley.
Combined with the analysis of population dynamics, it is evident that ecological restoration projects in dry-hot valleys may have been an effective means to prevent ecosystem degradation over the past decade. The population dynamics analysis indicates that the population of A. grevilleoides ceased to decline for a period after the ecological restoration project started. In addition, the results of the current study reveal issues in the assessment of the threat category of A. grevilleoides. Thus, this assessment must be re-evaluated, and corresponding protection plans should be formulated. The incorrect threat assessment may be due to an insufficient understanding of A. grevilleoides in the past, such as identification errors, insufficient survey scales, and a lack of systematic studies.

5. Conclusions

Degraded ecosystems dominated by grasses have emerged in dry-hot valleys. The predominant view is that human destruction is the main driver of environmental changes. The three differentiations of A. grevilleoides and the change in population dynamics were found to be related to the geological changes in the dry-hot valleys, according to our comprehensive analysis, which included genetic diversity analysis, temporal differentiation, and the reconstruction of the ancestral distribution area of A. grevilleoides. As early as 40 kya, the dry-hot valley effect began to intensify, resulting in a periodic decline in the population size and genetic diversity of A. grevilleoides. However, human activities began to affect the climate and ecosystems after the Anthropocene in 7000 BC. Therefore, human disturbances may have accelerated the process of large-scale degradation of flora in dry-hot valleys, but it is not the main cause of vegetation degradation in dry-hot valleys.

Author Contributions

Y.-H.Y. conceived the project. J.-W.S. and Y.-H.Y. supervised the work. X.-Y.W., D.-M.J., W.-Y.S. and J.-Y.X. gathered and analyzed data. X.-Y.W., J.Z. and T.W. contributed to data interpretation. X.-Y.W., J.-W.S. and Y.-H.Y. wrote the manuscript with help from all other co-authors. All authors have read and agreed to the published version of the manuscript.

Funding

This work was supported by Biodiversity Survey and Assessment Project of the Ministry of Ecology and Environment (2019HJ2096001006). National Natural Science Foundation of China (32170216), and Strategic Pilot Science and Technology Project of Chinese Academy of Sciences (XDA19050404).

Institutional Review Board Statement

Not applicable.

Informed Consent Statement

Not applicable.

Data Availability Statement

The data presented in this study are available in this article.

Conflicts of Interest

The authors declare no conflict of interest.

References

  1. Antonelli, A.; Kissling, W.D.; Flantua, S.G.A.; Bermúdez, M.A.; Mulch, A.; Muellner-Riehl, A.N.; Kreft, H.; Linder, H.P.; Badgley, C.; Fjeldså, J. Geological and climatic influences on mountain biodiversity. Nat. Geosci. 2018, 11, 718–725. [Google Scholar] [CrossRef] [Green Version]
  2. Cody, S.; Richardson, J.E.; Rull, V.; Ellis, C.; Pennington, R.T. The great American biotic interchange revisited. Ecography 2010, 33, 326–332. [Google Scholar] [CrossRef]
  3. Vermeij, G.J. When biotas meet: Understanding biotic interchange. Science 1991, 253, 1099–1104. [Google Scholar] [CrossRef] [PubMed]
  4. Yan, F.; Zhou, W.W.; Zhao, H.T.; Yuan, Z.Y.; Wang, Y.Y.; Jiang, K.; Jin, J.Q.; Murphy, R.W.; Che, J.; Zhang, Y.P. Geological events play a larger role than pleistocene climatic fluctuations in driving the genetic structure of Quasipaa boulengeri (Anura: Dicroglossidae). Mol. Ecol. 2013, 22, 1120–1133. [Google Scholar] [CrossRef]
  5. Wu, Z.Y.; Milne, R.I.; Liu, J.; Slik, F.; Yu, Y.; Luo, Y.H.; Monro, A.K.; Wang, W.T.; Wang, H.; Kessler, P.J.A.; et al. Phylogenomics and evolutionary history of Oreocnide (Urticaceae) shed light on recent geological and climatic events in SE Asia. Mol. Phylogenet. Evol. 2022, 175, 107555. [Google Scholar] [CrossRef]
  6. Wu, C.Y.; Wu, S.G. A proposal for a new floristic kingdom (realm). In Floristic Characteristics and Diversity of East Asian Plants; Zhang, A.L., Wu, S.G., Eds.; China Higher Education Press: Hong Kong, China; Springer: Berlin/Heidelberg, Germany, 1996; pp. 3–42. [Google Scholar]
  7. Wen, J.; Zhang, J.Q.; Nie, Z.L.; Zhong, Y.; Sun, H. Evolutionary diversification of plants on the Qinghai-Tibetan Plateau. Front. Genet. 2014, 5, 4. [Google Scholar] [CrossRef] [PubMed] [Green Version]
  8. He, Y.B.; Lu, P.Z.; Zhu, T. Causes for the Formation of Dry-Hot Valleys in Hengduan Mountain Yunan Plateau. Resour. Sci. 2000, 22, 69–73. [Google Scholar]
  9. Zhu, H.; Tan, Y.H.; Yan, L.C.; Liu, F.Y. Flora of the Savanna-like Vegetation in Hot Dry Valleys, Southwestern China with Implications to their Origin and Evolution. Bot. Rev. 2020, 3, 281–297. [Google Scholar] [CrossRef]
  10. Yang, J.D.; Zhang, Z.M.; Shen, Z.H.; Ou, X.K.; Geng, Y.P.; Yang, M.Y. Review of research on the vegetation and environment of dry-hot valleys in Yunnan. Biodivers. Sci. 2016, 24, 462–474. [Google Scholar] [CrossRef]
  11. Jin, Z.Z.; Ou, X.K.; Qu, P.D.; Chen, J. Preliminary study on the floristic characteristics of seed plants in the dry-hot valley of Jinsha River. Acta Bot. Yunnanica 1994, 16, 1–16. [Google Scholar]
  12. Jin, Z.Z.; Yang, Y.P.; Tao, G.D. The floristic characteristics, nature and origin of seed plant in the dry-hot river valley of SW China. Acta Bot. Yunnanica 1995, 17, 129–143. [Google Scholar]
  13. Ji, Z.H.; Pan, Z.X.; Sha, Y.C.; Fang, H.D.; Liao, C.F.; Bai, D.Z.; Yang, Y.X. Model Construction of Ecological Restoration in Arid Hot Valley of Jinsha River. J. Agro-Environ. Sci. 2006, 25, 716–720. [Google Scholar]
  14. Díaz, F.P.; Latorre, C.; Carrasco-Puga, G.; Wood, J.R.; Wilmshurst, J.M.; Soto, D.C.; Cole, T.L.; Gutiérrez, R.A. Multiscale climate change impacts on plant diversity in the Atacama Desert. Glob. Change Biol. 2019, 25, 1733–1745. [Google Scholar] [CrossRef]
  15. Mao, K.S.; Milne, R.; Zhang, L.B.; Peng, Y.L.; Liu, J.Q.; Thomas, P.; Mill, R.; Renner, S.S. Distribution of living Cupressaceae reflects the breakup of Pangea. Proc. Natl. Acad. Sci. USA 2012, 109, 7793–7798. [Google Scholar] [CrossRef] [Green Version]
  16. Zhao, J.L.; Xia, Y.M.; Cannon, C.H.; Kress, W.J.; Li, Q.J. Evolutionary diversification of alpine ginger reflects the early uplift of the Himalayan-Tibetan Plateau and rapid extrusion of Indochina. Gondwana Res. 2016, 32, 232–241. [Google Scholar] [CrossRef] [Green Version]
  17. Zhang, T.; Sun, H. Phylogeographic structure of Terminalia franchetii (combretaceae) in southwest china and its implications for drainage geological history. J. Plant Res. 2011, 124, 63–73. [Google Scholar] [CrossRef]
  18. Chen, L.H.; Hu, T.X.; Zhang, F. AFLP analysis on genetic diversity of Juglans populations in dry and dry-hot valleys of Sichuan province. J. Fruit Sci. 2009, 26, 48–54. [Google Scholar]
  19. Dong, S.Y.; Zuo, Z.Y.; Yan, Y.H.; Xiang, J.Y. Red list assessment of lycophytes and ferns in China. Biodivers. Sci. 2017, 25, 765–773. [Google Scholar] [CrossRef] [Green Version]
  20. Qin, H.N.; Yang, Y.; Dong, S.Y.; He, Q. Threatened species list of China’s higher plants. Biodivers. Sci. 2017, 25, 696–744. [Google Scholar] [CrossRef] [Green Version]
  21. Christensen, C.; Chink, R.C. Sinopteris, a New Fern Genus in China. Bull. Fan Mem. Inst. Bot. 1933, 4, 355–364. [Google Scholar]
  22. National Forestry Administration and Ministry of Agriculture of the People’s Republic of China. 1999; List of National Key Preserved Wild Plants (Batch 1) [EB/OL]. Available online: http://www.gov.cn/gongbao/content/2000/content_60072.htm (accessed on 20 March 2023).
  23. National Forestry and Grassland Administration of the People’s Republic of China. 2021; List of National Key Preserved Wild Plants, EB/OL. Available online: http://www.gov.cn/zhengce/zhengceku/2021-09/09/content_5636409.htm (accessed on 9 September 2021).
  24. Wang, W.Q.; Zhu, H.; Peng, Z.J.; Sun, C.S.; Cheng, X. Resource Distribution, Protection Status and Reasonable Utilization of Sinopteris. In China Botanical Garden; China Forestry Publishing House: Beijing, China, 2010; pp. 158–163. [Google Scholar]
  25. Wang, W.Q.; Cheng, X.; Jiao, Y.; Chen, G.J. Substratum Affects the Gametophyte Development and Reproduction of Sinopteris grevilleoides (Sinopteridaceae) an Endangered Fern Endemic to China. Acta Bot. Yunnanica 2010, 32, 25–31. [Google Scholar] [CrossRef]
  26. Yuan, Q.; Liu, Y.B.; Jin, D.M.; Song, Y.G.; Morigengowa; Gu, Y.F.; Wang, A.H.; Xiang, J.Y.; Dai, X.L.; Yan, Y.H. Three endangered Pteridaceae species in China: Current population and conservation suggestion. Chin. J. Ecol. 2021, 42, e02396. [Google Scholar]
  27. Zhong, X.H. Ecosystem degradation, restoration and reconstruction approaches in hot-dry valley. Resour. Environ. Yang Tze Basin 2000, 9, 1–4. [Google Scholar]
  28. Xu, Q.M.; Yang, D.Y.; Ge, Z.S.; Chen, D.J.; Xu, G.F. Terraces along Sanduizi-Wudongde section of Jinsha Rive. Sci. Geogr. Sin. 2006, 26, 609–615. [Google Scholar]
  29. He, R. Study on the Formation Age of the Dry Hot Valley Based on River Terrace Records in the Qiaojia Section of Jinsha River. Master’s Thesis, Yunnan Normal University, Yunnan, China, 2018. [Google Scholar]
  30. Qin, R.C.; Xing, G.X. Flora Reipublicae Popularis Sinicae. Typis Acad. Sci. Sin. 1990, 3, 180. [Google Scholar]
  31. Sonah, H.; Bastien, M.; Iquira, E.; Tardivel, A.; Le´gare, G.; Boyle, B.; Normandeau, E.; Laroche, J.; Larose, S.; Jean, M.; et al. An improved genotyping by sequencing (gbs) approach offering increased versatility and efficiency of snp discovery and genotyping. PLoS ONE 2013, 8, e54603. [Google Scholar] [CrossRef] [Green Version]
  32. Rochette, N.; Rivera-Colón, A.; Catchen, J. Stacks 2: Analytical methods for paired-end sequencing improve RADseq-based population genomics. Mol. Ecol. 2019, 28, 4737–4754. [Google Scholar] [CrossRef]
  33. Li, H.; Durbin, R. Fast and accurate long-read alignment with Burrows–Wheeler transform. Bioinformatics 2010, 26, 589–595. [Google Scholar] [CrossRef] [Green Version]
  34. Chang, C.C.; Chow, C.C.; Tellier, L.C.A.M.; Vattikuti, S.; Purcell, S.M.; Lee, J.J. Second-generation PLINK: Rising to the challenge of larger and richer datasets. GIGASCIENCE 2015, 4, 7. [Google Scholar] [CrossRef]
  35. Frichot, E.; Francois, O. LEA: An R package for landscape and ecological association studies. Methods Ecol. Evol. 2015, 6, 925–929. [Google Scholar] [CrossRef]
  36. Galinsky, K.J.; Bhatia, G.; Loh, P.R.; Georgiev, S.; Mukherjee, S.; Patterson, N.J.; Price, A.L. Fast Principal-Component Analysis Reveals Convergent Evolution of ADH1B in Europe and East Asia. Am. J. Hum. Genet. 2016, 98, 456–472. [Google Scholar] [CrossRef] [Green Version]
  37. Catchen, J.; Hohenlohe, P.; Bassham, S.; Amores, A.; Cresko, W.A. Stacks: An analysis tool set for population genomics. Mol. Ecol. 2013, 22, 3124–3140. [Google Scholar] [CrossRef] [Green Version]
  38. Conte, A.M.; Gammerdinger, J.W.; Bartie, L.K.; Penman, D.J.; Kocher, T.D. A high quality assembly of the Nile Tilapia (Oreochromis niloticus) genome reveals the structure of two sex determination regions. BMC Genom. 2017, 18, 341. [Google Scholar] [CrossRef]
  39. Stange, M.; Sanchez-Villagra, M.R.; Salzburger, W.; Matschiner, M. Bayesian divergence-time estimation with genome-wide single-nucleotide polymorphism data of sea catfishes (ariidae) supports miocene closure of the panamanian isthmus. Syst. Biol. 2018, 4, 681–699. [Google Scholar] [CrossRef] [Green Version]
  40. Nitta, J.H.; Schuettpelz, E.; Ramírez-Barahona, S.; Iwasaki, W. An open and continuously updated fern tree of life. Front. Plant Sci. 2022, 13, 909768. [Google Scholar] [CrossRef]
  41. Testo, W.; Sundue, M. A 4000-species dataset provides new insight into the evolution of ferns. Mol. Phylogenet Evol. 2016, 105, 200–211. [Google Scholar] [CrossRef] [Green Version]
  42. Yu, Y.; Blair, C.; He, X.J. RASP 4: Ancestral State Reconstruction Tool for Multiple Genes and Characters. Mol. Biol. Evol. 2020, 37, 604–606. [Google Scholar] [CrossRef]
  43. Yu, Y.; Harris, A.J.; Blair, C.; He, X.J. RASP (Reconstruct Ancestral State in Phylogenies): A tool for historical biogeography. Mol. Biol. Evol. 2015, 87, 46–49. [Google Scholar] [CrossRef]
  44. Liu, X.; Fu, Y.X. Exploring population size changes using SNP frequency spectra. Nat Genet. 2015, 47, 555–559. [Google Scholar] [CrossRef] [Green Version]
  45. Liu, X.; Fu, Y.X. Stairway Plot 2: Demographic history inference with folded SNP frequency spectra. Genome Biol. 2020, 21, 280. [Google Scholar] [CrossRef]
  46. Cristofari, R.; Liu, X.; Bonadonna, F.; Cherel, Y.; Pistorius, P.; Maho, Y.L.; Raybaud, V.; Stenseth, N.C.; Bohec, C.L.; Trucchi, E. Climate-driven range shifts of the king penguin in a fragmented ecosystem. Nat. Clim. Change 2018, 8, 245–251. [Google Scholar] [CrossRef]
  47. Gitzendanner, M.A.; Soltis, P.S. Patterns of genetic variation in rare and widespread plant congeners. Am. J. Bot. 2000, 87, 783. [Google Scholar] [CrossRef] [PubMed]
  48. Sun, W.Y.; Shu, J.P.; Gu, Y.F.; Morigengaowa. Conservation genomics analysis revealed the endangered mechanism of Adiantum nelumboides. Biodivers. Sci. 2022, 30, 1–12. [Google Scholar] [CrossRef]
  49. Murray, G.G.R.; Soares, A.E.R.; Novak, B.J.; Schaefer, N.K.; Cahill, J.A.; Baker, A.J.; Demboski, J.R.; Doll, A.; Fonseca, R.R.D.; Fulton, T.L. Natural selection shaped the rise and fall of passenger pigeon genomic diversity. Science 2017, 358, 951–954. [Google Scholar] [CrossRef] [PubMed] [Green Version]
  50. Roelke, M.E.; Martenson, J.S.; O’Brien, S.J. The consequences of demographic reduction and genetic depletion in the endangered florida panther. Curr. Biol. 1993, 6, 340–350. [Google Scholar] [CrossRef]
  51. Willoughby, J.R.; Sundaram, M.; Wijayawardena, B.K.; Kimble, S.J.A.; Ji, Y.Z.; Fernandez, N.B.; Antonides, J.D.; Lamb, M.C.; Marra, N.J.; DeWoody, J.A. The reduction of genetic diversity in threatened vertebrates and new recommendations regarding iucn conservation rankings. Biol. Conserv. 2015, 191, 495–503. [Google Scholar] [CrossRef] [Green Version]
  52. Fan, H.; Hu, Y.; Wu, Q.; Nie, Y.G.; Yan, L.; Wei, F.W. Conservation genetics and genomics of threatened vertebrates in China. J. Genet. Genom. 2018, 11, 593–601. [Google Scholar] [CrossRef]
  53. Ehlers, E.; Krafft, T. The “Anthropocene”. Earth System Science in the Anthropocene; Springer: Berlin/Heidelberg, Germany, 2006; pp. 13–18. [Google Scholar]
  54. Su, H.; Ming, Q.Z.; Pan, B.T.; Gao, H.S.; Zhang, W.X.; Dong, M.; Shi, Z.T. Jinsha River Valley-Analysis and Discussion on Chronological Framework of Water System Development. J. Mt. Sci. 2013, 31, 685–692. [Google Scholar]
Figure 1. Analysis of Population Structure. Note: Aleuritopteris grevilleoides include QH (yellow), KM (green), SC (red), and TD (red); A. albofusca is ST (blue).
Plants 12 01579 g001
Figure 2. K value and PCA analysis of sampled populations: (A) The best grouping of K value; (B) The results of PCA analysis.
Plants 12 01579 g002
Figure 3. Divergence-time estimation and S-DIVA reconstruct historical biogeography: (A) Divergence-time estimation and S-DIVA reconstruct historical biogeography; (B) The node 14: The A. grevilleoides was probably widely distributed in the ABC area, and then a vicariance event occurred at A area; (C) The node 14: The original distribution area was C spread to D; (D) B vicariance occurred; (E) The node 12: a geographical separation (vicariance) between C and D has occurred. Note: The numbers inside the circle represent nodes; The terraces of dry-hot valley time node are references [28,29]; T1: The first terrace of the dry-hot valley; T2: The second terraces of the dry-hot valley; T3: The third terraces of the dry-hot valley.
Plants 12 01579 g003
Figure 4. Historical fluctuation of effective population size of A. grevilleoides. Note: Red line: median of 200 inferences based on subsampling. Dark gray lines: 75% confidence interval of the inference. Light gray lines: 95% confidence interval of the inference. DHV: The first terraces in the dry-hot Valley; LC: the historical drainage capture events between the Luquan Wudongde and Canyon-Jinpingzi.
Plants 12 01579 g004
Figure 5. Spatial distribution points in the wild population of Aleuritopteris grevilleoides.
Plants 12 01579 g005
Figure 6. Photographs of A. grevilleoides and A. albofusca phenotypes in the wild population: (A) QH group (A. grevilleoides, fern09010); (B) KM group (A. grevilleoides, fern09033); (C) TD group (A. grevilleoides, fern09025); (D) ST group (A. albofusca, fern09032).
Plants 12 01579 g006
Table 1. Calculation of Fst between groups of A. grevilleoides and A. albofusca.
QHSCTDKM
SC0.225
TD0.1880.031
KM0.2260.1420.116
ST0.6840.6210.5430.579
Table 2. Genetic diversity analysis of A. grevilleoides.
FIDPrivateObs_HetObs_HomExp_HetExp_HomPiFis
QH10160.1240.8760.1460.8540.1590.084
SC4390.1820.8180.2220.7780.2510.144
TD4610.2160.7840.2370.7630.2680.108
KM9950.1590.8410.1910.8090.2110.114
A. grevilleoides00.1660.8340.3220.6780.3330.452
Note: Private: Private alleles; Obs_Hom: Expected homozygous; Exp_Hom: Expected homozygous; Obs_Het: Observed heterozygous; Exp_Het: Expected heterozygous; Pi: Nucleotide diversity; Fis: inbreeding coefficient.
Table 3. Sample details of Aleuritopteris grevilleoides.
SpecieNo.Specimen CopyDateSiteAbbr
A. albofuscafern09030114 August 2019Qiaojia CountyST
A. albofuscafern09031114 August 2019Qiaojia CountyST
A. albofuscafern09032114 August 2019Qiaojia CountyST
A. grevilleoidesfern09005113 August 2019Qihei Highway of Dayao CountyQH
A. grevilleoidesfern09009113 August 2019Qihei Highway of Dayao CountyQH
A. grevilleoidesfern09010113 August 2019Qihei Highway of Dayao CountyQH
A. grevilleoidesfern09011113 August 2019Qihei Highway of Dayao CountyQH
A. grevilleoidesfern09012113 August 2019Qihei Highway of Dayao CountyQH
A. grevilleoidesfern09013113 August 2019Qihei Highway of Dayao CountyQH
A. grevilleoidesfern09014113 August 2019Qihei Highway of Dayao CountyQH
A. grevilleoidesfern09016113 August 2019SanCha River of Dayao CountySC
A. grevilleoidesfern09018113 August 2019SanCha River of Dayao CountySC
A. grevilleoidesfern09019113 August 2019SanCha River of Dayao CountySC
A. grevilleoidesfern09022113 August 2019SanCha River of Dayao CountySC
A. grevilleoidesfern09023113 August 2019SanCha River of Dayao CountySC
A. grevilleoidesfern09024113 August 2019Tademe Bridge of Dayao CountyTD
A. grevilleoidesfern09025113 August 2019Tademe Bridge of Dayao CountyTD
A. grevilleoidesfern09026113 August 2019Tademe Bridge of Dayao CountyTD
A. grevilleoidesfern09027113 August 2019Tademe Bridge of Dayao CountyTD
A. grevilleoidesfern09028113 August 2019Tademe Bridge of Dayao CountyTD
A. grevilleoidesfern09033117 August 2019Luquan County of KunMing CityKM
A. grevilleoidesfern09035117 August 2019Luquan County of KunMing CityKM
A. grevilleoidesfern09037117 August 2019Luquan County of KunMing CityKM
A. grevilleoidesfern09038117 August 2019Luquan County of KunMing CityKM
A. grevilleoidesfern09039117 August 2019Luquan County of KunMing CityKM
A. grevilleoidesfern09043117 August 2019Luquan County of KunMing CityKM
Disclaimer/Publisher’s Note: The statements, opinions and data contained in all publications are solely those of the individual author(s) and contributor(s) and not of MDPI and/or the editor(s). MDPI and/or the editor(s) disclaim responsibility for any injury to people or property resulting from any ideas, methods, instructions or products referred to in the content.

