Article

The Contribution of Epigenetics to Evolutionary Adaptation in Zingiber kawagoii Hayata (Zingiberaceae) Endemic to Taiwan

1
School of Life Science, National Taiwan Normal University, 88 Tingchow Road, Section 4, Taipei 11677, Taiwan
2
Department of Life Science, Tunghai University, 1727 Taiwan Boulevard, Section 4, Taichung 40704, Taiwan
*
Author to whom correspondence should be addressed.
Plants 2023, 12(7), 1558; https://doi.org/10.3390/plants12071558
Submission received: 26 February 2023 / Revised: 3 April 2023 / Accepted: 3 April 2023 / Published: 4 April 2023
(This article belongs to the Special Issue Epigenetics and Genome Evolution in Plants)

Abstract

:
We epigenotyped 211 individuals from 17 Zingiber kawagoii populations using methylation-sensitive amplification polymorphism (MSAP) and investigated the associations of methylated (mMSAP) and unmethylated (uMSAP) loci with 16 environmental variables. Data regarding genetic variation based on amplified fragment length polymorphism (AFLP) were obtained from an earlier study. We found a significant positive correlation between genetic and epigenetic variation. Significantly higher mean mMSAP and uMSAP uHE (unbiased expected heterozygosity: 0.223 and 0.131, respectively, p < 0.001) per locus than that estimated based on AFLP (uHE = 0.104) were found. Genome scans detected 10 mMSAP and 9 uMSAP FST outliers associated with various environmental variables. A significant linear fit for 11 and 12 environmental variables with outlier mMSAP and uMSAP ordination, respectively, generated using full model redundancy analysis (RDA) was found. When conditioned on geography, partial RDA revealed that five and six environmental variables, respectively, were the most important variables influencing outlier mMSAP and uMSAP variation. We found higher genetic (average FST = 0.298) than epigenetic (mMSAP and uMSAP average FST = 0.044 and 0.106, respectively) differentiation and higher genetic isolation-by-distance (IBD) than epigenetic IBD. Strong epigenetic isolation-by-environment (IBE) was found, particularly based on the outlier data, controlling either for geography (mMSAP and uMSAP βE = 0.128 and 0.132, respectively, p = 0.001) or for genetic structure (mMSAP and uMSAP βE = 0.105 and 0.136, respectively, p = 0.001). Our results suggest that epigenetic variants can be substrates for natural selection linked to environmental variables and complement genetic changes in the adaptive evolution of Z. kawagoii populations.

1. Introduction

Adaptation to changing environments is a fundamental process for the survival of populations and species, especially during fast-paced environmental changes [1,2,3,4]. Epigenetics, which can occur without alterations in DNA sequences, is an important mechanism influencing population processes [5]. Over the ecological and evolutionary time scales of range redistribution, mutation and recombination would rarely provide sufficient sources of variation [6]. Epigenetic modifications have been suggested to respond to the environment before genetic changes begin to accumulate [7]. Phenotypic plasticity may arise as a result of epigenetic switches to deal with fluctuating environments [8], which may buy time for populations in the initial stages of adaptation [9,10]. Epigenetic modifications can generate heritable phenotypic variation in relation to adaptive evolution [11,12]. Population adaptive divergence in association with environmental gradients cannot be explained solely by DNA sequence variation [6]. Stable heritable epialleles may have significant evolutionary roles and are ecologically relevant in natural populations [13,14,15,16].
Epigenetic variation can be classified into (1) obligatory dependence of epigenetic variation on genetic variation, (2) facilitated epigenetic variation represents partial independence of epigenetic variation from genetic variation, and (3) pure epigenetic variation characterizes complete independence of epigenetic variation from genetic variation [17]. In natural plant populations, epigenetic variation can influence evolutionary processes in ways that are not related to sequence variation when epigenetic variation has arisen independently of genetic variation [6,17]. However, epigenetic variation may be the direct or indirect consequence of upstream genetic changes [6,16,17,18]. Epigenetic variation, provoked by DNA methylation and demethylation, is an additional system compensating for adaptive genetic divergence [7,9,10]. Gene flow between populations may be reduced due to isolation-by-distance (IBD) [19]. IBD is the process by which geographically restricted gene flow generates a genetic structure indicating a positive correlation between genetic differentiation and geographic distance. The spatial genetic and epigenetic structure may differ, causing the difference between genetic and epigenetic IBD [20]. Additionally, ecological factors in divergent environments may lead to the selection-driven divergence that decreases gene flow between populations, creating a pattern of isolation-by-environment (IBE) [21,22].
In an earlier study, using data on amplified fragment length polymorphism (AFLP), a latitudinal pattern of environmentally dependent adaptive genetic divergence was found to be highly correlated with the annual temperature range in Z. kawagoii [23]. It is probable that the latitudinal northerly range expansion of Z. kawagoii [24] may have been related to the latitudinal pattern of adaptive divergence in Z. kawagoii [23]. Additionally, the lack of genetic variation in Z. kawagoii [23] may result in genetic as well as migration load [25,26]. Studies have demonstrated local adaptation linked to epigenetic variation and closely associated with environmental gradients in a variety of natural systems [27,28,29,30,31,32,33,34]. Therefore, the investigation of epigenetic variation in association with specific environmental variables is important. Epigenetic variation may play a role in compensation for the lack of genetic variation [7,9,10]. Testing for the association between epigenetic variation and environmental factors within a species’ distribution range is important to identify environmental variables that may act as ecological drivers shaping the spatial epigenetic structuring of natural plant populations [6,16,27,30,31,32,33,34]. The association between epigenetic variation and the environment may be related to alteration in the methylation status of different genes, resulting in local adaptation related to fitness-related traits [28,34,35,36].
Epigenetic variation can be quantified with methylation-sensitive amplification polymorphism (MSAP) [37] that reflects a modification in cytosine methylation states [6,27,36]. In the present study, we surveyed the epigenetic variation in 211 individuals from 17 populations using MSAP to test the role that the environment plays in shaping adaptive epigenetic variation in Z. kawagoii. Epigenetic variation in association with environmental gradients can be important for plant adaptations to various environments apart from adaptive genetic divergence [5,6,7,9,10,11,12,13,14,15,16]. In addition to previous studies [13,14,15,16,27,28,29,30,31,32,33,34], the present study can provide additional empirical evidence for adaptive epigenetic divergence in natural plant populations. We aimed to answer questions related to spatial epigenetic structuring and environmentally dependent adaptive epigenetic divergence in Z. kawagoii. First, we explored the inter-population correlation between epigenetic distance and genetic distance using the Mantel test. Second, we intended to understand the level of population epigenetic diversity and epigenetic structure relative to the level of genetic diversity and genetic structure. Third, we assessed the correlations between all MSAP loci and environmental variables using a latent factor mixed model (LFMM) [38] and Samβada [39]. Fourth, FST outliers were detected using genome scan methods including BAYESCAN [40] and DFDIST [41]. Fifth, FST outliers identified using both BAYESCAN and DFDIST were further examined for their correlations with environmental variables using a Bayesian logistic regression approach [42]. Sixth, we assessed the linear fit of environmental variables with the ordination axes derived from a redundancy analysis (RDA) on the outlier epigenetic variation [43]. Subsequently, the environmental variables that showed a significant linear fit to the RDA ordinations were used in a partial RDA (pRDA) to examine the correlation between the environmental variables and pRDA axes conditioned on geographic effect. Lastly, we tested whether epigenetic IBE is present when controlling for either the geographic or genetic effect. The main objectives of the present study were to (1) assess the inter-population relationship between genetic and epigenetic variation in natural populations of Z. kawagoii, (2) understand how environmental variables influence population evolutionary epigenetic divergence and local adaptation, and (3) investigate if there is an environmentally dependent epigenetic divergence when controlling for the presence of any genetic structure.

2. Materials and Methods

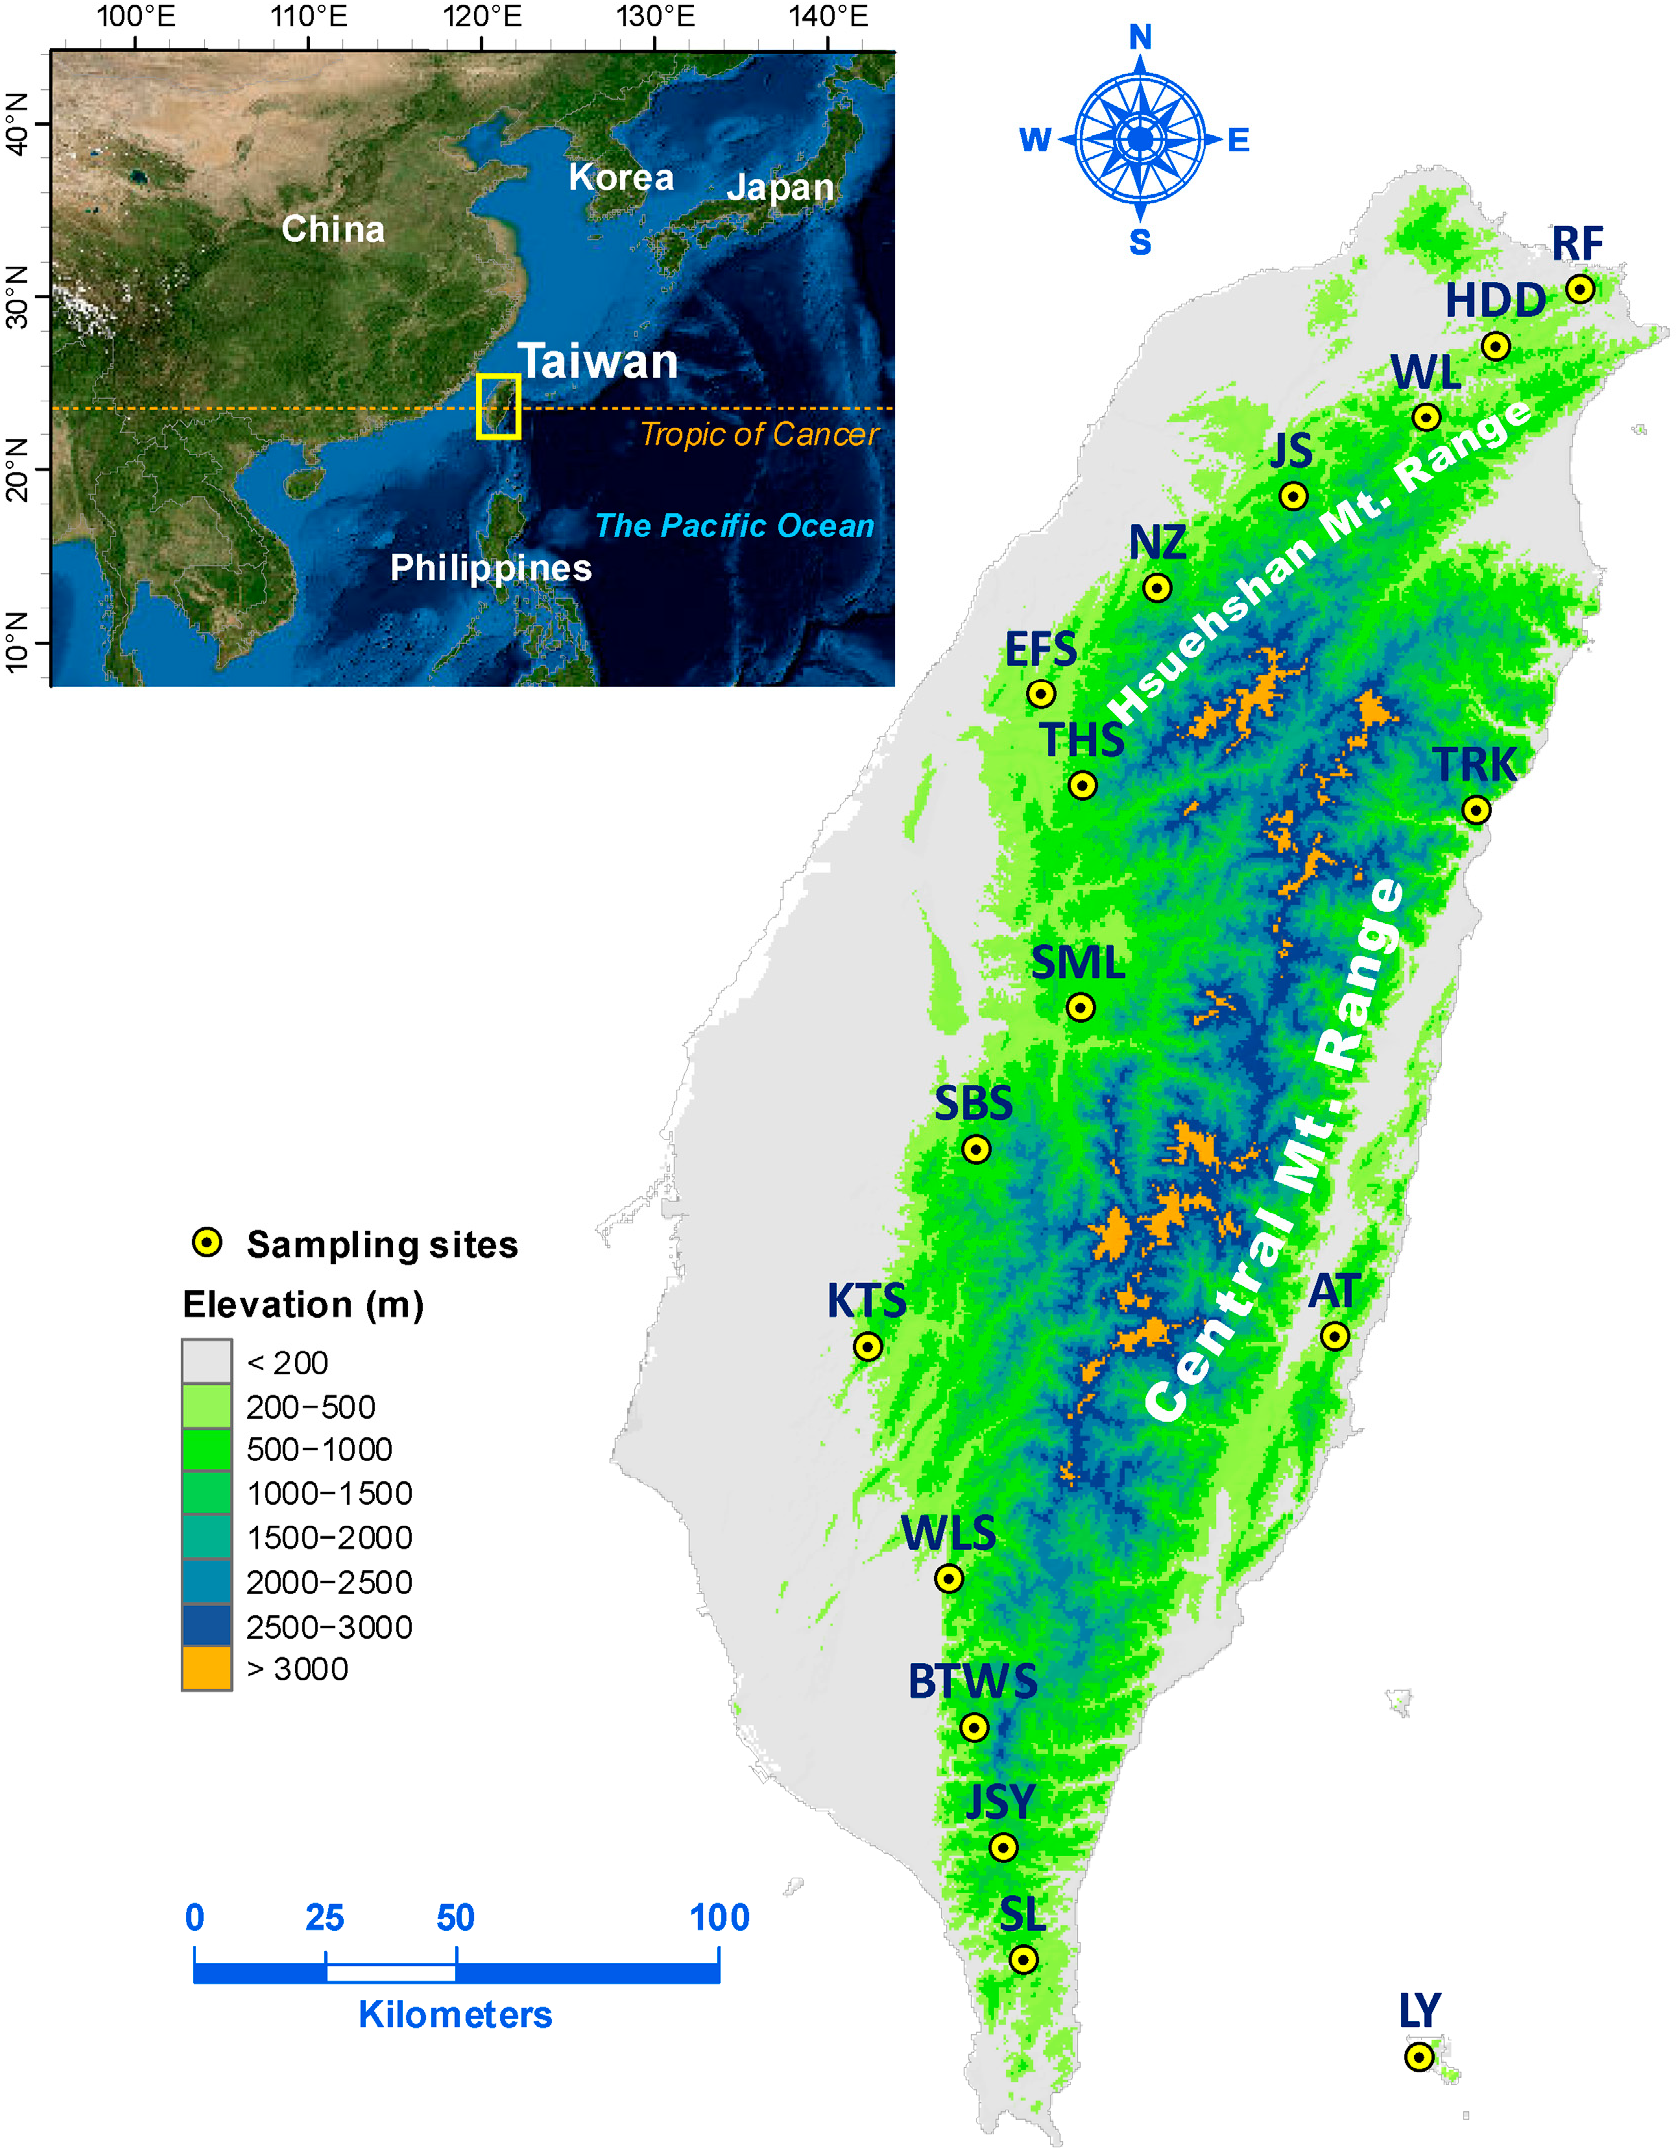
2.1. Sample Collection and Epigenotyping

This study used the same 17 populations of Z. kawagoii examined in an earlier investigation [23] (Figure 1). Genomic DNA was extracted from silica gel dried leaf samples using a cetyltrimethyl ammonium bromide (CTAB) procedure [44], and ethanol-precipitated DNA was dissolved in 200 µL TE buffer (pH 8.0). The 211 plants used in this study included all but one individual from the TRK population used in the earlier AFLP investigation [23] due to a technical problem. A NanoDrop spectrophotometer (NanoDrop Technology, Wilmington, DE, USA) was used to quantify total genomic DNA. In brief, total genomic DNA (200 ng) was digested with the methylation-sensitive enzymes HpaII (1 U) and MspI (1 U) as frequent cutters separately with rare cutter EcoRI (1 U). Restriction digestion was performed in a total 10 µL reaction volume with 10X CutSmart buffer (New England Biolabs, Ipswich, MA, USA) for 1.5 h at 37 °C and then deactivated at 65 °C for 15 min. Restricted DNA products were ligated to MSAP adaptors (5 µM) with 5 U T4 DNA ligase (Thermo Scientific, Vilnius, Lithuania) and 5X ligation buffer (Thermo Scientific) at 22 °C for 1 h in a 10 µL ligation reaction mixture.
Pre-selective amplification was performed using a polymerase chain reaction (PCR). Adaptor ligated product (1∶9 dilution with ddH2O) was mixed with 12 µM EcoRI primer (E00, Table S1), 12 µM HpaII-MspI primer (HM00, Table S1), 2.5 mM dNTPs, 1 U Taq DNA polymerase (Zymeset Biotech, Taipei, Taiwan), and 10X PCR buffer (Zymeset) in a 20 µL total volume. Pre-selective amplification was performed with an initial holding at 72 °C for 2 min and pre-denaturation at 94 °C for 3 min, followed by 25 cycles of 30 s at 94 °C, 30 s at 56 °C, and 1 min at 72 °C, with a final 5 min holding at 72 °C. Nine primer pair combinations with additional selective bases added at the ends of E00 and HM00 were used for selective amplification (Table S1). Fluorescent-dye-labeled 10 µM EcoRI selective primer was mixed with 10 µM HpaII-MspI primer, 2.5 mM dNTPs, 2 U Taq DNA polymerase (Zymeset), 10X PCR buffer (Zymeset), and diluted pre-selective amplified products (1∶19 dilution with ddH2O) in a 20 µL total volume. Subsequently, selective PCR was performed with an initial holding at 94 °C for 3 min, followed by 13 cycles of 30 s at 94 °C, 30 s at 65–56 °C (decreasing the temperature by 0.7 °C each cycle), 1 min at 72 °C, and then 23 cycles of 30 s at 94 °C, 30 s at 56 °C, and 1 min at 72 °C, with a final 5 min holding at 72 °C. Selective amplification products were electrophoresed with an ABI 3730XL DNA analyzer (Applied Biosystem, Foster City, CA, USA).
We scored amplification fragments in the range of 150–500 bp, setting a fluorescent threshold of 150 units using Peak Scanner v.1.0 (Applied Biosystem). Low peak fragments and those scored higher than 99% or less than 1% of individuals were removed. Additionally, fragments within one nucleotide in a ± 0.8 base pair window were recognized as the same fragment. To determine the DNA methylation status of every locus, the “mixed scoring 1” transformation scheme in the R function MSAP-calc [45] in the R environment [46] was applied to obtain mMSAP (methylated) and uMSAP (unmethylated) datasets. Three randomly chosen samples in each population for each primer combination were used to assess the epigenotyping error rate. The error rate for EcoRI-MspI (eMspI), EcoRI-HpaII (eHpaII), and a combined error rate (eMspI + eHpaII − 2eMspIeHpaII) for each primer combination was calculated [27]. We removed loci with an error rate per locus greater than 5% [47]. The mean error rate was 2.15 and 2.12%, respectively, for eMspI and eHpaII, with a combined error rate of 4.18% (Table S1).

2.2. Environmental Variables

Sixteen environmental variables were included in this study [23]. These variables were annual temperate range (BIO7), mean temperature in the driest quarter (BIO9), annual precipitation (BIO12), precipitation in the coldest quarter (BIO19), aspect, elevation, slope, cloud cover (CLO), enhanced vegetation index (EVI), leaf area index (LAI), normalized difference vegetation index (NDVI), annual moisture index (MI), annual total potential evapotranspiration (PET), relative humidity (RH), soil pH, and mean wind speed (WSmean) (Table S2).

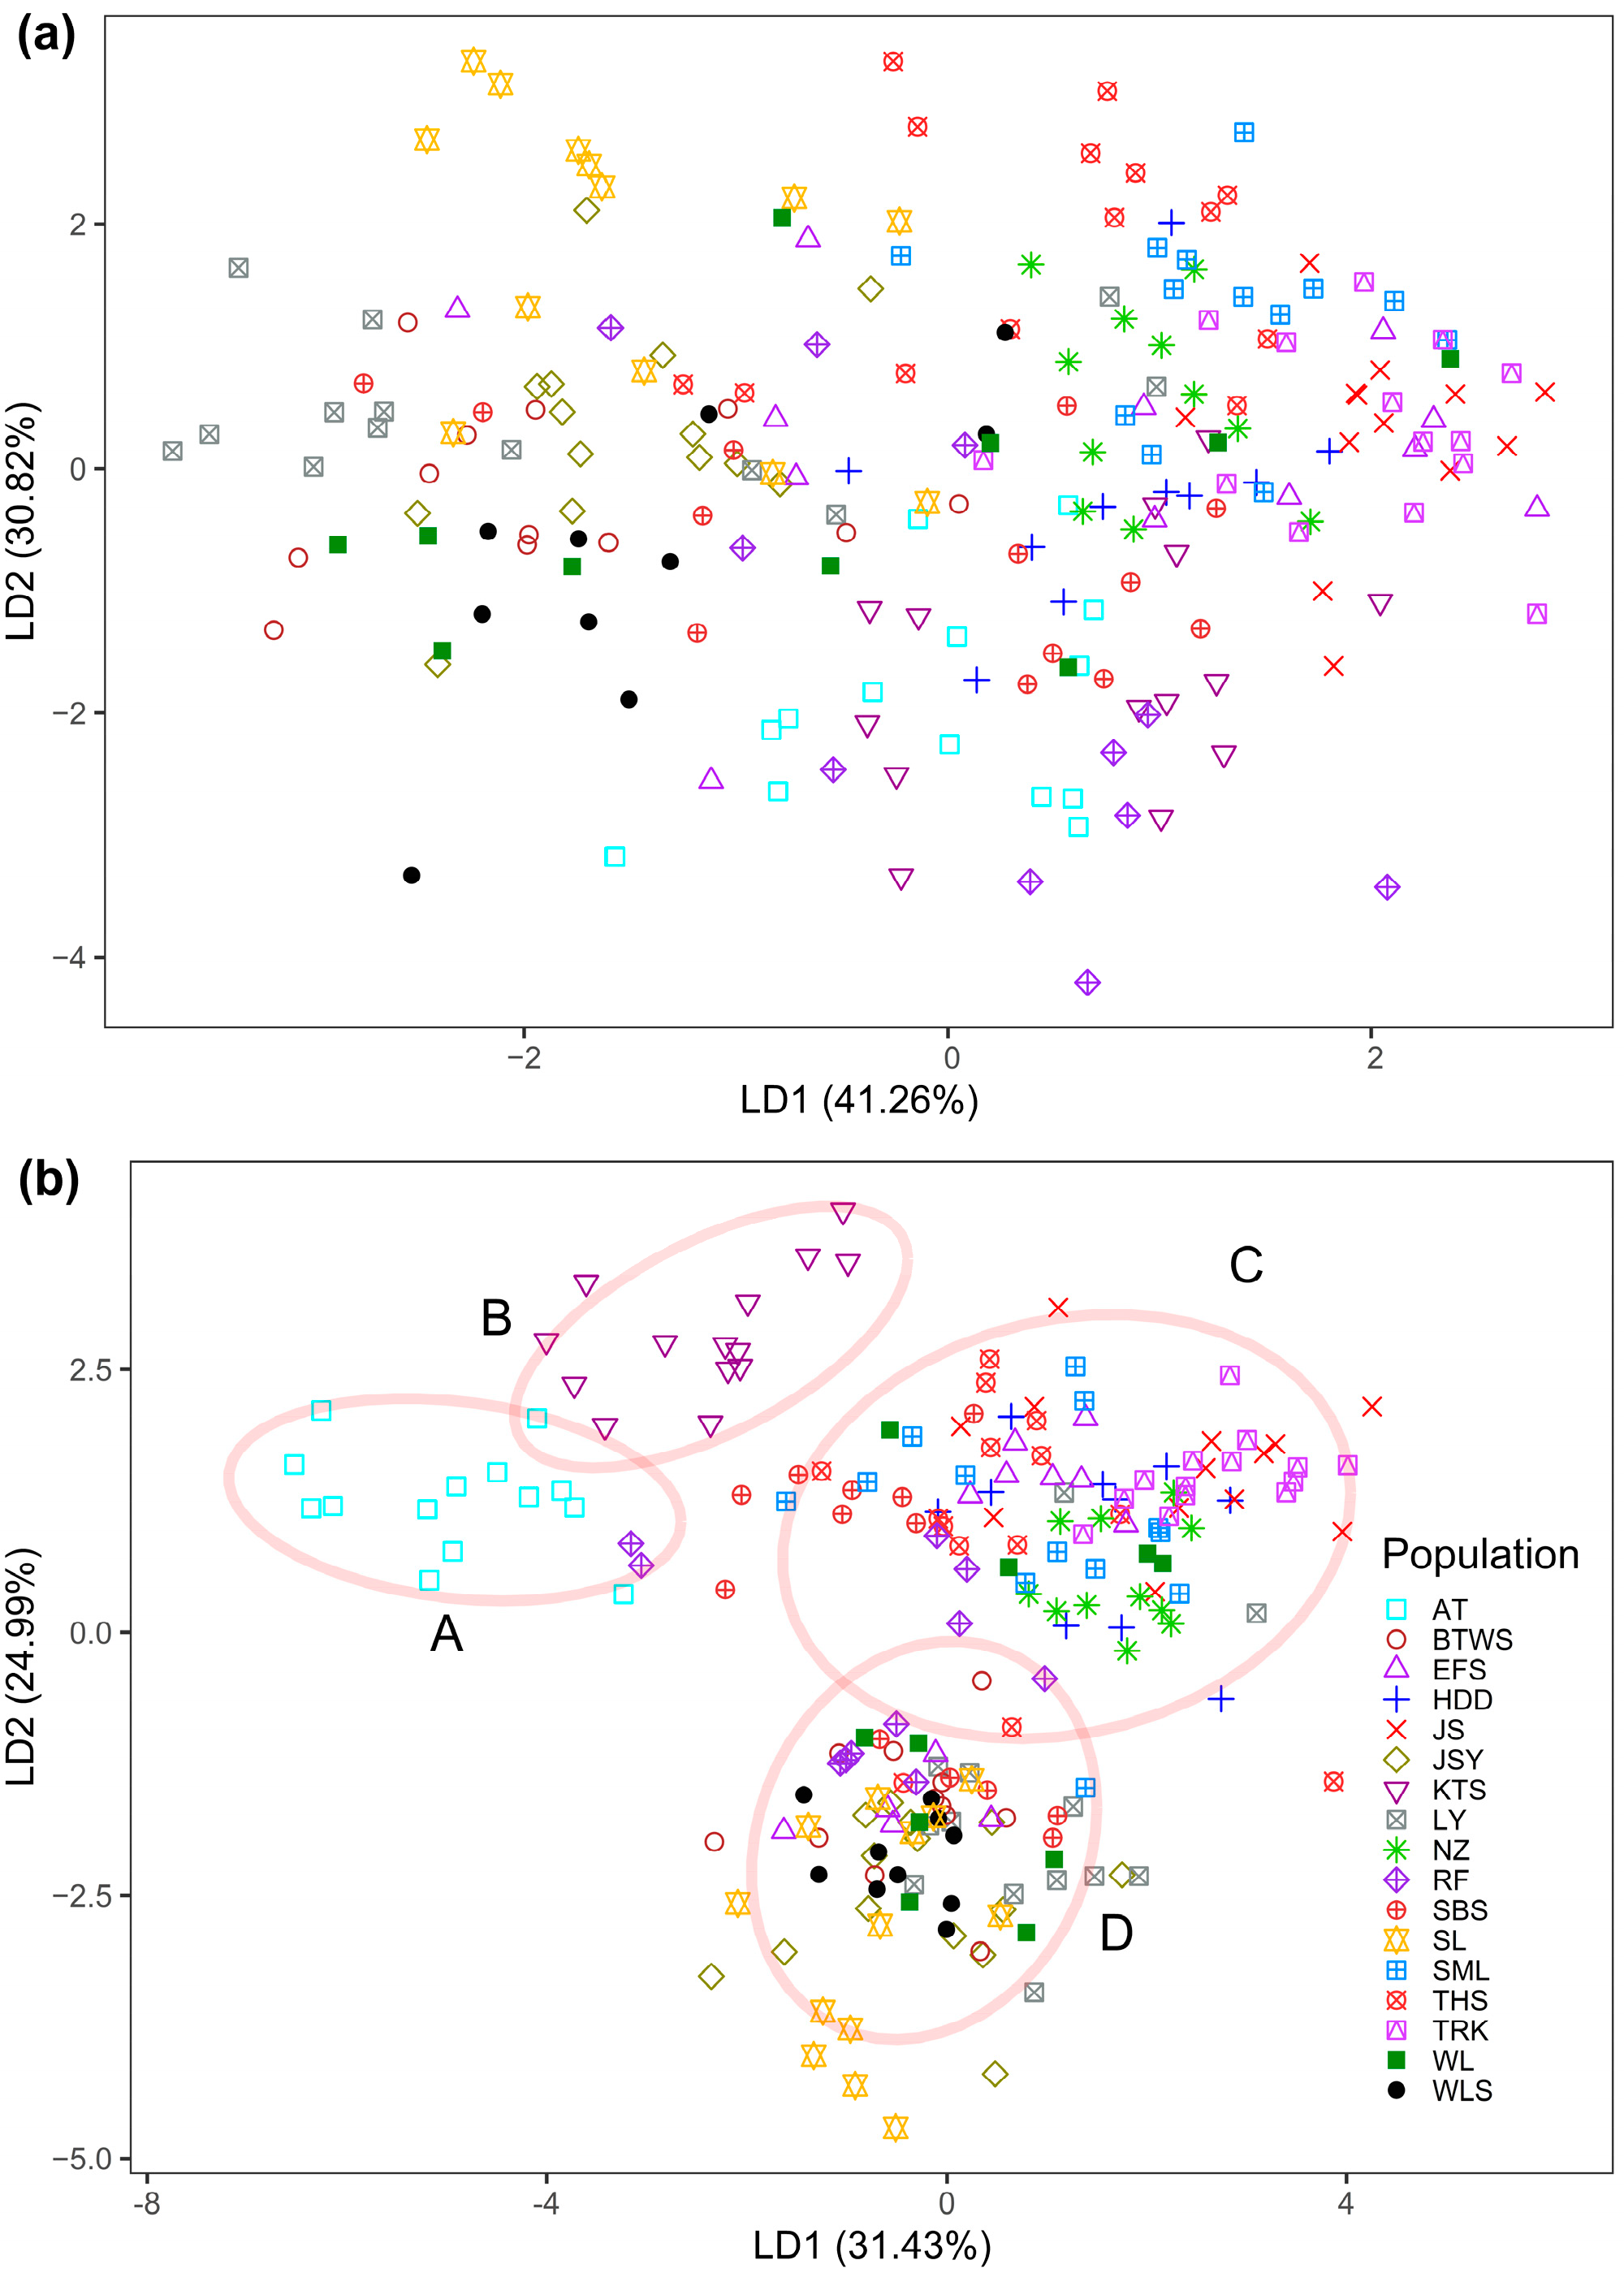
2.3. Epigenetic Diversity, Differentiation, and Clustering

The software AFLP-SURV v.1.0 [48] was used to estimate population unbiased expected heterozygosity (uHE) [49] and the percentage of polymorphic loci (PPL) based on allele frequencies using the settings of the Hardy–Weinberg equilibrium and a non-uniform prior distribution. Per locus uHE was estimated using ARLEQUIN v.6.0 [50]. A linear mixed effect model (LMM) was used to estimate the difference in mean uHE per locus between three types of markers (AFLP, mMSAP, and uMSAP). AFLP data were obtained from an earlier study [23]. In LMM, the marker type and population were used as a fixed factor and a random factor, respectively, and analyzed using the lmer function in the R package lme4 [51]. Significance was tested using the Anova function in the R package car based on type II Wald χ2 statistic [52]. Tukey’s post hoc pairwise comparisons of mean uHE per locus between marker types were assessed using the lsmeans function in the R package emmeans [53]. Additionally, a paired t-test was used to assess the differences in mean uHE between the three marker types at the population level. Population genetic (AFLP) and epigenetic (mMSAP and uMSAP) distance matrices were calculated using Nei’s genetic distance [54] using the nei.dist function in the R package poppr [55]. Mantel correlations for the inter-population relationship between genetic and epigenetic variation, based on these distance matrices, were assessed using the mantel function in the R package vegan [56]. A partial Mantel test, performed using the mantel.partial function in the R package vegan, was also used to assess the inter-population relationship between genetic and epigenetic variation controlling for the geographic effect. The geographic effect was computed using the coordinates of the sample sites.
Analysis of molecular variance (AMOVA) was used to estimate the level of genetic differentiation between populations (ΦST) using the poppr.amova function in the R package poppr. Significance was tested using the randtest function in the R package ade4 [57] with 9999 permutations. Pairwise population FST was computed using ARLEQUIN, and significance was tested with 10,000 permutations. Pairwise population FST values were used to calculate the level of divergence for each population from the remaining populations as the mean value of pairwise FST for each population against the rest of the populations (denoted as the population mean FST). Epigenetic homogeneous groups of individuals were assessed using discriminant analysis of principal components (DAPC) [58]. The find.clusters and dapc functions in the R package adegenet [59] were used in DAPC analysis setting K = 1–10. The Bayesian information criterion (BIC) in DAPC was estimated to determine the optimal number of clusters.

2.4. Test for FST Outliers

To detect signatures in selection on MSAP loci, FST outliers were identified using BAYESCAN and DFDIST. BAYESCAN v.2.1 [40] was used to estimate the ratio of posterior probabilities of selection over neutrality (the posterior odds (PO), log10(PO)). Two hundred pilot runs of 50,000 iterations followed by a sample size of 50,000 with a thinning interval of 20 among 106 iterations were performed in BAYESCAN. A logarithmic scale of log10(PO) > 1 was used as strong evidence (posterior probability > 0.91) for selection over neutrality for a locus under directional selection [60]. DFDIST estimates a distribution of observed FST versus uHE, and loci under selection were identified by comparing them to a simulated neutral distribution. In DFDIST, we set critical frequency = 0.99, Zhivotovsky parameter = 0.25, trimmed mean FST = 0.3 (excluding 30% of highest and 30% of lowest FST values), smoothing proportion = 0.04, 500,000 resamplings, and critical p = 0.05. MSAP loci with observed FST against uHE falling above the 95% confidence level of the simulated distribution were recognized as FST outliers under directional selection.

2.5. Test for Associations between Epigenetic Loci and Environmental Variables

The associations between all epigenetic loci and environmental variables were estimated using LFMM and Samβada. In LFMM, we considered population epigenetic structure as a random factor using a latent factor of 1 and 4, respectively, according to the DAPC results (see Results) for mMSAP and uMSAP. Matrices of mMSAP and uMSAP variation were used as fixed factors. Ten LFMM runs with 10,000 iterations of the Gibbs sampling algorithm and a burn-in period of 5000 cycles were performed for each environmental predictor. Z-scores for each environmental predictor were obtained by combining the results of ten independent LFMM runs, and p-values were adjusted using the genomic inflation factor [38]. Moreover, a 1% false discovery rate (FDR) was used to adjust the p-value using the qvalue function in the R package qvalue [61]. A multiple univariate logistic regression approach in Samβada was used to assess the correlations between the allele frequencies of mMSAP and uMSAP loci and the values of the environmental variables. Both Wald and G scores [39] were used, applying a 1% FDR for the p-value adjustment, to assess the fit of the model with environmental variables against the null model without environmental variables.
Moreover, a Bayesian logistic regression analysis, implemented with the stan_glm function in the R package rstanarm [42], was used to further justify the associations between environmental variables and the potential FST outliers that were identified with both BAYESCAN and DFDIST. The weakly informative priors following a student’s t distribution with mean zero and seven degrees of freedom were used in stan_glm, and the scale of the prior distribution was 10 for the intercept and 2.5 for the predictors. We ran all the stan_glm models using 4 chains, each containing 2000 warm-up and 2000 sampling steps, and a 95% credible interval was determined using the posterior_interval function in the R package rstanarm. In the stan_glm analysis, we obtained values for the effective sample size and convergence diagnostic statistic representing good priors applied and stable estimates obtained for each predictor.

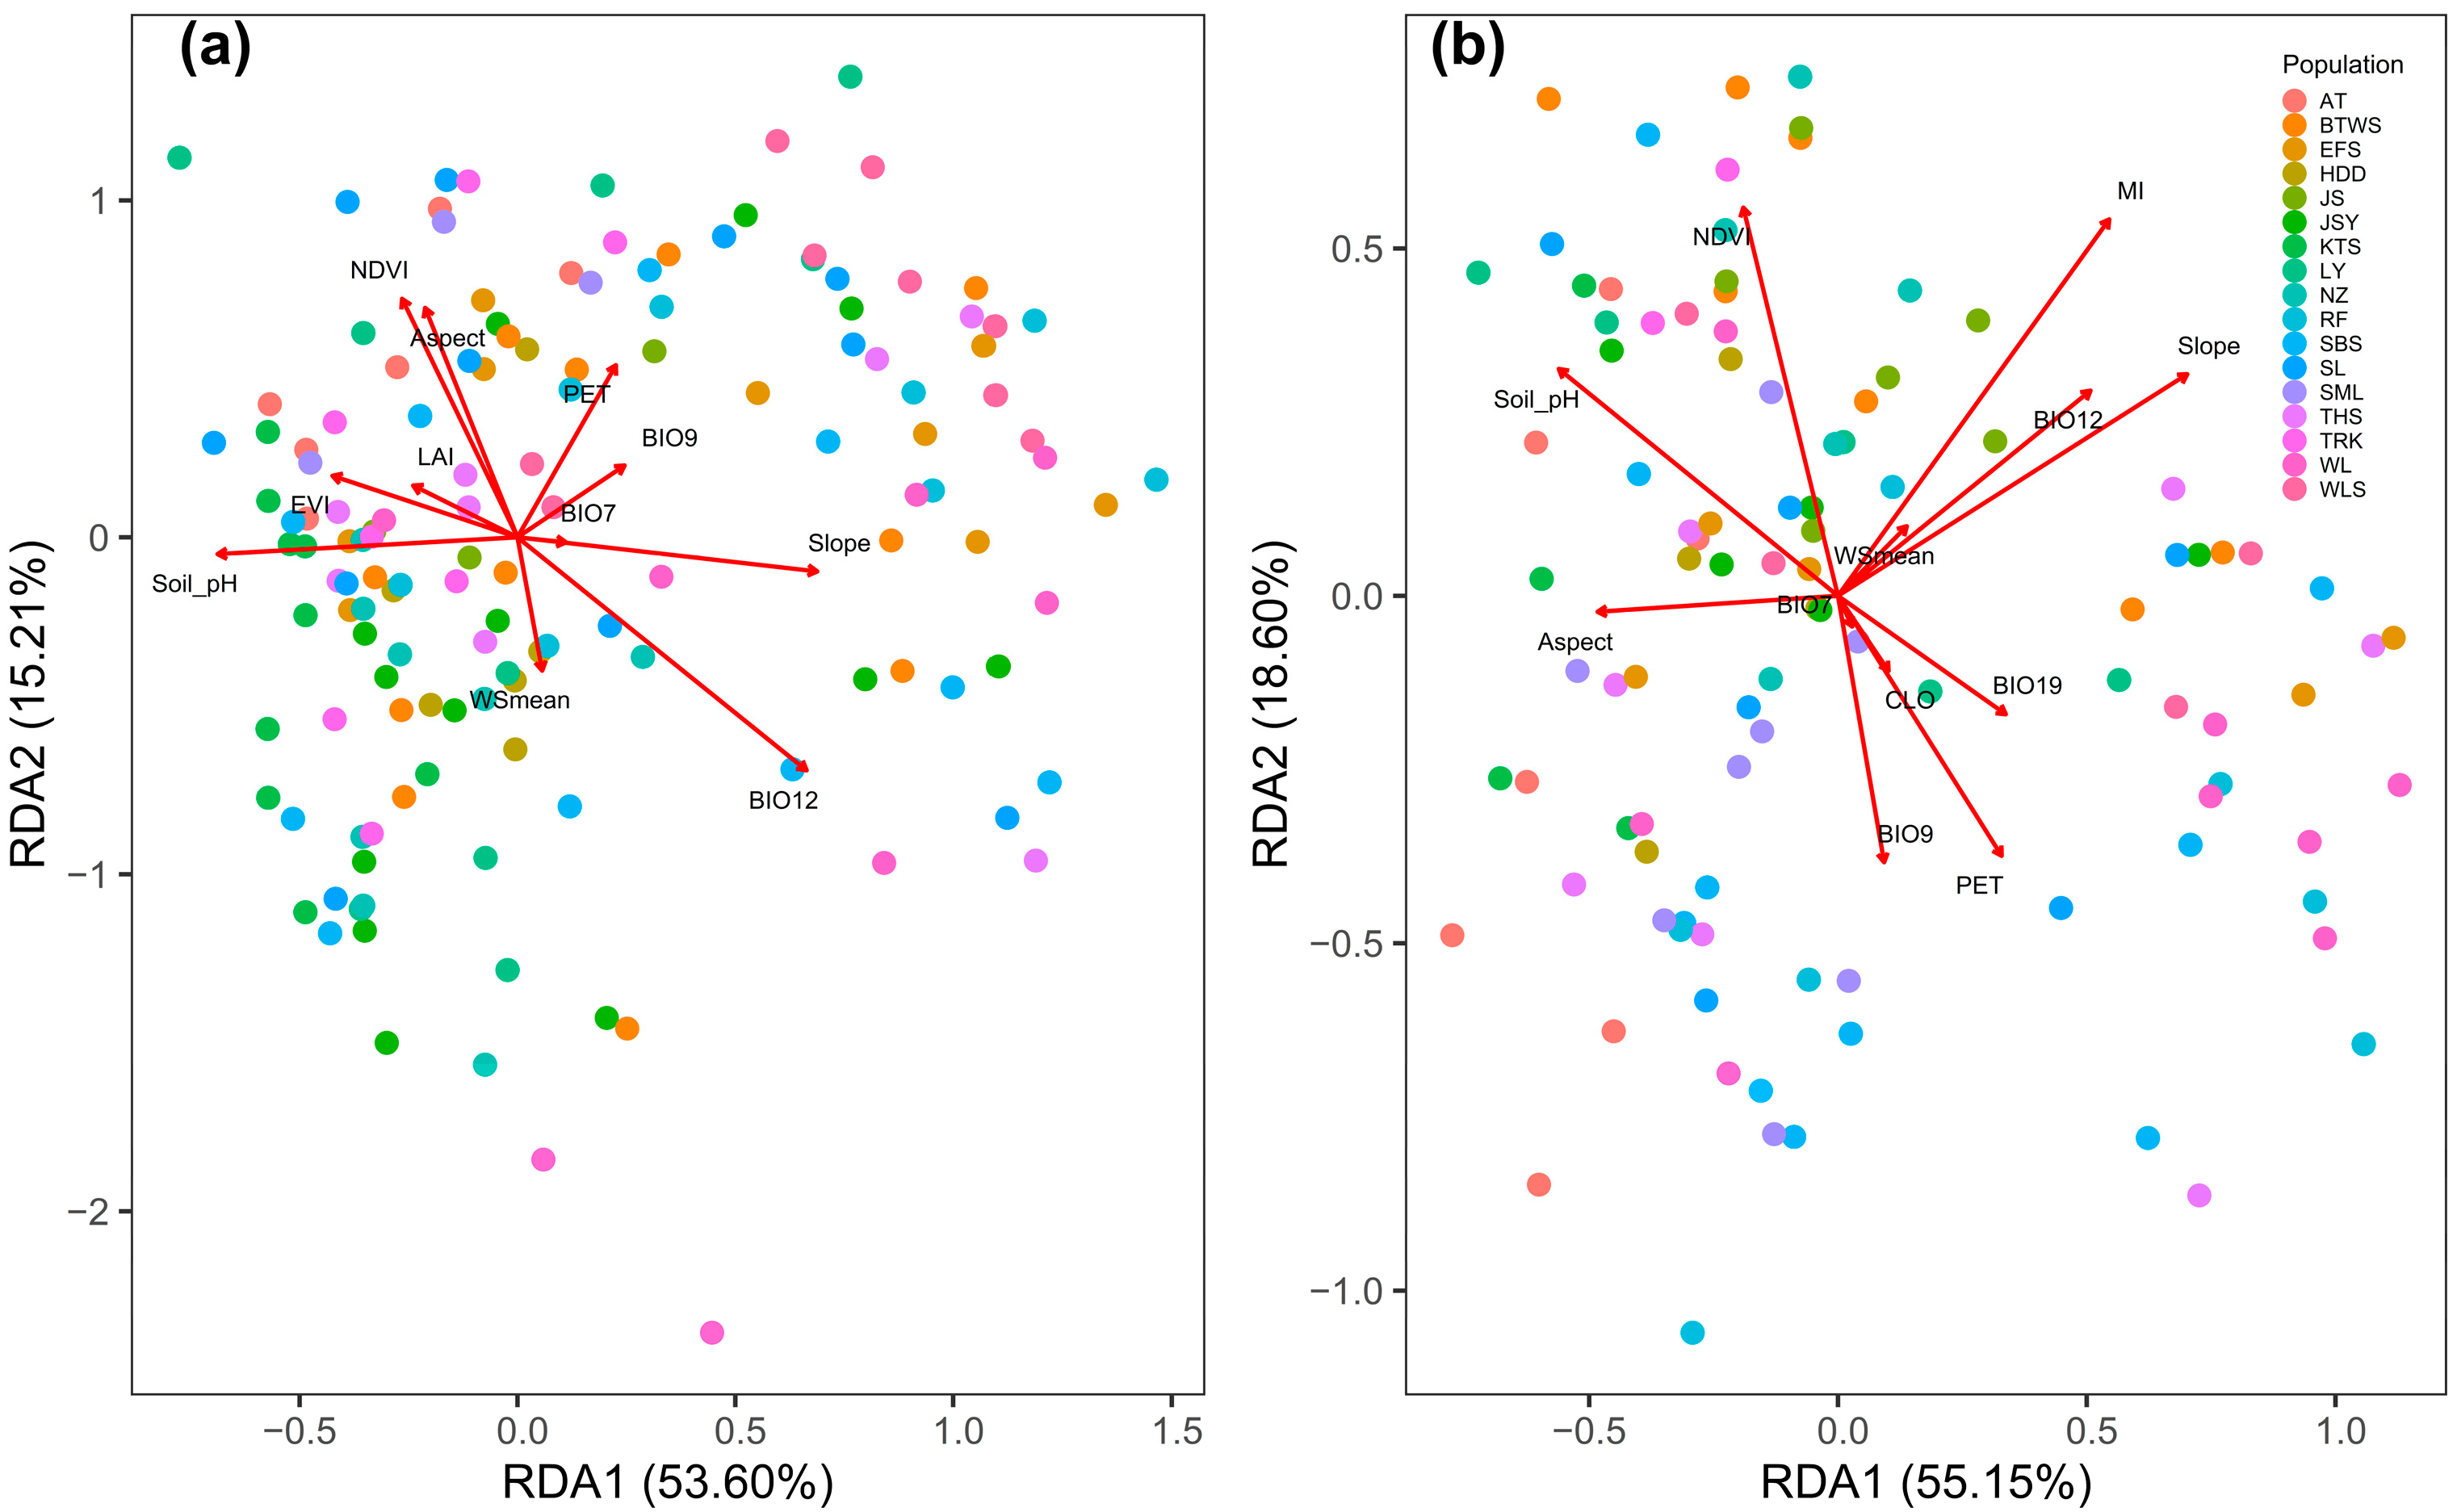
2.6. Linear Relationships between Environmental Variables and the Ordination Axes of the Redundancy Analysis

A multivariate approach in an RDA analysis [43] was used to estimate the extent to which outlier variation was explained by the environmental variables. We explored the relationships between epigenetic variation and environmental drivers by fitting variables onto ordinations using the envfit function in the R vegan package. In the envfit analysis, a full RDA model was used to estimate the independent effect of the environment (16 environmental variables) fitting to the amount of outlier variation with 999 permutations and represented by the squared correlation coefficients (R2). All p-values were adjusted for multiple comparisons using 5% FDR. Environmental variables with significant fit to the outlier epigenetic variation were then used in a pRDA analysis. pRDA was analyzed in order to assess the correlations between environmental variables and the first two axes conditioned on the geographic effect. Significance of the pRDA ordination axes was assessed using the anova.cca function in the R package vegan with 999 permutations. The arrows pointed in the direction of maximum variation in the value of environmental variables, and the degree to which the variables correlated with pRDA axes was represented by the length of the arrows.

2.7. Epigenetic Isolation-by-Environment Controlling for Geographic or Genetic Effects

The Mantel function in the R package vegan (999 permutations) was used to test IBD based on the genetic and epigenetic distance matrices against the geographic distance matrix calculated using the dist function in R. To test IBE, Mantel and partial Mantel tests (controlling for the geographic effect) were used to assess the relationship between the epigenetic and environmental distance matrices, respectively, using the mantel and mantel.partial functions implemented in the R package vegan. IBD and IBE were also performed using the MMRR (multiple matrix regression with randomization) function in R [21]. In addition, IBE was also tested for epigenetic distance matrices against the environmental distance matrix controlling for genetic effect (AFLP) using the partial Mantel test and MMRR. This was performed to test if environmental variables influence epigenetic variation independent of the genetic effect (isolation-by-genetic structure, IBG). In MMRR, regression coefficients for IBD (βD), IBG (βG), and IBE (βE) were obtained, and the significance was determined after 999 permutations.

3. Results

3.1. Epigenetic Diversity and Structure

Overall, 9 primer pairs resolved a total of 481 unambiguous bands ranging from 22 to 107 (Table S1), and the number of loci estimated using the R MSAP-calc script [45] were 424 and 354, respectively, for mMSAP and uMSAP. The average PPL was 58.8% in mMSAP and 33.6% in uMSAP. The average uHE was 0.160 in mMSAP and 0.119 in uMSAP (Table 1). The LMM analysis showed a significant difference in mean uHE per locus among the three types of markers (AFLP, mMSAP, and uMSAP; χ2 = 2002.8, p < 0.0001). Pairwise comparisons between marker types revealed that the mean uHE per locus was significantly smaller in AFLP (mean uHE per locus = 0.104) compared to mMSAP (mean uHE per locus = 0.223) and uMSAP (mean uHE per locus = 0.131) (Table S3). At the population level, genetic uHE was not significantly different from uMSAP epigenetic uHE (paired t-test: t16 = 0.796, p = 0.438), but it was significantly lower compared to mMSAP epigenetic uHE (paired t-test, t16 = −7.426, p < 0.0001). mMSAP uHE was significantly higher compared to uMSAP uHE (paired t-test, t16 = 8.007, p < 0.0001).
The overall values of FST based on all loci were 0.044 and 0.106, respectively, for mMSAP and uMSAP (Table S4). The AMOVA showed an overall population differentiation (ΦST) of 0.071 and 0.181, respectively, for mMSAP and uMSAP based on the total data (Table 2). The average FST values computed were 0.044 and 0.106, respectively, for the total mMSAP and uMSAP variation (Table S4). Using the total data, the lowest BIC was found at K = 2 and K = 6, respectively, for mMSAP and uMSAP in DAPC (Figure S1). No distinct mMSAP population clustering was found (Figure 2a), but four uMSAP population clusters were revealed (Figure 2b). However, individuals in the same population may be grouped in different uMSAP clusters. Unlike AFLP [23], the annual temperature range and latitude showed no significant relationship with the mMSAP population mean FST (Pearson’s r = −0.173, p = 0.507 and Pearson’s r = 0.031, p = 0.904, respectively) or with the uMSAP population mean FST (Pearson’s r = −0.046, p = 0.860 and Pearson’s r = −0.020, p = 0.938, respectively).

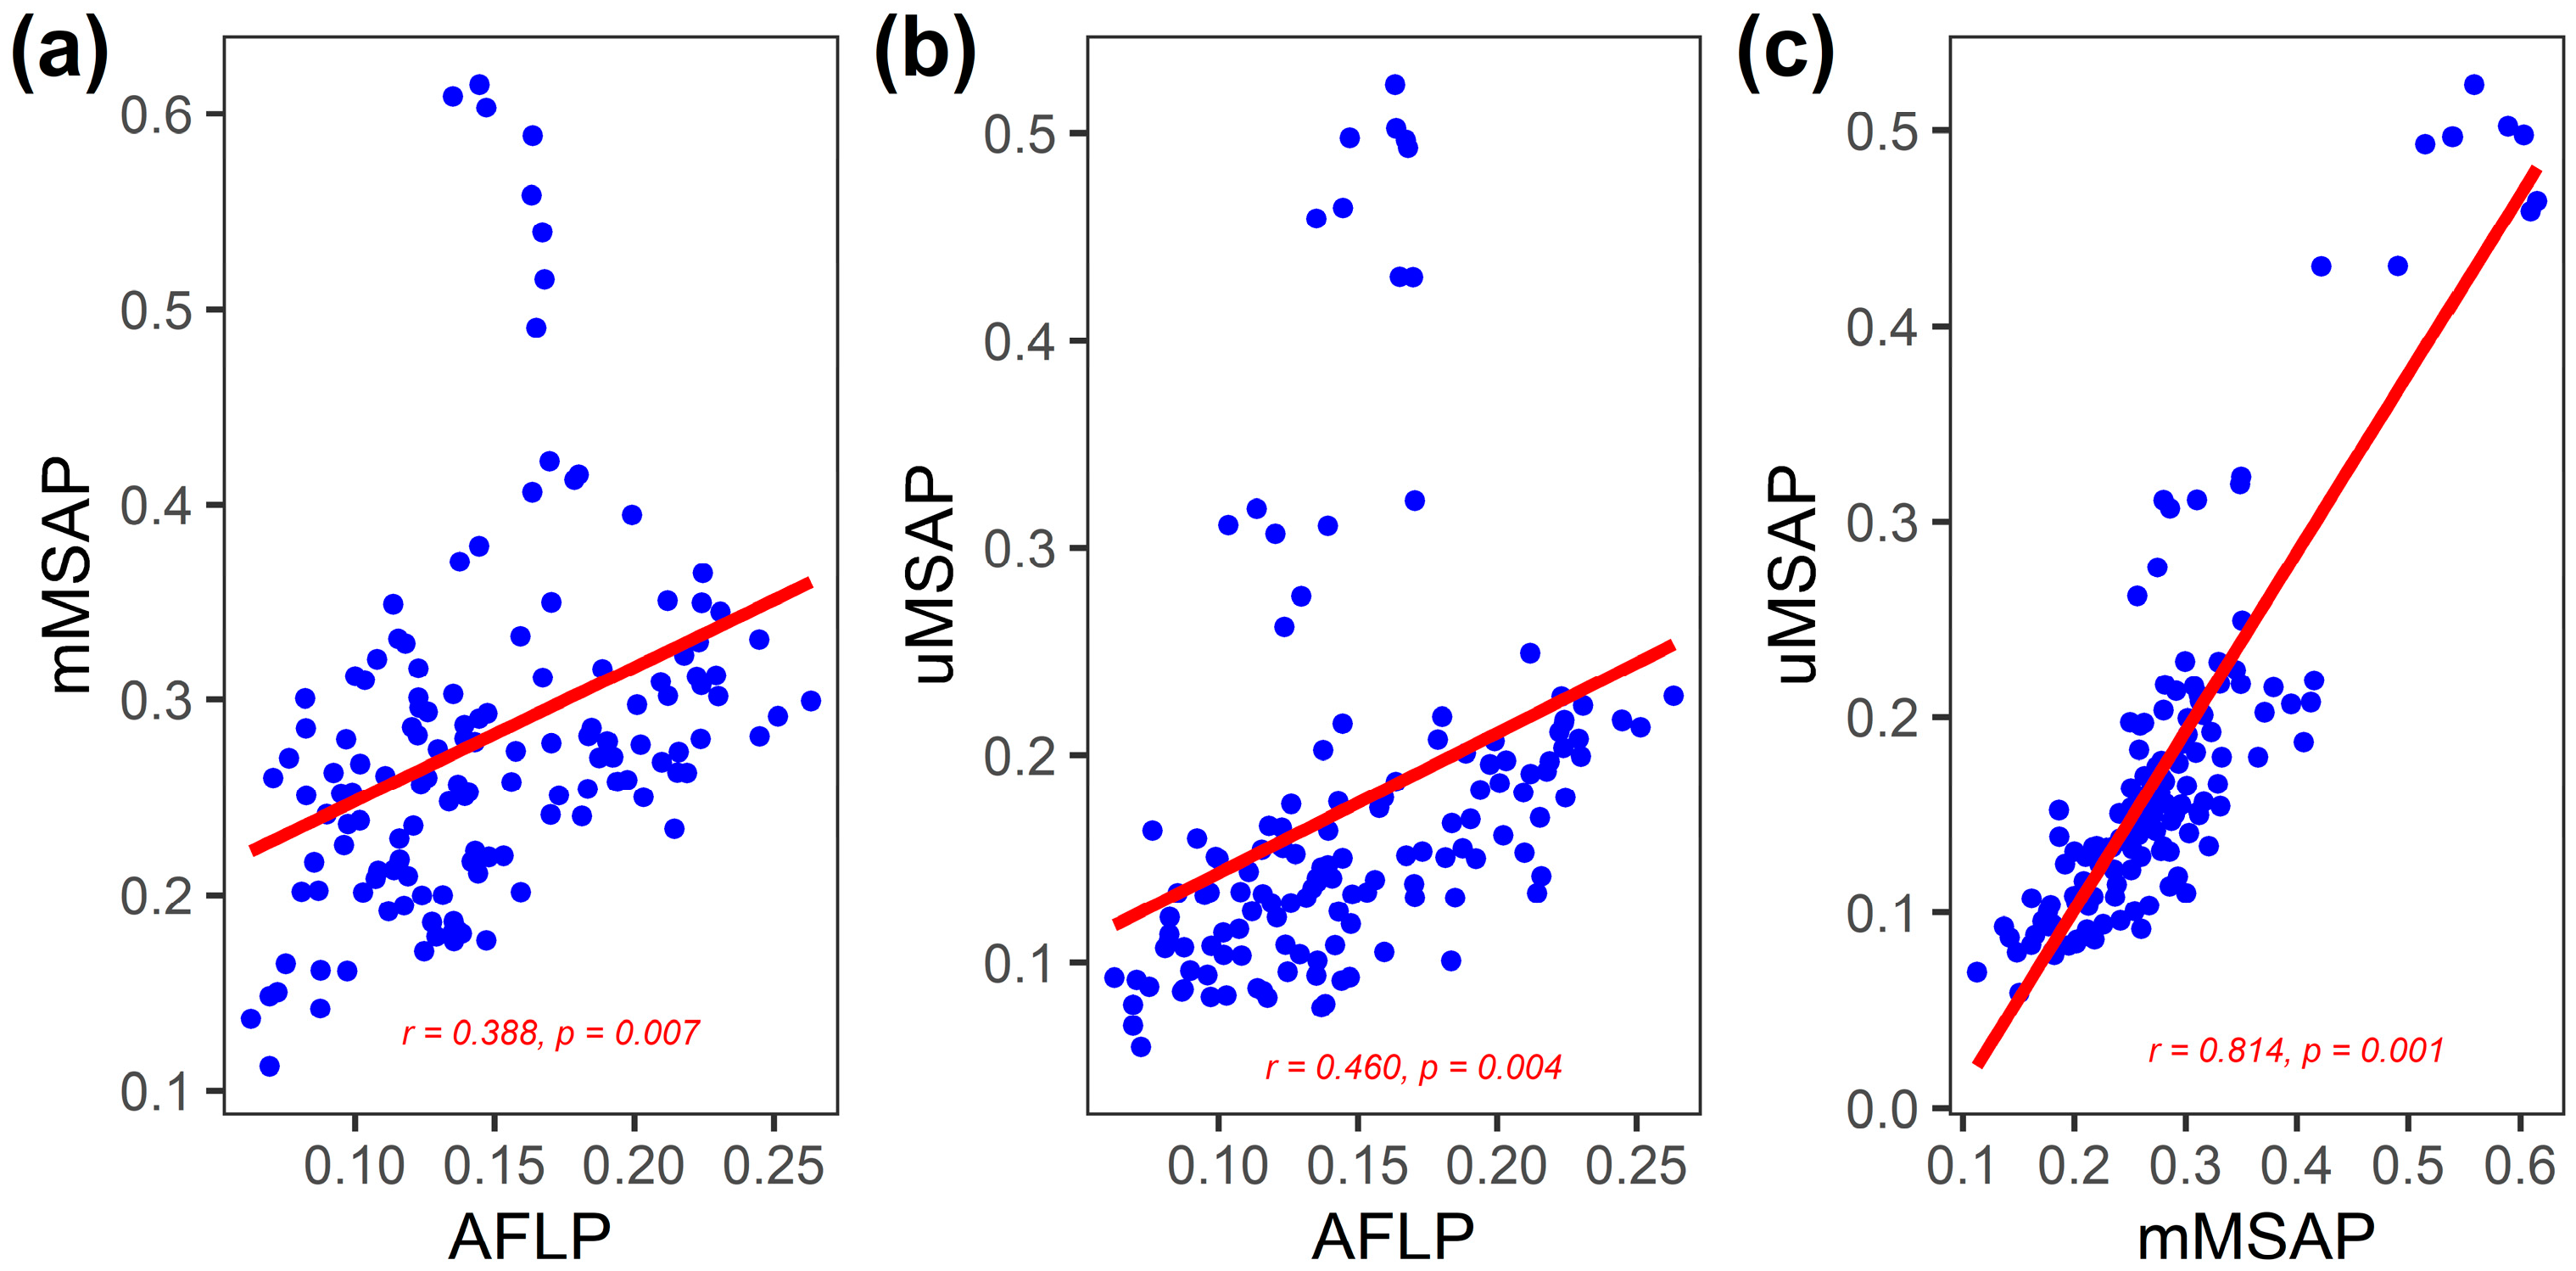
3.2. Inter-Population Relationship between Genetic and Epigenetic Variation

A pairwise population Nei’s distance matrix was used in a Mantel test to investigate the inter-population correlation between genetic and epigenetic variation. We found significant inter-population correlations between genetic and epigenetic distance (AFLP vs. mMSAP: Mantel r = 0.484, p = 0.002; AFLP vs. uMSAP: Mantel r = 0.596, p = 0.001; and mMSAP vs. uMSAP: Mantel r = 0.832, p = 0.001), and the linear fitting lines are displayed in Figure 3. The relationships between the three marker types were also significant when the effect of geography was excluded using the partial Mantel test (AFLP vs. mMSAP: Mantel r = 0.388, p = 0.007; AFLP vs. uMSAP: Mantel r = 0.460, p = 0.004; and mMSAP vs. uMSAP: Mantel r = 0.814, p = 0.001).

3.3. FST Outlier Identification and Association between Outliers and Environmental Variables

In the DFDIST analysis, 41 mMSAP and 10 uMSAP loci (9.67 and 2.82%, respectively) were identified as being FST outliers (Figure S2). The BAYESCAN analysis identified 45 mMSAP and 15 uMSAP loci as being FST outliers, corresponding to 10.61 and 4.24% of all loci, respectively. Although we set log10(PO) > 1.0 as a criterion for strong evidence in the identification of outliers using BAYESCAN, most of the outliers identified with BAYESCAN had a log10(PO) > 2 (decisive evidence for selection corresponding to a probability > 0.99) [58], except two mMSAP outliers (mX06HM_2011 and mX10HM_4950) (Table S5). A total of 10 mMSAP and 9 uMSAP loci, respectively, were identified as outliers using both DFDIST and BAYESCAN (Table S5, Figure S2). No outlier mMSAP loci were correlated with BIO19 or CLO assessed using LFMM, Samβada, and rstanarm (Table S5). Most outlier loci exhibited a significant association with two or more environmental variables based on the three regression approaches (Table S5). The ΦST was 0.284 in mMSAP and 0.404 in uMSAP based on the outlier loci (Table 2).

3.4. Environmental Effect on Outlier Epigenetic Variation

Using the 16 environmental variables in the full RDA model, the statistical test supported the role of the environment in shaping the distribution of the outlier mMSAP and uMSAP epigenotypes (mMSAP: adjusted R2 = 0.273, F = 5.917, p = 0.001; uMSAP: adjusted R2 = 0.390, F = 9.414, p = 0.001). The full RDA model analysis with envfit suggested that outlier mMSAP and uMSAP variation, respectively, correlated significantly with 11 and 12 environmental variables (5% FDR adjusted p < 0.05, Table 3). These 11 and 12 environmental variables were used, respectively, in the pRDA model for outlier mMSAP and uMSAP conditioned on geography. The first two axes of the pRDA explained 68.81 and 73.75% of the outlier mMSAP and uMSAP variation, respectively (mMSAP: adjusted R2 = 0.140, F = 4.427, p = 0.001; uMSAP: adjusted R2 = 0.269, F = 8.224, p = 0.001) (Figure 4).
When conditioned on the geographic effect, the outlier mMSAP variation was highly correlated with slope, soil pH, and BIO12 on the first pRDA axis (Table 4 and Figure 4). Aspect, NDVI, PET, and BIO12 were highly correlated with the outlier mMSAP variation on the second pRDA axis. On the first pRDA axis, the outlier uMSAP variation showed strong correlations with aspect, slope MI, soil pH, and BIO12. The second pRDA axis revealed high correlations between MI and NDVI and the outlier uMSAP variation. The annual temperature range had a relatively higher R2 (mMSAP: R2 = 0.308; uMSAP: R2 = 0.129) than the other environmental variables in the envfit analysis (Table 3). However, the annual temperature range had low levels of correlation with the outlier mMSAP (RDA1 biplot score = 0.074, RDA2 biplot score = −0.010) and uMSAP (RDA1 biplot score = 0.019, RDA2 biplot score = −0.029) variation in both pRDA axes when controlling for the geographic effect (Table 4 and Figure 4).

3.5. Contribution of Environment to Explaining the Total and Outlier Epigenetic Variation

The Mantel test revealed a significant genetic IBD based on the total AFLP data (Mantel r = 0.457, p = 0.001) [23]. A significant epigenetic IBD was also found based on the total mMSAP and uMSAP using the Mantel test (mMSAP: Mantel r = 0.126, p = 0.001; uMSAP: Mantel r = 0.184, p = 0.001) and MMRR (mMSAP: r = 0.112, p = 0.001; uMSAP: r = 0.174, p = 0.001) (Table 5). A significant IBE was found in all analyses based on the total variation using the Mantel test (mMSAP: Mantel r = 0.148, p = 0.002; uMSAP: Mantel r = 0.195, p = 0.001) and MMRR (mMSAP: r = 0.131, p = 0.002; uMSAP: r = 0.184, p = 0.001). Moreover, a significant IBE can be inferred based on the total (mMSAP: Mantel r = 0.121, p = 0.013; uMSAP: Mantel r = 0.150, p = 0.001) and outlier (mMSAP: Mantel r = 0.191, p = 0.001; uMSAP: Mantel r = 0.184, p = 0.001) datasets when controlling for geography using the partial Mantel test. MMRR also revealed a significant IBE when controlling for the geographic effect based on the total (mMSAP: R2 = 0.030, βE = 0.110, p = 0.012 vs. βD = 0.084, p = 0.002; uMSAP: R2 = 0.056, βE = 0.145, p = 0.001 vs. βD = 0.130, p = 0.001) and outlier (mMSAP: R2 = 0.098, βE = 0.128, p = 0.001 vs. βD = 0.138, p = 0.001; uMSAP: R2 = 0.068, βE = 0.132, p = 0.001 vs. βD = 0.100, p = 0.001) variation.
Partial Mantel tests revealed strong correlations between mMSAP and uMSAP variation and environmental heterogeneity when controlling for genetic structure based on the total (mMSAP: Mantel r = 0.091, p = 0.031; uMSAP: Mantel r = 0.121, p = 0.001) and outlier (mMSAP: Mantel r = 0.150, p = 0.001; uMSAP: Mantel r = 0.191, p = 0.001) data. However, MMRR revealed non-significant IBE based on the total mMSAP variation when controlling for genetic structure (R2 = 0.036, βE = 0.086, p = 0.051 vs. βG = 0.138, p = 0.009), but a significant IBE was found when controlling for genetic structure based on the total uMSAP variation (R2 = 0.062, βE = 0.121, p = 0.001 vs. βG = 0.190, p = 0.001). Nonetheless, MMRR revealed a significant IBE based on the outlier mMSAP and uMSAP variation when controlling for the genetic structure (mMSAP: R2 = 0.102, βE = 0.105, p = 0.002 vs. βG = 0.182, p = 0.001; uMSAP: R2 = 0.070, βE = 0.136, p = 0.001 vs. βG = 0.122, p = 0.001).

4. Discussion

Theoretical work has shown that beneficial and heritable epigenetic variants may play important roles for populations to adapt quickly to local conditions independent of genetic changes [7]. Although empirical studies have shown epigenetics may act independently from underlying genetic variation [29,30,33,62,63], genotypes and epigenotypes may interact and together affect biological processes, for example, in Viola cazorlensis [27], Arabidopsis thaliana [28], and Taiwania cryptomerioides [64]. Our results indicate inter-population correlations between genetic and epigenetic variation, even with the exclusion of the geographic effect using the partial Mantel test (Figure 3). The underlying mechanism could be that the epigenetic variation interplay with genetic variation and epigenetic variation is at least in part a downstream, subsidiary effect of genetic changes [6,16,17,18]. Epigenetic variation may have played a role in speeding up the local adaptation of Z. kawagoii. Relatively lower Z. kawagoii AFLP diversity was found compared to that of Zingiber species distributed in Brazil and India [23]. We found that mean mMSAP diversity is relatively higher compared to mean AFLP diversity (Table 1, cf. 23). At the population level, most populations of Z. kawagoii had a relatively higher level of epigenetic than genetic diversity, particularly when compared between AFLP and mMSAP (Table 1, cf. 23). Additionally, mean uHE per locus was significantly smaller in AFLP compared to mMSAP and uMSAP (Table S3). These results suggest that epigenetic mutation may occur at a faster rate than genetic mutation [65,66]. Moreover, lower epigenetic than genetic differentiation (Table 2 and Table S4; cf. 23) suggests larger epigenetic variation in shorter spatial distances might contribute considerably to population epigenetic diversity [27,33,34,67,68]. It is possible that epigenetic variation may provide a compensating source for the low level of genetic variation [7,9,10].
Neutral epigenetic divergence may occur via drift, and inter-population correlation between genetic and epigenetic variation may involve no functional link [5,69]. The higher genetic than epigenetic differentiation found in Z. kawagoii and other plants [30,63,64,70] (Table 2 and Table S4; cf. 23) suggests that geographic distance was a better predictor of genetic than epigenetic differentiation. This is evidenced by the larger Mantel statistic for AFLP relative to mMSAP and uMSAP in this study (AFLP: Mantel r = 0.457; mMSAP: Mantel r = 0.126; uMSAP: Mantel r = 0.184). Nonetheless, significant epigenetic IBD was detected with both the Mantel test and MMRR based on the total and outlier data (Table 5), suggesting that population epigenetic variation may be partly caused by random epigenetic drift [71]. Additionally, the stronger signal in genetic IBD than in epigenetic IBD suggests that the signal is biased by non-unidirectional changes in environmental gradients, which may impede epigenetic IBD [72,73].
Epigenetic changes can be triggered by biotic and abiotic stresses in natural environments and provide potential for novel heritable variation [74]. Environmental changes affect epigenetic variation in many organisms, which might help them adapt to rapid environmental changes [27,28,29,30,33]. Thus, the role of epigenetics in response to environmental stimulus has been an important issue in evolution [36]. With a significant inter-population correlation between genetic and epigenetic variation, strong epigenetic IBE can still be found when controlling for the effect of any genetic structure using both the partial Mantel test and MMRR (Table 5), particularly based on the outlier data. It is likely that part of the epigenetic variation is not coupled with genetic changes, and environments may act as causal factors in inducing epigenetic variation. Thus, epigenetic variation may play a role in the rapid evolution of individuals to various environments [64]. Epigenetic profiles may diverge between environments contributing to differentially induced effects [29,75]. Additionally, there was a significantly lower level of mean genetic uHE per locus compared to mean epigenetic uHE per locus (Table S3), reinforcing the role of epigenetic variation in Z. kawagoii adaptation. This may enable higher survival in a population encountering novel environments until the acquisition of beneficial genetic mutation.
The current study extends the earlier research [23] by examining the links between environmental variables and epigenetic variants. Unlike the earlier study [23], which showed that annual temperature range was the main driver for latitudinal adaptive divergence, this study found that the annual temperature range may play only a minor role in the adaptive epigenetic divergence, as suggested by low biplot scores in the first and second pRDA axes (Table 4 and Figure 4). This suggests low correlation between the annual temperature range and the outlier MSAP variation at larger spatial scales. Moreover, epigenetics in this study, similar to the earlier genetic study [23], indicated that combinations of different environmental drivers may act as selective pressures in invoking adaptive evolution. However, environmental variables may have differential effects on adaptive genetic and epigenetic variation in Z. kawagoii. The results of pRDA analyses in this study suggest outlier mMSAP variation is associated mainly with slope, soil pH, NDVI, PET, and BIO12, whereas outlier uMSAP variation is mainly associated with aspect, slope, MI, NDVI, soil pH, and BIO12 (Table 4 and Figure 4). However, the contributions of various environmental variables with high correlations with both pRDA axes (Table 4 and Figure 4) suggest that these variables may have acted in concert on various genes invoking adaptive epigenetic divergence.
Although it is unclear whether environmentally dependent epigenetic changes at distinct loci are the direct consequence of environments, local environments may play a role in mediating heritable epigenetic divergence for certain loci that are responsive to environmental conditions [36,72,76]. This may be advantageous if epigenetic changes that are stress responsive and are ecologically relevant. For example, individuals of L. racemosa from salt marsh populations display a shrub-like phenotype with lower levels of DNA methylation, whereas individuals of riverside populations with a tree-like phenotype had higher levels of DNA methylation [34]. In this mangrove species, genes may be activated via demethylation due to salinity stress in the salt marsh populations in contrast to hypermethylation of these genes in the riverside populations. Correlations between epigenetic changes and traits related to plant growth and development can be found, for example, leaf traits in Prunus mume [77] and Carpobrotus edulis [78], flower morphology in V. cazorlensis [27], and inhabiting different natural habitats in Phragmites australis and Lilium bosniacum [79,80]. Epigenetic changes are closely related to climatic factors such as temperature [31,33,81] and precipitation [31,33]. Epigenetic changes are also found to be closely associated with ecological factors such as soil factors [31,82], NDVI, and PET [31,33]. Topographic variables including slope and aspect are also found to be closely related to epigenetic changes [31,33]. Therefore, environmentally dependent epigenetic changes may be related to the growth and development of plants, thus contributing to ecological and evolutionary processes in natural populations.

5. Conclusions

Genetic adaptation to environmental changes is crucial for the conservation and survival of species. In addition, researchers in evolutionary biology are increasingly interested in epigenetic adaptations to different environments. Both genetic and epigenetic variations may be sources of variation that play important roles in adapting to environmental heterogeneity and, hence, are important for understanding how the environment shapes natural population diversity in a changing environment. In the present study, epigenetic variation provided no distinct regional substructuring, particularly based on the total mMSAP data. This study revealed low epigenetic population differentiation, indicating that larger epigenetic variation occurs mainly at shorter spatial scales. Epigenetic variation may have compensated for the lack of genetic variation and played an important role in the adaptive divergence and local adaptation in Z. kawagoii populations. We identified that outlier MSAP loci associated strongly with specific environmental variables that may have played important roles in the local adaptation and survival of Z. kawagoii populations despite significant IBD. The local adaptation involving epigenetic changes in Z. kawagoii is also evidenced by the finding of significant IBE based on the outlier epigenetic variation when controlling for the geographic or genetic effects. Nonetheless, this study suggests that selection may be involved in population divergence at epigenetic sites that are partly linked to genetic sites in Z. kawagoii. Our findings highlight that methylation changes can be substrates for natural selection associated with environmental variables and may have a long-term consequence on the adaptation and survival of Z. kawagoii populations. This study also emphasizes the importance of investigating population epigenetic variation in association with environmental gradients apart from adaptive genetic divergence.

Supplementary Materials

The following are available online at https://www.mdpi.com/article/10.3390/plants12071558/s1, Figure S1: Bayesian information criterion for the evaluation of clustering scenarios analyzed based on mMSAP and uMSAP. Figure. S2: Venn diagrams showing the number of outlier MSAP (mMSAP and uMSAP) loci identified using genome scans of natural populations of Zingiber kawagoii using BAYESCAN and DFDIST. Table S1: Primer combinations, number of markers, and error rate per locus calculated using the MSAP technique. Table S2: The 16 environmental variables of the 17 populations of Zingiber kawagoii. Table S3: Summary of Tukey’s post hoc pairwise comparisons of the mean unbiased expected heterozygosity (uHE) per locus in Zingiber kawagoii between marker types (AFLP, mMSAP, and uMSAP) using a linear mixed effect model. Table S4: Matrix of pairwise FST (lower diagonal) and p-values (upper diagonal) based on the total mMSAP and uMSAP data of the 17 populations of Zingiber kawagoii estimated using ARLEQUIN. Table S5: FST outliers identified using BAYESCAN and DFDIST that were strongly associated with environmental variables.

Author Contributions

Conceptualization, S.-Y.H.; methodology, S.-Y.H. and Y.-S.L.; field work, P.-C.L.; formal analysis, S.-Y.H., Y.-S.L. and C.-T.C.; writing—original draft, S.-Y.H. and Y.-S.L.; writing—review and editing, S.-Y.H., Y.-S.L., C.-T.C. and P.-C.L.; acquisition of financing, S.-Y.H. All authors have read and agreed to the published version of the manuscript.

Funding

This work was funded by the National Science and Technology Council grant project MOST109-2313-B-003-001-MY3 to S.-Y.H.

Data Availability Statement

The data presented in this study are available on request from the corresponding author.

Acknowledgments

The authors are grateful to Bing-Hong Huang and Yi-Ting Tseng for their assistance in plant material collection and identification.

Conflicts of Interest

The authors declare no conflict of interest.

References

  1. Ackerly, D.D. Community assembly, niche conservatism, and adaptive evolution in changing environments. Int. J. Plant Sci. 2003, 164, S165–S184. [Google Scholar] [CrossRef]
  2. Anderson, B.J.; Akçakaya, H.R.; Araújo, M.B.; Fordham, D.A.; Martinez-Meyer, E.; Thuiller, W.; Brook, B.W. Dynamics of range margins for metapopulations under climate change. Proc. R. Soc. B 2009, 276, 1415–1420. [Google Scholar] [CrossRef] [Green Version]
  3. Hoffmann, A.A.; Sgrὸ, C.M. Climate change and evolutionary adaptation. Nature 2011, 470, 479–485. [Google Scholar] [CrossRef] [PubMed]
  4. Schluter, D. Evidence for ecological speciation and its alternative. Science 2009, 323, 737–741. [Google Scholar] [CrossRef] [PubMed] [Green Version]
  5. Richards, C.L.; Bossdorf, O.; Pigliucci, M. What role does heritable epigenetic variation play in phenotypic evolution? BioScience 2010, 60, 232–237. [Google Scholar] [CrossRef] [Green Version]
  6. Bossdorf, O.; Richards, C.L.; Pigliucci, M. Epigenetics for ecologists. Ecol. Lett. 2008, 11, 106–115. [Google Scholar] [CrossRef]
  7. Klironomos, F.D.; Berg, J.; Collins, S. How epigenetic mutations can affect genetic evolution: Model and mechanism. BioEssays 2013, 35, 571–578. [Google Scholar] [CrossRef]
  8. Jablonka, E.; Lachmann, M.; Lamb, M.J. Evidence, mechanisms and models for the inheritance of acquired characters. J. Theor. Biol. 1992, 158, 245–268. [Google Scholar] [CrossRef]
  9. Merilä, J.; Hendry, A.P. Climate change, adaptation, and phenotypic plasticity: The problem and the evidence. Evol. Appl. 2013, 7, 1–14. [Google Scholar] [CrossRef]
  10. Lande, R. Evolution of phenotypic plasticity in colonizing species. Mol. Ecol. 2015, 24, 2038–2045. [Google Scholar] [CrossRef]
  11. Furrow, R.E. Epigenetic inheritance, epimutation, and the response to selection. PLoS ONE 2014, 9, e101559. [Google Scholar] [CrossRef] [PubMed]
  12. Kronholm, I.; Collins, S. Epigenetic mutations can both help and hinder adaptive evolution. Mol. Ecol. 2016, 25, 1856–1868. [Google Scholar] [CrossRef]
  13. Cervera, M.-T.; Ruiz-García, L.; Martínez-Zapater, J. Analysis of DNA methylation in Arabidopsis thaliana based on methylation-sensitive AFLP markers. Mol. Genet. Genom. 2002, 268, 543–552. [Google Scholar] [CrossRef] [PubMed] [Green Version]
  14. Rapp, R.A.; Wendel, J.F. Epigenetics and plant evolution. New Phytol. 2005, 168, 81–91. [Google Scholar] [CrossRef] [PubMed]
  15. Vaughn, M.W.; Tanurdžić, M.; Lippman, Z.; Jiang, H.; Carrasquillo, R.; Rabinowicz, P.D.; Dedhia, N.; McCombie, W.R.; Agier, N.; Bulski, A.; et al. Epigenetic natural variation in Arabidopsis thaliana. PLoS Biol. 2007, 5, e174. [Google Scholar] [CrossRef]
  16. Verhoeven, K.J.F.; Jansen, J.J.; van Dijk, P.J.; Biere, A. Stress–induced DNA methylation changes and their heritability in asexual dandelions. New Phytol. 2010, 185, 1108–1118. [Google Scholar] [CrossRef]
  17. Richards, C.L.; Bossdorf, O.; Muth, N.Z.; Gurevitch, J.; Pigliucci, M. Jack of all trades, master of some? On the role of phenotypic plasticity in plant invasions. Ecol. Lett. 2006, 9, 981–993. [Google Scholar] [CrossRef] [Green Version]
  18. Riddle, N.C.; Richards, E.J. The control of natural variation in cytosine methylation in Arabidopsis. Genetics 2002, 162, 355–363. [Google Scholar] [CrossRef]
  19. Wright, S. Isolation by distance. Genetics 1943, 28, 114–138. [Google Scholar] [CrossRef]
  20. Herrera, C.M.; Bazaga, P. Genetic and epigenetic divergence between disturbed and undisturbed subpopulations of a Mediterranean shrub: A 20-year field experiment. Ecol. Evol. 2016, 6, 3832–3847. [Google Scholar] [CrossRef] [Green Version]
  21. Wang, I.J.; Glor, R.E.; Losos, J.B. Quantifying the roles of ecology and geography in spatial genetic divergence. Ecol. Lett. 2013, 16, 175–182. [Google Scholar] [CrossRef] [PubMed]
  22. Sexton, J.P.; Hangartner, S.B.; Hoffmann, A.A. Genetic isolation by environment or distance: Which pattern of gene flow is most common? Evolution 2014, 68, e12258. [Google Scholar] [CrossRef] [PubMed] [Green Version]
  23. Li, Y.-S.; Liao, P.-C.; Chang, C.-T.; Hwang, S.-Y. Pattern of adaptive divergence in Zingiber kawagoii Hayata (Zingiberaceae) along a narrow latitudinal range. Plants 2022, 11, 2490. [Google Scholar] [CrossRef] [PubMed]
  24. Lu, H.-P. Contrasting pattern of population genetic structure and local adaptation of two Taiwan endemic ginger species. Master’s Thesis, National Taiwan Normal University, Taipei, Taiwan, 2020. [Google Scholar]
  25. Kirkpatrick, M.; Barton, N.H. Evolution of a species’ range. Am. Nat. 1997, 150, 286054. [Google Scholar] [CrossRef] [Green Version]
  26. Polechová, J.; Barton, N.H. Limits to adaptation along environmental gradients. Proc. Natl. Acad. Sci. USA 2015, 112, 6401–6406. [Google Scholar] [CrossRef] [Green Version]
  27. Herrera, C.M.; Bazaga, P. Epigenetic differentiation and relationship to adaptive genetic divergence in discrete populations of the violet Viola cazorlensis. New Phytol. 2010, 187, 867–876. [Google Scholar] [CrossRef]
  28. Latzel, V.; Allan, E.; Silveira, A.B.; Colot, V.; Fischer, M.; Bossdorf, O. Epigenetic diversity increases the productivity and stability of plant populations. Nat. Commu. 2013, 4, 2875. [Google Scholar] [CrossRef] [Green Version]
  29. Dubin, M.J.; Zhang, P.; Meng, D.; Remigereau, M.-S.; Osborne, E.J.; Casale, F.P.; Drewe, P.; Kahles, A.; Jean, G.; Vilhjalmsson, B. DNA methylation in Arabidopsis has a genetic basis and shows evidence of local adaptation. eLife 2015, 4, e05255. [Google Scholar] [CrossRef]
  30. Foust, C.M.; Preite, V.; Schrey, A.W.; Alvarez, M.; Robertson, M.H.; Verhoeven, K.J.F.; Richards, C.L. Genetic and epigenetic differences associated with environmental gradients in replicate populations of two salt marsh perennials. Mol. Ecol. 2016, 25, 1639–1652. [Google Scholar] [CrossRef]
  31. Cao, J.-J.; Li, Y.-S.; Chang, C.-T.; Chung, J.-D.; Hwang, S.-Y. Adaptive divergence without distinct species relationships indicate early stage ecological speciation in species of the Rhododendron pseudochrysanthum complex endemic to Taiwan. Plants 2022, 11, 1226. [Google Scholar] [CrossRef] [PubMed]
  32. Johnson, L.J.; Tricker, P.J. Epigenomic plasticity within populations: Its evolutionary significance and potential. Heredity 2010, 105, 113–121. [Google Scholar] [CrossRef] [Green Version]
  33. Huang, C.-L.; Chen, J.-H.; Tsang, M.-H.; Chung, J.-D.; Chang, C.-T.; Hwang, S.-Y. Influences of environmental and spatial factors on genetic and epigenetic variations in Rhododendron oldhamii (Ericaceae). Tree Genet. Genom. 2015, 11, 823. [Google Scholar] [CrossRef]
  34. Lira-Medeiros, C.F.; Parisod, C.; Fernandes, R.A.; Mata, C.S.; Cardoso, M.A.; Ferreira, P.C.G. Epigenetic variation in mangrove plants occurring in contrasting natural environments. PLoS ONE 2010, 5, e10326. [Google Scholar] [CrossRef] [PubMed]
  35. Whipple, A.V.; Holeski, L.M. Epigenetic inheritance across the landscape. Front. Genet. 2016, 7, 189. [Google Scholar] [CrossRef] [Green Version]
  36. Richards, C.L.; Alonso, C.; Becker, C.; Bossdorf, O.; Bucher, E.; Colomé-Tatché, M.; Durka, W.; Engelhardt, J.; Gaspar, G.; Gogol-Döring, A.; et al. Ecological plant epigenetics: Evidence from model and non-model species, and the way forward. Ecol. Lett. 2017, 20, 1576–1590. [Google Scholar] [CrossRef] [Green Version]
  37. Xiong, L.Z.; Xu, C.G.; Saghai Maroof, M.A.; Zhang, Q. Patterns of cytosine methylation in an elite rice hybrid and its parental lines, detected by a methylation-sensitive amplification polymorphism technique. Mol. Gen. Genet. 1999, 261, 439–446. [Google Scholar] [CrossRef]
  38. Frichot, E.; Schoville, S.D.; Bouchard, G.; François, O. Testing for associations between loci and environmental gradients using latent factor mixed models. Mol. Biol. Evol. 2013, 30, 1687–1699. [Google Scholar] [CrossRef] [Green Version]
  39. Stucki, S.; Orozco-terWengel, P.; Forester, B.R.; Duruz, S.; Colli, L.; Masembe, C.; Negrini, R.; Landguth, E.; Jones, M.R.; The NEXTGEN Consortium; et al. High performance computation of landscape genomic models integrating local indices of spatial association. Mol. Ecol. Resour. 2017, 17, 1072–1089. [Google Scholar] [CrossRef] [Green Version]
  40. Foll, M.; Gaggiotti, O. A genome scan method to identify selected loci appropriate for both dominant and codominant markers: A Bayesian perspective. Genetics 2008, 180, 977–993. [Google Scholar] [CrossRef] [Green Version]
  41. Beaumont, M.A.; Nichols, R.A. Evaluating loci for use in the genetic analysis of population structure. Proc. R. Soc. B Biol. Sci. 1996, 263, 1619–1626. [Google Scholar] [CrossRef]
  42. Goodrich, B.; Gabry, J.; Ali, I.; Brilleman, S. rstanarm: Bayesian Applied Regression Modeling via Stan. R Package Version 2.21.1. 2020. Available online: https://mc-stan.org/rstanarm (accessed on 3 April 2018).
  43. Borcard, D.; Legendre, P.; Drapeau, P. Partialling out the spatial component of ecological variation. Ecology 1992, 73, 1045–1055. [Google Scholar] [CrossRef] [Green Version]
  44. Doyle, J.J.; Doyle, J.L. A rapid DNA isolation procedure from small quantities of fresh leaf tissue. Phytochem. Bull. 1987, 19, 11–15. [Google Scholar]
  45. Schulz, B.; Eckstein, R.L.; Durka, W. Scoring and analysis of methylation-sensitive amplification polymorphisms for epigenetic population studies. Mol. Ecol. Resour. 2013, 134, 642–653. [Google Scholar] [CrossRef] [PubMed] [Green Version]
  46. R Development Core Team. R: A Language and Environment for Statistical Computing, (Version 3.6.3); R Foundation for Statistical Computing: Vienna, Austria, 2020; Available online: https://www.R-project.org/ (accessed on 6 January 2022).
  47. Bonin, A.; Bellemain, E.; Bronken, E.P.; Pompanon, F.; Brochmann, C.; Taberlet, P. How to track and assess genotyping errors in population genetics studies. Mol. Ecol. 2004, 13, 3261–3273. [Google Scholar] [CrossRef]
  48. Vekemans, X.; Beauwens, T.; Lemaire, M.; Roldán-Ruiz, I. Data from amplified fragment length polymorphism (AFLP) markers show indication of size homoplasy and of a relationship between degree of homoplasy and fragment size. Mol. Ecol. 2002, 11, 139–151. [Google Scholar] [CrossRef]
  49. Nei, M. Molecular Evolutionary Genetics; Columbia University Press: New York, NY, USA, 1987; ISBN 9780231886710. [Google Scholar] [CrossRef] [Green Version]
  50. Excoffier, L.; Lischer, H.E. Arlequin suite ver 3.5: A new series of programs to perform population genetics analyses under Linux and Windows. Mol. Ecol. Resour. 2010, 10, 564–567. [Google Scholar] [CrossRef]
  51. Bates, D.; Maechler, M.; Bolker, B.; Walker, S. Fitting linear mixed effects models using lme4. J. Stat. Soft. 2015, 67, 1–48. [Google Scholar] [CrossRef]
  52. Fox, J.; Weisberg, S. An R Companion to Applied Regression, 2nd ed.; Sage: Thousand Oaks, CA, USA, 2011; ISBN 978-141-297-518-8. Available online: http://socserv.socsci.mcmaster.ca/jfox/Books/Companion (accessed on 11 March 2019).
  53. Lenth, R.V. Emmeans: Estimated Marginal Means, Aka Least-Squares Means. R Package Version 1.8.0. 2022. Available online: https://CRAN.R-project.org/package=emmeans (accessed on 6 January 2022).
  54. Nei, M. Estimation of average heterozygosity and genetic distance from a small number of individuals. Genetics 1978, 89, 583–590. [Google Scholar] [CrossRef]
  55. Kamvar, Z.N.; Brooks, J.C.; Grünwald, N.J. Novel R tools for analysis of genome-wide population genetic data with emphasis on clonality. Front. Genet. 2015, 6, 208. [Google Scholar] [CrossRef] [Green Version]
  56. Oksanen, J.; Blanchet, F.G.; Friendly, M.; Kindt, R.; Legendre, P.; McGlinn, D.; Minchin, P.R.; O’Hara, R.B.; Simpson, G.L.; Solymos, P.; et al. Vegan: Community Ecology Package. R Package Version 2.4-2. 2017. Available online: https://CRAN.R-project.org/package=vegan (accessed on 15 January 2018).
  57. Dray, S.; Dufour, A.-B. The ade4 package: Implementing the duality diagram for ecologists. J. Stat. Soft. 2007, 22, 1–20. [Google Scholar] [CrossRef] [Green Version]
  58. Jombart, T.; Devillard, S.; Balloux, F. Discriminant analysis of principal components: A new method for the analysis of genetically structured populations. BMC Genet. 2010, 11, 94. [Google Scholar] [CrossRef] [PubMed] [Green Version]
  59. Jombart, T.; Ahmed, I. Adegenet 1.3-1: New tools for the analysis of genome-wide SNP data. Bioinformatics 2011, 27, 3070–3071. [Google Scholar] [CrossRef] [PubMed] [Green Version]
  60. Foll, M. Bayescan 2.1 User Manual. Available online: http://cmpg.unibe.ch/software/BayeScan/files/BayeScan2.1_manual.pdf (accessed on 23 June 2012).
  61. Storey, J.D.; Bass, A.J.; Dabney, A.; Robinson, D. qvalue: Q-Value Estimation for False Discovery Rate Control. R Package Version 2.28.0. 2022. Available online: http://github.com/jdstorey/qvalue (accessed on 8 January 2019).
  62. Schulz, B.; Eckstein, R.L.; Durka, W. Epigenetic variation reflects dynamic habitat conditions in a rare floodplain herb. Mol. Ecol. 2014, 23, 3523–3537. [Google Scholar] [CrossRef]
  63. Liu, L.; Du, N.; Pei, C.; Guo, X.; Guo, W. Genetic and epigenetic variations associated with adaptation to heterogeneous habitat conditions in a deciduous shrub. Ecol. Evol. 2018, 8, 2594–2606. [Google Scholar] [CrossRef] [Green Version]
  64. Li, Y.-S.; Chang, C.-T.; Wang, C.-N.; Thomas, P.; Chung, J.-D.; Hwang, S.-Y. The contribution of neutral and environmentally dependent processes in driving population and lineage divergence in Taiwania (Taiwania cryptomerioides). Front. Plant Sci. 2018, 9, 1148. [Google Scholar] [CrossRef] [Green Version]
  65. Angers, B.; Castonguay, E.; Massicotte, R. Environmentally induced phenotypes and DNA methylation: How to deal with unpredictable conditions until the next generation and after. Mol. Ecol. 2010, 19, 1283–1295. [Google Scholar] [CrossRef]
  66. Jiang, C.; Mithani, A.; Belfield, E.J.; Mott, R.; Hurst, L.D.; Harberd, N.P. Environmentally responsive genome-wide accumulation of de novo Arabidopsis thaliana mutations and epimutations. Genome Res. 2014, 24, 1821–1829. [Google Scholar] [CrossRef] [Green Version]
  67. Richards, C.L.; Schrey, A.W.; Pigliucci, M. Invasion of diverse habitats by few Japanese knotweed genotypes is correlated with high epigenetic differentiation. Ecol. Lett. 2012, 15, 1016–1025. [Google Scholar] [CrossRef]
  68. Medrano, M.; Herrera, C.M.; Bazaga, P. Epigenetic variation predicts regional and local intraspecific functional diversity in a perennial herb. Mol. Ecol. 2014, 23, 4926–4938. [Google Scholar] [CrossRef]
  69. Trucchi, E.; Mazzarella, A.B.; Gilfillan, G.D.; Lorenzo, M.T.; Schönswetter, P.; Paun, O. BsRADseq: Screening DNA methylation in natural populations of non-model species. Mol. Ecol. 2016, 25, 1697–1713. [Google Scholar] [CrossRef] [PubMed] [Green Version]
  70. Yan, X.; Liu, X.; Li, J.; Zhao, H.; Li, Q.; Wang, Y.; Yuan, C.; Zhang, L.; Dong, Y. Genetic and epigenetic diversity of wild and cultivated soybean in local populations in Northern Huang Huai region of China. Plant Omics 2014, 7, 415–423. [Google Scholar]
  71. Richards, E.J. Population genetics. Curr. Opin. Genet. Dev. 2008, 18, 221–226. [Google Scholar] [CrossRef]
  72. Fraser, D.J.; Lippe, C.; Bernatchez, L. Consequences of unequal population size, asymmetric gene flow and sex-biased dispersal on population structure in brook charr (Salvelinus fontinalis). Mol. Ecol. 2004, 13, 67–80. [Google Scholar] [CrossRef] [PubMed]
  73. Hänfling, B.; Weetman, D. Concordant genetic estimators of migration reveal anthropogenically enhanced source-sink population structure in the river sculpin, Cottus gobio. Genetics 2006, 173, 1487–1501. [Google Scholar] [CrossRef] [Green Version]
  74. Baulcombe, D.C.; Dean, C. Epigenetic regulation in plant responses to the environment. Cold Spring Harb. Perspect. Biol. 2014, 6, a019471. [Google Scholar] [CrossRef] [PubMed]
  75. Dowen, R.H.; Pelizzola, M.; Schmitz, R.J.; Lister, R.; Dowen, J.M.; Nery, J.R.; Dixon, J.E.; Ecker, J.R. Widespread dynamic DNA methylation in response to biotic stress. Proc. Natl. Acad. Sci. USA 2012, 109, E2183–E2191. [Google Scholar] [CrossRef] [Green Version]
  76. Meyer, P. Epigenetic variation and environmental change. J. Exp. Bot. 2015, 66, 3541–3548. [Google Scholar] [CrossRef] [Green Version]
  77. Ma, K.; Sun, L.; Cheng, T.; Pan, H.; Wang, J.; Zhang, Q. Epigenetic variance, performing cooperative structure with genetics, is associated with leaf shape traits in widely distributed populations of ornamental tree Prunus mume. Front. Plant Sci. 2018, 9, 41. [Google Scholar] [CrossRef] [Green Version]
  78. Campoy, J.G.; Sobral, M.; Carro, B.; Lema, M.; Barreiro, R.; Retuerto, R. Epigenetic and phenotypic responses to experimental climate change of native and invasive Carpobrotus edulis. Front. Plant Sci. 2022, 13, 888391. [Google Scholar] [CrossRef]
  79. Qiu, T.; Liu, Z.; Yang, Y.; Liu, B. Epigenetic variation associated with responses to different habitats in the context of genetic divergence in Phragmites australlis. Ecol. Evol. 2021, 11, 11874–11889. [Google Scholar] [CrossRef] [PubMed]
  80. Zoldoš, V.; Biruš, I.; Muratović, E.; Šatović, Z.; Vojta, A.; Robin, O.; Pustahija, F.; Bogunić, F.; Bočkor, V.V.; Siljak-Yakovlev, S. Epigenetic differentiation of natural populations of Lilium bosniacum associated with contrasting habitat conditions. Genome Biol. Evol. 2018, 10, 291–303. [Google Scholar] [CrossRef] [PubMed] [Green Version]
  81. Sammarco, I.; Münzbergová, Z.; Latzel, V. DNA methylation can mediate local adaptation and response to climate change in the clonal plant Fragaria vesca: Evidence from a European-scale reciprocal transplant experiment. Front. Plant Sci. 2022, 13, 827166. [Google Scholar] [CrossRef] [PubMed]
  82. Ni, B.; You, J.; Li, J.; Du, Y.; Zhao, W.; Chen, X. Genetic and epigenetic changes during the upward expansion of Deyeuxia angustifolia Kom. in the alpine tundra of the Changbai mountains, China. Plants 2021, 10, 291. [Google Scholar] [CrossRef] [PubMed]
Figure 1. Sampling localities of the 17 Zingiber kawagoii populations. The map was derived from the default map database in ArcGIS v.10.8.1. Sampling site coordinates were used to depict population locations using ArcGIS. The elevation gradient was generated with a 20 m digital elevation model. See Table 1 for abbreviations of the population names.
Plants 12 01558 g001
Figure 2. Analysis of epigenetic homogeneous groups of 211 individuals of Zingiber kawagoii based on the total (a) mMSAP and (b) uMSAP variation using DAPC. The first two linear discriminants described 72.08 and 56.42% of the total mMSAP and uMSAP variation, respectively.
Plants 12 01558 g002
Figure 3. Inter-population relationships between genetic (AFLP) and epigenetic variation (mMSAP and uMSAP) in the 17 Zingiber kawagoii populations. Linear relationships between distance matrices of (a) AFLP vs. mMSAP, (b) AFLP vs. uMSAP, and (c) mMSAP vs. uMSAP are depicted. The Mantel r and p-values for the partial Mantel test are annotated.
Plants 12 01558 g003
Figure 4. Partial RDA analysis using (a) mMSAP and (b) uMSAP variation explained by the effects of the environment conditioned on the geographic effect. The colored points refer to individuals (colors represent which population they were sampled from), and the red vectors represent environmental predictors. The length and direction of vectors indicate relative correlation strength of the environmental predictors with RDA axes.
Plants 12 01558 g004
Table 1. Site properties and epigenetic parameters of the 17 sampled populations of Zingiber kawagoii estimated using total mMSAP and uMSAP variation.
PopulationLatitude/LongitudeAltitude (m)NmMSAPuMSAP
PPL (%)uHE (SE)PPL (%)uHE (SE)
Antong (AT)23.2847/121.37216101445.50.159 (0.007)31.90.112 (0.008)
Beitawushan (BTWS)22.6148/120.702211921283.00.190 (0.005)34.70.140 (0.008)
Erfenshan (EFS)24.3919/120.82407691277.80.179 (0.006)30.50.133 (0.009)
Huangdidian (HDD)24.9894/121.67994321059.70.158 (0.007)38.10.109 (0.008)
Jianshi (JS)24.7307/121.28958501332.10.120 (0.007)26.30.093 (0.008)
Jinshuiying (JSY)22.4075/120.756414881454.20.167 (0.006)37.30.150 (0.010)
Kantoushan (KTS)23.2671/120.50105831442.20.146 (0.008)31.10.096 (0.008)
Lanyu (LY)22.0496/121.52573021346.00.152 (0.006)33.10.136 (0.010)
Nanzhuang (NZ)24.5742/121.04364671149.10.130 (0.008)28.20.099 (0.008)
Ruifang (RF)25.0861/121.83853491176.90.185 (0.006)44.90.131 (0.008)
Shibishan (SBS)23.6077/120.704513471382.30.179 (0.006)30.50.132 (0.010)
Shuangliu (SL)22.2140/120.79612551375.00.174 (0.006)30.20.128 (0.009)
Sunmoonlake (SML)23.8519/120.89828161333.00.119 (0.007)28.20.103 (0.008)
Tahsueshan (THS)24.2326/120.90039371447.40.158 (0.007)31.10.133 (0.010)
Taroko (TRK)24.1880/121.63829291440.10.136 (0.007)27.40.085 (0.007)
Wulai (WL)24.8663/121.54981431072.90.166 (0.005)45.20.134 (0.008)
Weiliaoshan (WLS)22.8695/120.65716941081.60.206 (0.005)42.40.099 (0.006)
Average 12.458.80.16033.60.119
N, sample size; PPL (%), percentage of polymorphic loci; uHE, unbiased expected heterozygosity.
Table 2. Epigenetic differentiation between the 17 populations of Zingiber kawagoii based on the total and outlier mMSAP and uMSAP variation using an analysis of molecular variance (AMOVA).
Source of VariationdfSum of SquaresPercent VariationΦ Statistic (p)
mMSAP
Total data
Between populations161456.4627.08ΦST = 0.071 (0.0001)
Within populations1949083.03692.92
Total21010,539.498100
Outlier data
Between species16131.39628.39ΦST = 0.284 (0.0001)
Within populations194269.24971.61
Total210400.645100
uMSAP
Total data
Between populations161372.46218.13ΦST = 0.181 (0.0001)
Within populations1944442.69481.87
Total2105815.156100
Outlier data
Between species16172.24240.42ΦST = 0.404 (0.0001)
Within populations194221.85359.58
Total210394.095100
p, p-value.
Table 3. Environmental covariates that were significantly associated with outlier epigenetic variation based on the envfit analysis. R2, the amount of variation explained by each covariate in the model, was determined using envfit. Adjusted p, the p-value corrected for multiple comparisons, was determined using 5% FDR after 999 permutation tests.
Environmental VariablemMSAPuMSAP
R2Adjusted pR2Adjusted p
Aspect0.1270.0020.1060.002
Elevation0.0050.6550.0010.968
Slope0.0650.0040.1040.002
CLO0.0090.4550.0830.002
EVI0.0790.0020.0160.247
LAI0.0550.0050.0130.303
MI0.0040.7390.2300.002
NDVI0.0910.0020.0760.002
PET0.0390.0160.1890.002
RH0.0210.1590.0090.409
Soil pH0.1000.0020.0420.015
WSmean0.2010.0020.0900.002
BIO70.3080.0020.1290.002
BIO90.1010.0020.0970.002
BIO120.2430.0020.0970.002
BIO190.0020.8050.0570.002
Table 4. The pRDA biplot scores for constraining environmental variables associated with epigenetic variation controlling for the geographic effect.
Environmental VariablemMSAPuMSAP
RDA1RDA2RDA1RDA2
Aspect−0.1410.454−0.322−0.015
Slope0.459−0.0670.4680.213
CLO 0.068−0.072
EVI−0.2830.122
LAI−0.1600.102
MI 0.3640.361
NDVI−0.1770.472−0.1270.373
PET0.1510.3410.219−0.249
Soil pH−0.459−0.033−0.3740.218
WSmean0.038−0.2640.0920.067
BIO70.074−0.0100.019−0.029
BIO90.1640.1420.062−0.256
BIO120.442−0.4610.3380.197
BIO19 0.225−0.114
Table 5. Isolation-by-environment (IBE), isolation-by-distance (IBD), and isolation-by-genetic structure (IBG) tested using the Mantel test, partial Mantel tests, and multiple matrix regression with randomization (MMRR). Euclidean distance matrices were generated based on the total and outlier mMSAP and uMSAP, AFLP, geography, and environment. The partial Mantel test and MMRR were used to infer the effects of IBE controlling for geography or genetic structure. In MMRR, R2 represents the total amount of variation explained by both geographic and environmental factors or by both genetic structure and environmental factors. Regression coefficients for IBD (βD), IBG (βG), and IBE (βE) were obtained using MMRR.
Mantel Test Partial Mantel Test
IBE IBD IBE controlling for geographic effectIBE controlling for
genetic effect
r (p)r (p)r (p)r (p)
Total data
mMSAP0.148 (0.002)0.126 (0.001)0.121
(0.013)
0.091
(0.031)
uMSAP0.195 (0.001)0.184 (0.001)0.150
(0.001)
0.121
(0.001)
Outlier data
mMSAP0.243 (0.001)0.253 (0.001)0.191
(0.001)
0.150
(0.001)
uMSAP0.222 (0.001)0.188 (0.001)0.184
(0.001)
0.191
(0.001)
MMRR
IBE IBD IBE controlling for geographic effectIBE controlling for
genetic effect
r (p)r (p)R2βD (p)βE (p)R2βG (p)βE (p)
Total data
mMSAP0.131 (0.002)0.112 (0.001)0.0300.084 (0.002)0.110 (0.012)0.0360.138
(0.009)
0.086
(0.051)
uMSAP0.184 (0.001)0.174 (0.001)0.0560.130 (0.001)0.145 (0.001)0.0620.190 (0.001)0.121 (0.001)
Outlier data
mMSAP0.163 (0.001)0.171 (0.001)0.0980.138 (0.001)0.128 (0.001)0.1020.182
(0.001)
0.105
(0.002)
uMSAP0.157 (0.001)0.132 (0.001)0.0680.100 (0.001)0.132 (0.001)0.0700.122
(0.001)
0.136
(0.001)
r, Mantel r statistic; p, p-value.
Disclaimer/Publisher’s Note: The statements, opinions and data contained in all publications are solely those of the individual author(s) and contributor(s) and not of MDPI and/or the editor(s). MDPI and/or the editor(s) disclaim responsibility for any injury to people or property resulting from any ideas, methods, instructions or products referred to in the content.

