
Addressing the Relationship between Leaf Nitrogen and Carbon Isotope Discrimination from the Three Levels of Community, Population and Individual

Abstract
:1. Introduction
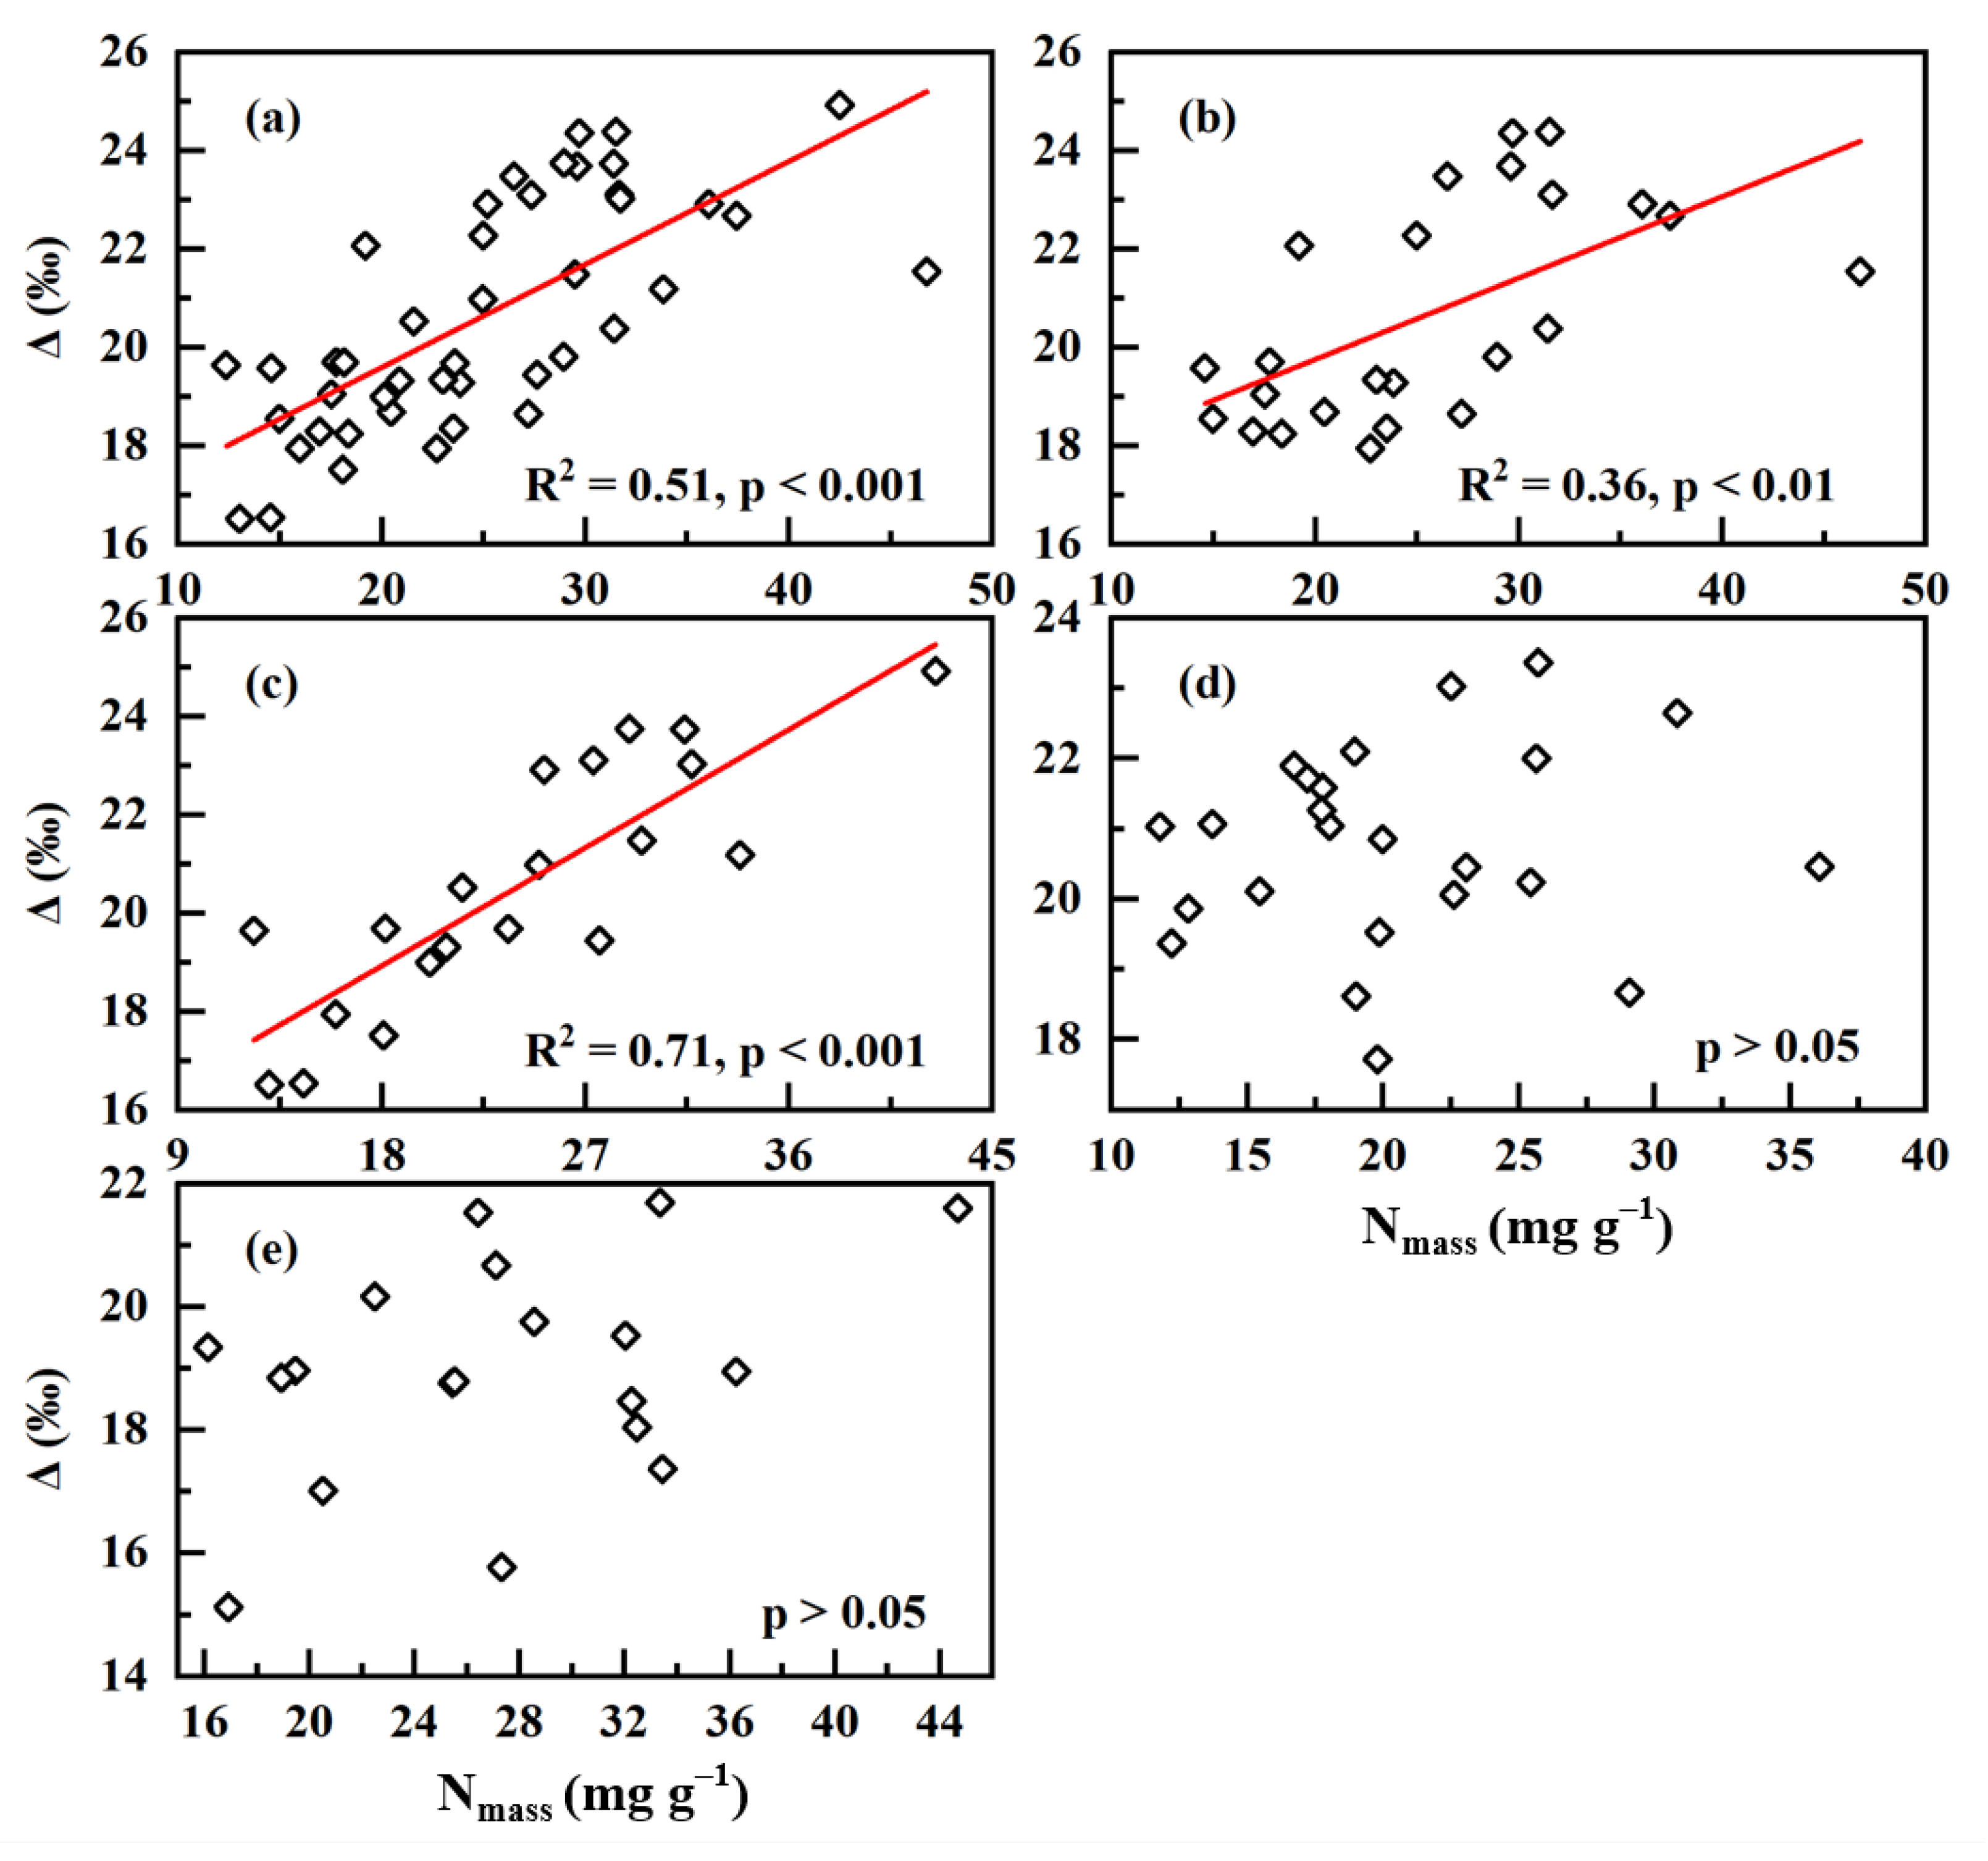
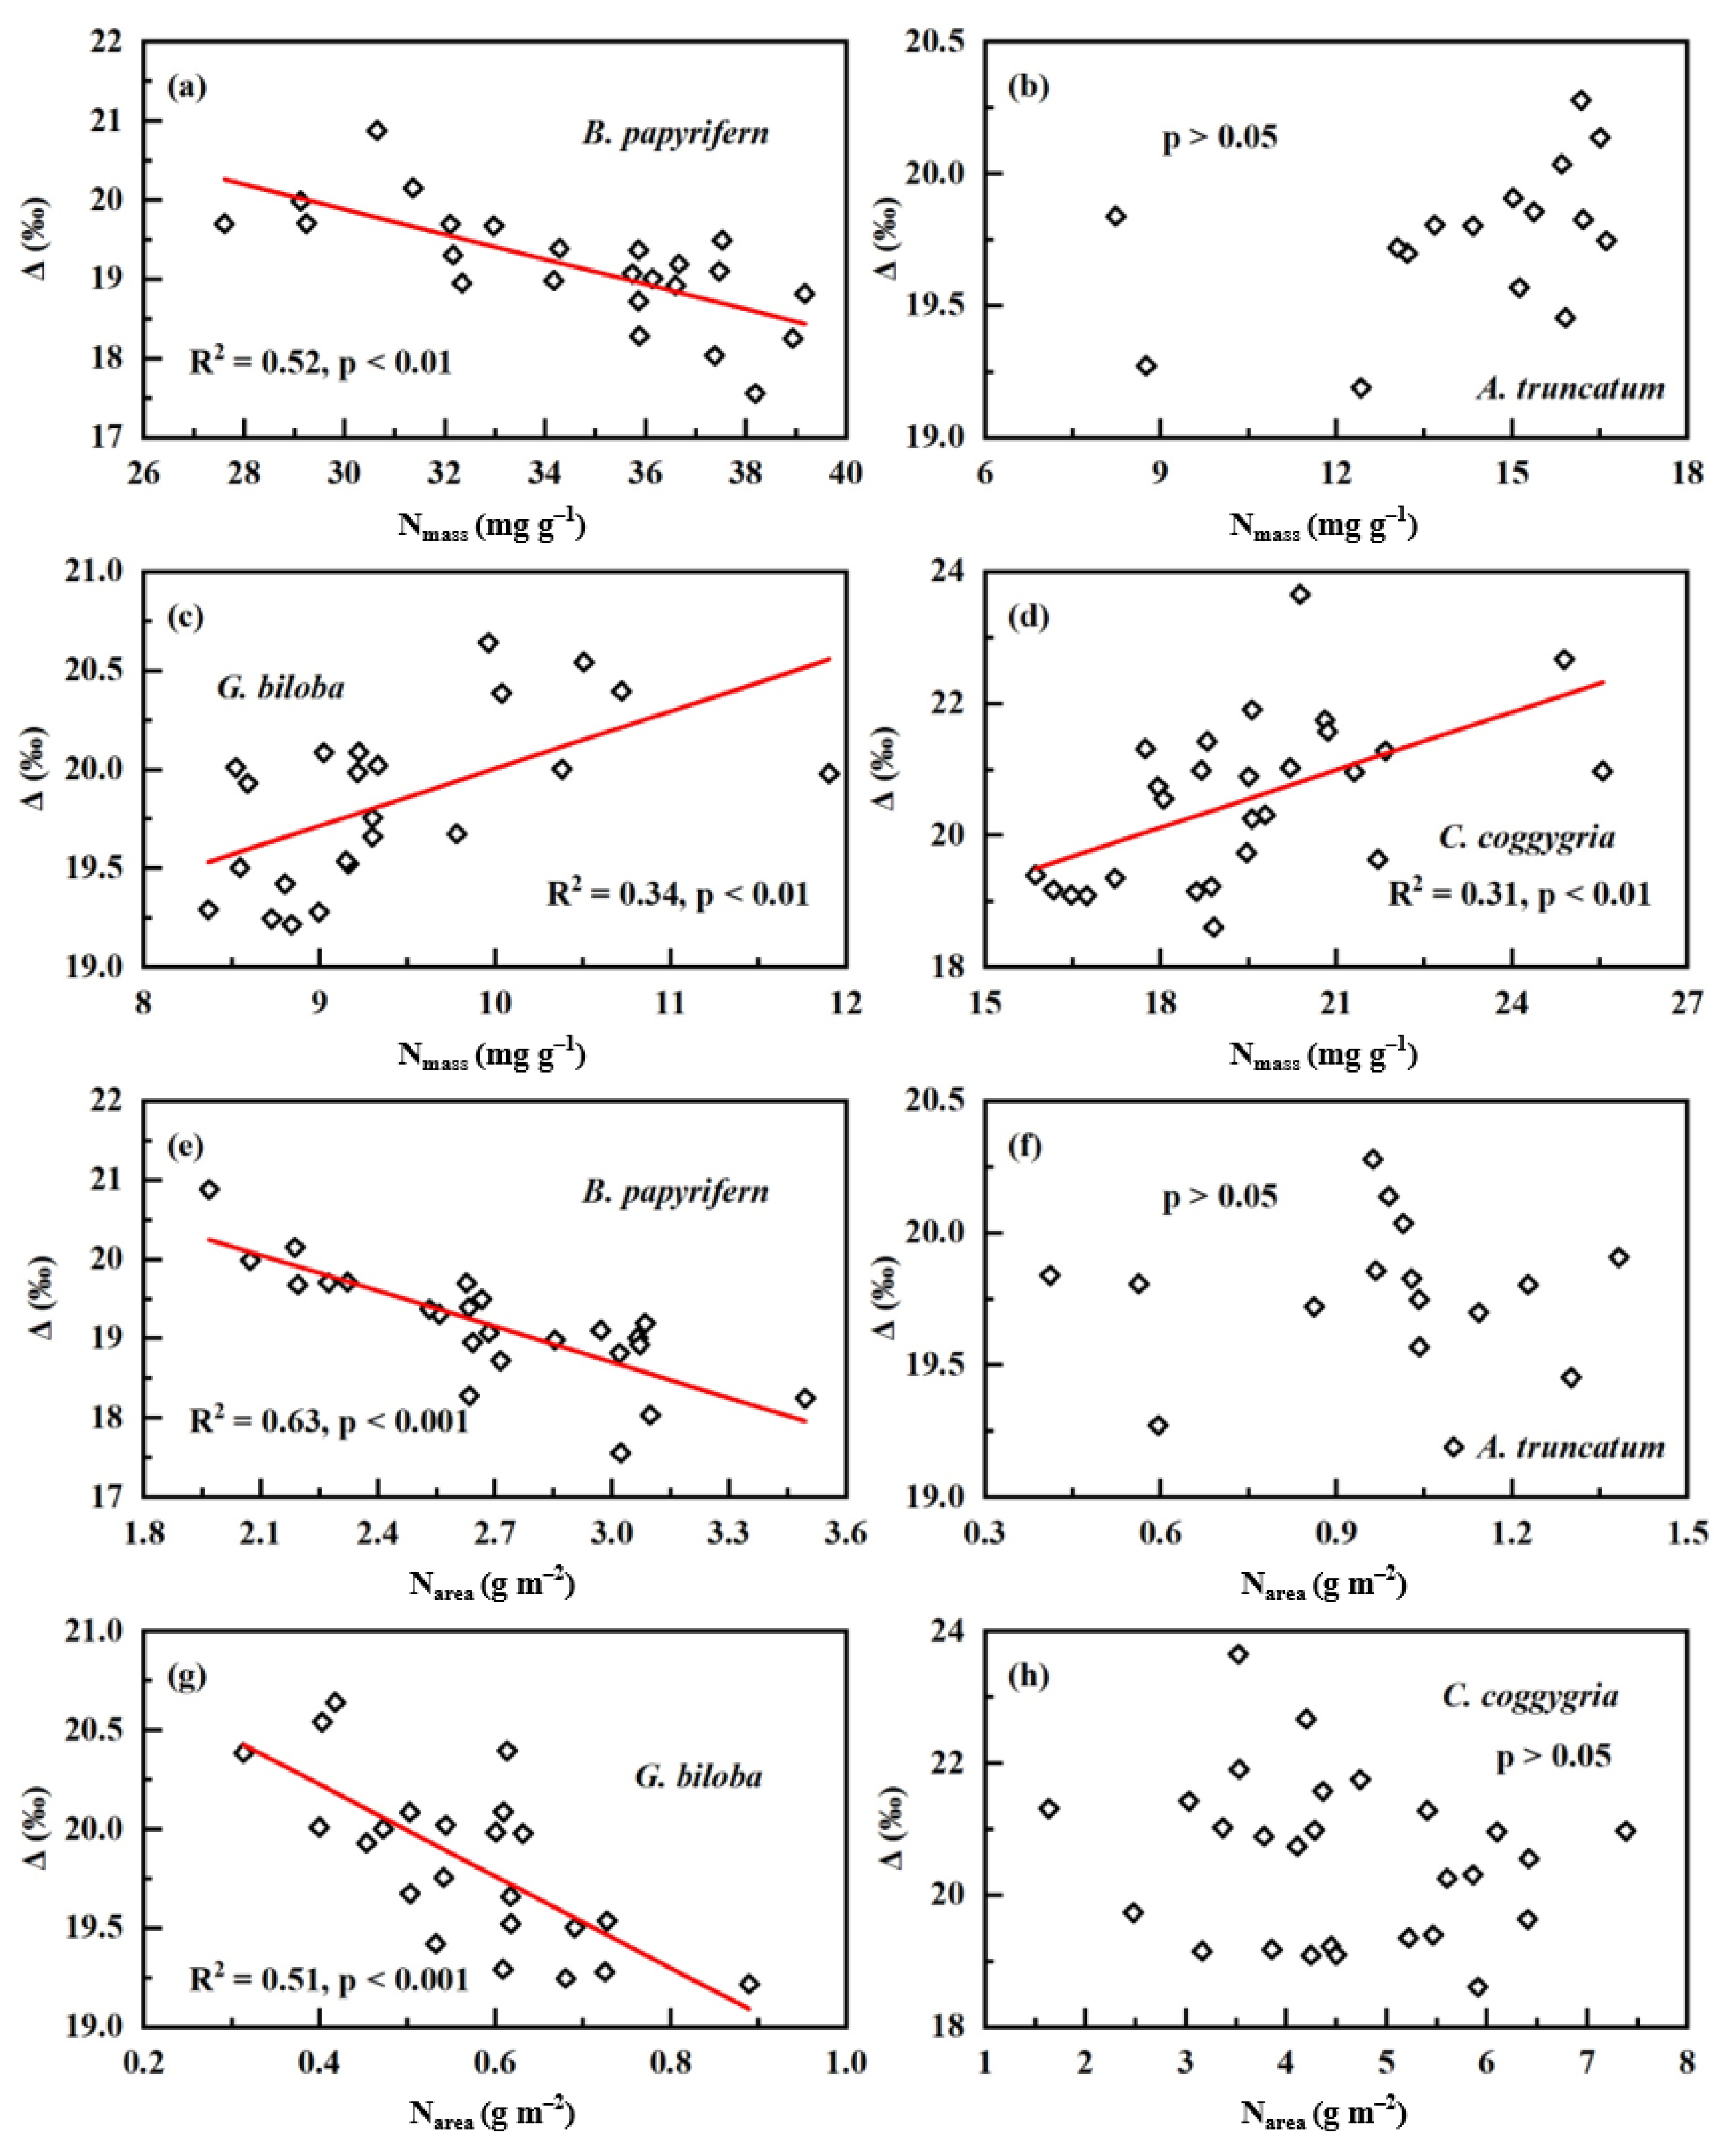
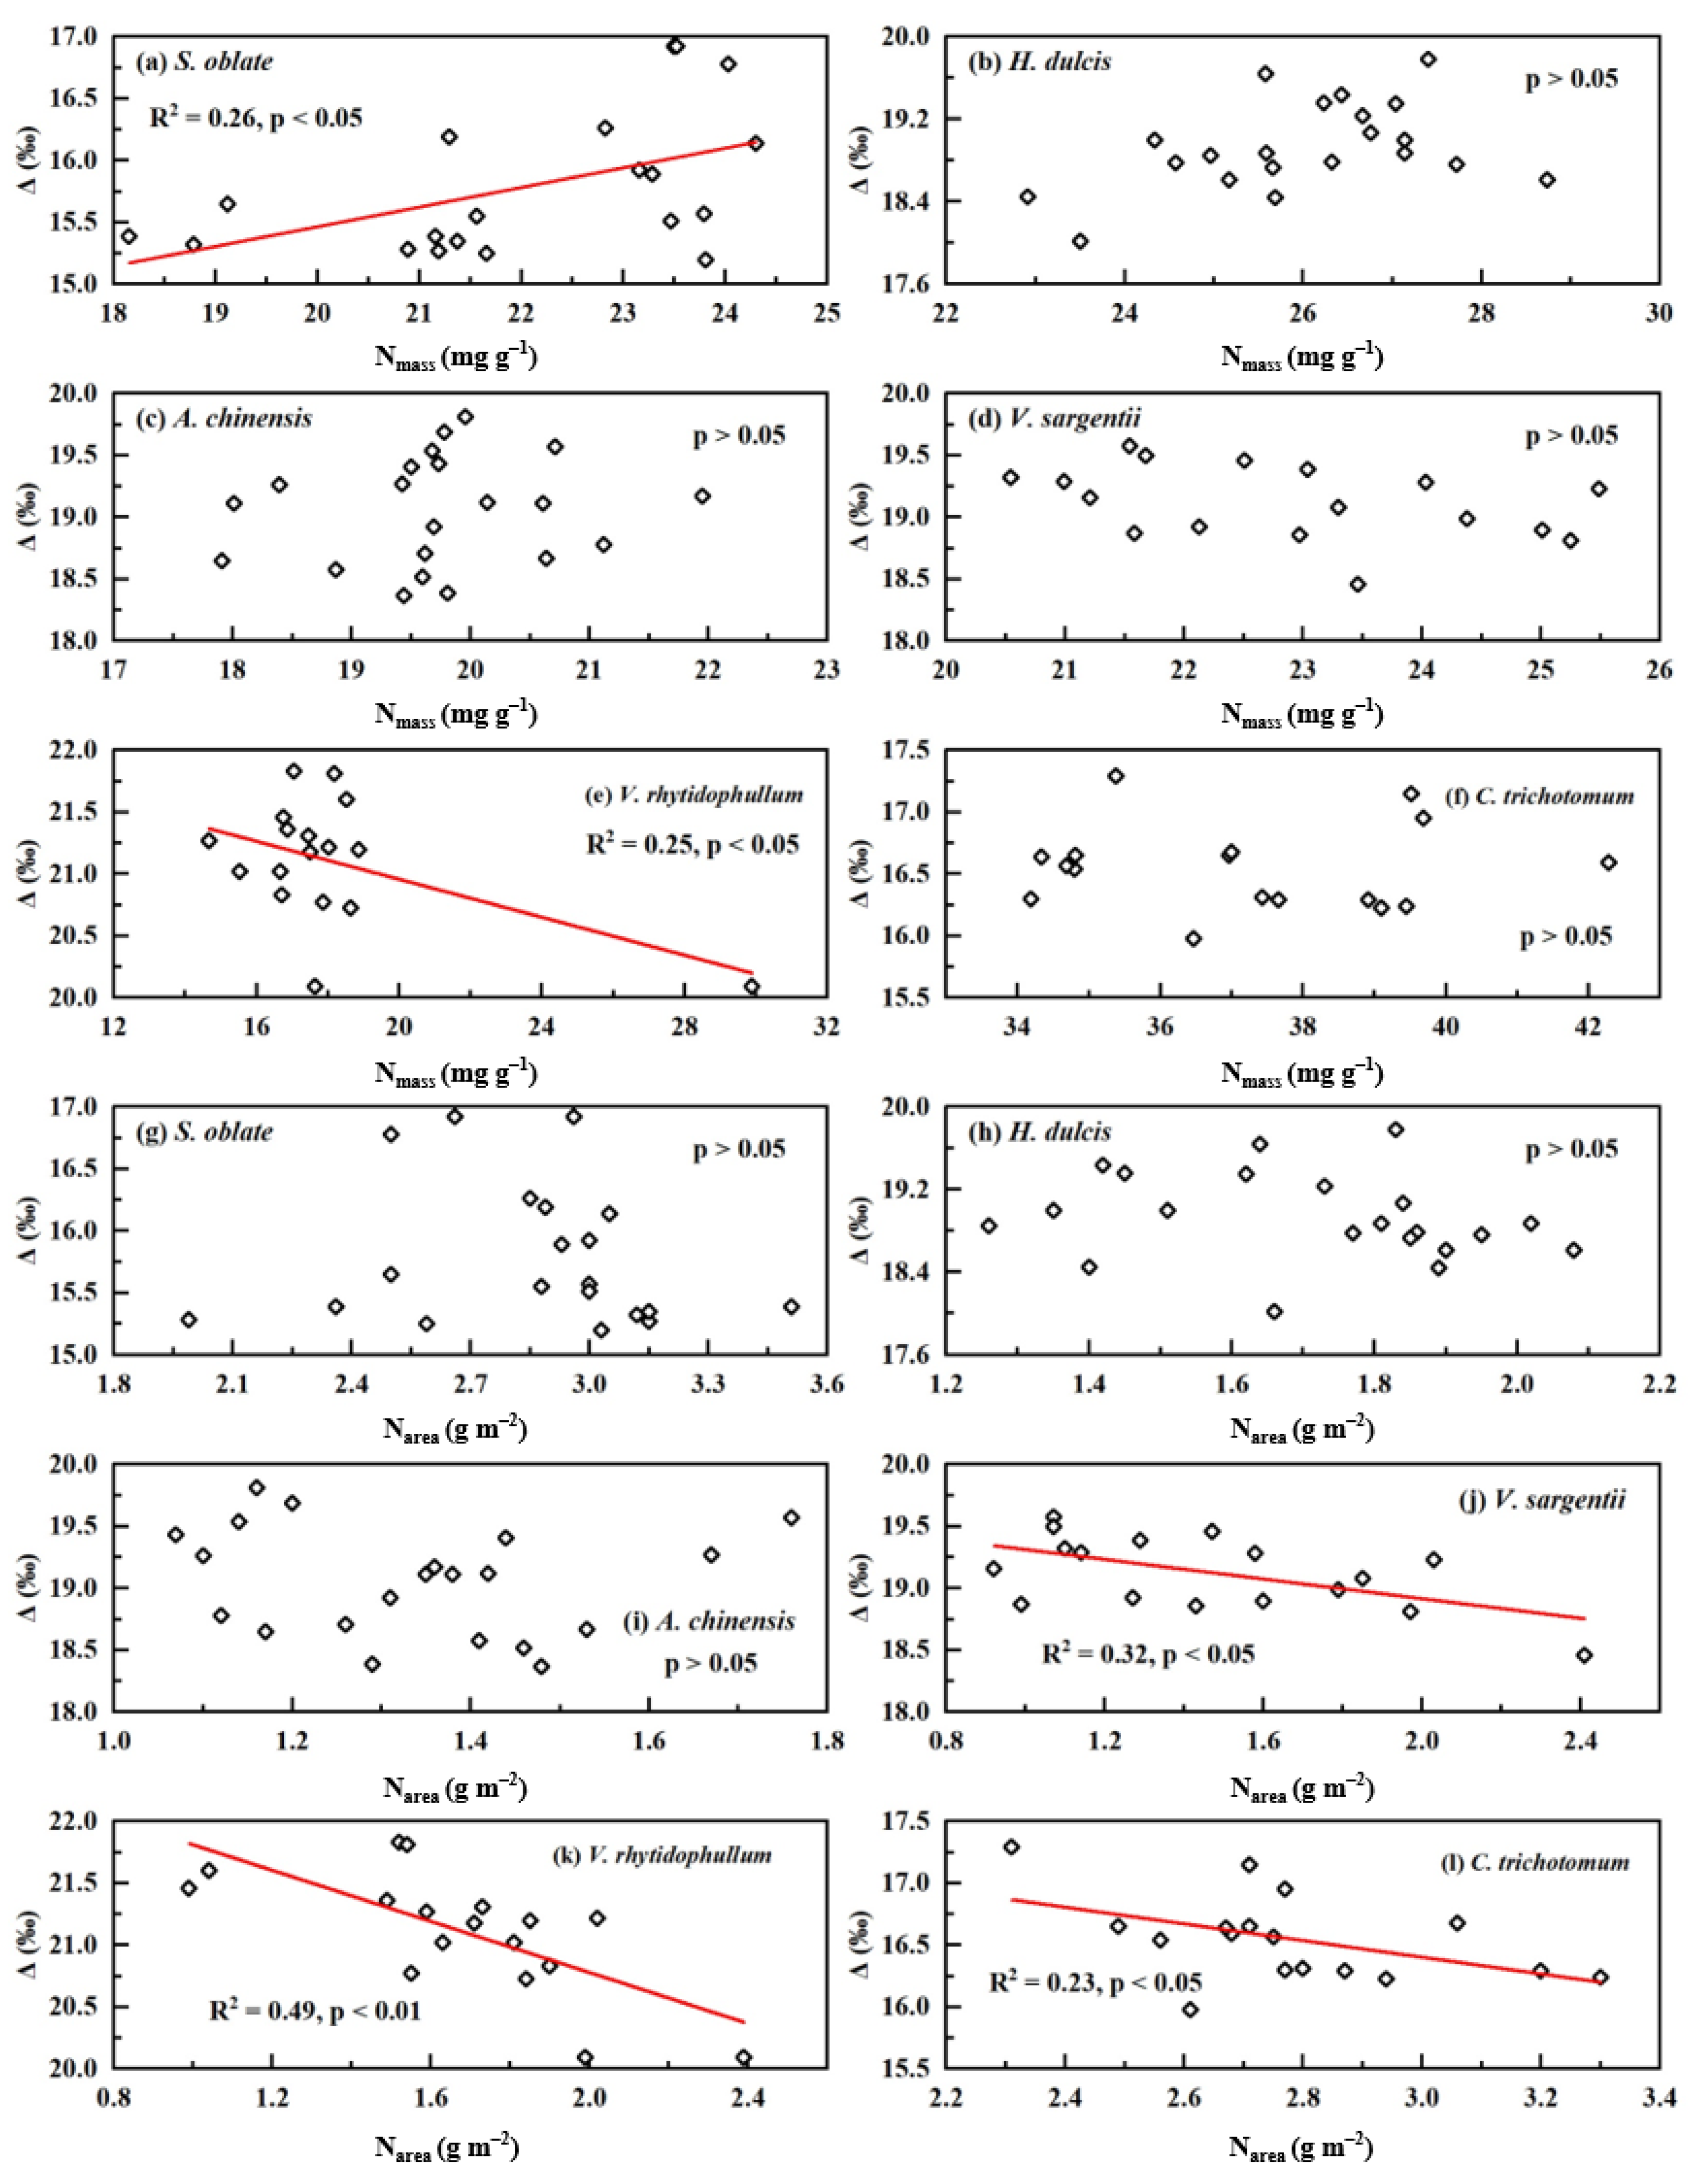
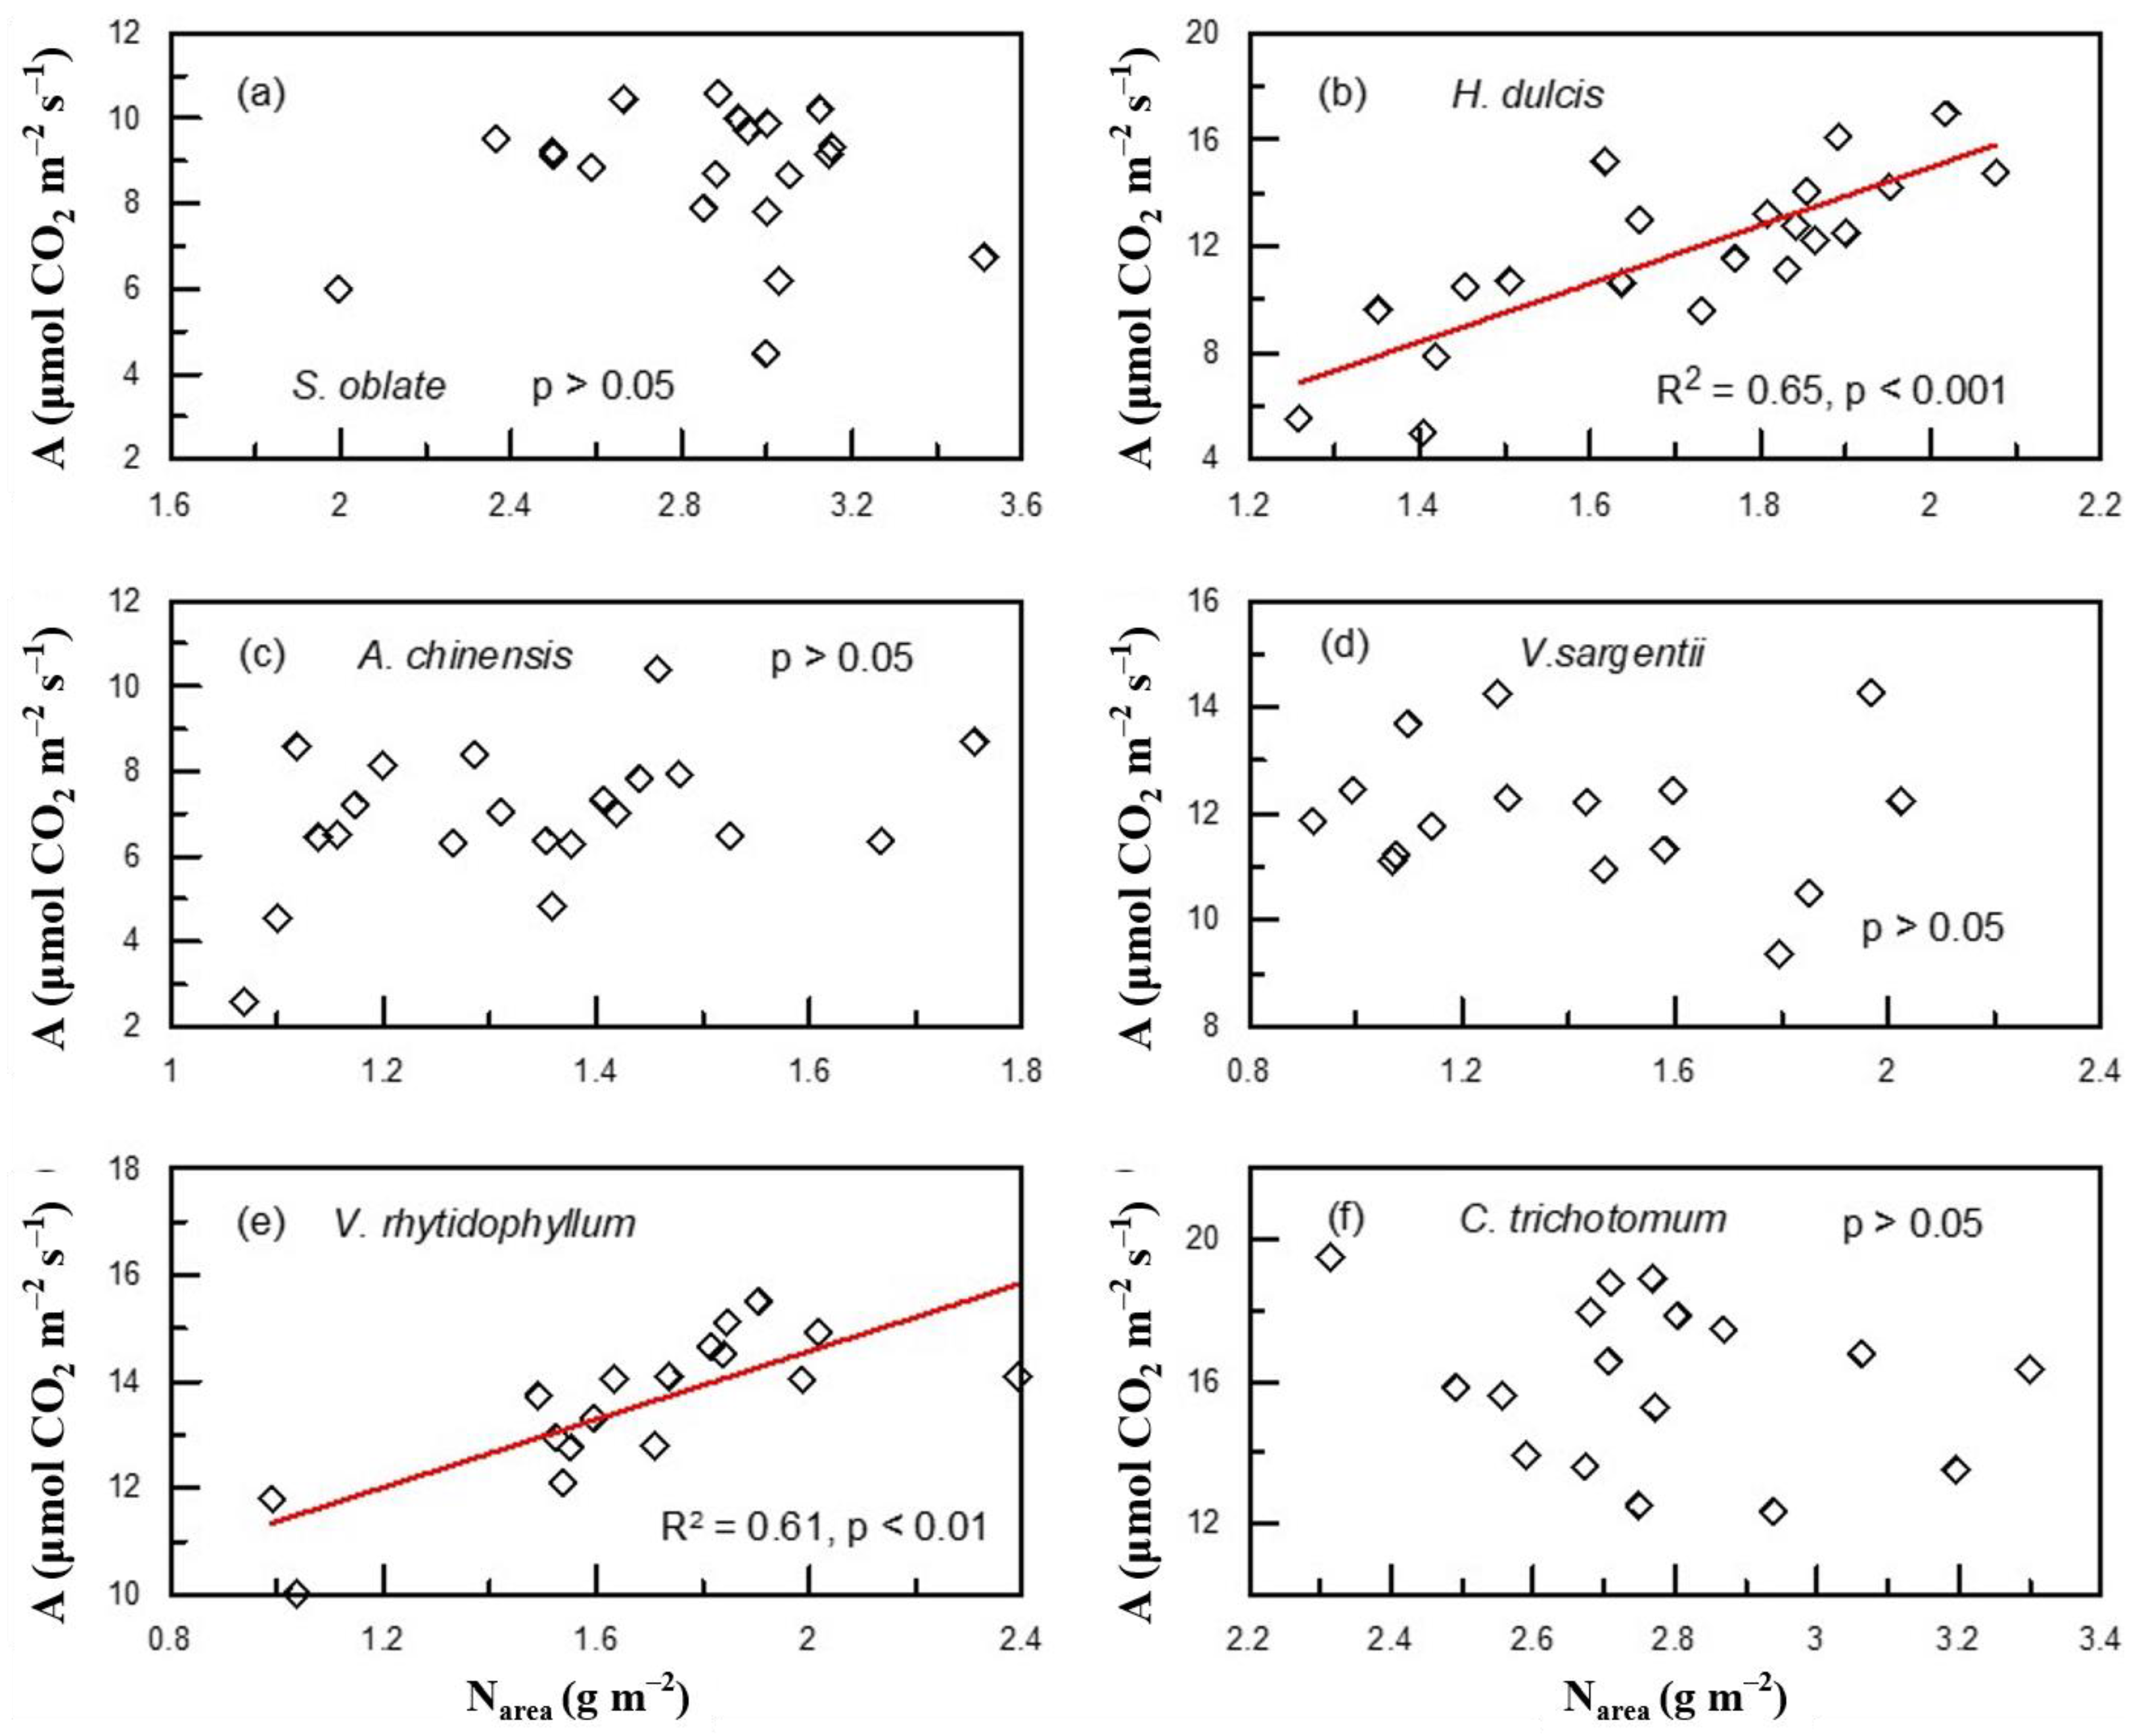
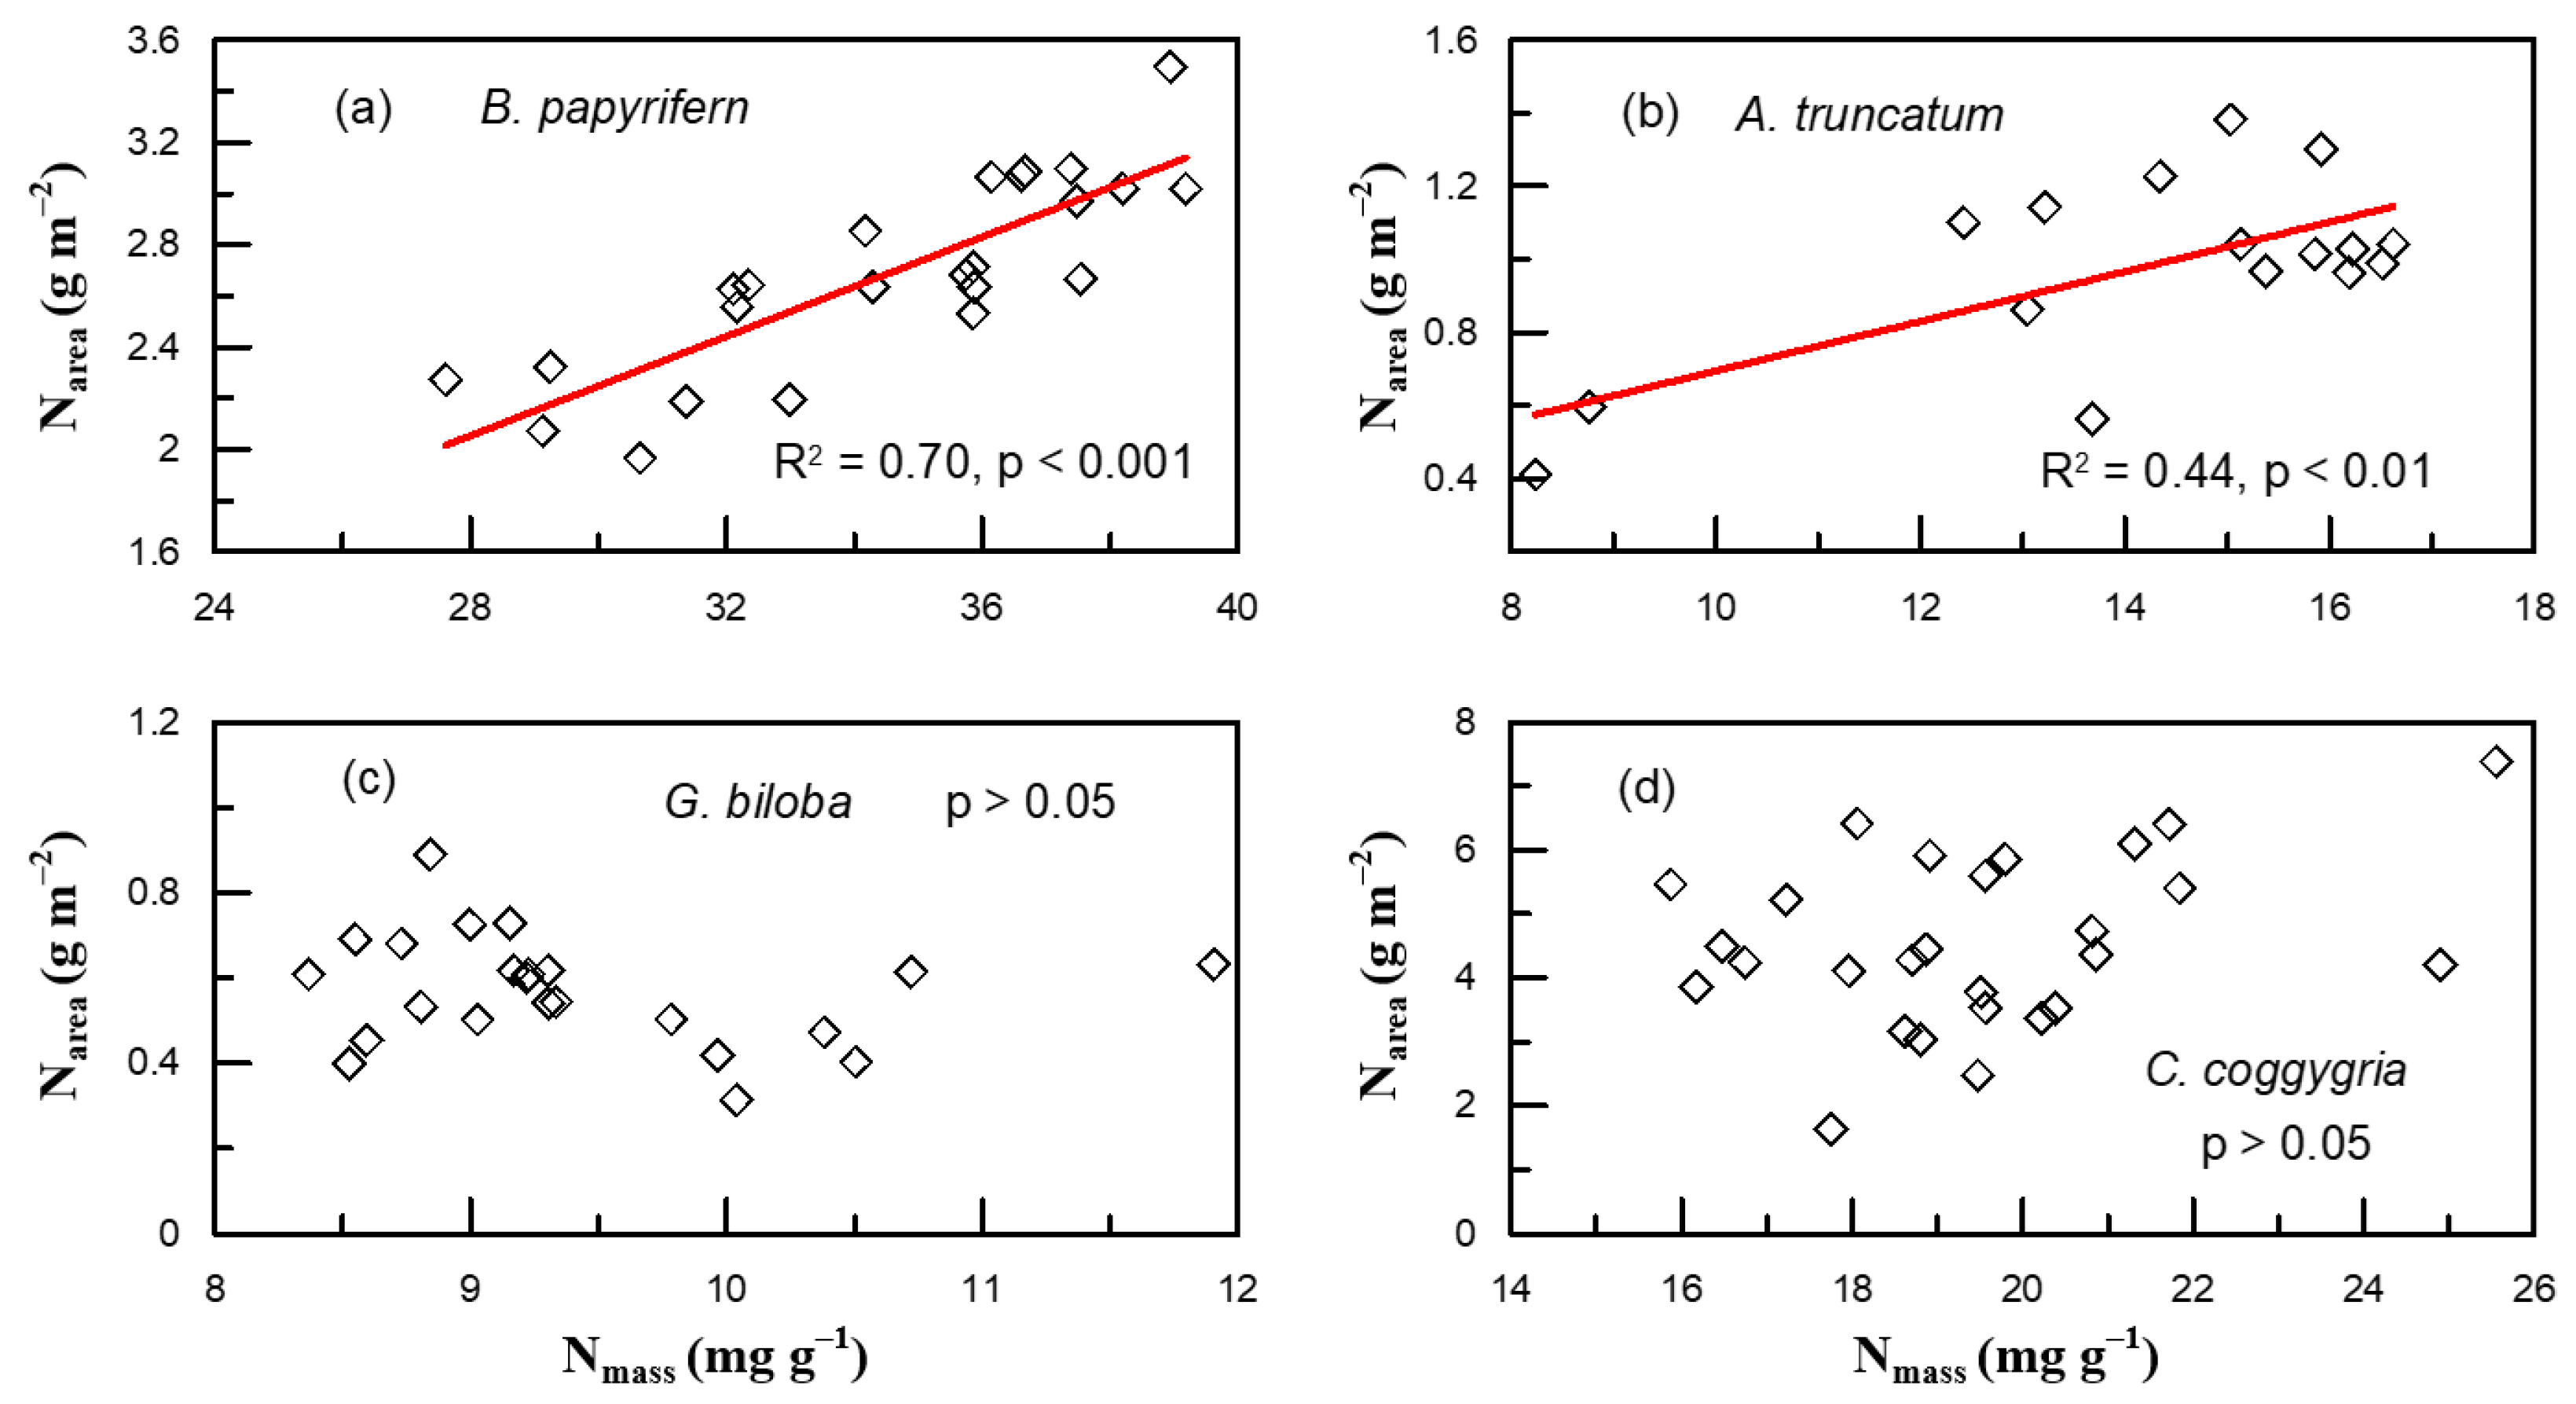
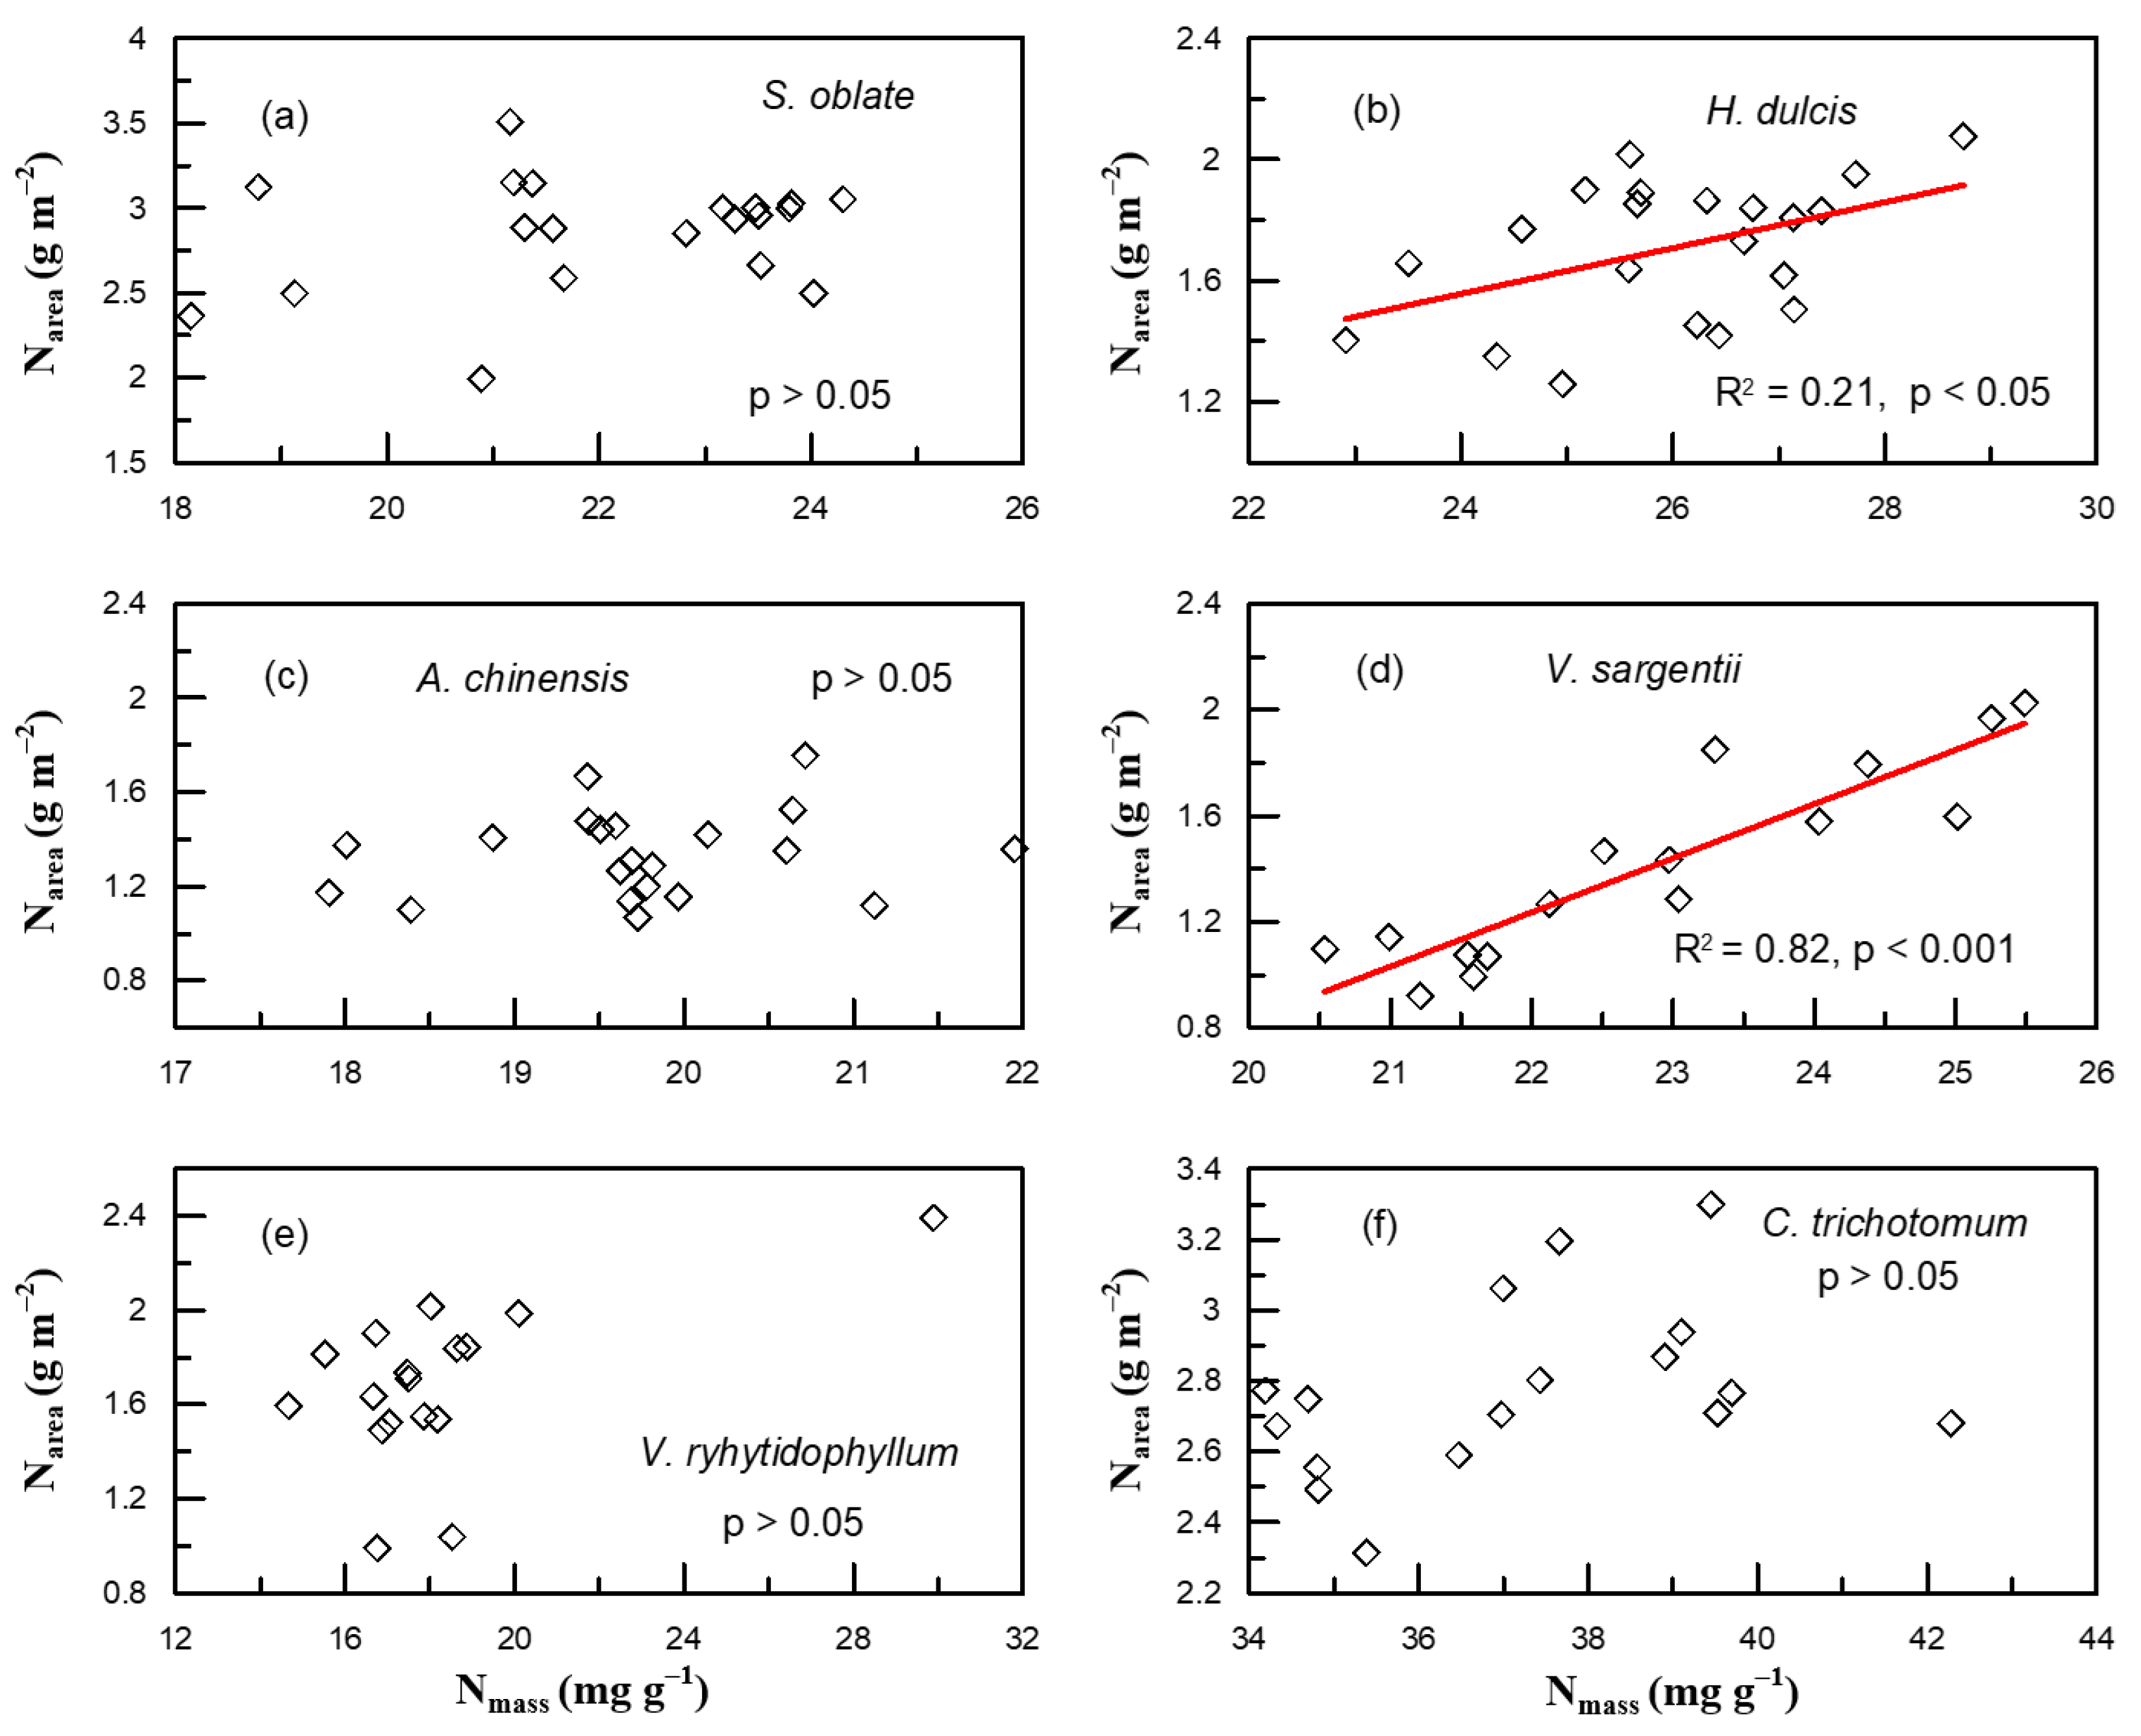
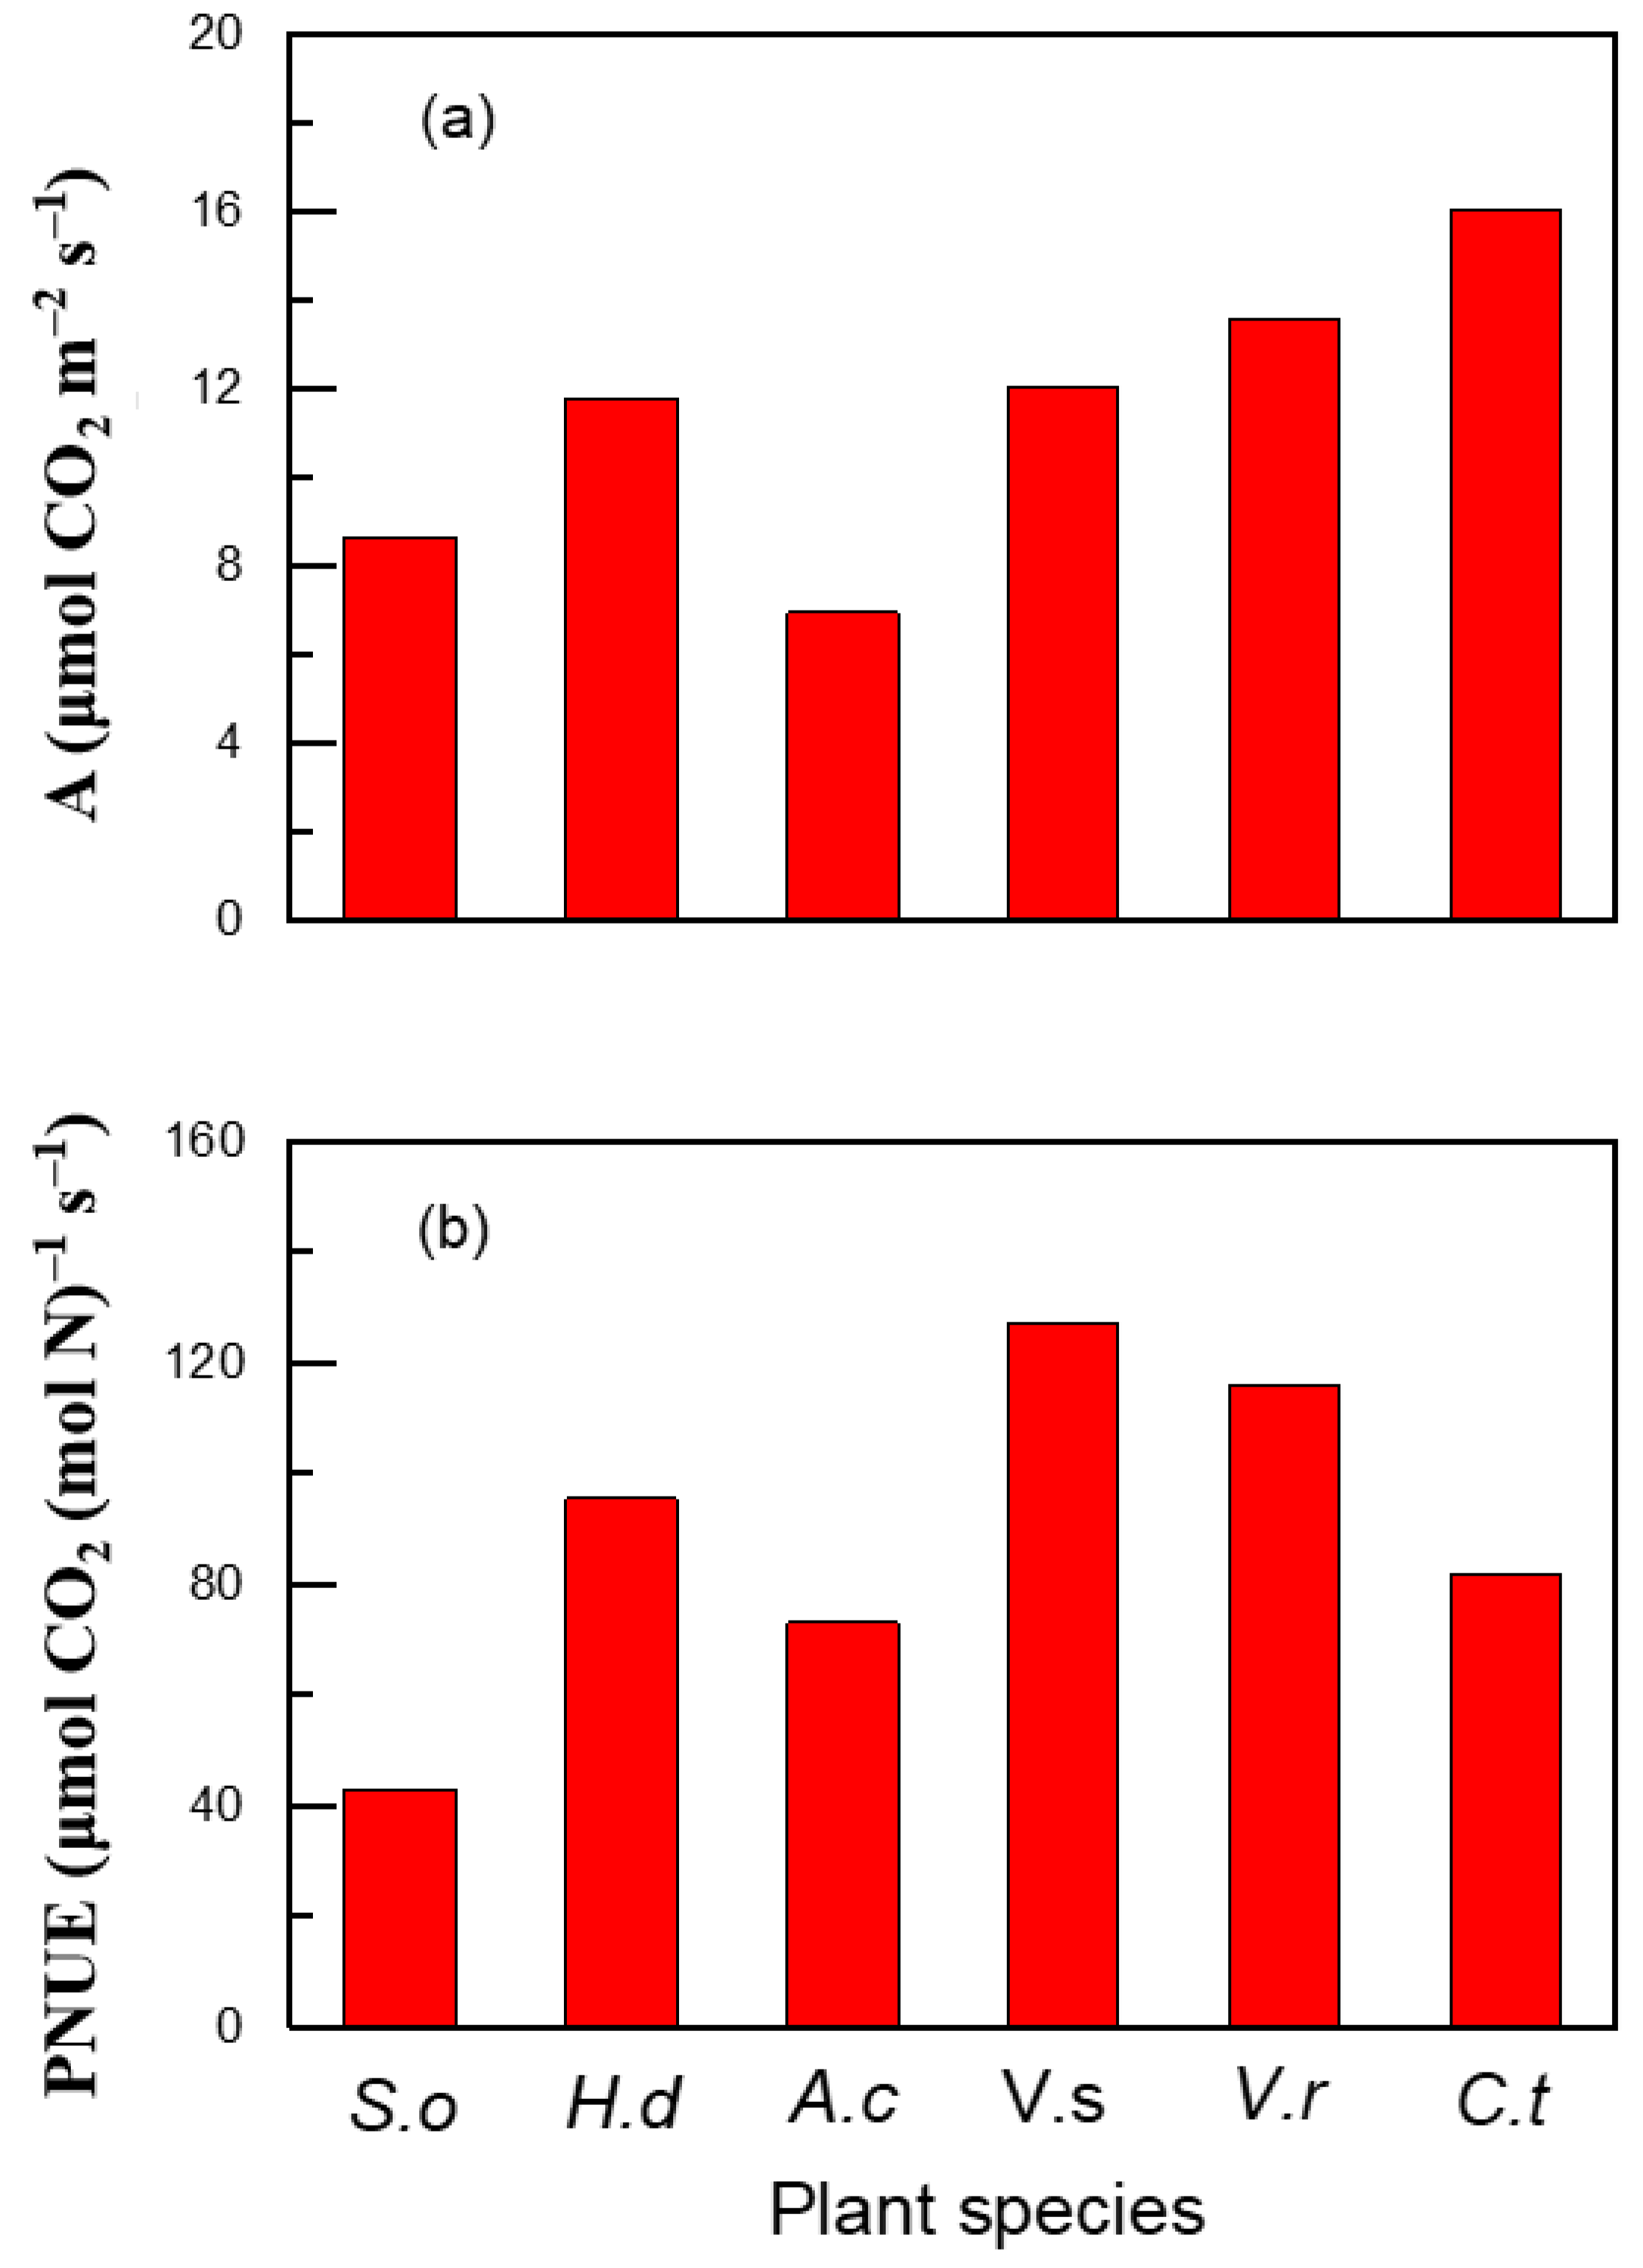
2. Results
3. Discussion
4. Materials and Methods
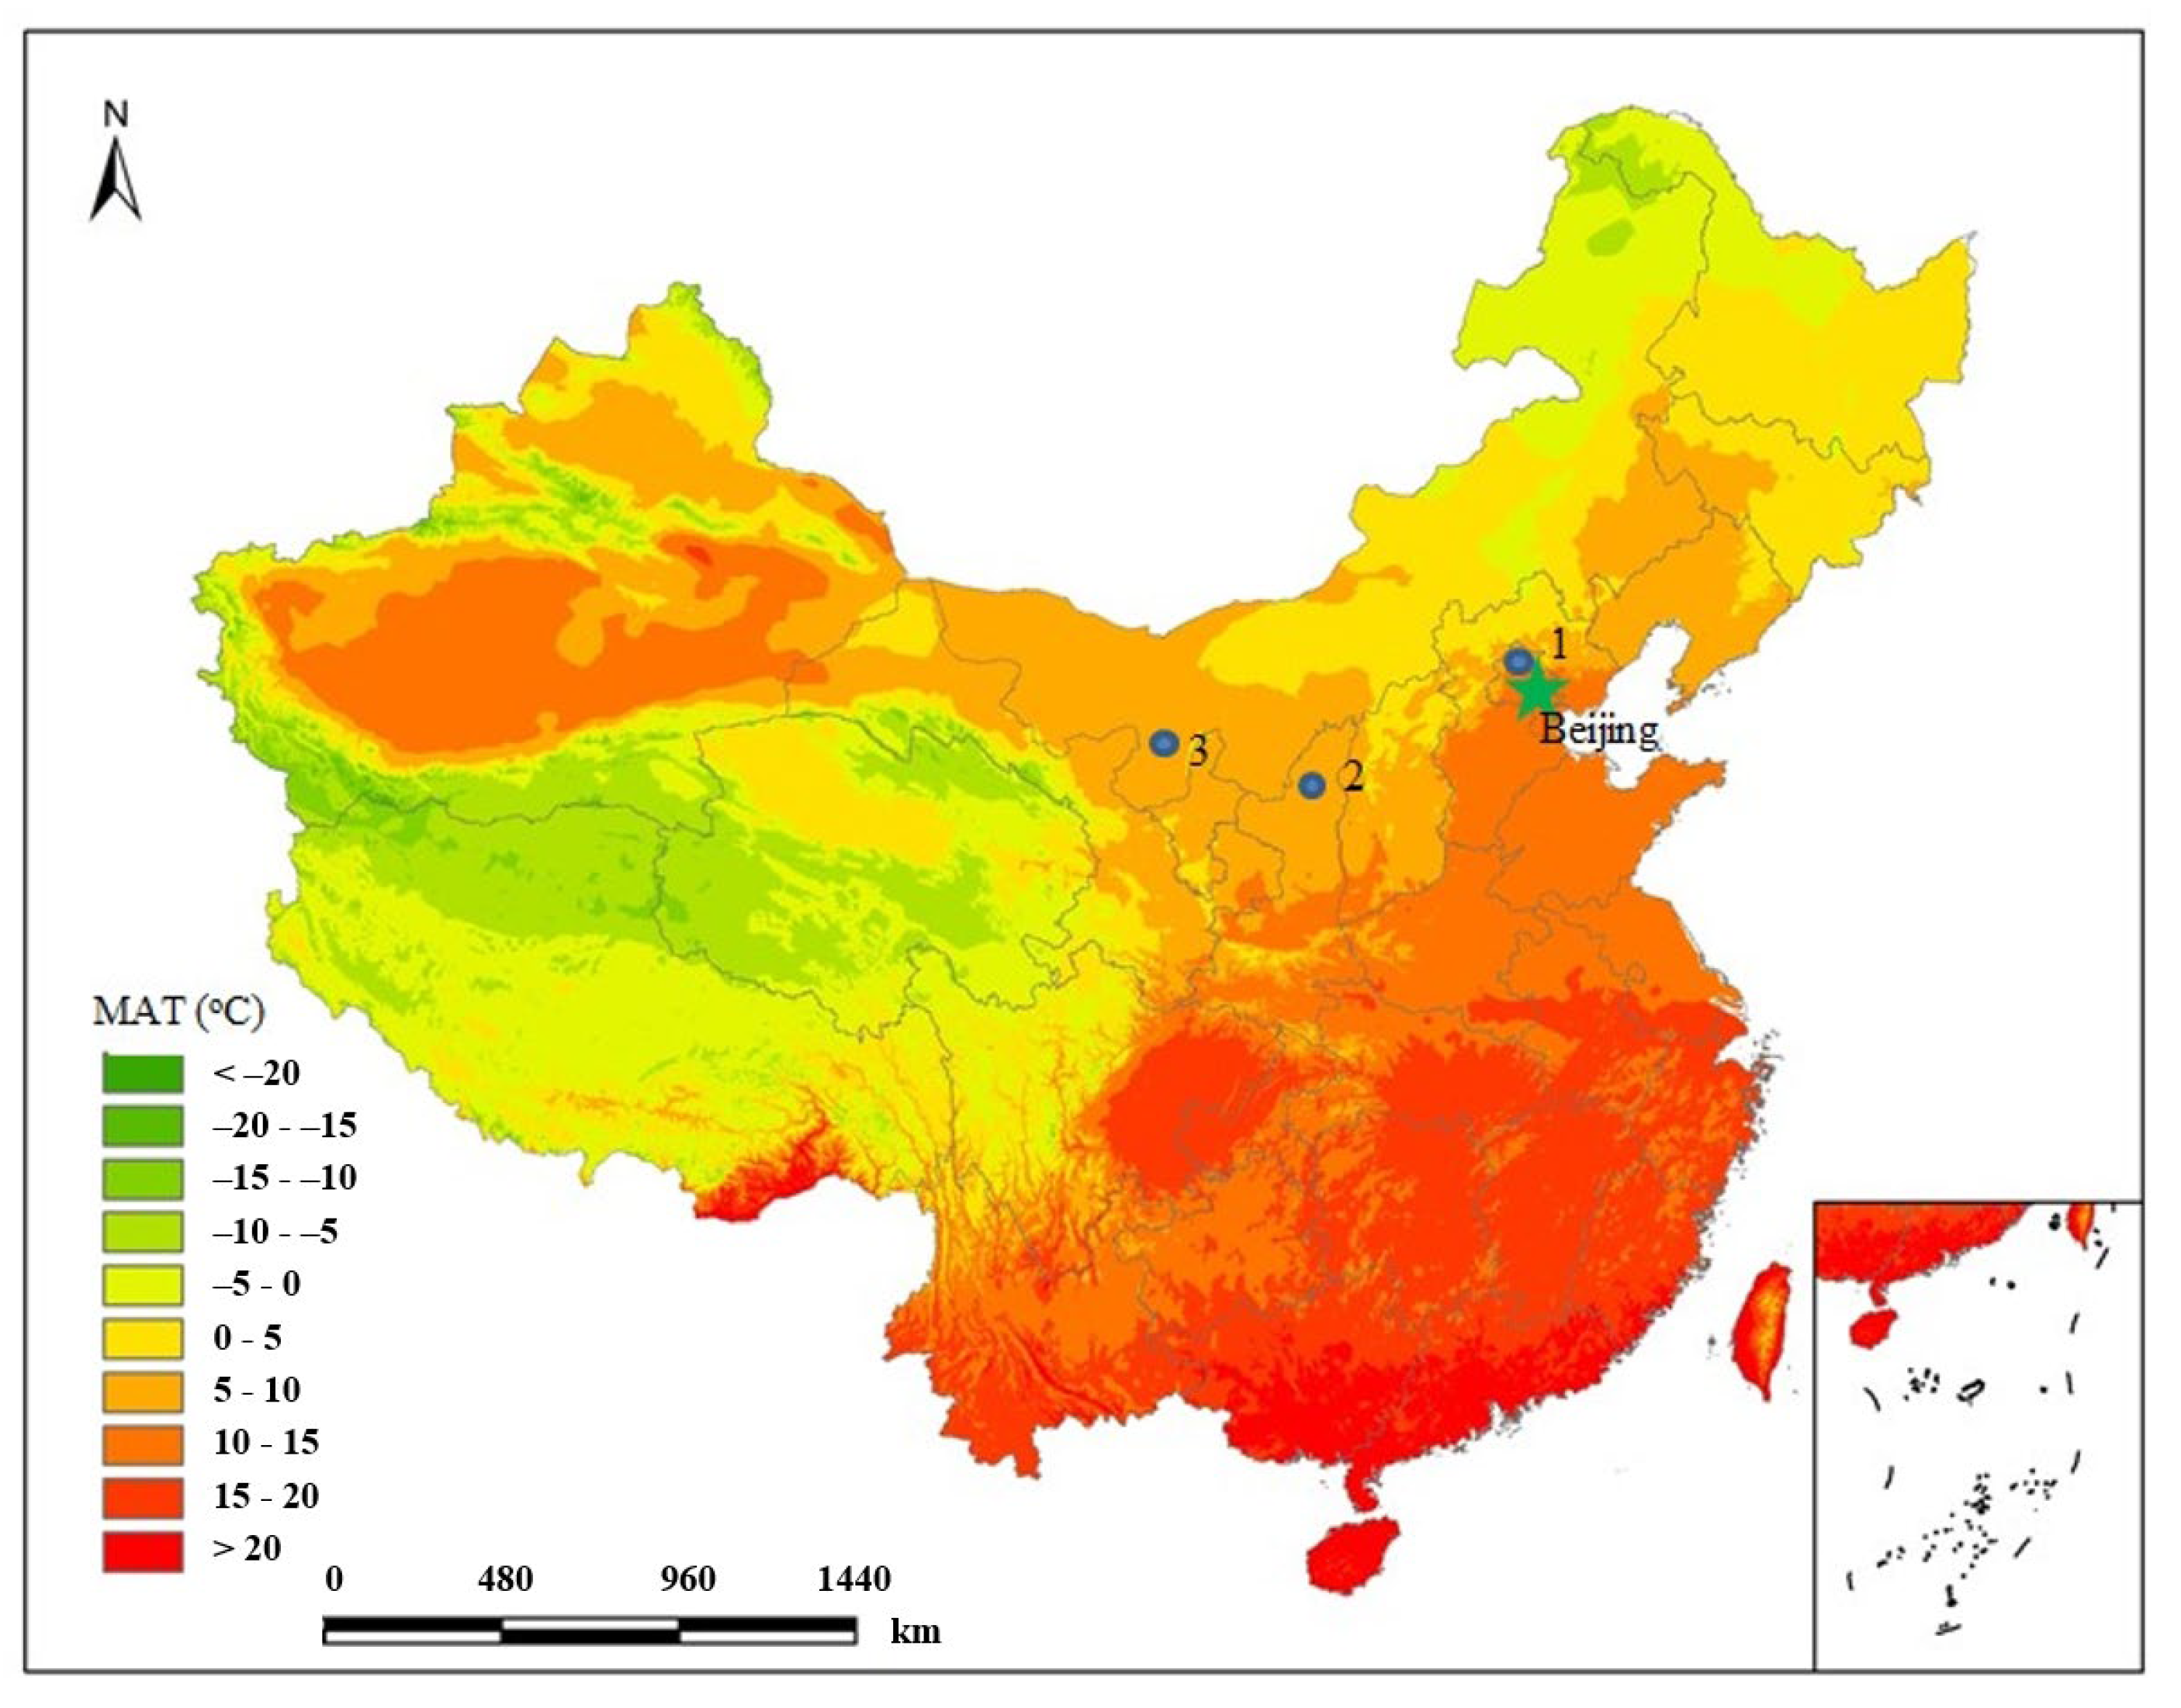
4.1. Plant Sampling Campaigns
4.2. Measurements of Leaf Gas-Exchange
4.3. Measurements of Leaf Morphology, N Concentrations and Carbon Isotope Ratios
4.4. Quantification of Leaf Protein
4.5. Statistical Analysis
5. Conclusions
Author Contributions
Funding
Data Availability Statement
Acknowledgments
Conflicts of Interest
Appendix A


| Species | Number of Samples | p | r |
|---|---|---|---|
| S. oblate | 16 | 0.812 ns | 0.065 |
| A. chinensis | 14 | 0.847 ns | 0.057 |
| V. sargentii | 16 | 1.000 ns | 0.000 |
| V. rhytidophyllum | 14 | 0.048 * | 0.536 |
| C. trichotomum | 10 | 0.845 ns | 0.071 |
References
- Farquhar, G.D.; Richards, R.A. Isotope composition of plant carbon correlates with water-use efficiency of wheat genotypes. Aus. J. Plant Phys. 1984, 11, 539–552. [Google Scholar] [CrossRef]
- Farquhar, G.D.; O’Leary, M.H.; Berry, J.A. On the relationship between carbon isotope discrimination and the intercellular carbon dioxide concentration in leaves. Aus. J. Plant Phys. 1982, 9, 121–137. [Google Scholar] [CrossRef]
- Busch, F.A.; Holloway-Phillips, M.; Stuart-Williams, H.; Farquhar, G.D. Revisiting carbon isotope discrimination in C-3 plants shows respiration rules when photosynthesis is low. Nat. Plant 2020, 6, 245–258. [Google Scholar] [CrossRef] [PubMed]
- Chen, Z.; Liu, X.; Cui, X.; Han, Y.; Wang, G.; Li, J. Evaluating the response of δ13C in Haloxylon ammodendron, a dominant C4 species in Asian desert ecosystems, to water and nitrogen addition as well as the availability of its δ13C as an indicator of water use efficiency. Biogeosciences 2021, 18, 2859–2870. [Google Scholar] [CrossRef]
- Evans, J.R.; Sharkey, T.D.; Berry, J.A.; Farquhar, G.D. Carbon isotope discrimination measured concurrently with gas exchange to investigate CO2 diffusion in leaves of higher plants. Funct. Plant Biol. 1986, 13, 281–292. [Google Scholar] [CrossRef] [Green Version]
- Liang, X.; Zhang, T.; Lu, X.; Ellsworth, D.S.; BassiriRad, H.; You, C.; Wang, D.; He, P.; Deng, Q.; Liu, H.; et al. Global response patterns of plant photosynthesis to nitrogen addition: A meta-analysis. Glob. Chang. Biol. 2020, 26, 3585–3600. [Google Scholar] [CrossRef]
- Bassi, D.; Menossi, M.; Mattiello, L. Nitrogen supply influences photosynthesis establishment along the sugarcane leaf. Sci. Rep. 2018, 8, 2327. [Google Scholar] [CrossRef] [Green Version]
- Körner, C.H.; Farquhar, G.D.; Wong, S.C. Carbon isotope discrimination by plants follows altitude and altitude trends. Oecologia 1991, 88, 30–40. [Google Scholar] [CrossRef]
- Yuan, Y.; Zhou, Z.; Zhang, S.; Zhao, Y.; Gao, Y.; Hou, F. Increasing reclamation ages drive shifts in carbon and nitrogen stoichiometry and natural isotopes from leaf-litter-root-soil continuum in a reclamation ecosystem, North China. J. Soils Sediments 2023, 23, 1806–1819. [Google Scholar] [CrossRef]
- Li, J.Z.; Wang, G.A.; Zhang, R.; Li, L. A negative relationship between foliar carbon isotope composition and mass-based nitrogen concentration on the eastern slope of Mount Gongga, China. PLoS ONE 2016, 11, e0166958. [Google Scholar] [CrossRef] [Green Version]
- Adams, M.A.; Turnbull, T.L.; Sprent, J.I.; Buchmann, N. Legumes are different: Leaf nitrogen, photosynthesis, and water use efficiency. Proc. Natl. Acad. Sci. USA 2016, 113, 4098–4103. [Google Scholar] [CrossRef] [Green Version]
- Prieto, I.; Querejeta, J.I.; Segrestin, J.; Volaire, F.; Roumet, C. Leaf carbon and oxygen isotopes are coordinated with the leaf economics spectrum in Mediterranean rangeland species. Funct. Ecol. 2018, 32, 612–625. [Google Scholar] [CrossRef]
- Du, B.; Zheng, J.; Ji, H.; Zhu, Y.; Yuan, J.; Wen, J.; Kang, H.; Liu, C. Stable carbon isotope used to estimate water use efficiency can effectively indicate seasonal variation in leaf stoichiometry. Ecol. Ind. 2021, 121, 107250. [Google Scholar] [CrossRef]
- Salazar-Tortosa, D.; Castro, J.; Villar-Salvador, P.; Viñegla, B.; Matıas, L.; Michelsen, A.; de Casas, R.R.; Querejeta, J.I. The “isohydric trap”: A proposed feedback between water shortage, stomatal regulation and nutrient acquisition drives differential growth and survival of European pines under climatic dryness. Glob. Chang. Biol. 2018, 24, 4069–4083. [Google Scholar] [CrossRef]
- Gouveia, C.S.S.; Gananca, J.F.T.; Slaski, J.; Lebot, V.; de Carvalho, M.A.A.P. Stable isotope natural abundances (δ13C and δ15N. and carbon-water relations as drought stress mechanism response of taro (Colocasia esculenta L. Schott). J. Plant Physiol. 2018, 232, 100–106. [Google Scholar] [CrossRef]
- Wang, G.A.; Feng, X.; Han, J.; Zhou, L.; Tan, W.; Su, F. Paleovegetation reconstruction using δ13C of soil organic matter. Biogeosciences 2008, 5, 1325–1337. [Google Scholar] [CrossRef] [Green Version]
- Shi, W.; Wang, G.; Han, W. Altitudinal variation in leaf nitrogen concentration on the eastern slope of Mount Gongga on the Tibetan Plateau, China. PLoS ONE 2012, 7, e44628. [Google Scholar] [CrossRef] [Green Version]
- Diefendorf, A.F.; Mueller, K.E.; Wing, S.L.; Koch, P.L.; Freeman, K.H. Global patterns in leaf 13C discrimination and implications for studies of past and future climate. Proc. Natl. Acad. Sci. USA 2010, 107, 5738–5743. [Google Scholar] [CrossRef] [Green Version]
- Kohn, M.J. Carbon isotope compositions of terrestrial C3 plants as indicators of (paleo) ecology and (paleo) climate. Proc. Natl. Acad. Sci. USA 2010, 107, 19691–19695. [Google Scholar] [CrossRef] [Green Version]
- Chen, Z.X.; Wang, G.A.; Jia, Y.F. Foliar δ13C showed no altitudinal trend in an arid region and atmospheric pressure exerted a negative effect on plant δ13C. Front. Plant Sci. 2017, 8, 1070. [Google Scholar] [CrossRef] [PubMed]
- Chen, C.J.; Jia, Y.F.; Chen, Y.Z.; Mehmood, I.; Fang, Y.T.; Wang, G.A. Nitrogen isotopic composition of plants and soil in an arid mountainous terrain: South slope versus north slope. Biogeosciences 2018, 15, 369–377. [Google Scholar] [CrossRef] [Green Version]
- Cernusak, L.A.; Ubierna, N.; Winter, K.; Holtum, J.A.M.; Marshall, J.D.; Farquhar, G.D. Environmental and physiological determinants of carbon isotope discrimination in terrestrial plants. New Phytol. 2013, 20, 950–965. [Google Scholar] [CrossRef] [PubMed]
- Wang, G.A.; Feng, X. Response of plants’ water use efficiency to increasing atmospheric CO2 concentration. Environ. Sci. Technol. 2012, 46, 8610–8620. [Google Scholar] [CrossRef] [PubMed]
- Abraha, M.; Gelfand, I.; Hamilton, S.K.; Shao, C.L.; Su, Y.J.; Robertson, G.P.; Chen, J.Q. Ecosystem water-use efficiency of annual corn and perennial grasslands: Contributions from land-use history and species composition. Ecosystems 2016, 19, 1001–1012. [Google Scholar] [CrossRef]
- Ma, W.; Tcherkez, G.; Wang, X.; Schaufele, R.; Schnyder, H.; Yang, Y.; Gong, X. Accounting for mesophyll conductance substantially improves 13C-based estimates of intrinsic water-use efficiency. New Phytol. 2021, 229, 1326–1338. [Google Scholar] [CrossRef]
- Gong, X.; Ma, W.; Yu, Y.; Fang, K.; Yang, Y.; Tcherkez, G.; Adams, M.A. Overestimated gains in water-use efficiency by global forests. Glob. Chang. Biol. 2022, 28, 4923–4934. [Google Scholar] [CrossRef]
- Kerkhoff, A.J.; Fagan, W.F.; Elser, J.J.; Enquist, B.J. Phylogenetic and growth form variation in the scaling of nitrogen and phosphorus in the seed plants. Am. Nat. 2006, 168, 103–122. [Google Scholar] [CrossRef] [Green Version]
- Fageria, N.K. Dry matter yield and shoot nutrient concentrations of upland rice, common bean, corn, and soybean grown in rotation on an oxisol. Commun. Soil Sci. Plant Anal. 2004, 35, 961–974. [Google Scholar] [CrossRef]
- Wu, P.; Zhou, H.; Cui, Y.; Zhao, W.; Hou, Y.; Zhu, J.; Ding, F. Stoichiometric characteristics of leaf nutrients in Karst plant species during natural restoration in Maolan national nature reserve, Guizhou, China. J. Sustain. For. 2023, 42, 95–119. [Google Scholar] [CrossRef]
- Field, C.; Merino, J.; Mooney, H. Compromises between water use efficiency and nitrogen-use efficiency in five species of California evergreens. Oecologia 1983, 60, 384–389. [Google Scholar] [CrossRef]
- Zhong, C.; Jian, S.; Huang, J.; Jin, Q.; Cao, X. Trade-off of within-leaf nitrogen allocation between photosynthetic nitrogen-use efficiency and water deficit stress acclimation in rice (Oryza sativa L.). Plant Phys. Biochem. 2019, 135, 41–50. [Google Scholar] [CrossRef]
- Yang, K.; Huang, Y.; Yang, J.; Yu, L.; Hu, Z.; Sun, W.; Zhang, Q. The determiner of photosynthetic acclimation induced by biochemical limitation under elevated CO2 in japonica rice. J. Plant Phys. 2023, 280, 153889. [Google Scholar] [CrossRef]
- Miller, A.J.; Fan, X.; Shen, Q.; Smith, S.J. Amino acids and nitrate as signals for the regulation of nitrogen acquisition. J. Exp. Bot. 2008, 59, 111–119. [Google Scholar] [CrossRef]
- Schwember, A.R.; Schulze, J.; del Pozo, A.; Cabeza, R.A. Regulation of symbiotic nitrogen fixation in legume root nodules. Plants 2019, 8, 333. [Google Scholar] [CrossRef] [Green Version]
- Vitousek, P.M.; Field, C.B.; Matson, P.A. Variation in foliar δ13C in Hawaiian Metrosidero spolymorpha: A case of internal resistance? Oecologia 1990, 84, 362–370. [Google Scholar] [CrossRef]
- Evans, J.R. Photosynthesis and nitrogen relationships in leaves of C3 plants. Oecologia 1989, 78, 9–19. [Google Scholar] [CrossRef]
- von Caemmerer, S.; Evans, J.R. Determination of the average partial pressure of CO2 in chloroplast from leaves of several C3 plants. Funct. Plant Biol. 1991, 18, 287–305. [Google Scholar] [CrossRef]
- Gillon, J.S.; Yakir, D. Internal conductance to CO2 diffusion and C18OO discrimination in C3 leaves. Plant Physiol. 2000, 123, 201–213. [Google Scholar] [CrossRef] [Green Version]
- Flexas, J.; Ribas-Carbó, M.; Diaz-Espejo, A.; Galmés, J.; Medrano, H. Mesophyll conductance to CO2: Current knowledge and future prospects. Plant Cell Environ. 2008, 31, 602–621. [Google Scholar] [CrossRef]
- Gu, L.; Sun, Y. Artefactual responses of mesophyll conductance to CO2 and irradiance estimated with the variable J and online isotope discrimination methods. Plant Cell Environ. 2013, 37, 1231–1249. [Google Scholar] [CrossRef]
- Barbour, M.M.; Evans, J.R.; Simonin, K.A.; von Caemmerer, S. Online CO2 and H2O oxygen isotope fractionation allows estimation of mesophyll conductance in C4 plants, and reveals that mesophyll conductance decreases as leaves age in both C4 and C3 plants. New Phytol. 2016, 210, 875–889. [Google Scholar] [CrossRef] [PubMed] [Green Version]
- Xiong, D.; Liu, X.; Liu, L.; Douthe, C.; Li, Y.; Peng, S.; Huang, J. Rapid responses of mesophyll conductance to changes of CO2 concentration, temperature and irradiance are affected by N supplements in rice. Plant Cell Environ. 2015, 38, 2541–2550. [Google Scholar] [CrossRef] [PubMed]
- Xiong, D.; Flexas, J.; Yu, T.; Peng, S.; Huang, J. Leaf anatomy mediates coordination of leaf hydraulic conductance and mesophyll conductance to CO2 in Oryza. New Phytol. 2016, 213, 572–583. [Google Scholar] [CrossRef] [PubMed]
- Yamori, W.; Kusumi, K.; Iba, K.; Terashima, I. Increased stomatal conductance induces rapid changes to photosynthetic rate in response to naturally fluctuating light conditions in rice. Plant Cell Environ. 2020, 43, 1230–1240. [Google Scholar] [CrossRef]
- Han, J.M.; Meng, H.F.; Wang, S.Y.; Jiang, C.D.; Liu, F.; Zhang, W.F.; Zhang, Y.L. Variability of mesophyll conductance and its relationship with water use efficiency in cotton leaves under drought pretreatment. J. Plant Phys. 2016, 194, 61–71. [Google Scholar] [CrossRef]
- Voelker, S.L.; Brooks, J.R.; Meinzer, F.C.; Anderson, R.; Bader, M.K.F.; Battipaglia, G.; Becklin, K.M.; Beerling, D.; Bert, D.; Betancourt, J.L.; et al. A dynamic leaf gas-exchange strategy is conserved in woody plants under changing ambient CO2: Evidence from carbon isotope discrimination in paleo and CO2 enrichment studies. Glob. Chang. Biol. 2016, 22, 889–902. [Google Scholar] [CrossRef]
- Wang, B.; Cai, W.; Li, J.; Wan, Y.; Li, Y.; Guo, C.; Wilkes, A.; You, S.; Qin, X.; Gao, Q.; et al. Leaf photosynthesis and stomatal conductance acclimate to elevated [CO2] and temperature thus increasing dry matter productivity in a double rice cropping system. Field Crops Res. 2020, 248, 107735. [Google Scholar] [CrossRef]
- Roig-Oliver, M.; Fullana-Pericas, M.; Bota, J.; Flexas, J. Adjustments in photosynthesis and leaf water relations are related to changes in cell wall composition in Hordeum vulgare and Triticum aestivum subjected to water deficit stress. Plant Sci. 2021, 311, 111015. [Google Scholar] [CrossRef]
- Abdalla, M.; Ahmed, M.A.; Cai, G.; Wankmuller, F.; Schwartz, N.; Litig, O.; Javaux, M.; Carminati, A. Stomatal closure during water deficit is controlled by below-ground hydraulics. Ann. Bot. 2022, 129, 161–170. [Google Scholar] [CrossRef]
- Wang, J.; Ouyang, F.; An, S.; Wang, L.; Xu, N.; Ma, J.; Wang, J.; Zhang, H.; Kong, L. Variation, coordination, and trade-offs between needle structures and photosynthetic-related traits across five Picea species: Consequences on plant growth. BMC Plant Biol. 2022, 22, 242. [Google Scholar] [CrossRef]
- Yao, H.S.; Zhang, Y.L.; Yi, X.P.; Hu, Y.Y.; Luo, H.H.; Gou, L.; Zhang, W.F. Plant density alters nitrogen partitioning among photosynthetic components, leaf photosynthetic capacity and photosynthetic nitrogen use efficiency in field-grown cotton. Field Crops Res. 2015, 184, 39–49. [Google Scholar] [CrossRef]
- Wang, G.A.; Han, G.; Faiia, A.; Tan, W.; Shi, W.Q.; Liu, X. Experimental measurements of leaf carbon isotope discrimination and gas exchange in the progenies of Plantago depressa and Setaria viridis collected from a wide altitudinal range. Physiol. Plant. 2018, 134, 64–73. [Google Scholar] [CrossRef]


Disclaimer/Publisher’s Note: The statements, opinions and data contained in all publications are solely those of the individual author(s) and contributor(s) and not of MDPI and/or the editor(s). MDPI and/or the editor(s) disclaim responsibility for any injury to people or property resulting from any ideas, methods, instructions or products referred to in the content. |
© 2023 by the authors. Licensee MDPI, Basel, Switzerland. This article is an open access article distributed under the terms and conditions of the Creative Commons Attribution (CC BY) license (https://creativecommons.org/licenses/by/4.0/).
Share and Cite
Wang, S.; Han, Y.; Jia, Y.; Chen, Z.; Wang, G. Addressing the Relationship between Leaf Nitrogen and Carbon Isotope Discrimination from the Three Levels of Community, Population and Individual. Plants 2023, 12, 1551. https://doi.org/10.3390/plants12071551
Wang S, Han Y, Jia Y, Chen Z, Wang G. Addressing the Relationship between Leaf Nitrogen and Carbon Isotope Discrimination from the Three Levels of Community, Population and Individual. Plants. 2023; 12(7):1551. https://doi.org/10.3390/plants12071551
Chicago/Turabian StyleWang, Shuhan, Yaowen Han, Yufu Jia, Zixun Chen, and Guoan Wang. 2023. "Addressing the Relationship between Leaf Nitrogen and Carbon Isotope Discrimination from the Three Levels of Community, Population and Individual" Plants 12, no. 7: 1551. https://doi.org/10.3390/plants12071551