
Comparative Analysis of Antioxidant System and Salt-Stress Tolerance in Two Hibiscus Cultivars Exposed to NaCl Toxicity
 , ,
, , 
Abstract
:1. Introduction
2. Results
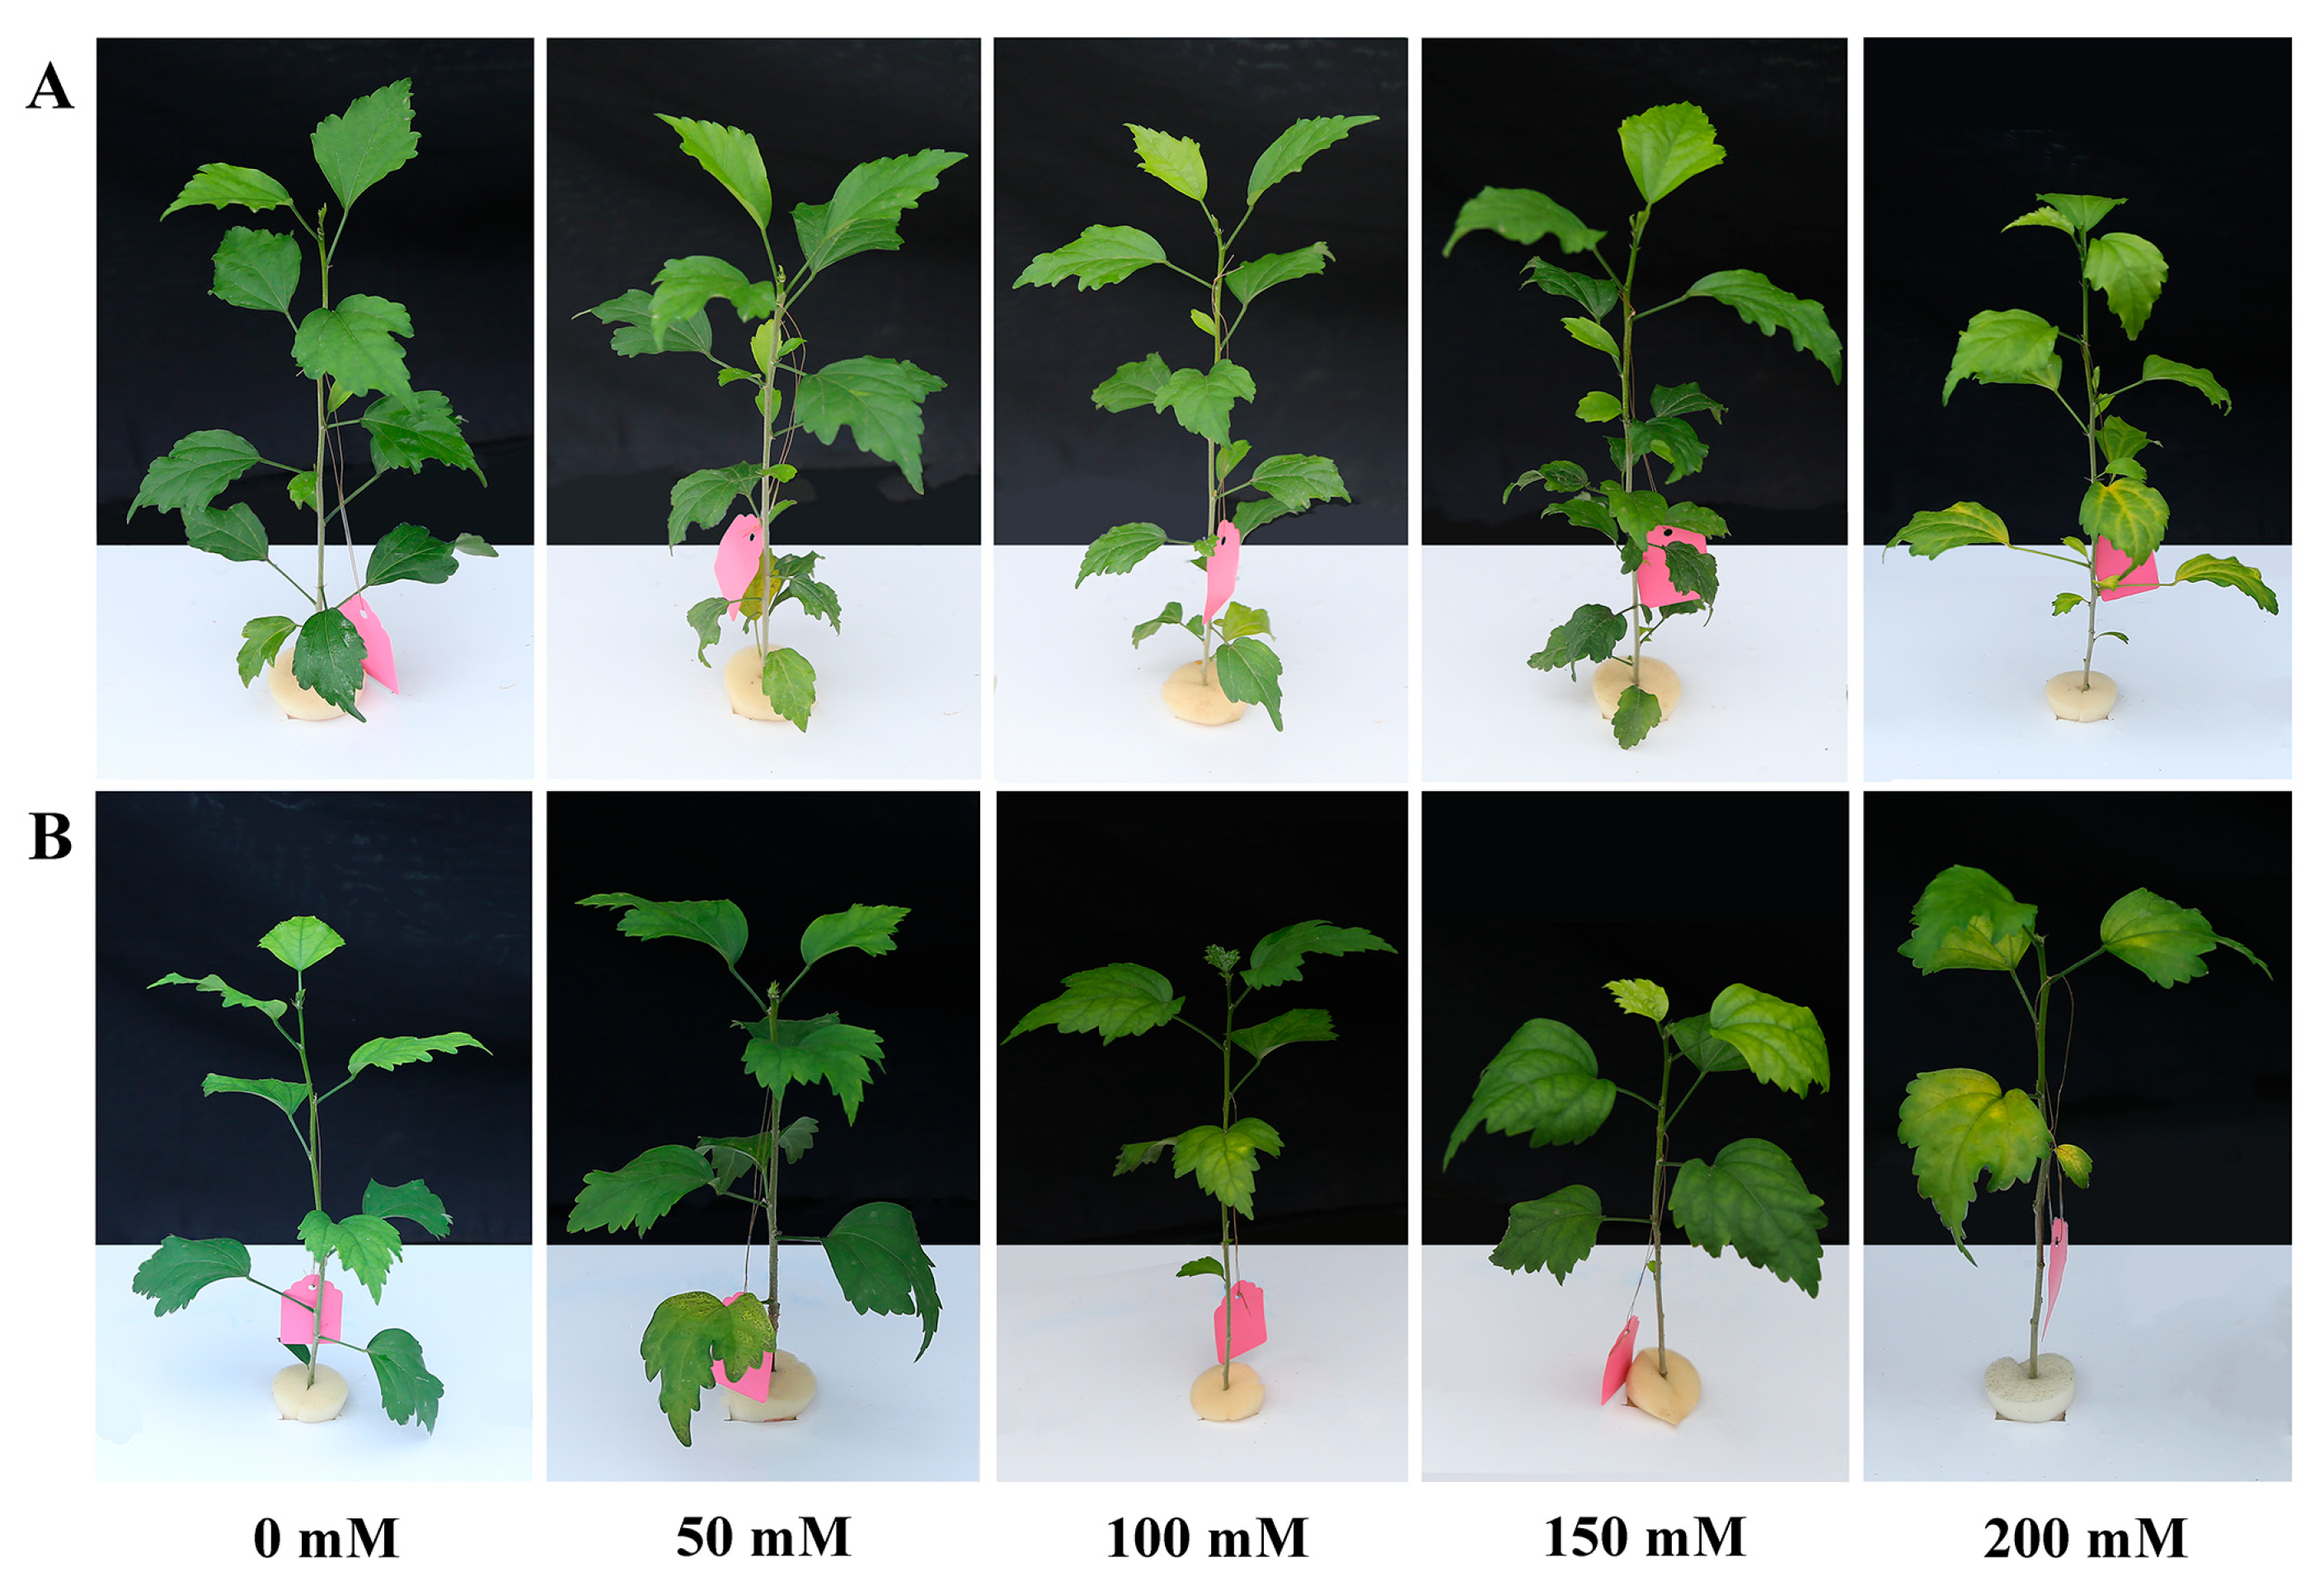
2.1. Phenotypes
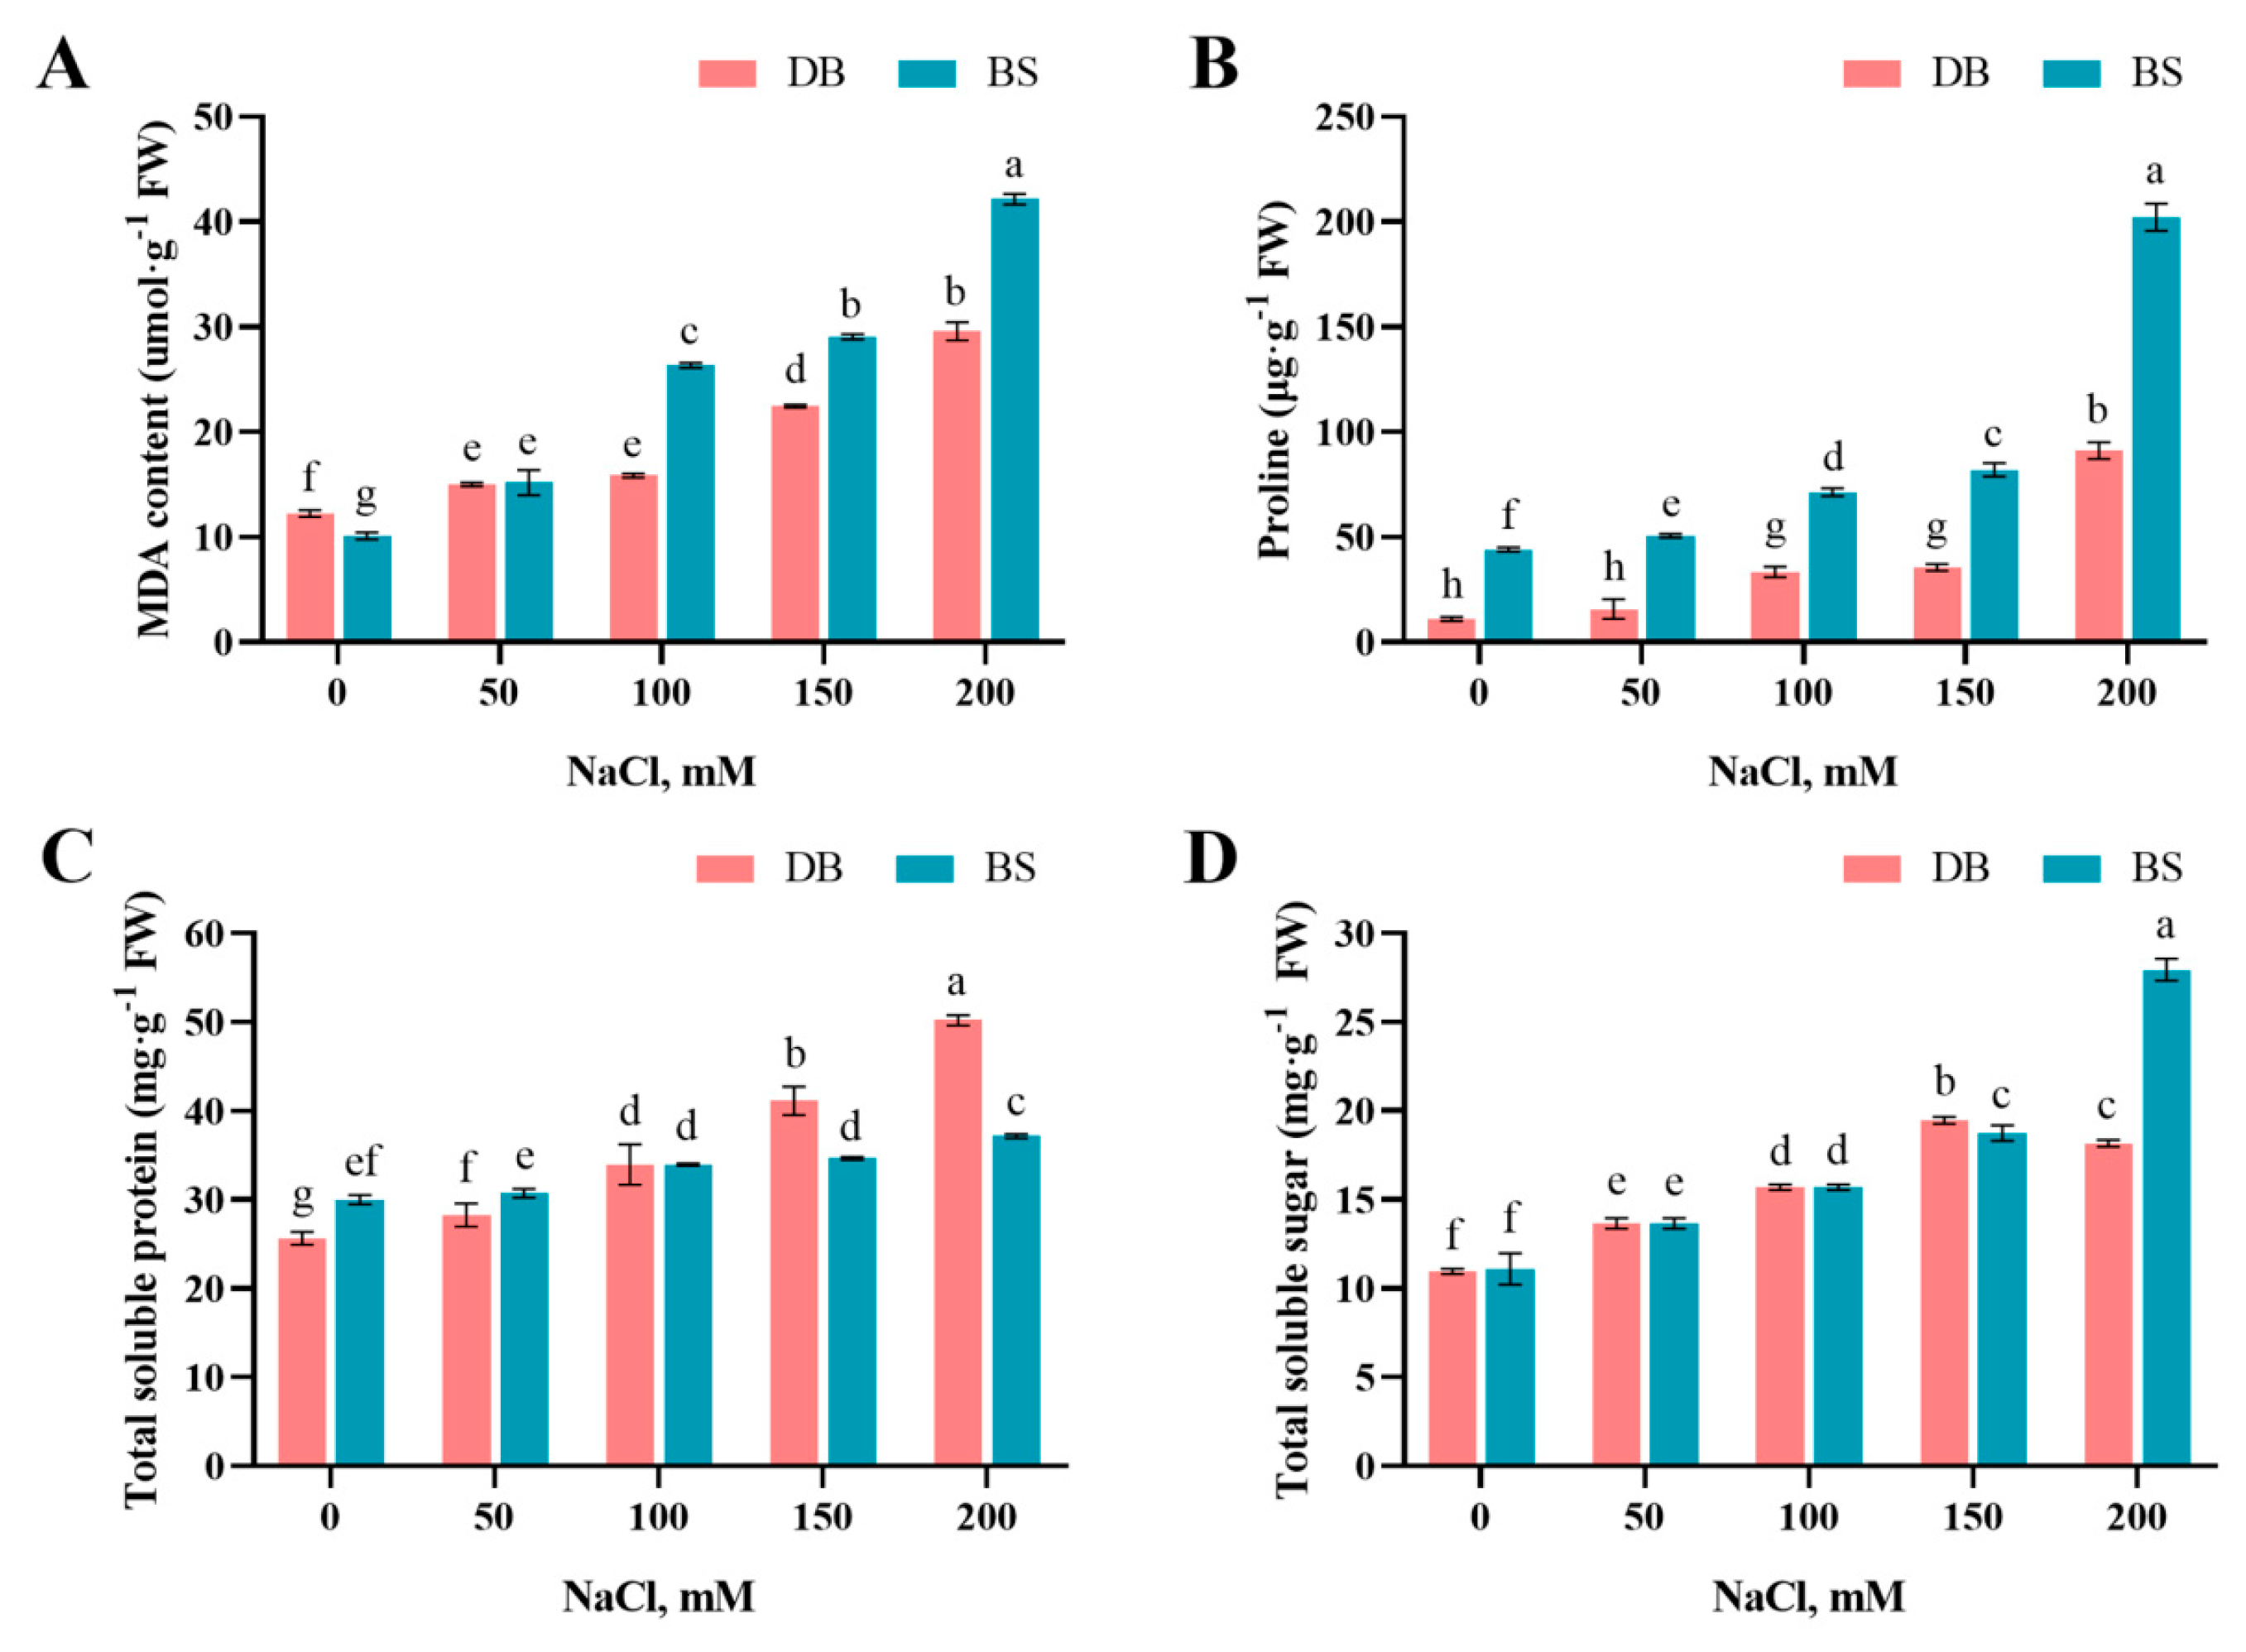
2.2. Salt Stress Induced Lipid Peroxidation
2.3. Salt-Stress-Induced Proline, Soluble Protein, and Soluble Sugar Accumulation
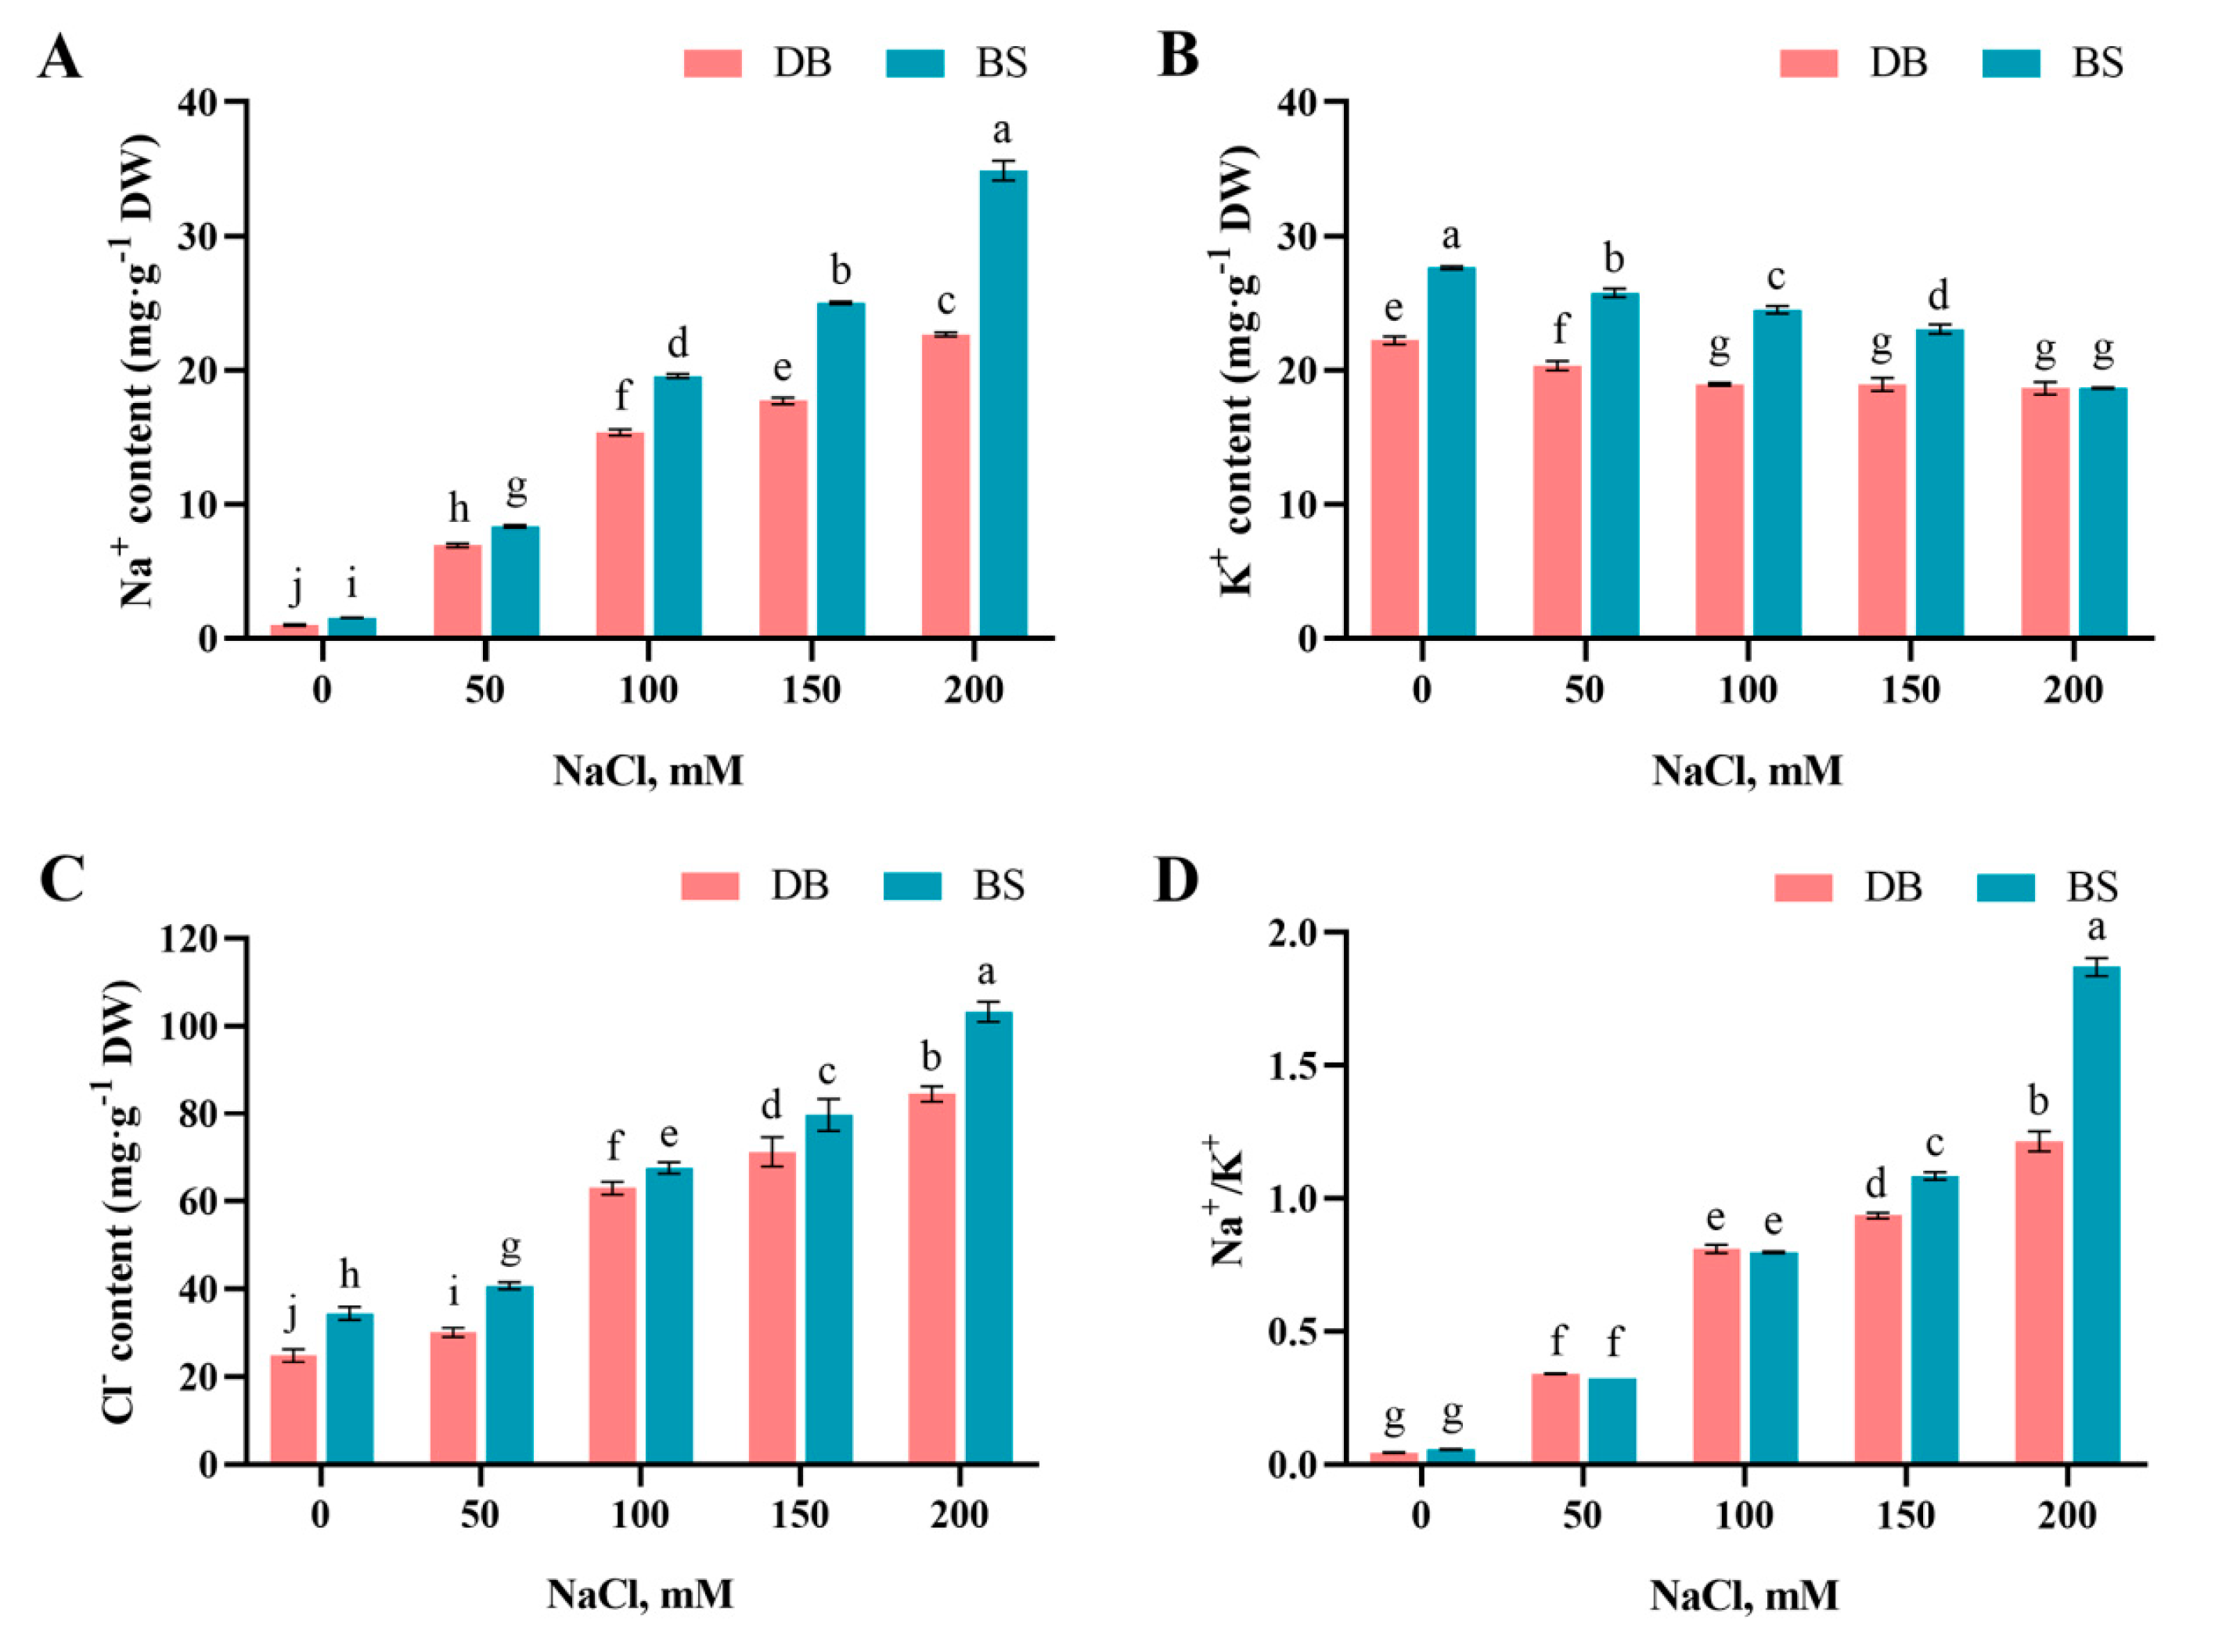
2.4. Salt-Stress-Induced Ion Imbalance
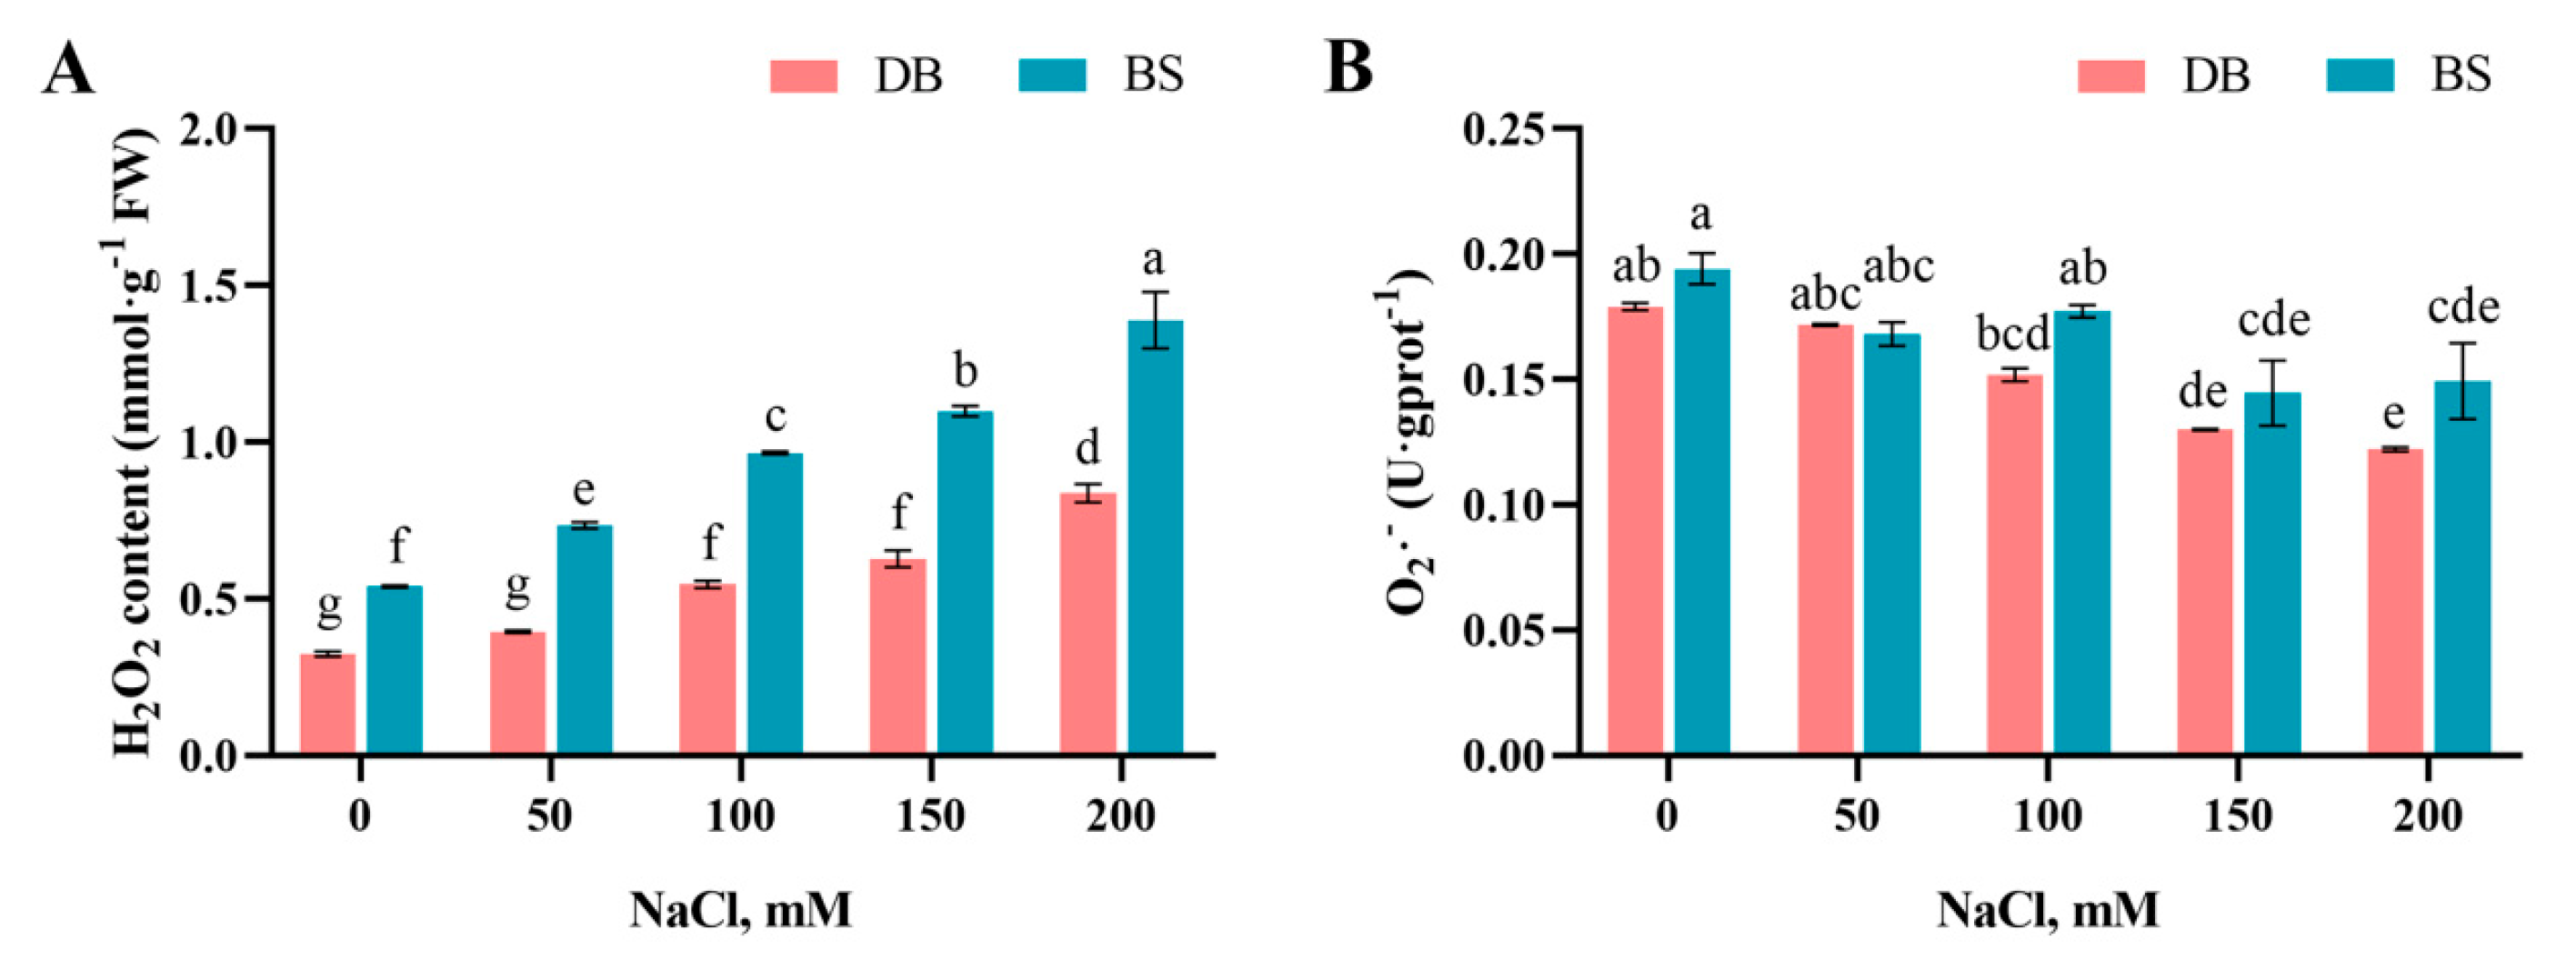
2.5. Salt-Stress-Induced Reactive Oxygen Species Accumulation
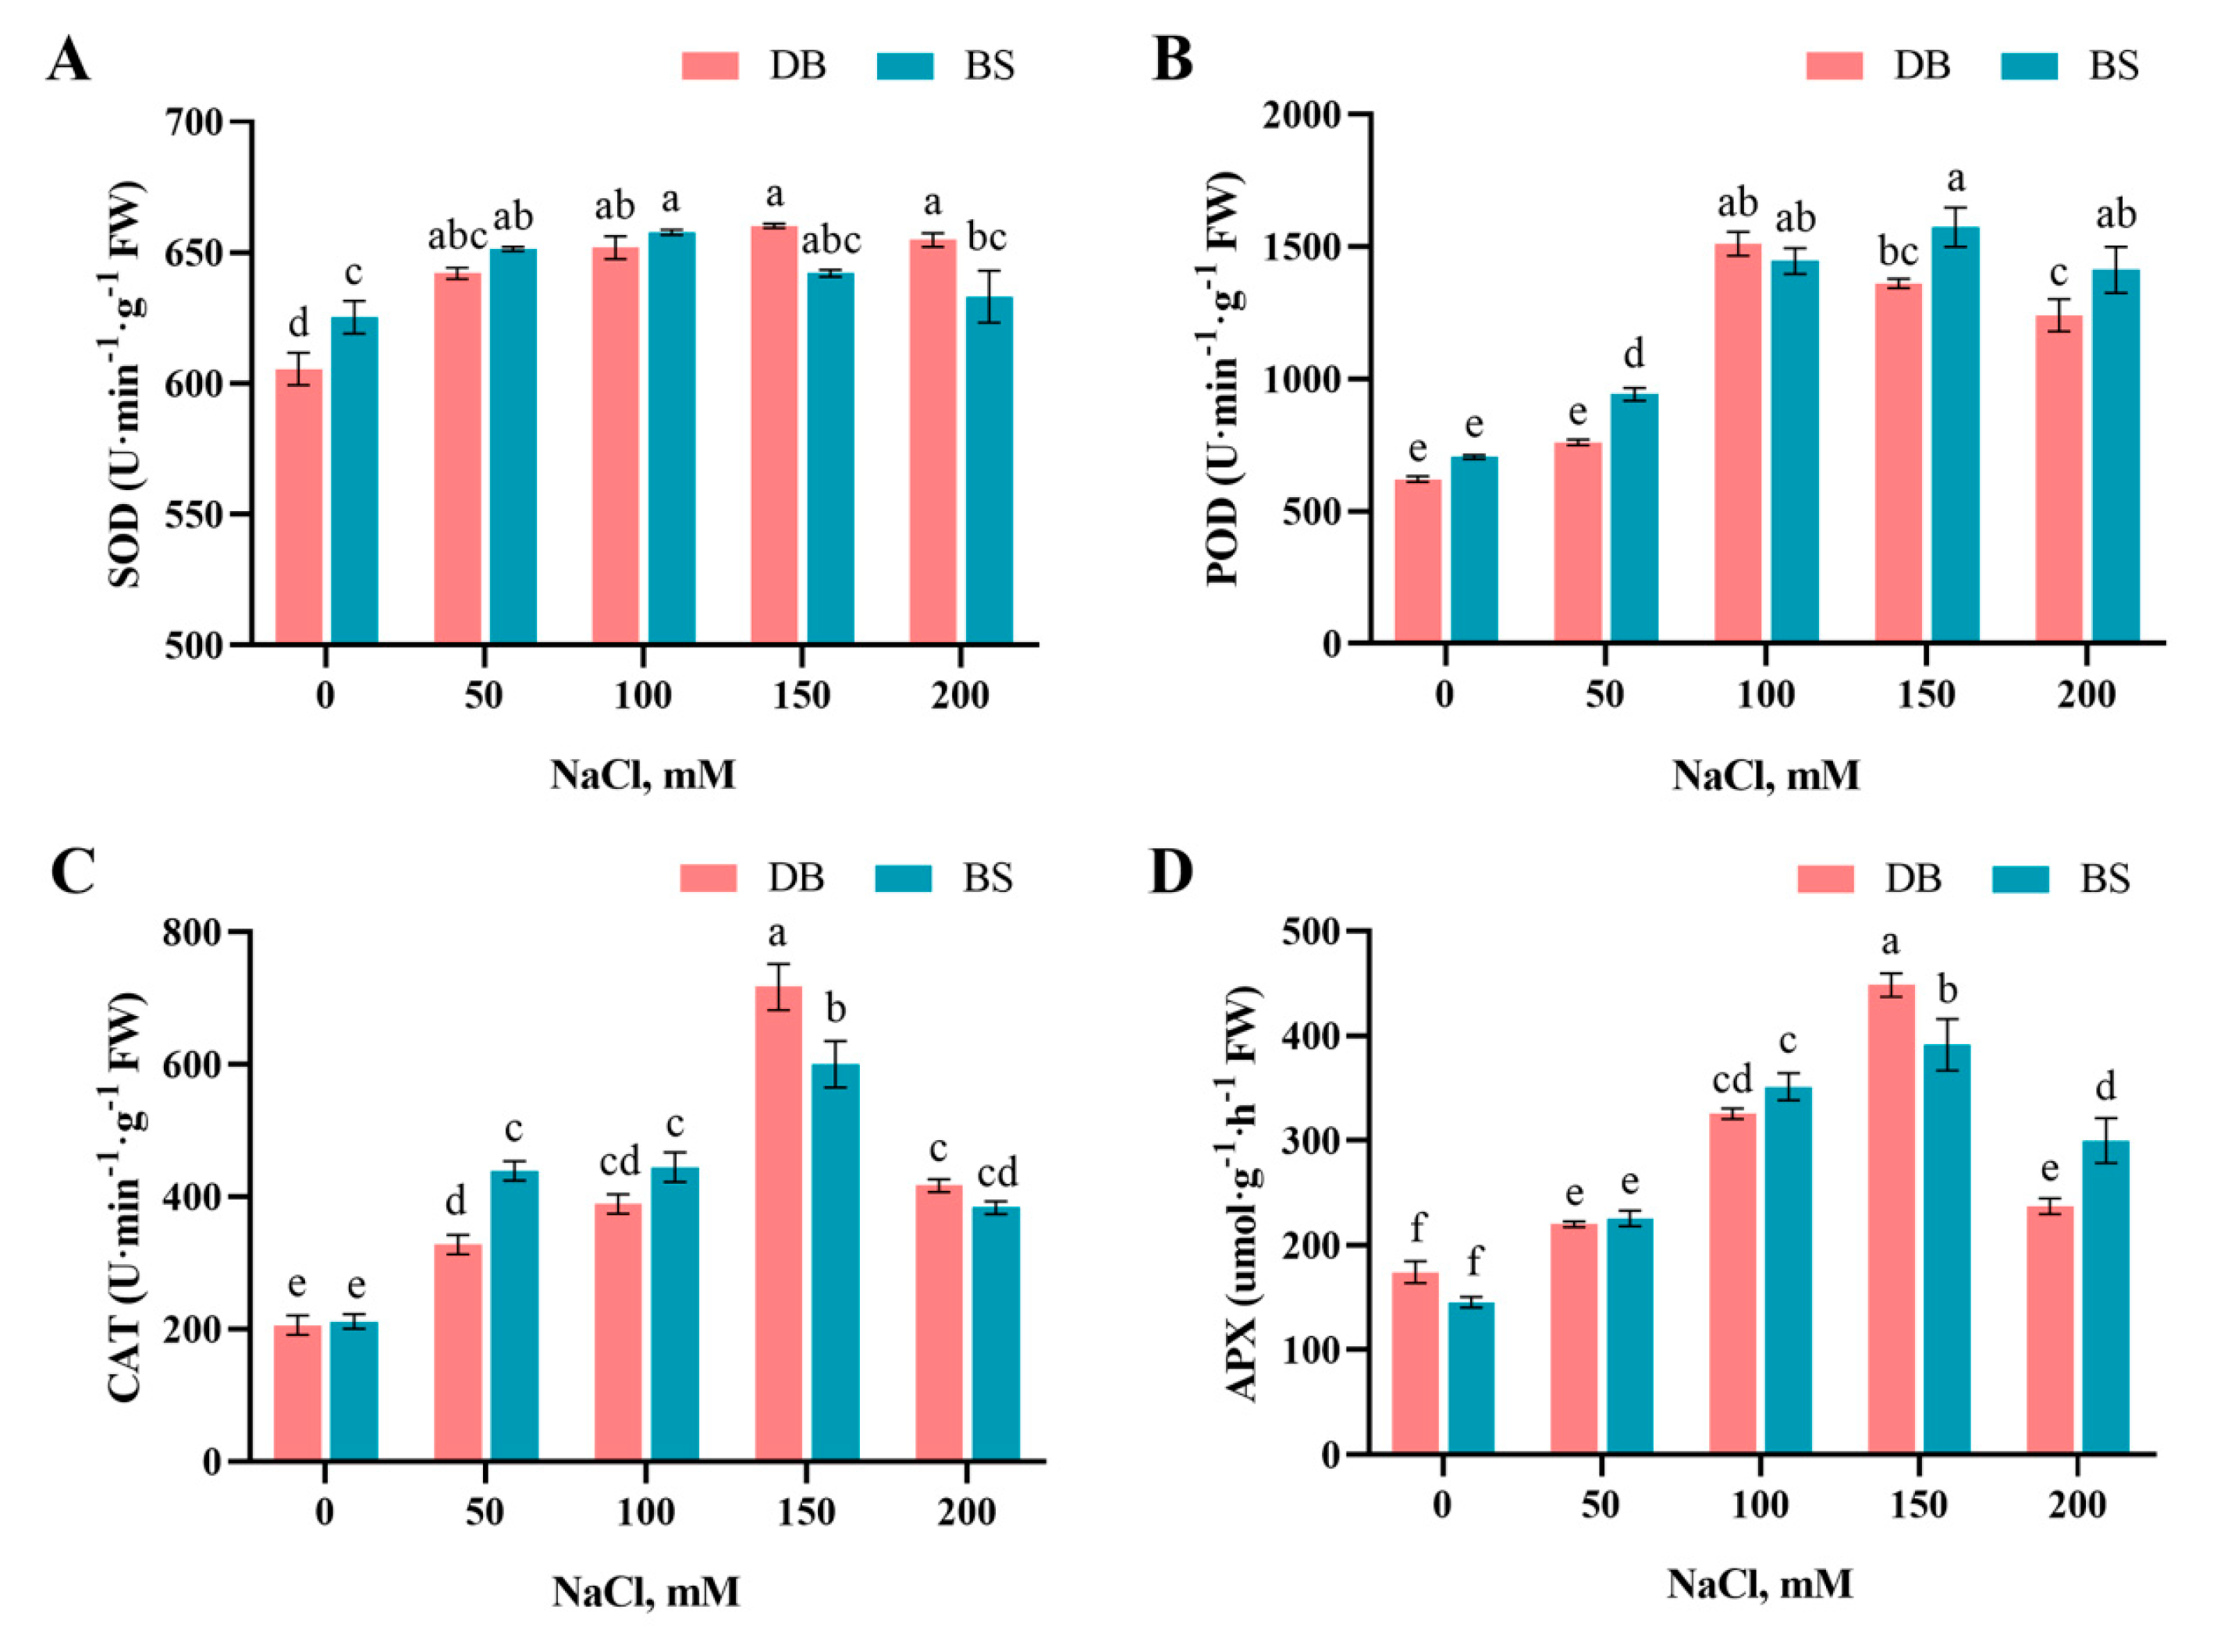
2.6. Salinity Modification of the Antioxidant System
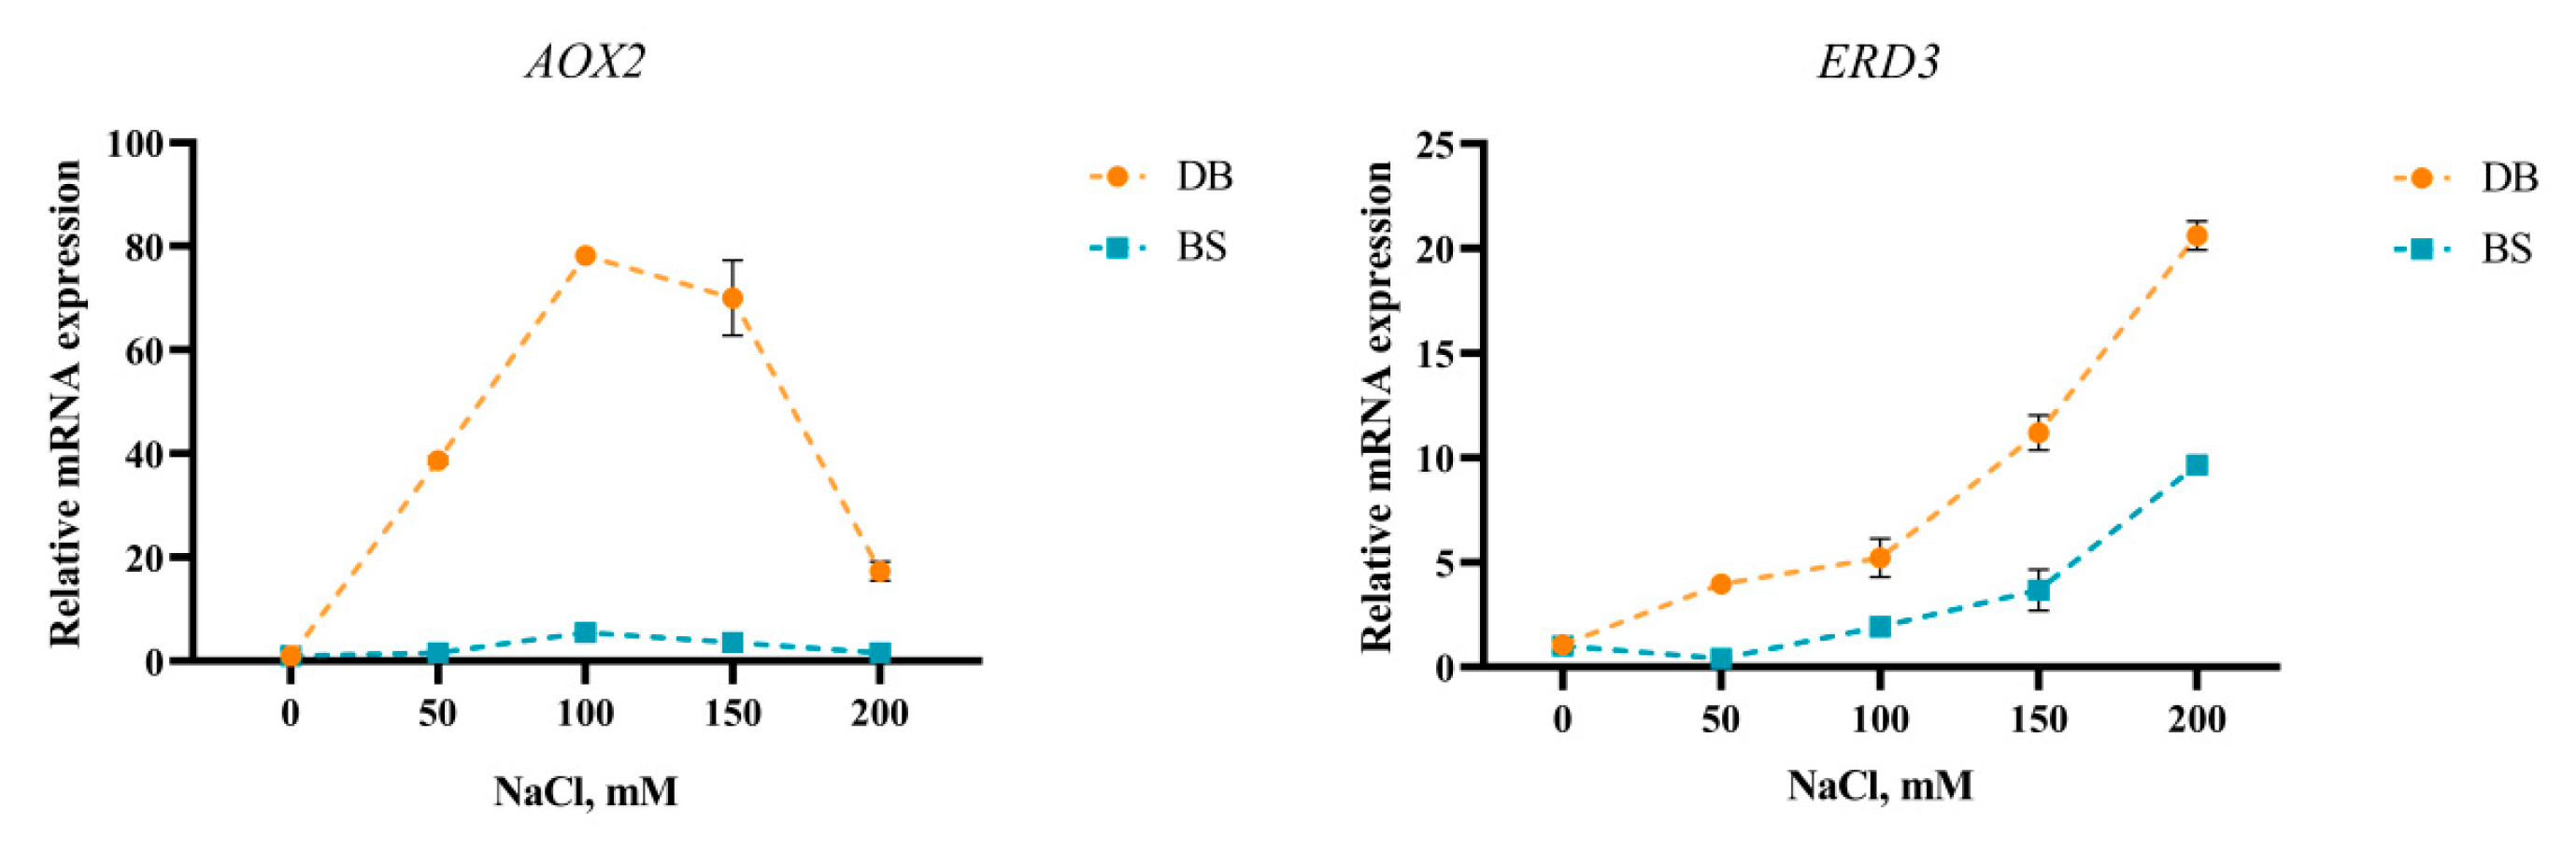
2.7. Salt Stress Induced Expression Level of AOX2 and ERD3
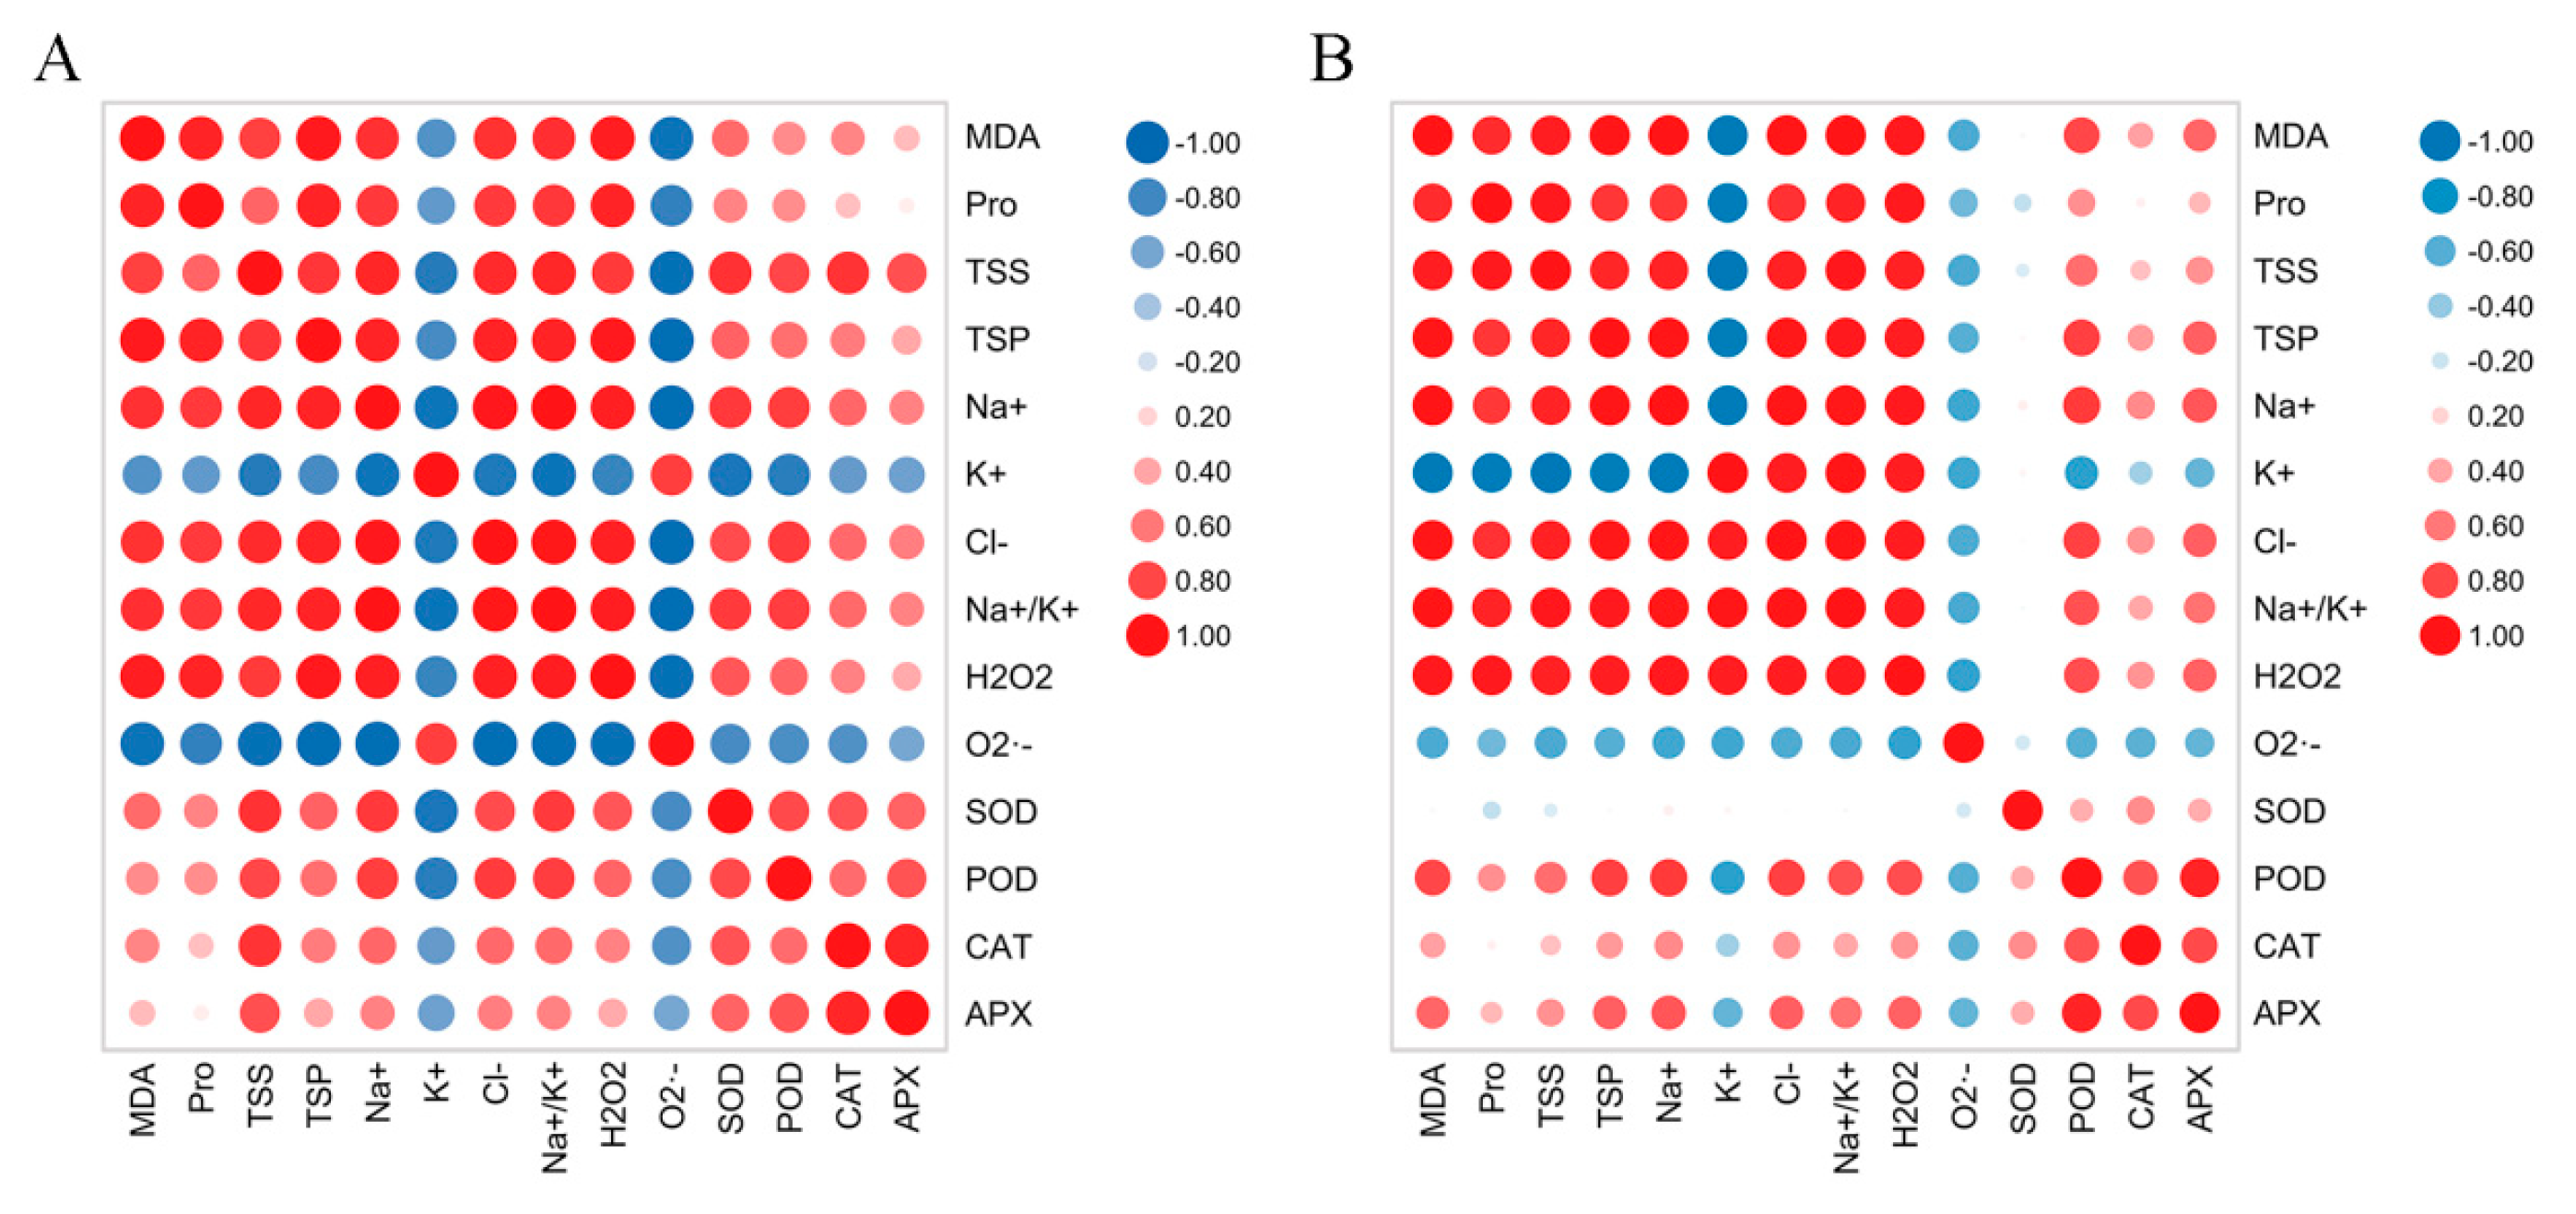
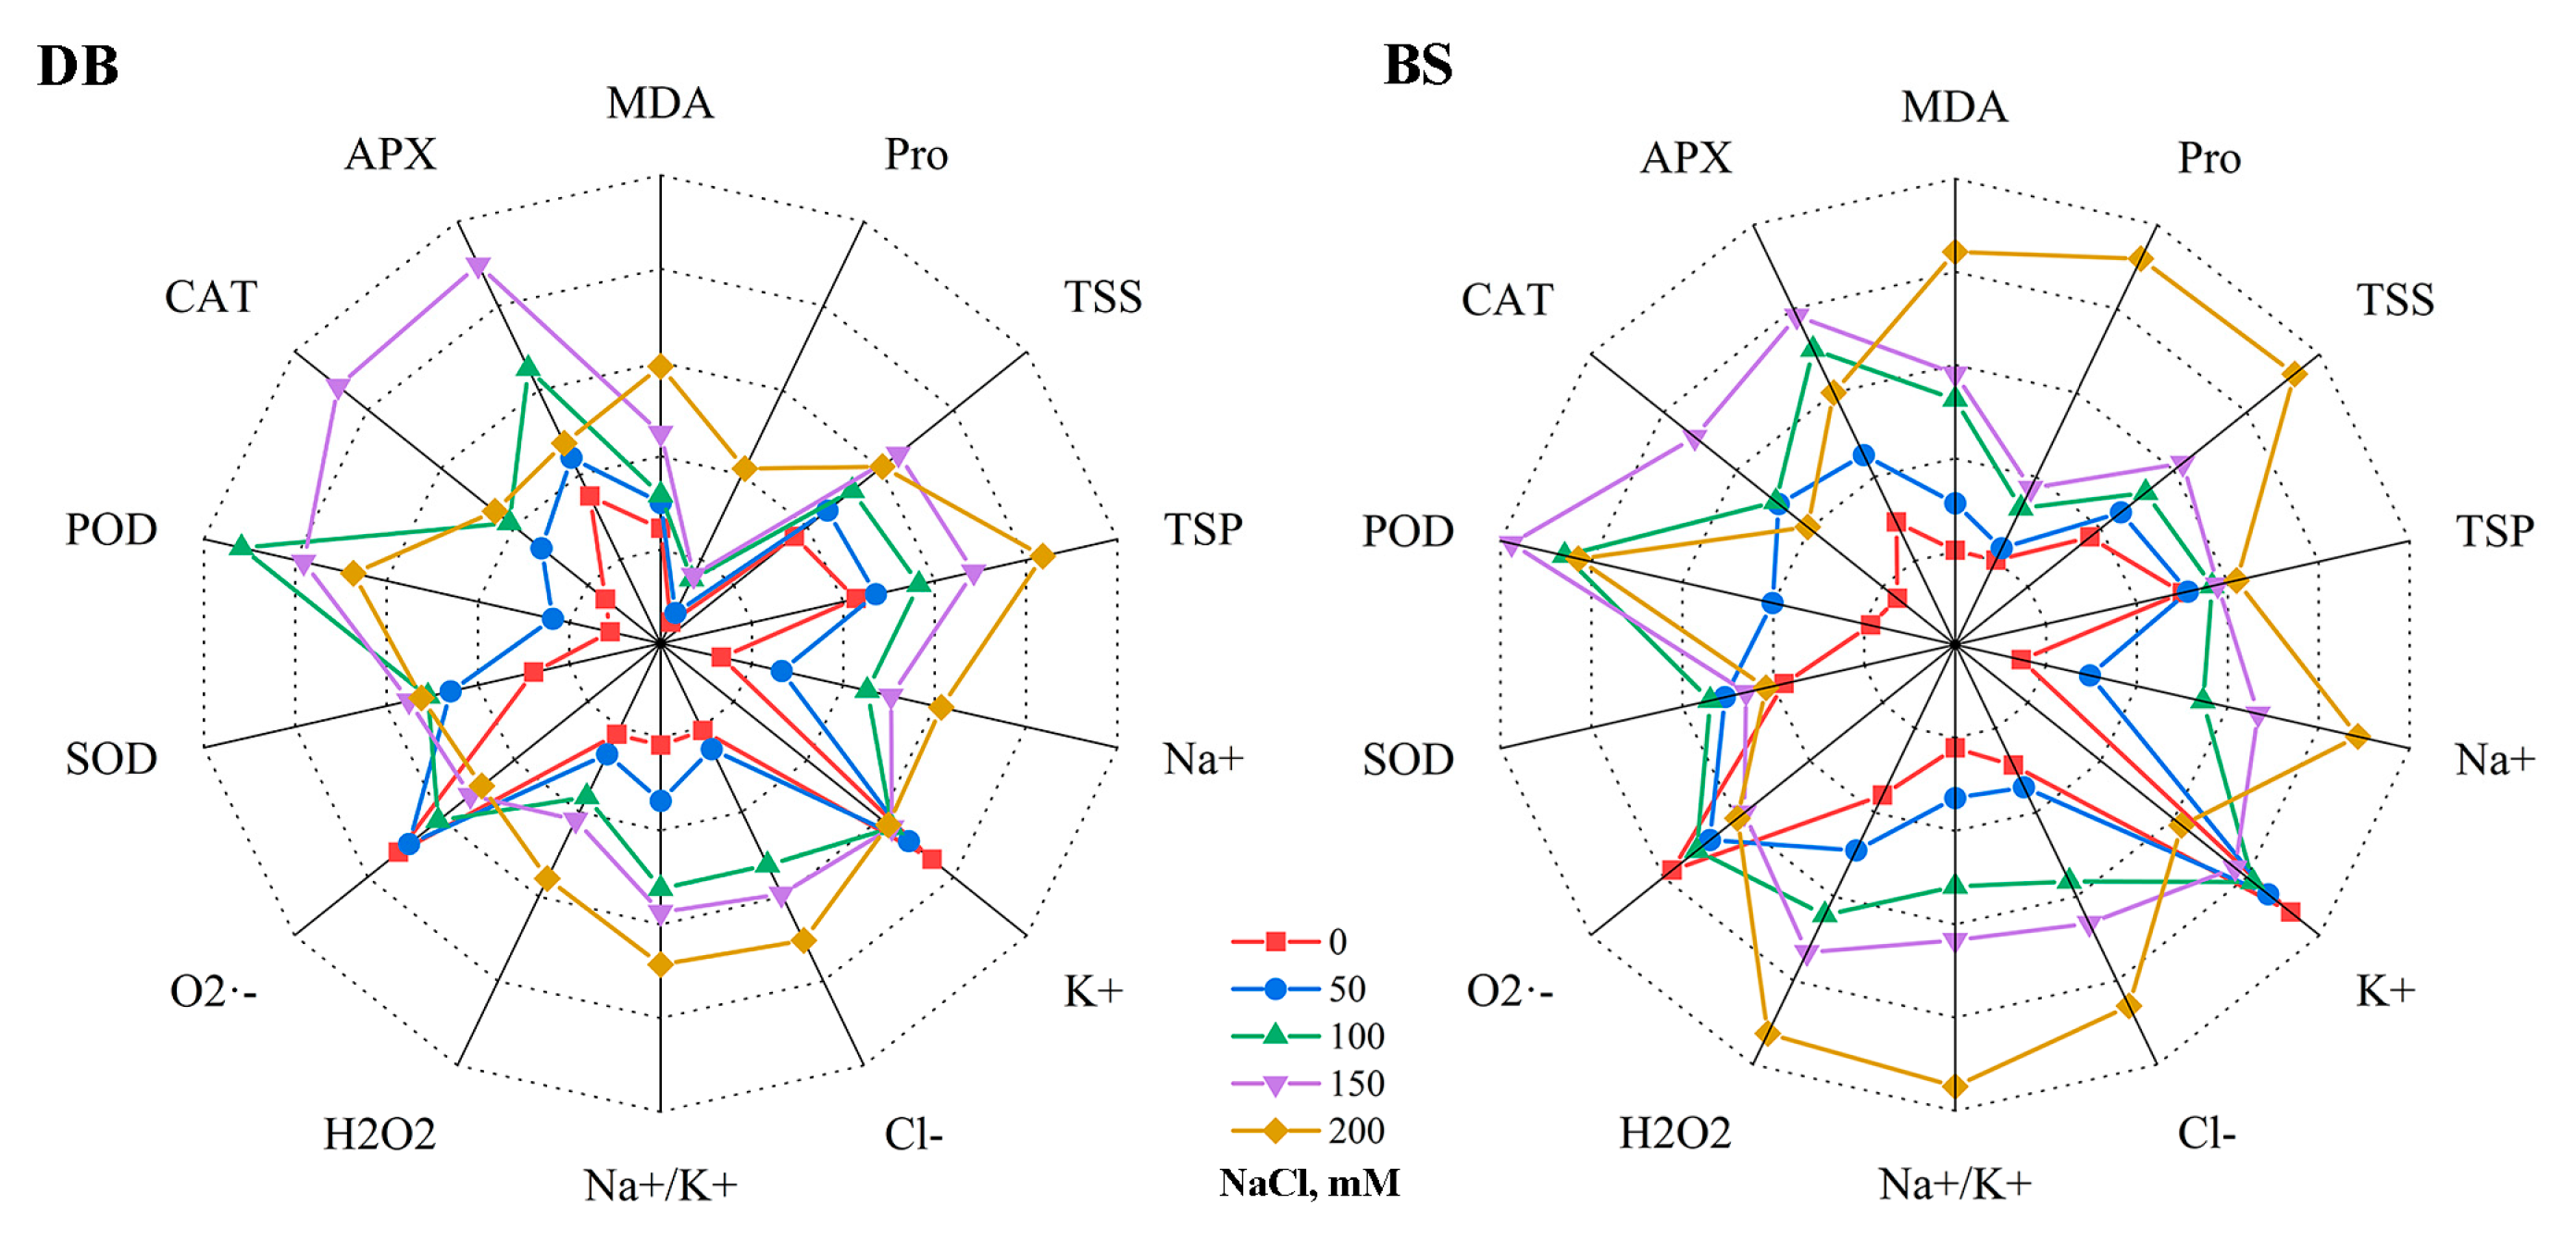
2.8. Comparison of Salt Tolerance in Two Hibiscus Cultivars
3. Discussion
4. Materials and Methods
4.1. Plant Materials and Growth Conditions
4.2. Experimental Design and Salt Treatment
4.3. Determination of Physiological and Biochemical Indicators
4.3.1. MDA Content Determination
4.3.2. Proline Content, Soluble Sugar, and Soluble Protein Determination
4.3.3. H2O2 Content and Inhibition of O2·− Product Activity Determination
4.3.4. Antioxidant Enzyme Activity Determination
4.4. Determination of Ion Contents
4.5. RNA Extraction and Quantitative PCR Analysis
4.6. Data Analysis
5. Conclusions
Supplementary Materials
Author Contributions
Funding
Data Availability Statement
Acknowledgments
Conflicts of Interest
References
- Parida, A.K.; Das, A.B. Salt Tolerance and Salinity Effects on Plants: A Review. Ecotoxicol. Environ. Saf. 2005, 60, 324–349. [Google Scholar] [CrossRef] [PubMed]
- Deinlein, U.; Stephan, A.B.; Horie, T.; Luo, W.; Xu, G.; Schroeder, J.I. Plant Salt-Tolerance Mechanisms. Trends Plant Sci. 2014, 19, 371–379. [Google Scholar] [CrossRef] [PubMed] [Green Version]
- Munns, R.; Tester, M. Mechanisms of Salinity Tolerance. Annu. Rev. Plant Biol. 2008, 59, 651–681. [Google Scholar] [CrossRef] [PubMed] [Green Version]
- Zhao, G.; Shi, Q.; Han, Y.; Li, S.; Wang, W. The Physiological and Biochemical Responses of a Medicinal Plant (Salvia miltiorrhiza L.) to Stress Caused by Various Concentrations of NaCl. PLoS ONE 2014, 9, e89624. [Google Scholar] [CrossRef] [Green Version]
- Chen, J.; Zhang, J.; Hu, J.; Xiong, W.; Du, C.; Lu, M. Integrated Regulatory Network Reveals the Early Salt Tolerance Mechanism of Populus euphratica. Sci. Rep. 2017, 7, 6769. [Google Scholar] [CrossRef] [Green Version]
- Yao, X.; Zhou, M.; Ruan, J.; Peng, Y.; Ma, C.; Wu, W.; Gao, A.; Weng, W.; Cheng, J. Physiological and Biochemical Regulation Mechanism of Exogenous Hydrogen Peroxide in Alleviating NaCl Stress Toxicity in Tartary Buckwheat (Fagopyrum tataricum (L.) Gaertn). Int. J. Mol. Sci. 2022, 23, 10698. [Google Scholar] [CrossRef]
- Patel, J.; Khandwal, D.; Choudhary, B.; Ardeshana, D.; Jha, R.K.; Tanna, B.; Yadav, S.; Mishra, A.; Varshney, R.K.; Siddique, K.H.M. Differential Physio-Biochemical and Metabolic Responses of Peanut (Arachis hypogaea L.) under Multiple Abiotic Stress Conditions. Int. J. Mol. Sci. 2022, 23, 660. [Google Scholar] [CrossRef]
- Munns, R.; Gilliham, M. Salinity Tolerance of Crops—What Is the Cost? New Phytol. 2015, 208, 668–673. [Google Scholar] [CrossRef] [Green Version]
- Chen, Y.-E.; Mao, J.-J.; Sun, L.-Q.; Huang, B.; Ding, C.-B.; Gu, Y.; Liao, J.-Q.; Hu, C.; Zhang, Z.-W.; Yuan, S.; et al. Exogenous Melatonin Enhances Salt Stress Tolerance in Maize Seedlings by Improving Antioxidant and Photosynthetic Capacity. Physiol. Plant. 2018, 164, 349–363. [Google Scholar] [CrossRef]
- Chetouani, M.; Mzabri, I.; Aamar, A.; Boukroute, A.; Kouddane, N.; Berrichi, A. Morphological-Physiological and Biochemical Responses of Rosemary (Rosmarinus officinalis) to Salt Stress. Mater. Today Proc. 2019, 13, 752–761. [Google Scholar] [CrossRef]
- Rodrigues, C.R.F.; Silva, E.N.; da Mata Moura, R.; dos Anjos, D.C.; Hernandez, F.F.F.; Viégas, R.A. Physiological Adjustment to Salt Stress in R. Communis Seedlings Is Associated with a Probable Mechanism of Osmotic Adjustment and a Reduction in Water Lost by Transpiration. Ind. Crops Prod. 2014, 54, 233–239. [Google Scholar] [CrossRef]
- Qu, C.; Liu, C.; Gong, X.; Li, C.; Hong, M.; Wang, L.; Hong, F. Impairment of Maize Seedling Photosynthesis Caused by a Combination of Potassium Deficiency and Salt Stress. Environ. Exp. Bot. 2012, 75, 134–141. [Google Scholar] [CrossRef]
- Flowers, T.J.; Colmer, T.D. Salinity Tolerance in Halophytes. New Phytol. 2008, 179, 945–963. [Google Scholar] [CrossRef] [PubMed]
- Chakraborty, K.; Bose, J.; Shabala, L.; Eyles, A.; Shabala, S. Evaluating Relative Contribution of Osmotolerance and Tissue Tolerance Mechanisms toward Salinity Stress Tolerance in Three Brassica Species. Physiol. Plant. 2016, 158, 135–151. [Google Scholar] [CrossRef] [PubMed]
- Basu, S.; Kumar, A.; Benazir, I.; Kumar, G. Reassessing the Role of Ion Homeostasis for Improving Salinity Tolerance in Crop Plants. Physiol. Plant. 2021, 171, 502–519. [Google Scholar] [CrossRef] [PubMed]
- Das, K.; Roychoudhury, A. Reactive Oxygen Species (ROS) and Response of Antioxidants as ROS-Scavengers during Environmental Stress in Plants. Front. Environ. Sci. 2014, 2, 53. [Google Scholar] [CrossRef] [Green Version]
- Mittler, R. Oxidative Stress, Antioxidants and Stress Tolerance. Trends Plant Sci. 2002, 7, 405–410. [Google Scholar] [CrossRef]
- Tarchoune, I.; Sgherri, C.; Izzo, R.; Lachaâl, M.; Navari-Izzo, F.; Ouerghi, Z. Changes in the Antioxidative Systems of Ocimum basilicum L. (Cv. Fine) under Different Sodium Salts. Acta Physiol. Plant 2012, 34, 1873–1881. [Google Scholar] [CrossRef]
- Huihui, Z.; Xin, L.; Yupeng, G.; Mabo, L.; Yue, W.; Meijun, A.; Yuehui, Z.; Guanjun, L.; Nan, X.; Guangyu, S. Physiological and Proteomic Responses of Reactive Oxygen Species Metabolism and Antioxidant Machinery in Mulberry (Morus alba L.) Seedling Leaves to NaCl and NaHCO3 Stress. Ecotoxicol. Environ. Saf. 2020, 193, 110259. [Google Scholar] [CrossRef]
- Meloni, D.A.; Oliva, M.A.; Martinez, C.A.; Cambraia, J. Photosynthesis and Activity of Superoxide Dismutase, Peroxidase and Glutathione Reductase in Cotton under Salt Stress. Environ. Exp. Bot. 2003, 49, 69–76. [Google Scholar] [CrossRef]
- Moradi, F.; Ismail, A.M. Responses of Photosynthesis, Chlorophyll Fluorescence and ROS-Scavenging Systems to Salt Stress During Seedling and Reproductive Stages in Rice. Ann. Bot. 2007, 99, 1161–1173. [Google Scholar] [CrossRef] [PubMed] [Green Version]
- Ashraf, M.; Harris, P.J.C. Potential Biochemical Indicators of Salinity Tolerance in Plants. Plant Sci. 2004, 166, 3–16. [Google Scholar] [CrossRef]
- Sarker, U.; Oba, S. The Response of Salinity Stress-Induced A. Tricolor to Growth, Anatomy, Physiology, Non-Enzymatic and Enzymatic Antioxidants. Front. Plant Sci. 2020, 11, 559876. [Google Scholar] [CrossRef]
- Eo, H.J.; Kwon, H.Y.; Da Kim, S.; Kang, Y.; Park, Y.; Park, G.H. GC/MS Analysis and Anti-Inflammatory Effect of Leaf Extracts from Hibiscus syriacus through Inhibition of NF-ΚB and MAPKs Signaling in LPS-Stimulated RAW264.7 Macrophages. Plant Biotechnol. Rep. 2020, 14, 539–546. [Google Scholar] [CrossRef]
- Hsu, R.-J.; Hsu, Y.-C.; Chen, S.-P.; Fu, C.-L.; Yu, J.-C.; Chang, F.-W.; Chen, Y.-H.; Liu, J.-M.; Ho, J.-Y.; Yu, C.-P. The Triterpenoids of Hibiscus syriacus Induce Apoptosis and Inhibit Cell Migration in Breast Cancer Cells. BMC Complement. Altern. Med. 2015, 15, 65. [Google Scholar] [CrossRef] [Green Version]
- Karunarathne, W.A.H.M.; Lee, K.T.; Choi, Y.H.; Jin, C.-Y.; Kim, G.-Y. Anthocyanins Isolated from Hibiscus syriacus L. Attenuate Lipopolysaccharide-Induced Inflammation and Endotoxic Shock by Inhibiting the TLR4/MD2-Mediated NF-ΚB Signaling Pathway. Phytomedicine 2020, 76, 153237. [Google Scholar] [CrossRef]
- Kim, Y.H.; Im, A.-R.; Park, B.-K.; Paek, S.H.; Choi, G.; Kim, Y.R.; Whang, W.K.; Lee, K.H.; Oh, S.-E.; Lee, M.Y. Antidepressant-Like and Neuroprotective Effects of Ethanol Extract from the Root Bark of Hibiscus syriacus L. BioMed Res. Int. 2018, 2018, 7383869. [Google Scholar] [CrossRef] [Green Version]
- Teets, T.M.; Hummel, R.L.; Guy, C.L. Cold-Acclimation of Hibiscus rosa-sinensis L. and Hibiscus syriacus L. in Natural and Controlled Environments. Plant Cell Environ. 1989, 12, 495–502. [Google Scholar] [CrossRef]
- Gadwal, R.; Naik, G.R. A Comparative Study on the Effect of Salt Stress on Seed Germination and Early Seedling Growth of Two Hibiscus Species. IOSR-JAVS 2014, 7, 90–96. [Google Scholar] [CrossRef]
- Negrão, S.; Schmöckel, S.M.; Tester, M. Evaluating Physiological Responses of Plants to Salinity Stress. Ann. Bot. 2017, 119, 1–11. [Google Scholar] [CrossRef] [Green Version]
- Khan, M.A.H.; Mia, A.B.; Quddus, A.; Sarker, K.K.; Rahman, M.; Skalicky, M.; Brestic, M.; Gaber, A.; Alsuhaibani, A.M.; Hossain, A. Salinity-Induced Physiological Changes in Pea (Pisum sativum L.): Germination Rate, Biomass Accumulation, Relative Water Content, Seedling Vigor and Salt Tolerance Index. Plants 2022, 11, 3493. [Google Scholar] [CrossRef]
- He, W.; Yan, K.; Zhang, Y.; Bian, L.; Mei, H.; Han, G. Contrasting Photosynthesis, Photoinhibition and Oxidative Damage in Honeysuckle (Lonicera japonica Thunb.) under Iso-Osmotic Salt and Drought Stresses. Environ. Exp. Bot. 2021, 182, 104313. [Google Scholar] [CrossRef]
- Li, Q.; Qin, Y.; Hu, X.; Jin, L.; Li, G.; Gong, Z.; Xiong, X.; Wang, W. Physiology and Gene Expression Analysis of Potato (Solanum tuberosum L.) in Salt Stress. Plants 2022, 11, 1565. [Google Scholar] [CrossRef]
- Juan, M.; Rivero, R.; Romero, L.; Ruiz, J. Evaluation of Some Nutritional and Biochemical Indicators in Selecting Salt-Resistant Tomato Cultivars. Environ. Exp. Bot. 2005, 54, 193–201. [Google Scholar] [CrossRef]
- Mansour, M.M.F.; Salama, K.H.A.; Allam, H.Y.H. Role of the Plasma Membrane in Saline Conditions: Lipids and Proteins. Bot. Rev. 2015, 81, 416–451. [Google Scholar] [CrossRef]
- Hamouda, I.; Badri, M.; Mejri, M.; Cruz, C.; Siddique, K.H.M.; Hessini, K. Salt Tolerance of Beta Macrocarpa Is Associated with Efficient Osmotic Adjustment and Increased Apoplastic Water Content. Plant Biol. 2016, 18, 369–375. [Google Scholar] [CrossRef]
- Jafari, S.; Hashemi Garmdareh, S.E. Effects of Salinity on Morpho-Physiological, and Biochemical Characteristics of Stock Plant (Matthiola incana L.). Sci. Hortic. 2019, 257, 108731. [Google Scholar] [CrossRef]
- Hannachi, S.; Van Labeke, M.-C. Salt Stress Affects Germination, Seedling Growth and Physiological Responses Differentially in Eggplant Cultivars (Solanum melongena L.). Sci. Hortic. 2018, 228, 56–65. [Google Scholar] [CrossRef]
- Mansour, M.M.F.; Ali, E.F. Evaluation of Proline Functions in Saline Conditions. Phytochemistry 2017, 140, 52–68. [Google Scholar] [CrossRef]
- Abid, M.; Zhang, Y.J.; Li, Z.; Bai, D.F.; Zhong, Y.P.; Fang, J.B. Effect of Salt Stress on Growth, Physiological and Biochemical Characters of Four Kiwifruit Genotypes. Sci. Hortic. 2020, 271, 109473. [Google Scholar] [CrossRef]
- Feng, X.; Hussain, T.; Guo, K.; An, P.; Liu, X. Physiological, Morphological and Anatomical Responses of Hibiscus moscheutos to Non-Uniform Salinity Stress. Environ. Exp. Bot. 2021, 182, 104301. [Google Scholar] [CrossRef]
- Hussin, S.; Geissler, N.; Koyro, H.-W. Effect of NaCl Salinity on Atriplex nummularia (L.) with Special Emphasis on Carbon and Nitrogen Metabolism. Acta Physiol. Plant. 2013, 35, 1025–1038. [Google Scholar] [CrossRef]
- Luis Castañares, J.; Alberto Bouzo, C. Effect of Exogenous Melatonin on Seed Germination and Seedling Growth in Melon (Cucumis melo L.) Under Salt Stress. Hortic. Plant J. 2019, 5, 79–87. [Google Scholar] [CrossRef]
- Khalid, M.F.; Hussain, S.; Anjum, M.A.; Ahmad, S.; Ali, M.A.; Ejaz, S.; Morillon, R. Better Salinity Tolerance in Tetraploid vs Diploid Volkamer Lemon Seedlings Is Associated with Robust Antioxidant and Osmotic Adjustment Mechanisms. J. Plant Physiol. 2020, 244, 153071. [Google Scholar] [CrossRef] [PubMed]
- Li, J.; Ma, J.; Guo, H.; Zong, J.; Chen, J.; Wang, Y.; Li, D.; Li, L.; Wang, J.; Liu, J. Growth and Physiological Responses of Two Phenotypically Distinct Accessions of Centipedegrass (Eremochloa ophiuroides (Munro) Hack.) to Salt Stress. Plant Physiol. Biochem. 2018, 126, 1–10. [Google Scholar] [CrossRef] [PubMed]
- Assaha, D.V.M.; Ueda, A.; Saneoka, H.; Al-Yahyai, R.; Yaish, M.W. The Role of Na+ and K+ Transporters in Salt Stress Adaptation in Glycophytes. Front. Physiol. 2017, 8, 509. [Google Scholar] [CrossRef] [Green Version]
- Zhang, T.; Sun, K.; Chang, X.; Ouyang, Z.; Meng, G.; Han, Y.; Shen, S.; Yao, Q.; Piao, F.; Wang, Y. Comparative Physiological and Transcriptomic Analyses of Two Contrasting Pepper Genotypes under Salt Stress Reveal Complex Salt Tolerance Mechanisms in Seedlings. Int. J. Mol. Sci. 2022, 23, 9701. [Google Scholar] [CrossRef]
- Gogna, M.; Choudhary, A.; Mishra, G.; Kapoor, R.; Bhatla, S.C. Changes in Lipid Composition in Response to Salt Stress and Its Possible Interaction with Intracellular Na+-K+ Ratio in Sunflower (Helianthus annuus L.). Environ. Exp. Bot. 2020, 178, 104147. [Google Scholar] [CrossRef]
- Silva, B.R.S.; Batista, B.L.; Lobato, A.K.S. Anatomical Changes in Stem and Root of Soybean Plants Submitted to Salt Stress. Plant Biol. 2021, 23, 57–65. [Google Scholar] [CrossRef]
- Teakle, N.L.; Tyerman, S.D. Mechanisms of Cl− Transport Contributing to Salt Tolerance. Plant Cell Environ. 2010, 33, 566–589. [Google Scholar] [CrossRef]
- Liu, Y.; Ji, D.; Turgeon, R.; Chen, J.; Lin, T.; Huang, J.; Luo, J.; Zhu, Y.; Zhang, C.; Lv, Z. Physiological and Proteomic Responses of Mulberry Trees (Morus alba L.) to Combined Salt and Drought Stress. Int. J. Mol. Sci. 2019, 20, 2486. [Google Scholar] [CrossRef] [PubMed] [Green Version]
- de Oliveira, V.P.; Lima, M.D.R.; da Silva, B.R.S.; Batista, B.L.; da Silva Lobato, A.K. Brassinosteroids Confer Tolerance to Salt Stress in Eucalyptus urophylla Plants Enhancing Homeostasis, Antioxidant Metabolism and Leaf Anatomy. J. Plant Growth Regul. 2019, 38, 557–573. [Google Scholar] [CrossRef]
- Nie, W.; Gong, B.; Chen, Y.; Wang, J.; Wei, M.; Shi, Q. Photosynthetic Capacity, Ion Homeostasis and Reactive Oxygen Metabolism Were Involved in Exogenous Salicylic Acid Increasing Cucumber Seedlings Tolerance to Alkaline Stress. Sci. Hortic. 2018, 235, 413–423. [Google Scholar] [CrossRef]
- Sarabi, B.; Bolandnazar, S.; Ghaderi, N.; Ghashghaie, J. Genotypic Differences in Physiological and Biochemical Responses to Salinity Stress in Melon (Cucumis melo L.) Plants: Prospects for Selection of Salt Tolerant Landraces. Plant Physiol. Biochem. 2017, 119, 294–311. [Google Scholar] [CrossRef]
- Foyer, C.H. Oxygen Processing in Photosynthesis. Biochem. Soc. Trans. 1996, 24, 427–433. [Google Scholar] [CrossRef] [Green Version]
- Gill, S.S.; Tuteja, N. Reactive Oxygen Species and Antioxidant Machinery in Abiotic Stress Tolerance in Crop Plants. Plant Physiol. Biochem. 2010, 48, 909–930. [Google Scholar] [CrossRef]
- Ye, S.; Huang, Z.; Zhao, G.; Zhai, R.; Ye, J.; Wu, M.; Yu, F.; Zhu, G.; Zhang, X. Differential Physiological Responses to Salt Stress between Salt-Sensitive and Salt-Tolerant japonica Rice Cultivars at the Post-Germination and Seedling Stages. Plants 2021, 10, 2433. [Google Scholar] [CrossRef]
- Hichem, H.; Mounir, D.; Naceur, E.A. Differential Responses of Two Maize (Zea mays L.) Varieties to Salt Stress: Changes on Polyphenols Composition of Foliage and Oxidative Damages. Ind. Crops Prod. 2009, 30, 144–151. [Google Scholar] [CrossRef]
- Jamshidi Goharrizi, K.; Amirmahani, F.; Salehi, F. Assessment of Changes in Physiological and Biochemical Traits in Four Pistachio Rootstocks under Drought, Salinity and Drought + Salinity Stresses. Physiol. Plant. 2020, 168, 973–989. [Google Scholar] [CrossRef]
- Bagheri, M.; Gholami, M.; Baninasab, B. Hydrogen Peroxide-Induced Salt Tolerance in Relation to Antioxidant Systems in Pistachio Seedlings. Sci. Hortic. 2019, 243, 207–213. [Google Scholar] [CrossRef]
- Jumpa, T.; Beckles, D.M.; Songsri, P.; Pattanagul, K.; Pattanagul, W. Physiological and Metabolic Responses of Gac Leaf (Momordica cochinchinensis (Lour.) Spreng.) to Salinity Stress. Plants 2022, 11, 2447. [Google Scholar] [CrossRef] [PubMed]
- Da Silva, B.R.S.; Lobato, E.M.S.G.; dos Santos, L.A.; Pereira, R.M.; Batista, B.L.; Alyemeni, M.N.; Ahmad, P.; Lobato, A.K.D.S. How Different Na+ Concentrations Affect Anatomical, Nutritional Physiological, Biochemical, and Morphological Aspects in Soybean Plants: A Multidisciplinary and Comparative Approach. Agronomy 2023, 13, 232. [Google Scholar] [CrossRef]
- Kato, M.; Shimizu, S. Chlorophyll Metabolism in Higher Plants. VII. Chlorophyll Degradation in Senescing Tobacco Leaves; Phenolic-Dependent Peroxidative Degradation. Can. J. Bot. 1987, 65, 729–735. [Google Scholar] [CrossRef]
- Analin, B.; Mohanan, A.; Bakka, K.; Challabathula, D. Cytochrome Oxidase and Alternative Oxidase Pathways of Mitochondrial Electron Transport Chain Are Important for the Photosynthetic Performance of Pea Plants under Salinity Stress Conditions. Plant Physiol. Biochem. 2020, 154, 248–259. [Google Scholar] [CrossRef]
- Polidoros, A.N.; Mylona, P.V.; Arnholdt-Schmitt, B. Aox Gene Structure, Transcript Variation and Expression in Plants. Physiol. Plant. 2009, 137, 342–353. [Google Scholar] [CrossRef] [PubMed]
- Sun, L.J.; Zhao, X.Y.; Ren, J.; Yan, S.P.; Zhao, X.Y.; Song, X.S. Overexpression of Cerasus humilis ChAOX2 Improves the Tolerance of Arabidopsis to Salt Stress. 3 Biotech 2021, 11, 316. [Google Scholar] [CrossRef]
- Alves, M.S.; Reis, P.A.B.; Dadalto, S.P.; Faria, J.A.Q.A.; Fontes, E.P.B.; Fietto, L.G. A Novel Transcription Factor, ERD15 (Early Responsive to Dehydration 15), Connects Endoplasmic Reticulum Stress with an Osmotic Stress-Induced Cell Death Signal. J. Biol. Chem. 2011, 286, 20020–20030. [Google Scholar] [CrossRef] [Green Version]
- Yang, G.; Zhou, R.; Tang, T.; Chen, X.; Ouyang, J.; He, L.; Li, W.; Chen, S.; Guo, M.; Li, X.; et al. Gene Expression Profiles in Response to Salt Stress in Hibiscus tiliaceus. Plant Mol. Biol. Rep. 2011, 29, 609–617. [Google Scholar] [CrossRef]
- Song, X.; Weng, Q.; Zhao, Y.; Ma, H.; Song, J.; Su, L.; Yuan, J.; Liu, Y. Cloning and Expression Analysis of ZmERD3 Gene From Zea Mays. Iran. J. Biotechnol. 2018, 16, 140–147. [Google Scholar] [CrossRef] [Green Version]
- Hoagland, D.R.; Arnon, D.I. The Water-Culture Method for Growing Plants without Soil; University of California: Berkeley, CA, USA, 1950. [Google Scholar]
- Ben Abdallah, M.; Trupiano, D.; Polzella, A.; De Zio, E.; Sassi, M.; Scaloni, A.; Zarrouk, M.; Ben Youssef, N.; Scippa, G.S. Unraveling Physiological, Biochemical and Molecular Mechanisms Involved in Olive (Olea europaea L. Cv. Chétoui) Tolerance to Drought and Salt Stresses. J. Plant Physiol. 2018, 220, 83–95. [Google Scholar] [CrossRef]
- Kumar, S.; Li, G.; Huang, X.; Ji, Q.; Zhou, K.; Hou, H.; Ke, W.; Yang, J. Phenotypic, Nutritional, and Antioxidant Characterization of Blanched Oenanthe javanica for Preferable Cultivar. Front. Plant Sci. 2021, 12, 639639. [Google Scholar] [CrossRef] [PubMed]
- Bradford, M.M. A Rapid and Sensitive Method for the Quantitation of Microgram Quantities of Protein Utilizing the Principle of Protein-Dye Binding. Anal. Biochem. 1976, 72, 248–254. [Google Scholar] [CrossRef] [PubMed]
- Ibrahim, W.; Qiu, C.-W.; Zhang, C.; Cao, F.; Shuijin, Z.; Wu, F. Comparative Physiological Analysis in the Tolerance to Salinity and Drought Individual and Combination in Two Cotton Genotypes with Contrasting Salt Tolerance. Physiol. Plant. 2019, 165, 155–168. [Google Scholar] [CrossRef] [PubMed]
- Wu, F.; Zhang, G.; Dominy, P. Four Barley Genotypes Respond Differently to Cadmium: Lipid Peroxidation and Activities of Antioxidant Capacity. Environ. Exp. Bot. 2003, 50, 67–78. [Google Scholar] [CrossRef]
- Chen, F.; Wang, F.; Wu, F.; Mao, W.; Zhang, G.; Zhou, M. Modulation of Exogenous Glutathione in Antioxidant Defense System against Cd Stress in the Two Barley Genotypes Differing in Cd Tolerance. Plant Physiol. Biochem. 2010, 48, 663–672. [Google Scholar] [CrossRef]
- Voigt, E.L.; Caitano, R.F.; Maia, J.M.; Ferreira-Silva, S.L.; De Macêdo, C.E.C.; Silveira, J.A.G. Involvement of Cation Channels and NH4+-Sensitive K+ Transporters in Na+ Uptake by Cowpea Roots under Salinity. Biol. Plant. 2009, 53, 764–768. [Google Scholar] [CrossRef]
- Wang, X.; Li, J.; Guo, J.; Qiao, Q.; Guo, X.; Ma, Y. The WRKY transcription factor PlWRKY65 enhances the resistance of Paeonia lactiflora (herbaceous peony) to Alternaria tenuissima. Hortic. Res. 2020, 7, 57–68. [Google Scholar] [CrossRef] [Green Version]


Disclaimer/Publisher’s Note: The statements, opinions and data contained in all publications are solely those of the individual author(s) and contributor(s) and not of MDPI and/or the editor(s). MDPI and/or the editor(s) disclaim responsibility for any injury to people or property resulting from any ideas, methods, instructions or products referred to in the content. |
© 2023 by the authors. Licensee MDPI, Basel, Switzerland. This article is an open access article distributed under the terms and conditions of the Creative Commons Attribution (CC BY) license (https://creativecommons.org/licenses/by/4.0/).
Share and Cite
Lu, W.; Zhao, Y.; Liu, J.; Zhou, B.; Wei, G.; Ni, R.; Zhang, S.; Guo, J. Comparative Analysis of Antioxidant System and Salt-Stress Tolerance in Two Hibiscus Cultivars Exposed to NaCl Toxicity. Plants 2023, 12, 1525. https://doi.org/10.3390/plants12071525
Lu W, Zhao Y, Liu J, Zhou B, Wei G, Ni R, Zhang S, Guo J. Comparative Analysis of Antioxidant System and Salt-Stress Tolerance in Two Hibiscus Cultivars Exposed to NaCl Toxicity. Plants. 2023; 12(7):1525. https://doi.org/10.3390/plants12071525
Chicago/Turabian StyleLu, Wenjing, Ye Zhao, Jinying Liu, Bowen Zhou, Guoqing Wei, Ruiqiang Ni, Shuyong Zhang, and Jing Guo. 2023. "Comparative Analysis of Antioxidant System and Salt-Stress Tolerance in Two Hibiscus Cultivars Exposed to NaCl Toxicity" Plants 12, no. 7: 1525. https://doi.org/10.3390/plants12071525