Article

Effect of Long-Term Semiarid Pasture Management on Soil Hydraulic and Thermal Properties

1
Department of Crop, Soil and Environmental Sciences, Auburn University, Auburn, AL 36849, USA
2
Department of Plant and Soil Science, Texas Tech University, Lubbock, TX 79409, USA
3
Rodale Institute, 611 Siegfriedale Rd., Kutztown, PA 19530, USA
*
Author to whom correspondence should be addressed.
Plants 2023, 12(7), 1491; https://doi.org/10.3390/plants12071491
Submission received: 6 March 2023 / Revised: 26 March 2023 / Accepted: 27 March 2023 / Published: 29 March 2023
(This article belongs to the Special Issue Strategies to Improve Water-Use Efficiency in Plant Production)

Abstract

:
Semiarid pasture management strategies can affect soil hydraulic and thermal properties that determine water fluxes and storage, and heat flow in unsaturated soils. We evaluated long-term (>10 years) perennial and annual semiarid pasture system effects on saturated hydraulic conductivity (ks), soil water retention curves (SWRCs), soil water thresholds (i.e., volumetric water content (θv) at saturation, field capacity (FC), and permanent wilting point (PWP); plant available water (PAW)), thermal conductivity (λ), and diffusivity (Dt) within the 0–20 cm soil depth. Forage systems included: Old World bluestem (Bothriochloa bladhii) + legumes (predominantly alfalfa (Medicago sativa)) (OWB-legume), native grass-mix (native), alfalfa + tall wheatgrass (Thinopyrum ponticum) (alfalfa-TW), and annual grass-mix (annual) pastures on a clay loam soil; and native, teff (Eragrostis tef), OWB-grazed, and OWB-ungrazed pastures on a sandy clay loam soil. The perennial OWB-legume and native pastures had increased soil organic matter (SOM) and reduced bulk density (ρb), improving ks, soil water thresholds, λ, and Dt, compared to annual teff and alfalfa-TW (P < 0.05). Soil λ, but not Dt, increased with increasing θv. Grazed pastures decreased ks and water retention compared to other treatments (P < 0.05), yet did not affect λ and Dt (P > 0.05), likely due to higher ρb and contact between particles. Greater λ and Dt at saturation and PWP in perennial versus annual pastures may be attributed to differing SOM and ρb, and some a priori differences in soil texture. Overall, our results suggest that perennial pasture systems are more beneficial than annual systems for soil water storage and heat movement in semiarid regions.

1. Introduction

Soil hydraulic properties, which are needed for analyzing water fluxes and storage in unsaturated soils, can play an essential role in agricultural water management, especially in water-scarce regions [1]. Broadly, soil hydraulic properties, such as saturated hydraulic conductivity (ks) and soil water retention characteristics or curve (SWRC), are affected by both inherent and dynamic soil properties that can be managed or controlled, at least to a certain extent [2]. These soil properties include soil texture, pore size distribution, mineralogical composition, soil structure and aggregation, infiltration, bulk density (ρb), and soil organic matter (SOM) content [3,4]. These properties can be influenced by various factors, including land uses [5,6], root biomass [7], soil fauna [8], shrinking and swelling properties of clay soils [9], freezing and thawing [10,11], and agricultural activities such as tillage [12], wheel-traffic compaction [13], and animal trampling [14].
Similarly, soil thermal properties influence the partition of energy at the soil surface and control the soil thermal regime, thereby affecting coupled liquid water, water vapor, and heat transport in unsaturated soils [15,16,17]. The fundamental soil thermal properties, such as thermal conductivity (λ), volumetric heat capacity (Cv), and thermal diffusivity (Dt), can be affected by soil texture, soil structure, mineralogical composition, aggregate size, ρb, degree of compaction, soil porosity, soil water content, and SOM [18,19]. These properties (λ, Cv, and Dt) influence crop production systems by affecting seed germination, seedling emergence, water and nutrient uptakes by plant roots, root growth, and crop growth [20,21].
Grassland pastures are increasingly valued for their roles in conserving water and providing sustainable and economically viable alternatives to irrigated crop monocultures for the High Plains agriculture in the USA [22]. Although hydraulic and thermal properties are imperative for determining soil water fluxes, storage, and heat flow in unsaturated soils, these properties are seldom measured routinely in grassland pasture systems. This hinders our understanding of the water and thermal regimes of soil in forage production systems, which further impedes efforts to efficiently manage and conserve water resources in these semiarid pasture systems. Unsaturated soils managed under grassland and natural prairie system have shown stable pore size distribution compared to crop areas [23]. Fuentes et al. (2004) [24] reported that organic matter content in the natural prairie soil was twice the large amount seen under cultivated (i.e., conventional till and no-till) soils. The enhanced hydraulic properties were also observed in the natural prairie soil, and saturated and near-saturated hydraulic conductivities in the natural prairie were about one order of magnitude greater than in the cultivated soils [24]. Similarly, Fischer et al. (2014) [8] suggested that grasses and legumes could enhance earthworm activity, thereby influencing infiltration capacity due to changes in the burrowing activity of earthworms. Taproots of legumes can increase infiltration by forming vertical channels after decomposition [7]. Mixtures of different grass and legume species have been recommended for superior soil health [25,26] and soil water utilization [27].
Several studies have indicated ecological linkages between aboveground and belowground processes, as affected by plant community composition (e.g., microbiota assembly and nutrient mineralization), especially in C3 and C4 species [28,29]. For example, herbivory is an aboveground process that can change the quality and quantity of resources produced by plants, such as carbon and nitrogen [29], and alter soil physical properties, such as soil porosity and structure [14]. Regardless of soil texture, strategies that change SOM could impact soil water retention characteristics [30]. Besides agronomic practices, changes in land use management could alter the soil pore structures in the range from saturation (pressure head (h) of 0 cm) to h of −50 cm [31]. Schwartz et al. (2003) [5] suggested that the modifying effects of tillage, reconsolidation, and pore structure evolution on hydraulic properties are critical processes governing water movement in fine-textured soils of different land uses such as native grassland, tilled cropland, and reestablished grassland.
Studies on the effect of grassland management on soil physical properties have typically focused on variations in hydraulic conductivities due to water management, tillage, cropping systems, cover crops, soil amendments, and grazing. However, information on long-term pasture management effects on soil water retention characteristics for various annual and perennial pasture systems is limited. There is also limited information on the effect of annual and perennial pasture systems on soil water retention characteristics and their relationships to soil thermal properties. This lack of information is equally true for semiarid pasture systems with clayey soils. We considered that enhanced soil water and thermal regimes in the upper 20 cm soils were associated with improving soil physical, hydraulic, and thermal properties influenced by long-term perennial and annual pasture management practices. The objectives were to evaluate and analyze: (1) the effect of semiarid perennial and annual pasture management practices on soil hydraulic and water retention characteristics in two pasture soils with contrasting clay contents and (2) the effect of these pasture systems on soil thermal properties as a function of soil water contents given by soil water retention curves (SWRCs).

2. Materials and Methods
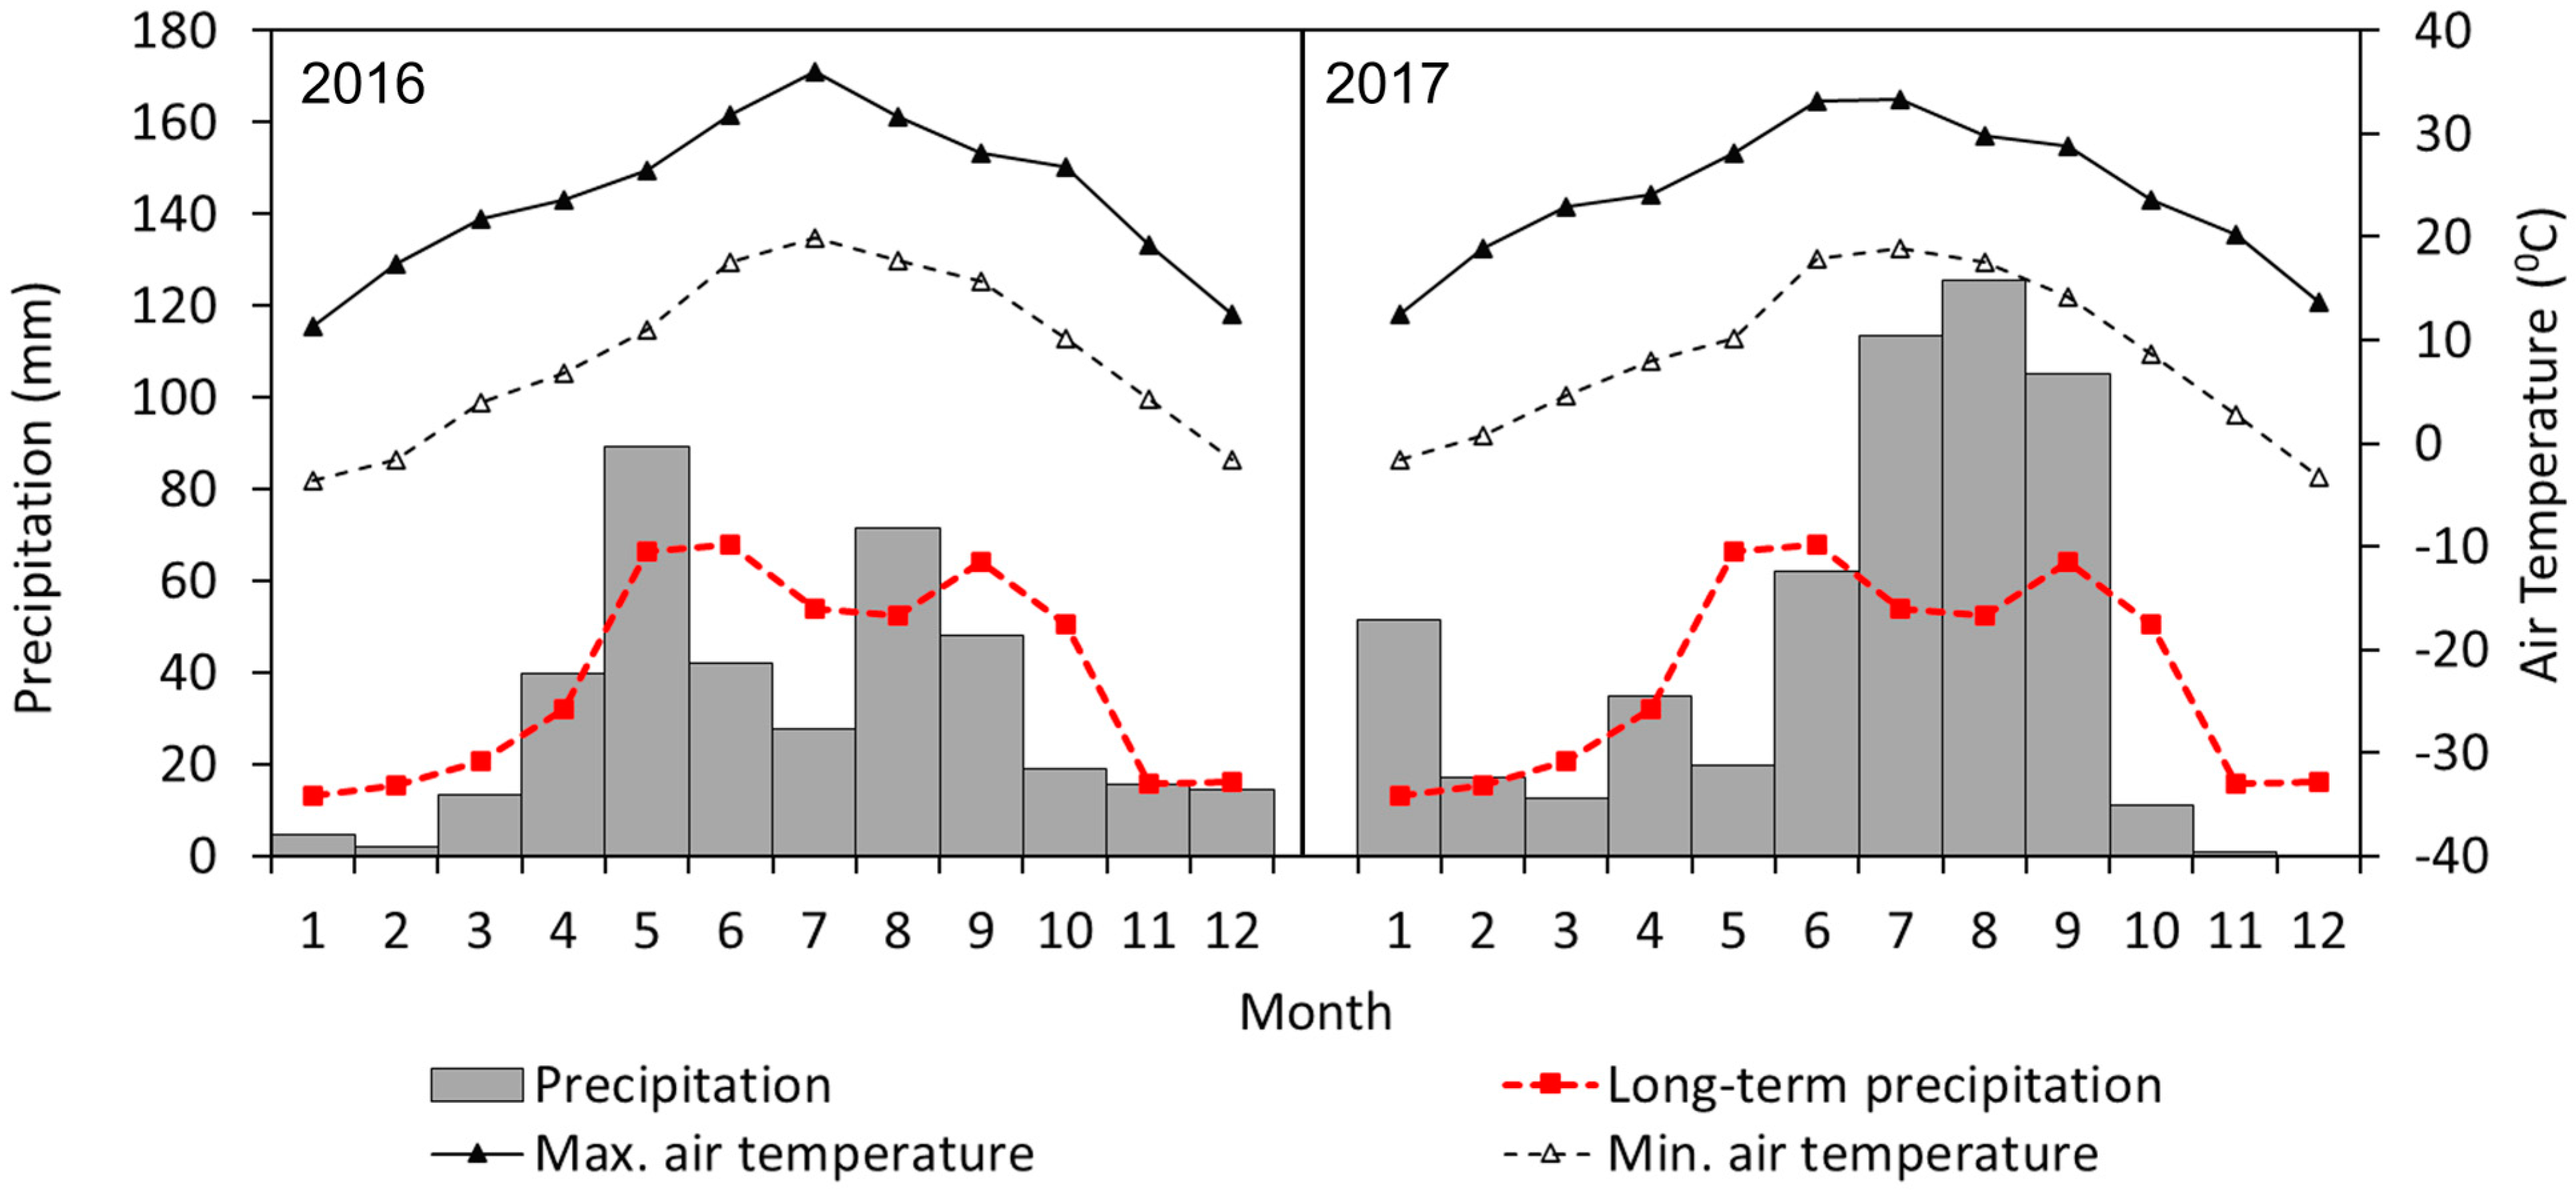
2.1. Study Site

The study was conducted at the Texas Tech University’s Forage-Livestock Research Laboratory Farm, New Deal, located 24 km northeast of Lubbock, TX, USA (33°43′47.2″ N, 101°43′47.1″ W at 993 m above mean sea level). The study site represented unsaturated soils that have undergone semiarid pasture management since 1997 [22]. This included variable precipitation conditions typical of the Texas Southern High Plains and various forage crop species, cattle grazing systems, water management practices (i.e., irrigation and dryland), and tillage methods. The land was nearly level, with 0 to 1% slopes. The taxonomic class of soil was Pullman clay loam (fine, mixed, superactive, thermic Torrertic Paleustolls), extensive in MLRA (Major Land Resource Area) 77C of the Southern High Plains [32]. The soil has 35 to 50% silicate clay and 0 to 3% carbonate clay content [32]. The diagnostic horizons include Ap, Bt1, Btk1, Btk2, and Btk3, with depth to secondary carbonates at 50 to 76 cm and calcic horizon at 76 to 150 cm [32]. The site has a continental, semiarid climate where the long-term mean annual precipitation for Lubbock County is 469 mm, and annual evapotranspiration is 1500 mm [33]. Monthly precipitation and air temperatures are presented in Figure 1. During the study period (2016–2017), 2016 was drier than 2017 when compared to the long-term average precipitation, especially during summer (June–September) and winter (November–December). The average daily maximum temperature exceeded 30 °C from June to August, while the minimum temperature remained below 0 °C from December to January.

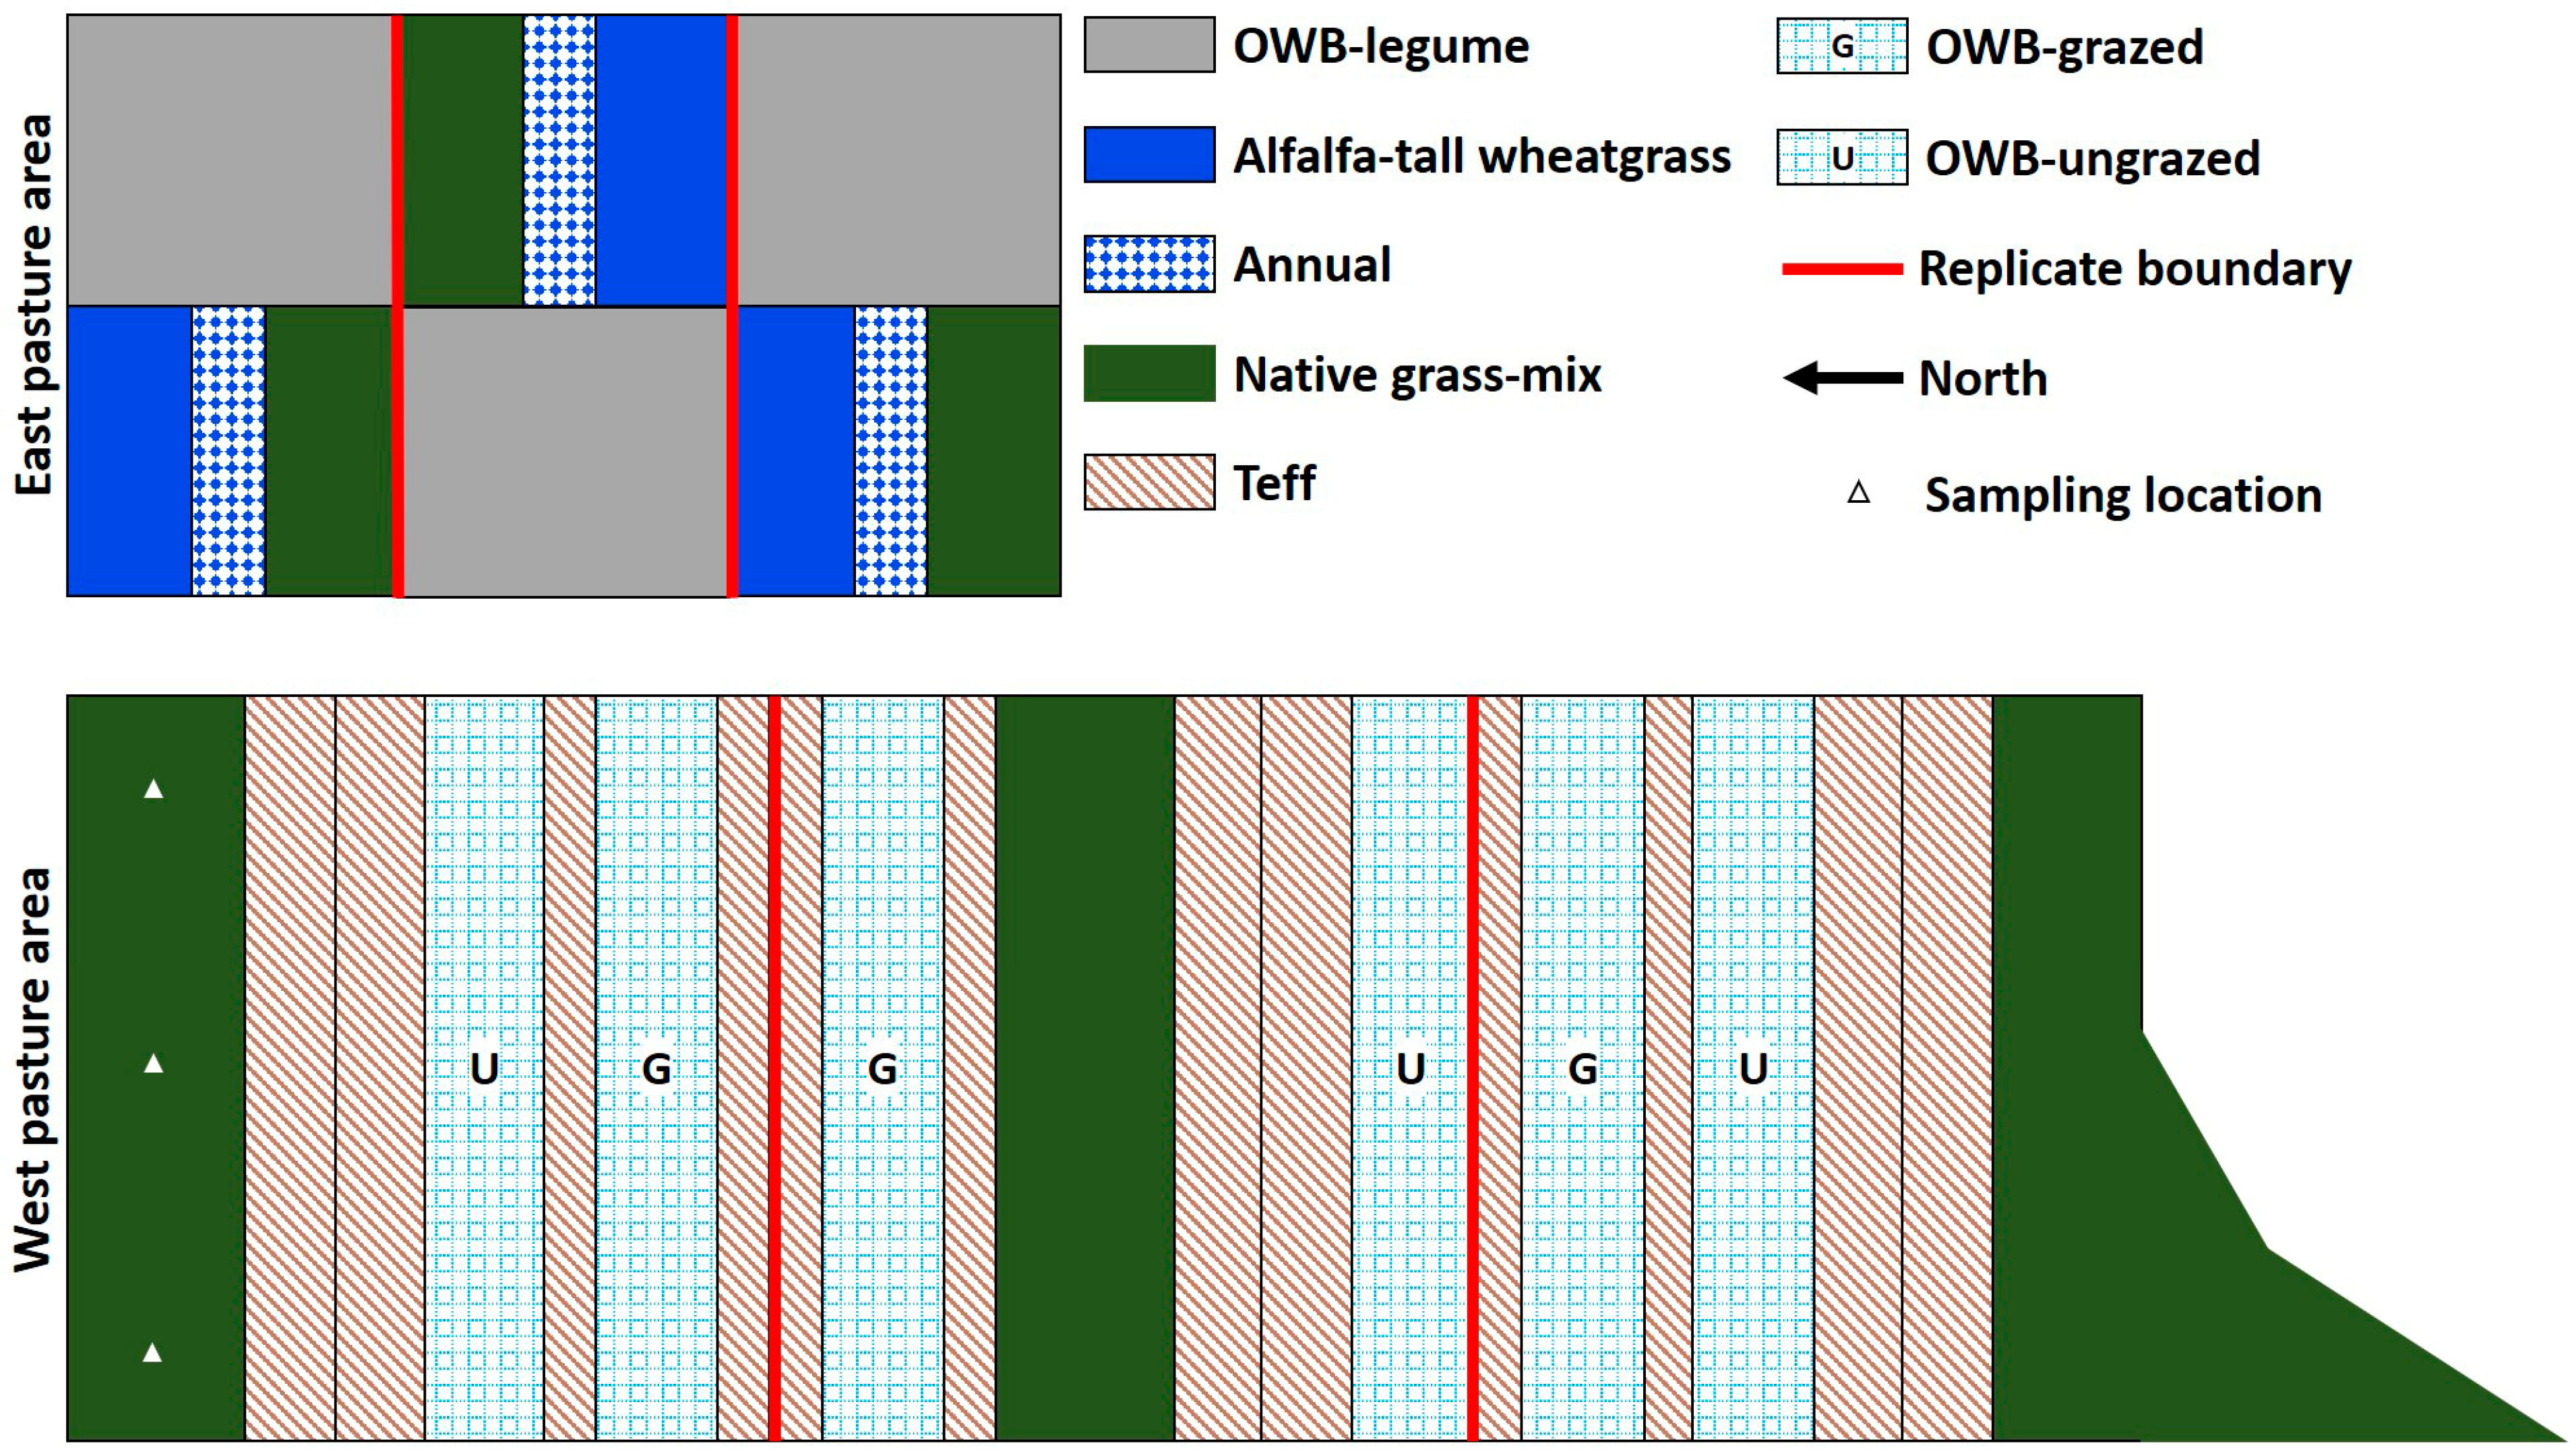
2.2. Experiment Design and Pasture Management

The experimental site for this study had two major pasture areas, of which the east pasture area (12.3 ha) (Figure 2, top) was smaller than the west pasture (32.7 ha) (Figure 2, bottom). The establishment and management of these pastures were described by [22] and [34] (Supplementary Tables S1 and S2). The east pasture area was established in 1983 and was under perennial forages for many years (>30 years). The west pasture area, established in 2002, was previously under continuous cotton (Gossypium hirsutum L.) system. Treatments were only compared within, rather than between, these selected pasture areas to avoid confounding effects of time since the establishment and management history. The differences in ρb, soil texture, and SOM between these pastures were also emphasized in previous studies [35,36]. Over the years, the establishment and management practices, such as water and irrigation management, crop rotation, use of various forage species, grazing, and tillage methods, were different for each pasture type or system in both east and west pasture areas. Different pasture systems were categorized into four broad practices (or treatments) in each pasture area to evaluate hydraulic and thermal properties in the upper 0–20 cm soil depths under long-term pasture management practices. In addition, a comparison was made between two specific pasture treatments: a grass-only (monoculture or grass-mix) and a grass-legume (two or more species) mixture.
During the study period (2016–2017), the west pasture area had pasture systems that contained either teff (Eragrostis tef (Zucc.) Trotter), native grass-mix (buffalograss (Buchloe dactyloides (Nutt.) Engelm), blue grama (Bouteloua gracilis (Willd. Ex Kunth) Lag. Ex Griffths), sideoats grama (Bouteloua curtipendula (Michx.) Torr), and green sprangletop (Leptochloa dubia (Kunth.) Nees)), or Old-World bluestem cv. WW-B.Dahl (OWB, Bothriochloa bladhii (Retz) T. Blake). The east pasture area had pasture systems containing either mixtures of OWB + alfalfa (Medicago sativa L.) + yellow sweetclover (Melilotus officinalis L.), alfalfa + tall wheatgrass (TW, Thinopyrum ponticum (Host) Beauv.), native, or teff (Eragrostis tef) (only in 2016). Since one of the replicate pastures in the east area had teff only in 2016 and was under different annual crops in previous years, such as sorghum–sudangrass (Sorghum bicolor (L.) Moench), wheat (Triticum aestivum L.), cereal rye (Secale cereale L.), or left fallow (annual weeds) during a severe drought in 2011 and 2012, the pasture was treated as annual. The native pastures in the east area did not have buffalograss. The grazing versus ungrazed (haying only) effect on soil hydraulic and thermal properties were evaluated for OWB pastures in the west area.
The experiment compared treatments using errors estimated with three replicate pastures nested within each pasture area (Figure 2). The east area replicates contained forage types that composed the grass-only and grass-legume systems to compare. A more favorable design would have all treatments within each spatial replicate; nevertheless, permanent physical structures of subsurface irrigation systems, fencing, and established stands did not allow the redesign of treatments and replicates. This study, aimed at evaluating the effect of perennial and annual pasture systems on soil hydraulic and thermal properties, was laid out in accordance with the layout of pasture treatments carried out over the years in the east and west pasture areas. The treatment arrangement in this study may have incurred unforeseen errors owing to a potential confounding of natural differences in soil properties between the east and west areas, for example, depth to the CaCO3 layer. However, the north–south placement of replicates and the separation of the east area from the west area may have minimized the potentially confounding effects on treatment differences.

2.3. Sample Collection and Preparation

Soil sampling was carried out from September to November in 2016 and from March to May in 2017. Soil samples were collected from three spatial points stratified in each pasture (Figure 2; see triangles in the west native treatment). Samples were taken from each end (10 m from the fence) and the middle of the pastures while maintaining a distance of at least 15 m between the sampling points. Both bulk and core soil samples were collected from each sampling point. Bulk samples were collected from 0–10 cm and 10–20 cm depths using a shovel in each treatment plot. The vegetative cover was not considered part of the surface soil sample. Collected bulk samples were stored in polyethylene zipper bags, labeled, and placed in a container to avoid evaporation. A total of 198 bulk samples (11 pastures × 3 replicates × 3 locations × 2 soil depths) were collected from the experimental site each year.
Similarly, undisturbed core samples were collected using 5 × 5 cm cylindrical cores at each sampling point. Core sampling was carried out with the help of a core sampler (with slide hammer attachment) at different soil depths down to 20 cm (i.e., 0–5, 5–10, 10–15, and 15–20 cm). Each aluminum liner with a core sample was removed from the core sampler, labeled, and sealed immediately with polyethylene end caps at both ends of the liner to prevent both soil loss and evaporation. A total of 396 soil cores (11 pastures × 3 replicates × 3 locations × 4 soil depths) were collected from the experimental site each year. All soil samples were transferred from the experimental site to the Soil Physics Laboratory at Texas Tech University. Bulk samples were air-dried, crushed, and sieved to pass a 2 mm screen before further analysis of soil properties. Bulk and core samples were stored in the refrigerator at 4 °C before analysis.

2.4. Determination of Soil Properties

2.4.1. Basic Soil Properties

The gravimetric water content (θg) of soil samples was determined from a 55 g sub-sample taken from fresh bulk samples. A pre-weighed aluminum foil was used to place the soil in a drying oven (Thermo Fisher Scientific, Waltham, MA) at 105 °C for at least 24 h until a constant dry weight was recorded. The θg (g g−1) was determined by dividing the weight of water by the weight of dry soil. About 50 g of air-dried sample (<2 mm) was used to conduct particle size analysis using the sedimentation (hydrometer) method [37] with the ASTM 152H hydrometer. Hydrometer readings and suspension temperature data were taken at 40 s and after 3 h, which were then used to estimate sand, clay, and silt percentages. The 5 × 5 cm core samples were used to determine soil ρb (g cm−3) by the core method [38], in which ρb was calculated as the ratio of the mass of dry soil solids (after oven drying at 105 °C for 24 h) to the bulk volume (volume of solids plus soil pores). The SOM content of soil samples was determined using the loss-on-ignition procedure that estimates SOM based on the gravimetric weight change associated with the high-temperature oxidation of organic matter [39]. About 10 g bulk soil sample was dried in an oven at 105 °C for 24 h and then ignited in a muffle furnace (Thomas Scientific, Swedesboro, NJ, USA) at 400 °C for 16 h. The difference in weight before (i.e., the weight of oven-dried soil at 105 °C) and after ignition (i.e., the weight of soil at 400 °C) was taken as the amount of SOM (mg g−1) that was present in the sample.

2.4.2. Soil Hydraulic Conductivity and Soil Water Retention Characteristics

Measurements of ks (cm d−1) were made on soil core samples (8 cm in diameter and 5 cm in height) by using both constant head and falling head methods [40] with a KSAT benchtop instrument (Meter Group, Inc., Pullman, WA, USA). Before ks measurement, air-dried bulk soil samples from 0–10 and 10–20 cm depths with known ρb values were repacked into 8 × 5 cm sampling cylinders. The measurement of ks was repeated three times for each core sample. In addition, a limited number of core samples using instrument-specific 8 × 5 cm cylinders were also collected from 0–10 and 10–20 cm soil depths to verify ks measurements of saturated repacked soil cores with saturated intact cores using the KSAT instrument. Both constant head and falling head methods, which determine soil ks using Darcy’s equation, are represented by the following governing equations (Equations (1) and (2), respectively).
k s = V L A t H = Q L A H where ,   Q = V t
k s = 2.303 a L A t t log 10 H 0 H t
where ks is the saturated hydraulic conductivity (cm s−1), V (cm3) is the volume of water flowing through the cross-sectional area A (cm2) of the soil sample per unit time t (s), Q is the steady-state flow rate from Mariotte flask (cm3 s−1), H is the hydraulic head difference between the water inlet and outlet level (cm), L is the length of the soil sample (cm), a is the cross-sectional area of the burette (cm2), H0 and Ht are the initial and final hydraulic head differences in the burette (cm), and tt is the time taken for the pressure head to drop from the initial to final pressure head in the burette (s).
Soil water retention characteristics were determined using the pressure chamber method [41] for all treatments in each pasture area using 5 × 5 cm core samples taken at soil depths of 0–5, 5–10, 10–15, and 15–20 for each year. A pressure plate apparatus (Soil Moisture Equipment Corp., Santa Barbara, CA, USA) was used to determine SWRC at nine pressure heads (h): 0 (at saturation), −100, −330, −500, −2000, −3000, −5000, −10,000, and −15,000 cm. Core samples were saturated from the bottom, weighed, and then placed on a saturated ceramic pressure plate in the pressure plate extractor. A predetermined h was applied for 36 to 48 h. Once the cores were equilibrated to applied h, cores were removed from the extractor and weighed. The same procedure was repeated with successively lower (more negative) h (i.e., from −100 to −15,000 cm). The ceramic plates corresponding to higher h (saturation to −3000 cm) and lower h (−5000 to −15,000 cm) were used to determine SWRCs (soil water retention curves) in the wet and dry soil water ranges, respectively. At the end of the experiment, gravimetric (θg) and volumetric (θv) water contents (cm3 cm−3) of the core samples were estimated from known ρb (g cm−3) of the core samples, dry weight of the core samples, and weight of the core samples at the end of each pressure head (h) experiment. The θv determined at each applied h was averaged over three replicate soil cores. The θv values were plotted against the corresponding h values to obtain functional relationships between θv and h of the soil samples, i.e., SWRCs for all treatments in the east and west pasture areas.
To quantify water flow parameters in unsaturated soils under long-term pasture management practices in both pasture areas, the van Genuchten’s SWRC model [42], which has shown its feasibility for a wide variety of soils (e.g., [43,44]), was fitted to measured SWRCs at different soil depths (i.e., 0–5, 5–10, 10–15, and 15–20 cm) for all treatments, using a nonlinear least-squares optimization program RETC [43].
θ v h = θ r + θ s θ r 1 + α v h n 1 1 n
where θr and θs are the residual and saturated θv, respectively (cm3 cm−3); h is the pressure head (cm); and αv (is related to the inverse of air entry pressure head; cm−1) and n (is related to pore size distribution; dimensionless) are fitting shape parameters of the SWRC. Soil water thresholds, necessary for water management in agricultural systems, were obtained from measured SWRCs at different soil depths for all treatments in each pasture area. Soil water for h > −15,000 cm was considered unavailable to plants. The θs (i.e., θv at saturation) provided a measure of the total porosity of soil samples. Plant available water (PAW) was determined as the difference between field capacity water content (FC; θv at h = −330 cm), which is the upper limit of PAW, and permanent wilting point (PWP; θv at h = −15,000 cm) when the plant can no longer extract water from the soil.

2.4.3. Soil Thermal Properties

For all treatments in each pasture area, measurements of λ (W m−1 K−1), Cv (MJ m−3 K−1), and Dt (mm2 s−1) were made on 5 × 5 cm core samples taken at soil depths of 0–5, 5–10, 10–15, and 15–20 cm using the KD2 Pro Thermal Properties Analyzer (Meter Group, Inc., Pullman, WA, USA). The λ, Cv, and Dt values were measured simultaneously during the SWRC measurements at applied pressure heads (h) of 0 (at saturation), −100, −330, −500, −2000, −3000, −5000, −10,000, and −15,000 cm. The KD2 pro instrument, equipped with a dual-needle sensor (30 mm long, 1.3 mm diameter, and 6 mm spacing), works on principles of the transient line heat source analysis [45,46]. The instrument was calibrated before measuring λ, Cv, and Dt of core samples using a Delrin verification block supplied by the manufacturer.
During SWRC measurements, after the soil water equilibrium had been reached at each of the applied pressure heads, the core samples were removed from the pressure extractor, and the dual-needle sensor was inserted at the full depth of the needles into each core sample to determine λ, Cv, and Dt. During the measurement of λ, Cv, and Dt, the KD2 pro instrument applied heat for a set of heating times (th) to one of the needles that contained a heating element. The heat was then transferred into the soil between two needles, and the temperature was measured in the measuring needle during the heating and the cooling period following heating. The resulting data were fitted to the following equations (Equations (4) and (5)) using a nonlinear least-squares procedure [47].
Δ T = b 0 t + b 1 E i b 2 t   where   Δ T = 4 π T T 0 q
Δ T = b 0 t + b 1 E i b 2 t E i b 2 t t h
where ΔT is the temperature rise at the measuring needle; T0 is the temperature at the start of the measurement; T is the measured temperature; b0, b1, and b2 are the fitting parameters; q is the heat input at the heated needle (W m−1); Ei is the exponential integral that is approximated using polynomials [48]; t is time (s); and th is the heating time (s). Equation (4) was applied for the first th when the heat was on, while Equation (5) was applied when the heat was off. The λ and Dt were then computed from Equations (6) and (7), respectively, while Cv was given as the ratio of λ and Dt.
λ = 1 b 1
D t = r 2 4 b 2
where r is the distance from the heated needle to the measuring needle.

2.5. Statistical Analysis

Measured data were analyzed separately for the east and west pasture areas. The generalized linear mixed model (PROC GLIMMIX) procedure in SAS version 9.4 [49] was used [50] to test the statistical significance of measured soil hydraulic and thermal properties among pasture treatments, soil depths, treatment × depth interactions, and depth × year interactions within each pasture area. Treatment differences were considered significant when ≥least significant difference (LSD) at α = 0.05. Pasture treatments were set as a fixed effect, whereas replication was set as a random effect. The repeated measurement analysis was performed for changes over the years [51], in which the denominator df (degrees of freedom) was adjusted to obtain an appropriate standard error using the Kenward–Roger method [52]. The relationship between variables was analyzed using a regression procedure (PROC REG). The outputs from the RETC model were exported to SigmaPlot 12.5 [53] to draw SWRCs for each treatment and depth.

3. Results and Discussion

3.1. Basic Soil Properties

Sand, silt, and clay contents in unsaturated soils were not affected by management practices in both east and west pasture areas (P > 0.05, Table 1). The east area was more clayey (i.e., clay loam according to the USDA classification) than the west (i.e., sandy clay loam). The variability in soil texture observed in pasture areas was consistent with previous studies [36,54]. SOM contents differed among treatments at 0–20 cm depth (Table 1). There was a treatment × year interaction for the east area (P < 0.01), while treatments did not affect SOM in the west in 2017 (P > 0.05). In the east pasture area, OWB-legume had the greatest SOM compared to alfalfa-TW, native, and annual (P < 0.01), whereas the annual had the lowest SOM (P < 0.01). OWB-grazed and OWB-ungrazed had consistently greater SOM than teff in 2016 (P < 0.05), while the native was intermediate between OWB and teff. Grazing did not affect SOM in the west OWB pasture (P > 0.05).
The greater SOM content at OWB pastures could be attributed to its vegetative characteristics. It has been evident that OWB-legume produced more biomass than native, alfalfa-TW, teff, and other annual grasses because of its ability to tolerate drought and longer vegetative period [34,55,56]. This suggested that more organic matter could return to the soil after the decomposition of aboveground residue and roots. Various OWB pasture systems have been reported to enhance microbial biomass [57] and soil organic C [58].
OWB pasture in the east had greater SOM than in the west (Table 1), which was most likely the result of the inclusion of legume and perennial species over more years. In a previous study conducted by Bhandari et al. (2018) [35], OWB-alfalfa pastures had greater soil organic C than native pastures in the east area, owing to a larger microbial population size. Generally, grazing animals help mix plant residues and manure into the soil, thereby increasing microbial substrate quality. However, responses of microbial biomass C and microbial community structure to grazing have yielded contrasting results in different studies (e.g., [57,59,60,61]). For instance, Acosta-Martinez et al. (2010) [57] and Wang et al. (2006) [61] observed increased microbial biomass under grazed systems. In contrast, Ingram et al. (2008) [60] reported lower microbial biomass in grazed pasture soils compared to ungrazed soils. Overall, our results indicated that OWB, a C4 perennial grass, was very effective in building SOM, while annuals and natives were less effective.
In both pasture areas, ρb values were lower in the upper 0–5 cm soil depth (1.41 and 1.44 g cm−3 for the east and west areas, respectively) than in the 5–20 cm depth (Table 1). The treatment × year interaction was not significant for both pasture areas (P > 0.05). In the east area, ρb in the 0–5 cm depth differed among pasture treatments (P < 0.05), whereas treatment had no effect in the deeper soil depths (P > 0.05). OWB-legume pasture had lower ρb than alfalfa-TW and annual in the upper 0–5 cm, while native had intermediate ρb values between OWB-legume and alfalfa-TW and annual pastures. On the contrary, ρb in the 0–5 cm was not affected by treatments in the west area (P > 0.05). Nonetheless, the treatment effect on ρb was observed for 5–10 and 10–15 cm depths (P < 0.05). Ungrazed OWB showed lower ρb than OWB-grazed and teff (P < 0.05). As in the east pasture, natives had an intermediate ρb value between OWB and teff in the west area. Grazing increased ρb in OWB pasture by 10% over OWB-ungrazed within the 5 to 15 cm soil depth in the west area, likely owing to animal trampling as SOM content was the same in both OWB-grazed and OWB-ungrazed pastures (Table 1). Animal trampling might decrease soil macroporosity (i.e., large pore spaces) and the total pore volume of soil, thereby increasing ρb. Higher ρb values under annual and teff pasture systems could be attributed to wheel traffic compaction and destruction of macropores due to tillage during planting. During soil sampling, the average gravimetric water content of the top 20 cm of soil was 10% and 11% in the east and west areas, respectively (Table 1). Native in 2016 and OWB-legume in 2017 in the east area had more soil water content than alfalfa-TW and annual. During soil sampling in the west pasture area in both years, OWB-grazed and OWB-ungrazed had more soil water content than native and teff (Table 1).

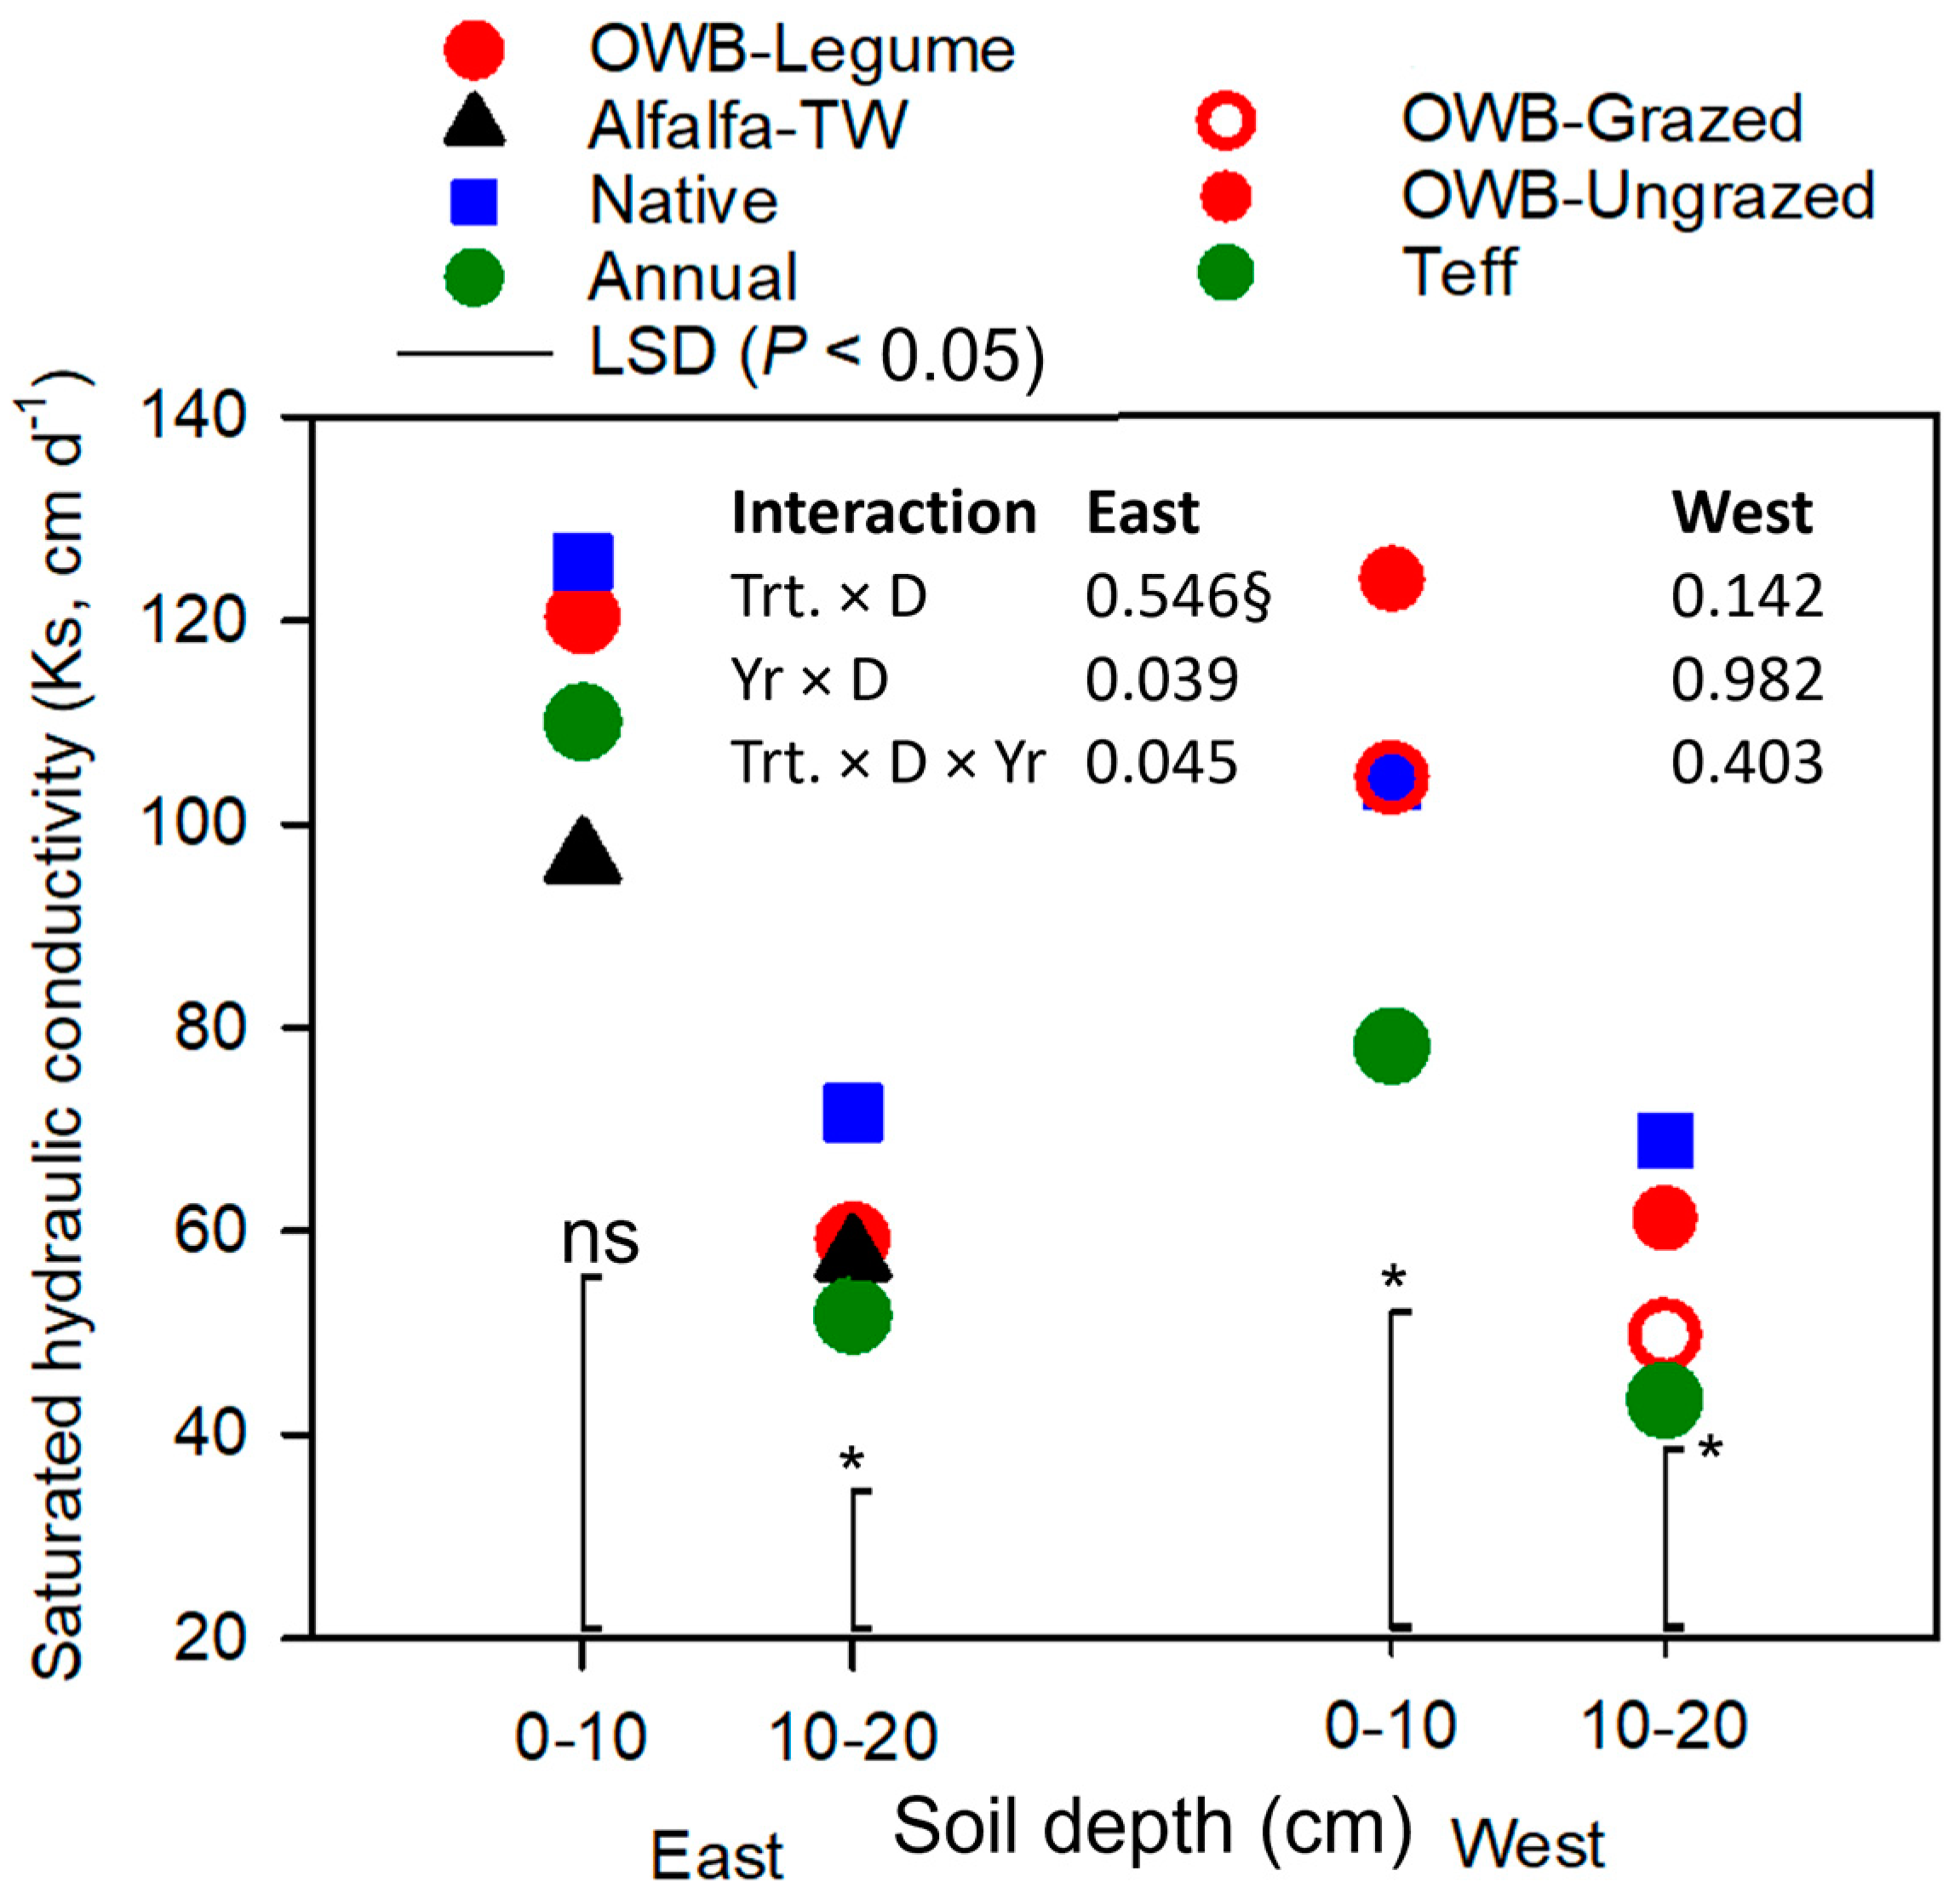
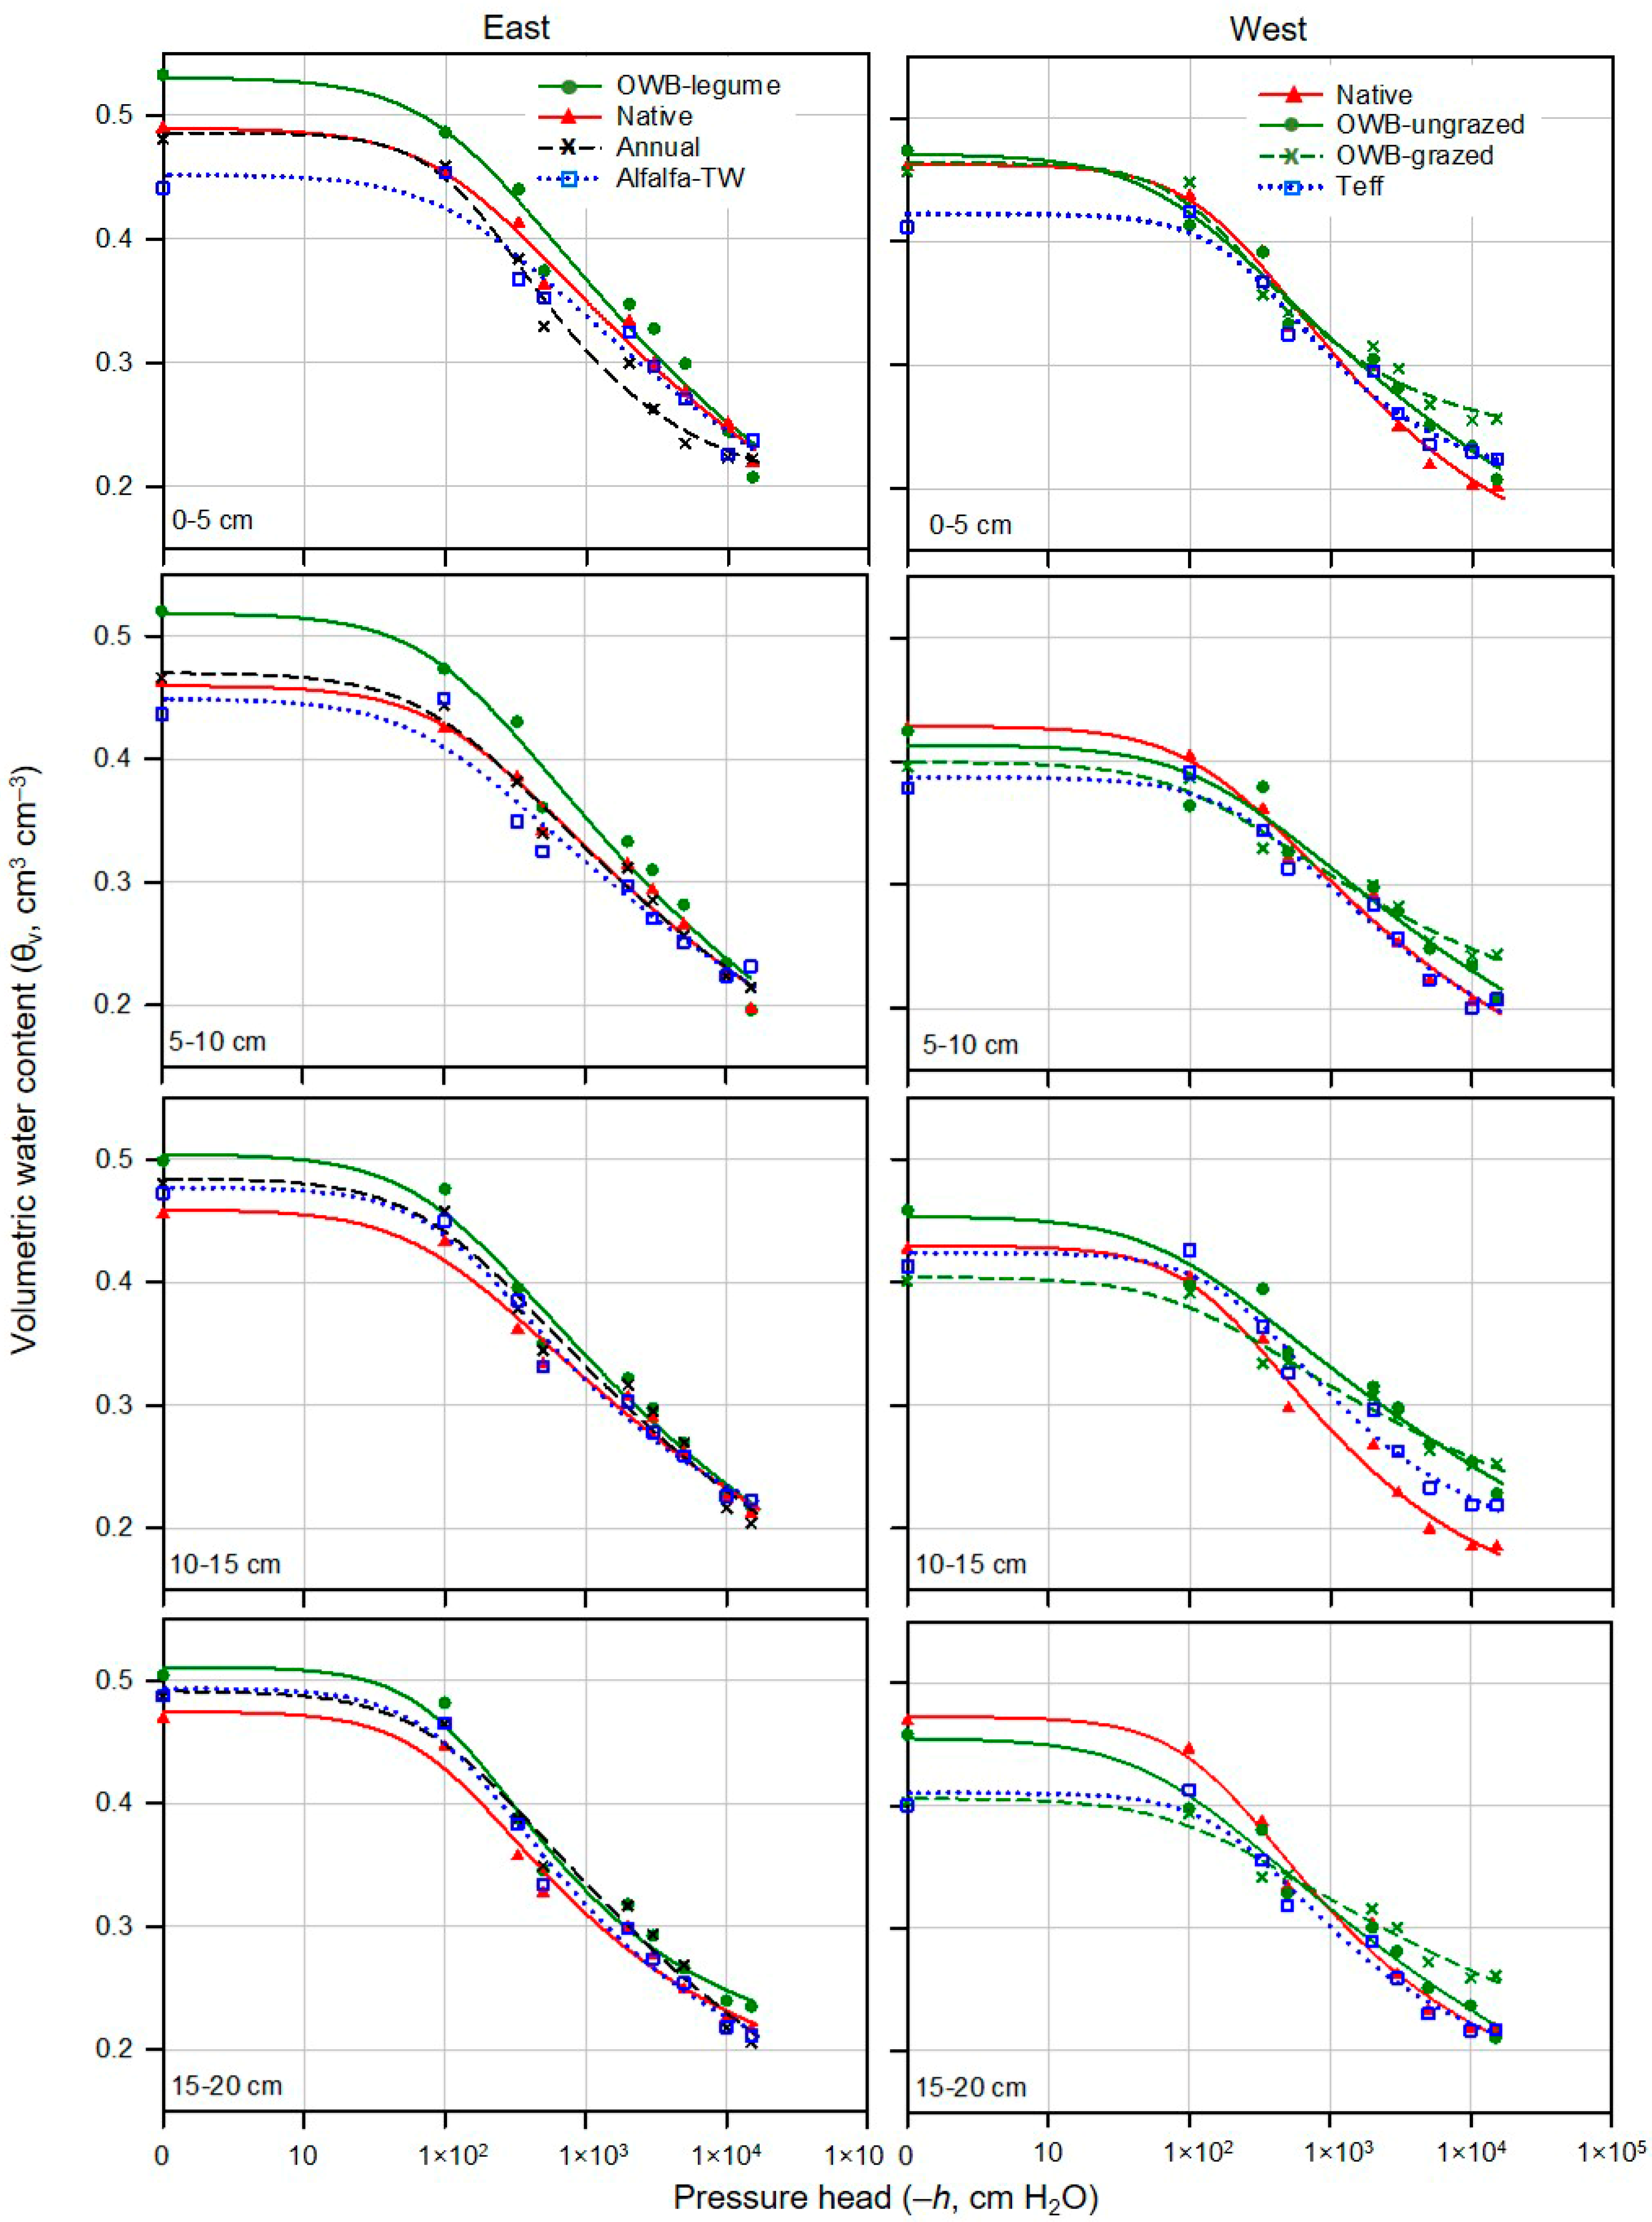
3.2. Soil Hydraulic Properties and Water Retention Characteristics

Saturated hydraulic conductivity (ks) values were 61 and 57 cm d−1 at depths of 0–10 and 10–20 cm, respectively, in the west pasture area during 2016–2017. The respective ks values for these depths in the east area were greater, i.e., 113 and 103 cm d−1, even though the east pasture soils had higher clay contents. Notably, the east pasture area tended to have lower ρb values than the west (Table 1). Hence, the most plausible explanation for differences in ks between pasture areas was that changes in ρb and the resultant changes in total soil porosity under different long-term pasture management practices comprised the primary factors influencing soil ks. Total porosity (i.e., θv at saturation determined from SWRCs) and characteristics of pores in soils have been known to impact ks. In addition, changes in vegetation species could be a driving factor influencing hydraulic properties by altering total porosity, non-capillary porosity, and macro water-stable aggregates [62]. Different vegetation types have also been reported to affect ks through root distribution and morphological characteristics, such as root biomass and distribution (e.g., [62,63,64,65]).
As shown in Figure 3, ks in the upper 0–10 cm soil depth was not affected by pasture management in the east area (P > 0.05), while it was significant for the 10–20 cm depth in the east and both 0–10 and 10–20 cm depths in the west area (P < 0.05). In the east area, native pasture had higher ks than annual and alfalfa-TW in the 10–20 cm depth (P < 0.05). For the 0–10 cm depth in the west area, OWB-ungrazed had higher ks than teff, and teff had the lowest ks (P < 0.05). Native and OWB-grazed pastures had intermediate ks values between OWB-ungrazed and teff. In the west area, ks in the 10–20 cm was in the order of native > OWB-ungrazed > OWB-grazed > teff. Saturated hydraulic conductivity (ks) was associated with ρb (r = 0.61, P < 0.0001) and SOM (r = 0.69, P < 0.0001) (data not shown) as it was greater for perennial pastures with low ρb and high SOM than annual. Our result was similar to previous studies, in which lower ρb was aligned with higher ks (e.g., [62,66,67], and ks tended to decrease with an increase in ρb with soil depth [24,62]. The finding was also consistent with previous studies focusing on perennial vegetation, in which Rachman et al. (2005) [68] and Seobi et al. (2005) [69] reported that ks was greater under perennial vegetation than in managed annual cropland.
The van Genuchten model was fitted to the measured SWRCs for different soil depths down to 20 cm to provide an additional tool for reliable estimates of SWRC parameters (θs, θr, αv, and n) for all treatments (Figure 4). Generally, the overall fit resulted in close agreements between measured and estimated θv, as indicated by lower values of overall RMSE (root mean squared error) between 0.010 and 0.038 cm3 cm−3 and 0.013 and 0.025 cm3 cm−3 (data not shown) for the east and west pasture areas, respectively. The measured and fitted SWRCs for different pasture soils suggested that soils with greater SOM and ks retained more water at or near saturation (i.e., air-entry region) and released less water when the h increased (i.e., more negative h), except for native and OWB-ungrazed pastures in the west area. Nonetheless, the capillary region (i.e., after air began to enter) of the SWRC was steeper with an increase in h for soils with greater SOM (Figure 3 and Figure 4; Table 1).
Similar to measured SWRCs at different soil depths, the patterns predicted by the modeled van Genuchten SWRCs differed among pasture treatments within and between the east and west areas (Figure 4). Accordingly, the van Genuchten parameters, especially θs, αv, and n, showed differences as a result of pasture management practices, thereby resulting in variations in soil water thresholds (i.e., θv at saturation, FC, PWP, and PAW) in the wet and dry soil water ranges of SWRCs. Fitted van Genuchten parameter values within the 0–20 cm soil depth for all treatments in both pasture areas are listed in Table 2. The model fitting process yielded similar θr values among different treatments in both pasture areas. The residual water content (θr) represents θv at the lowest h, at which water is retained in soil micropores [42,43,70]. The θr is often related to the amount and state of water adsorption in the mineral fractions of soil [71], which might not be affected by different pasture management practices. On the contrary, parameter αv, which determines the air entry h required to initiate the release of water and air begins to enter the soil pores during drainage when h exceeds air entry h, and especially parameter n, which describes the rate of water desorption, varied among pasture treatments within the 0–20 cm soil depths (Table 2). The variations in αv and n were likely due to the effect of pasture management practices on soil micropores.
Soil water thresholds, determined using SWRCs data (i.e., different soil water states from saturation to PWP) at different soil depths for each treatment, are shown in Table 3. Broadly, soil water thresholds were not affected by treatment × soil depth, year × treatment, and soil depth × year interactions at α = 0.05. An important aspect to be noted in Table 3 is that the perennial pastures, such as OWB and native, had improved soil water retention characteristics compared to annual teff (P < 0.05), with greater FC (0.38 to 0.44 cm3 cm−3) and PAW (0.17 to 0.23 cm3 cm−3). Generally, the east area had more water holding capacity (and PAW) than the west, which could be explained by the higher clay contents and SOM of the east pasture soils (Table 1).
It is worth noting that the type of OWB species used in this experiment (i.e., WW-B. Dahl) has been promoted for its longer vegetative period than other OWB species, which favors greater production of above- and belowground biomass [55]. Although the relation between SWRC or ks and root characteristics (e.g., distribution and morphological characteristics) was not clarified in our study, root parameters might have had effects on SWRC or ks under different pasture systems [62,72]. In the east area, θv at saturation (i.e., total soil porosity) in the 0–5 cm depth was greater for OWB-legume than alfalfa-TW and annual (P < 0.02), suggesting that OWB-legume treatment provided the relatively good topsoil structure.
As shown in Figure 4, when compared with native, annual, and alfalfa-TW, OWB-legume pasture retained nearly 0.05 and 0.1 cm3 cm−3 more water content in the 0–5 cm between h = 0 cm (at saturation) and h = −100 cm. Alfalfa-TW had the lowest total porosity in the 5–10 cm, where there was a parity among OWB-legume, native, and annual treatments (P < 0.05) (Table 3). In general, OWB-legume treatment showed greater soil water retention up to h of −2000 cm, while all pasture treatments, except native, had similar soil water retention characteristics after h of −2000 cm. Alfalfa-TW showed poor soil water retention up to h of −2000 cm (Figure 4). Total porosity at soil depths of 10–15 and 15–20 cm was not different among pasture treatments in the east area.
In the west pasture area, teff provided lower θv at saturation than OWB and native perennial pastures (P < 0.05) in the upper 0–5 cm depth (Table 3; Figure 4). As shown in Figure 4, native and both grazed and ungrazed OWB tended to have greater soil water retention in the 0–5 cm at h less than −100 cm. At the 5–10 cm depth, soil water retention was in the order of native > OWB-ungrazed > OWB-grazed > teff up to h of −330 cm (i.e., FC), but after that, native and teff released more water at an increasing rate with increasing (i.e., more negative) h when compared with OWB pastures. OWB-grazed delayed release of water after h of −1000 cm. OWB-ungrazed retained water more tightly, close to the grazed one in the 10–15 cm under h of −2000 cm or lower. At the 15–20 cm depth, native and OWB-ungrazed had improved soil water retention characteristics at h less than −100 cm than teff and OWB-grazed. Nevertheless, native and OWB-ungrazed released water under increasing h, while the soil impacted by grazing (OWB-grazed) held more water under the increased (i.e., more negative) h (Figure 4). Grazing reduced total porosity (P < 0.05) in the 15–20 cm, which was suggested by higher ρb at this 15–20 cm soil depth.
Similar effects of pasture management to those discussed for θv at saturation were observed for FC soil water threshold (i.e., θv at field capacity) (Table 3). In the east pasture area, OWB-legume and native had greater FC than alfalfa-TW (P < 0.05) in the 0–5 cm. Annual pasture had an intermediate FC value between native and alfalfa-TW. Native in the 5–10 cm and OWB-legume in the 10–20 cm had greater FC than alfalfa-TW (P < 0.05). Both native and annual treatments provided mostly similar intermediate FC values between OWB-legume and alfalfa-TW. In the west area, the effects of pasture management on FC soil water thresholds were not significant for 0–5 and 5–10 cm depths (P > 0.05). However, the effects of pasture management on FC for 10–15 and 15–20 cm depths were significant (P < 0.05). OWB-grazed treatment provided lower FC than OWB-ungrazed and native at depths of 10–20 cm and 15–20 cm, respectively (P < 0.05). As mentioned earlier, although soils in the west area had higher sand contents, higher ρb under OWB-grazed likely diminished the volume of large pores, affecting soil water retention at field capacity in denser soils.
As compared to FC soil water thresholds, an opposite trend was observed for PWP soil water threshold values under different treatments (Table 3), where pasture systems did not affect PWP in the east area (P > 0.05). In the west area, OWB-grazed showed greater PWP than OWB-ungrazed and native in the upper 0–5 cm (P < 0.05). OWB-grazed showed higher PWP compared to native pasture (P < 0.05) in the 0–5 cm depth (P < 0.05). Notably, grazing in the west area did not affect θv at PWP at soil depths of 5–10 cm and 15–20 cm (P > 0.05).
Following the differences observed in FC and PWP soil water thresholds at different soil depths, PAW ranged from 0.112 to 0.233 cm3 cm−3 and 0.095 to 0.190 cm3 cm−3 for the east and west pasture areas, respectively, within the 0–20 cm depth (Table 3). The east area pasture systems on clayey soils, associated with greater SOM, showed more PAW than the west. This was in alignment with prior studies (e.g., [73,74]), in which the increases in FC and PWP, as well as the greater available water content, were found for soils with higher clay and silt contents. OWB-legume had the highest PAW in the east area in the upper 0–5 cm compared to native, annual, and alfalfa-TW (P < 0.05). However, for the 5–10 cm depth, native pasture showed greater PAW than OWB-legume (P < 0.05). Alfalfa-TW treatment had PAW (0.120 cm3 cm−3), almost half of that in the OWB-legume treatment (0.229 cm3 cm−3). In the west pasture area, native and OWB-ungrazed had greater PAW than OWB-grazed in all soil depths (P < 0.05).

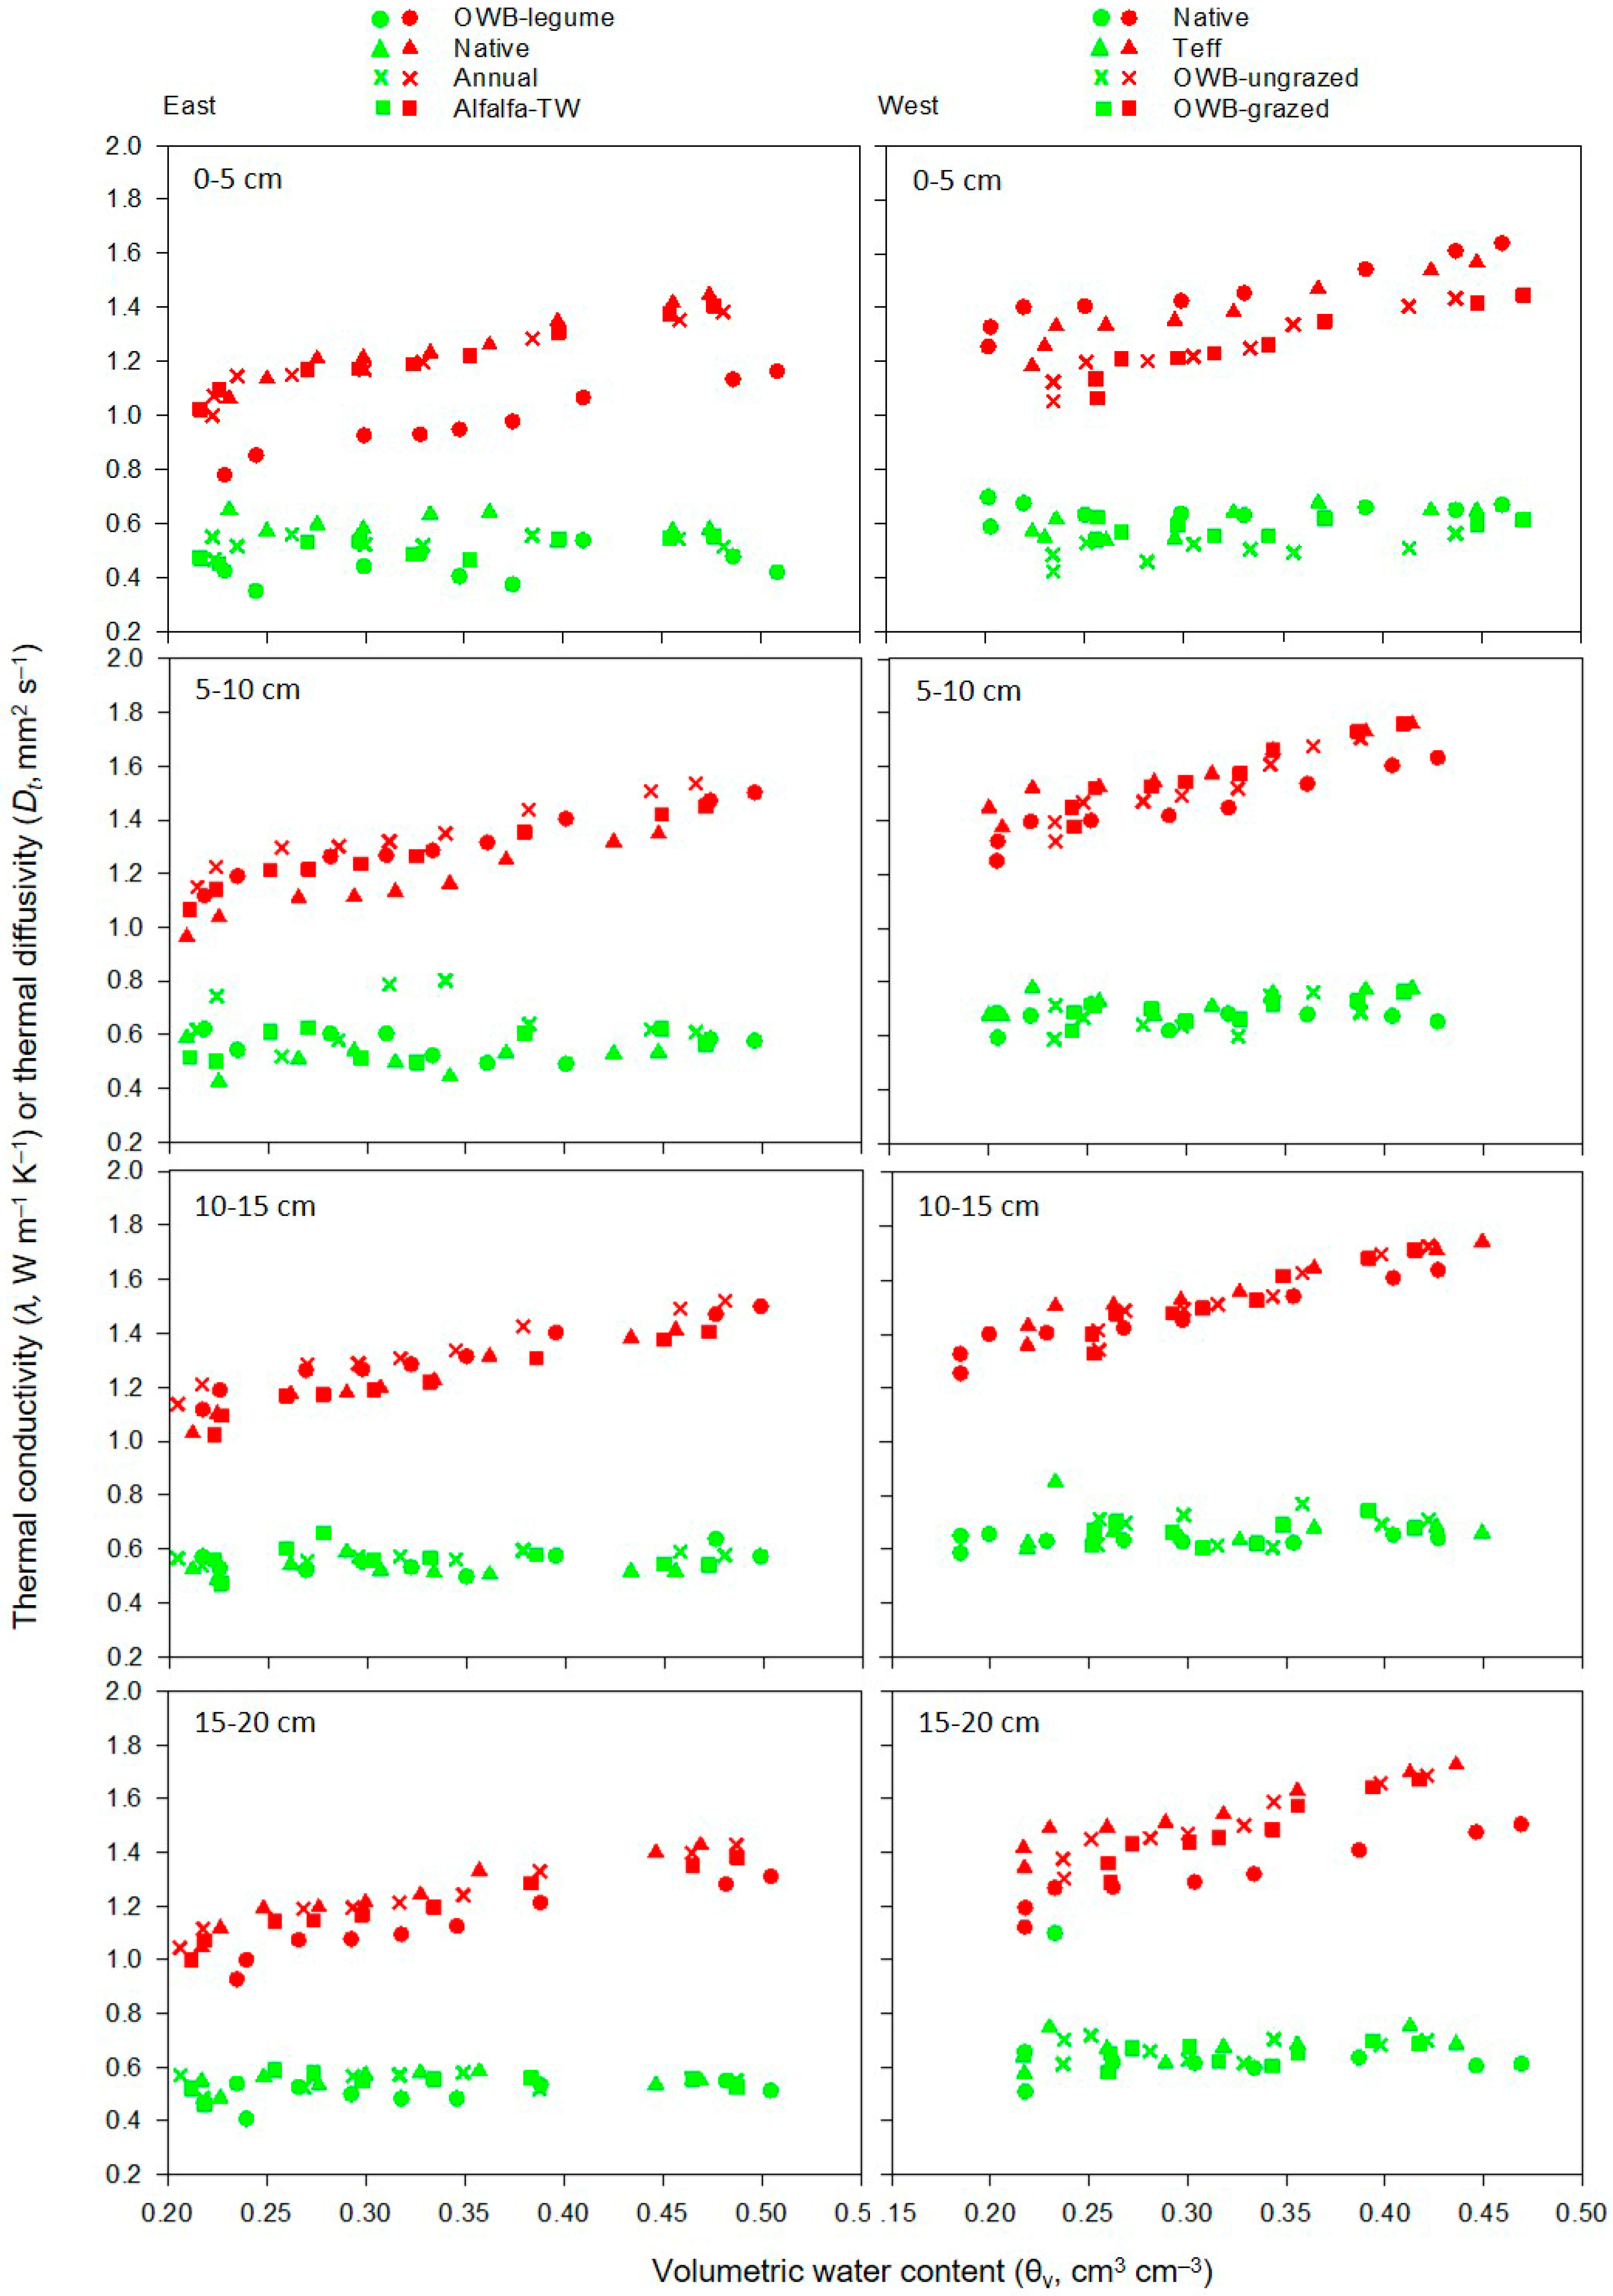
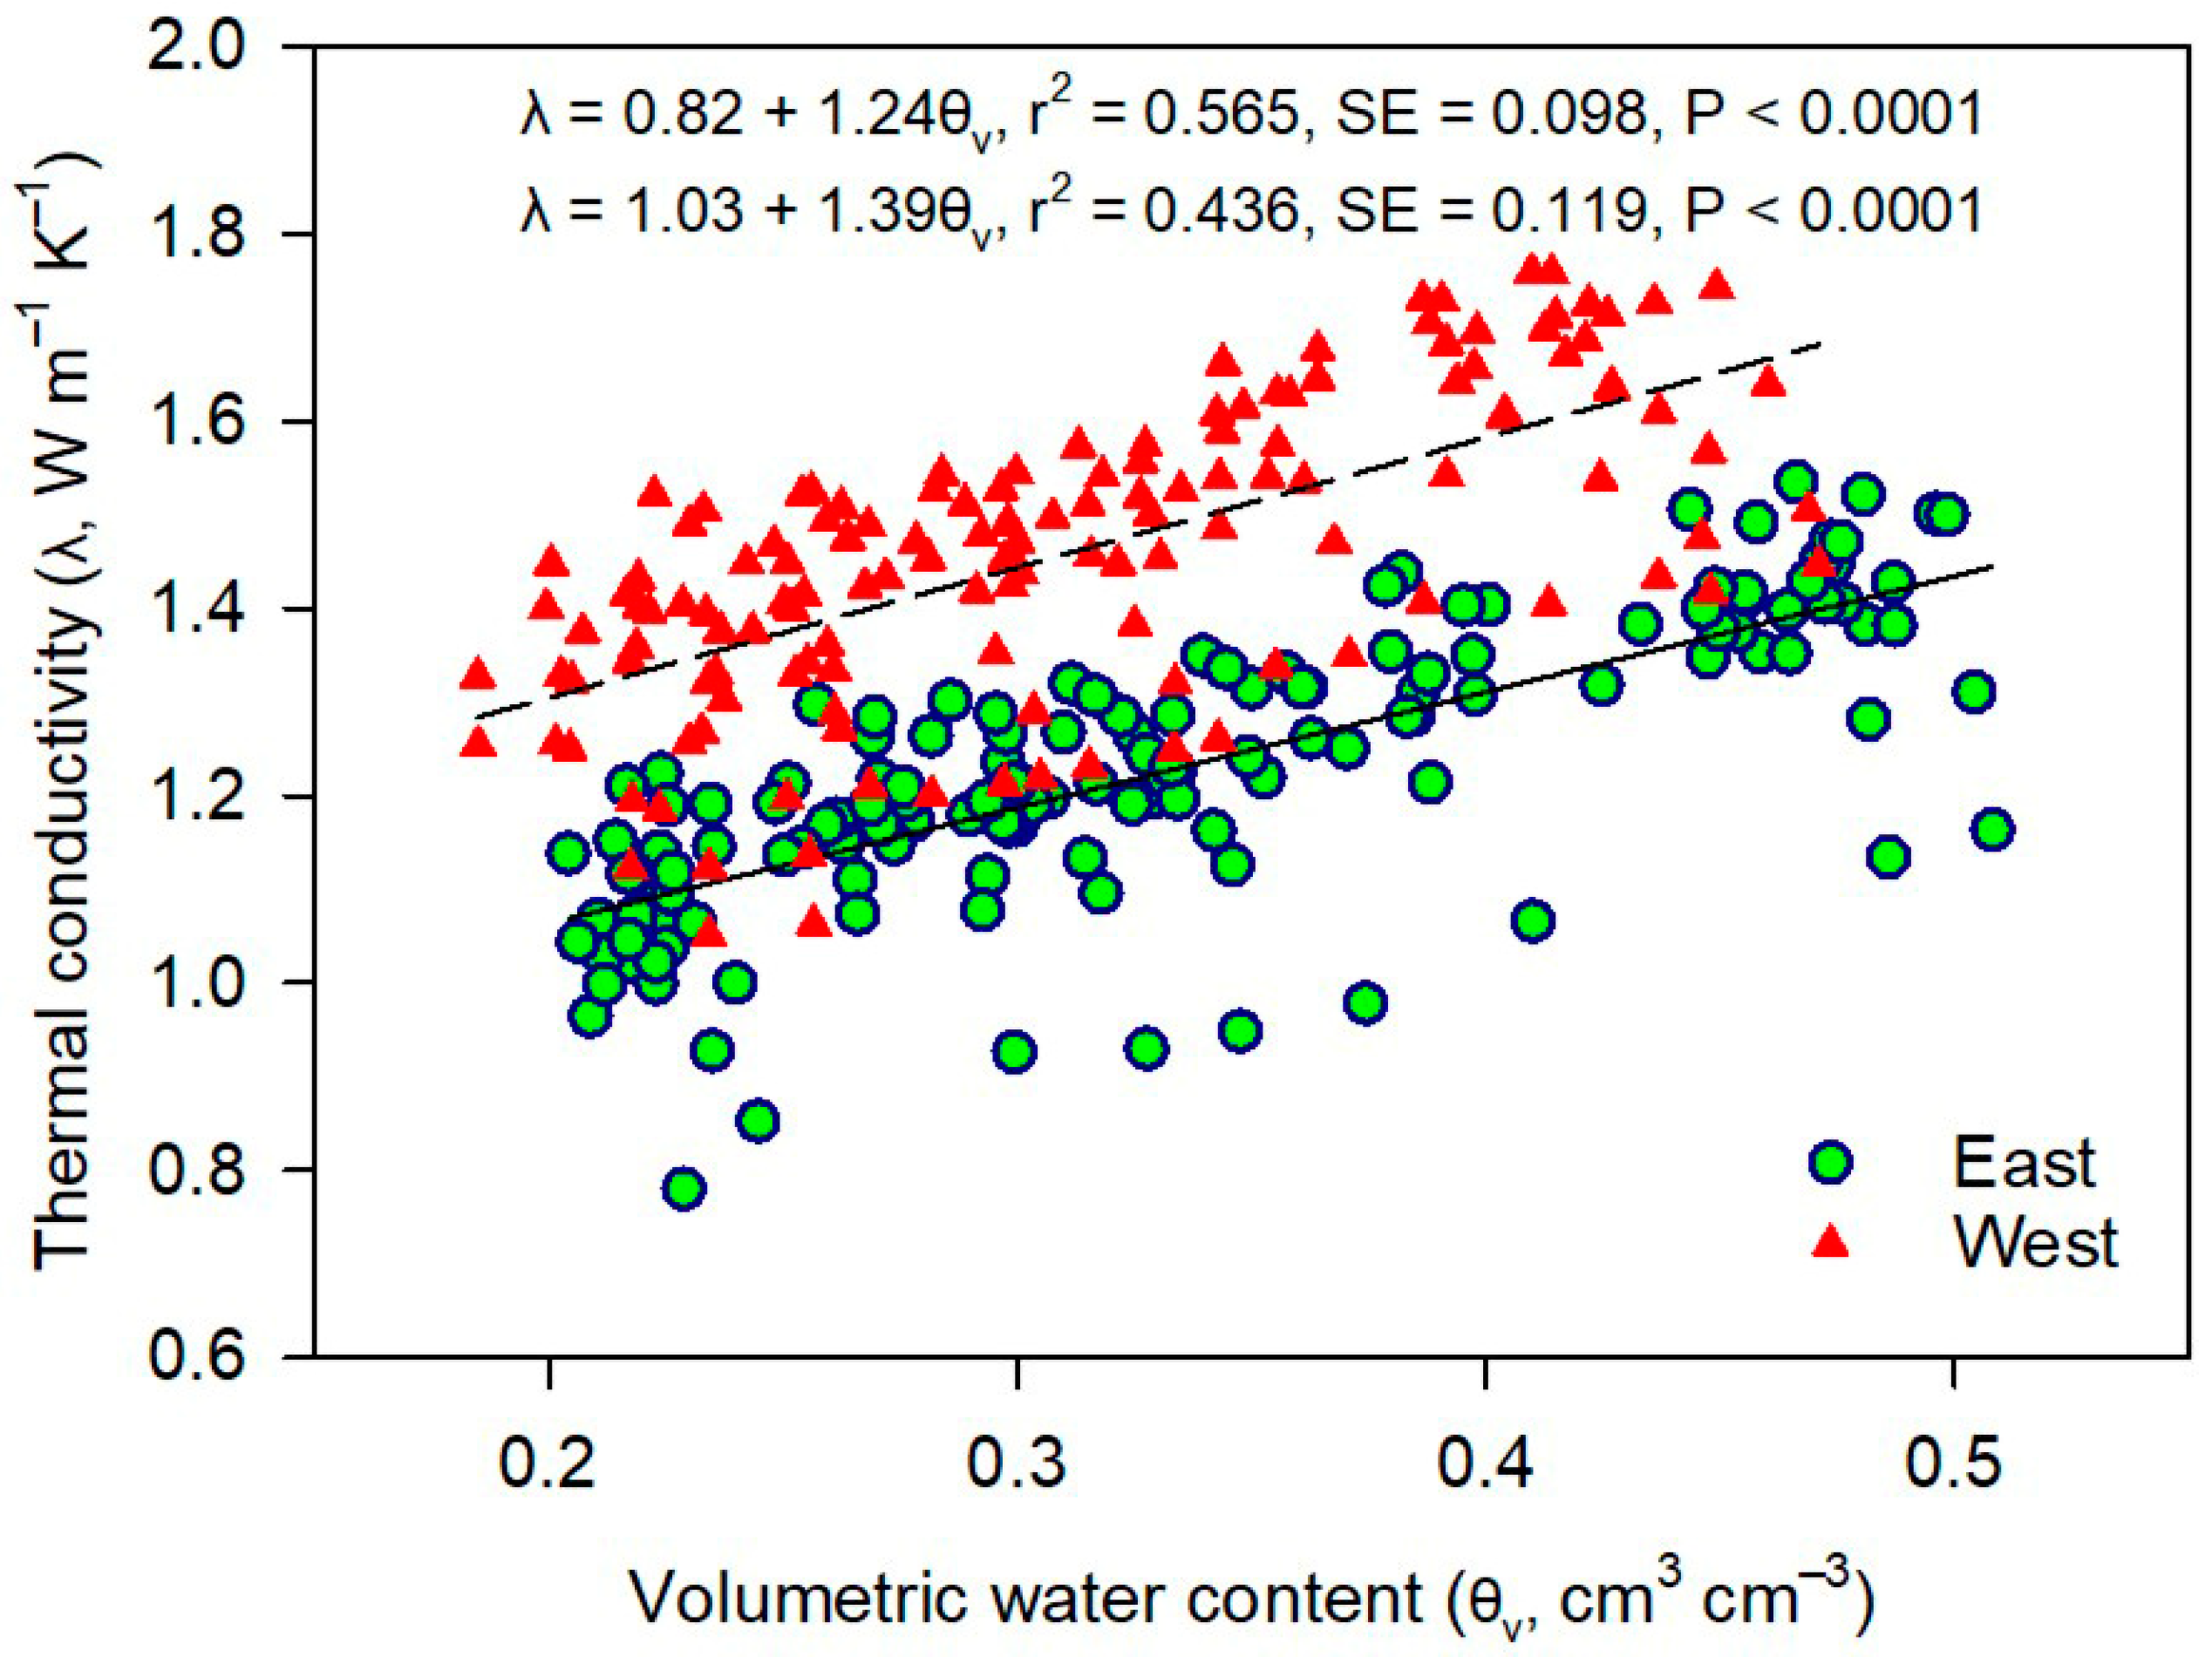
3.3. Soil Thermal Properties

Soil thermal conductivity (λ) and diffusivity (Dt) as a function of volumetric water contents (θv), which correspond to applied h of 0 (at saturation),−100, −330, −500, −2000, −3000, −5000, −10,000, and −15,000 cm, are shown in Figure 5 for all treatments at upper soil depths from 0 to 20 cm. Soil λ increased with increasing θv in both pasture areas. The increase in λ values with increasing θv agreed with previous studies (e.g., [75]). Soil λ was maximum at saturation and minimum at PWP. In dry soils at PWP (<0.05 cm3 cm−3; Figure 5), as the contact points between solid particles are very small compared to the contact points between air and solid particles, heat transfer is governed by conduction within the air and by heat transfer across the gas–solid interface. Hence, λ of dry soils is primarily controlled by the gaseous phase and is usually low owing to the lower thermal conductivity of air than that of the other soil components (i.e., λair < λwater < λmineral). As θv increases towards saturation, the replacement of air with water continues to enhance heat conduction through the mixture because more water gathers around the contact points and forms water bridges (i.e., thermal bridges) between solid particles [76,77]. Notably, although λ increased with increasing θv, there were no discernible changes in Dt with increasing θv for all treatments in both pasture areas. The reason could be explained by very little relative changes in the λ and Cv values of pasture soils observed in our study. The increase in λ with increasing θv was lower than the increase in Cv. On average, Cv increased by 13 and 7% when θv increased from PWP (2.33 and 2.35 MJ m−3 K−1) to saturation (2.63 and 2.51 MJ m−3 K−1) (data not shown) for the east and west pasture areas, respectively. This also suggested that while higher λ values ensured faster soil temperature recovery, higher Cv values of pasture soils likely provided larger heat storage in the upper 0–20 cm depth.
As shown in Figure 5, Dt values (as a function of θv) varied between 0.39 and 0.80 mm2 s−1 and between 0.48 and 0.76 mm2 s−1 within the 0–20 cm soil depth in the east and west pasture areas, respectively. Soil Dt data observed in our study were within the desirable ranges reported in previous studies [16,78,79], suggesting that both pasture soils would rapidly adjust to any temperature changes or would prevent the occurrence of temperature extremes when exposed to changes in the thermal environment. As reported by several studies (e.g., [20,80]), λ values in our study were also within and close to the desirable λ ranges that facilitated greater heat movement through the soil. For instance, Ghuman and Lal (1985) [20] found that λ ranged from 0.37 to 1.42 W m−1 K−1 at θv of 0.02 to 0.16 cm3 cm−3 for sandy loam, 0.35 to 3.34 W m−1 K−1 at θv of 0.02 to 0.46 cm3 cm−3 for sandy clay loam, and 0.39 to 1.15 W m−1 K−1 at θv of 0.10 to 0.52 cm3 cm−3 for clay soil, respectively.
The depthwise comparison of λ values for each pasture area showed a sudden increase in λ when θv increased from 0.20 to 0.25 cm3 cm−3, after which it increased slowly with further increases in θv up to saturation (Figure 5). The maximum λ of 2.03 W m−1 K−1 was observed at saturation in the 5–10 cm depth under the native pasture system. The regression between λ and θv (Figure 6) showed similar slopes of the linear function with a higher y-intercept for the west pasture soils than the east. In the east pasture area, native and alfalfa-TW had greater λ than OWB-legume at both saturation and PWP in the upper 0–5 cm depth (P < 0.05), while λ value of annual pasture soils was intermediate. Except for alfalfa-TW, the differences in Dt at saturation among native, alfalfa-TW, and OWB-legume followed a similar pattern of λ values for the same soil depth. For the 5–20 cm depth, Dt at saturation did not vary between treatments. At PWP, native had greater Dt than OWB-legume and alfalfa-TW in the 0–5 cm, whereas, in the 5–10 cm depth, OWB-legume and annual had greater Dt than alfalfa-TW (P < 0.05).
Despite having lower θv (a function of pressure heads) in the west pasture soils (Figure 4), the higher λ and Dt in the west compared to the east could be explained by various factors, such as soil texture or particle size distribution, SOM, and ρb [81], which were affected by pasture management practices. Soils with higher clay contents in the east pasture (i.e., clay loam soils) likely possessed a higher degree of aggregation than soils in the west pasture (i.e., sandy clay loam soils) with greater sand contents. This suggested that poorly aggregated soils in the west area had smaller pore spaces with better contact between soil solid particles than well-aggregated soils in the east. The results agreed with previous studies, in which lower λ values were observed for clayey soil compared to sandy soil (e.g., [75,82,83]). The relatively lower ρb in the east pasture area could contribute to greater pore space, resulting in a decrease in λ and Dt [20,83]. On the contrary, the contact between individual solid particles became more intimate for soils with the relatively higher ρb in the west pasture.
As discussed in Section 3.2, pasture soils with higher total porosity in the east area could decrease soil λ [16,84]. Organic matter, which has been reported to have greater Cv and lesser ρb than mineral soils with a greater pore space [85,86], does not transfer heat as readily as mineral soil. Hence, it was likely that pasture soils with greater SOM in the east area could decrease λ and Dt. Our result was in line with previous research (e.g., [20,75], [83]). For instance, Abu-Hamdeh and Reeder (2000) [75] reported a decrease in λ with increasing SOM, i.e., from λ of 0.33 W m−1 K−1 at 5% SOM to 0.17 W m−1 K−1 at 30% SOM. However, Usowicz and Lipiec (2020) [87] observed no clear trend in λ with an increasing application rate of exogenous SOM except for a few measurement dates. SOM content may indirectly affect thermal properties by altering soil aggregate structure [14], in which spherical soil aggregates tend to reduce λ and Dt by changing contact areas, and by altering water storage [30], in which soil water mainly increases λ [76].
Based on SWRCs data (Figure 4), the variations in λ and Dt values among different treatments were evaluated by three soil water thresholds, namely, very low θv (at PWP), intermediate θv (at FC), and high θv (at saturation). Soil λ and Dt at saturation and PWP in different soil depths are presented in Table 4 for the east and west area. Soil λ and Dt values in the upper 0–10 cm depth at saturation and PWP were affected by pasture treatments (P < 0.05), whereas λ and Dt in the 10–20 cm depth were not affected by treatments (P > 0.05). Soil λ and Dt at FC were not affected by pasture treatments (P > 0.05) (data not shown). Soil λ and Dt at FC were 1.03 and 1.24 W m−1 K−1 and 0.55 and 0.66 mm2 s−1 in the east and west areas, respectively, when averaged across years and soil depths. Soil λ and Dt values at FC were 1.31, 1.27, 1.37, and 1.31 W m−1 K−1 and 0.54, 0.53, 0.58, and 0.57 mm2 s−1 for native, OWB-legume, annual, and alfalfa-TW, respectively, in the east pasture area, while in the west area, λ and Dt at FC were 1.51, 1.54, 1.55, and 1.60 W m−1 K−1 and 0.65, 0.67, 0.68, and 0.70 mm2 s−1 for native, OWB-ungrazed, OWB-grazed, and teff, respectively. Neither treatment × depth nor year × treatment interaction was significant for both λ and Dt in both pasture areas (P > 0.05).
In the west pasture area, λ had no definitive trend at saturation. For example, native showed greater λ than OWB pastures in the 0–5 cm depth, whereas teff and OWB-grazed had greater λ at saturation than native in the 5–10 cm (P < 0.01) (Table 4). Soil λ under teff was higher at 0–5 and 5–10 cm depths. Pasture treatments did not affect λ at PWP for all soil depths (P > 0.05). Similarly, Dt did not differ among treatments at saturation for all depths (P > 0.05). At PWP, only the upper 0–5 cm depth showed differences in Dt, where native had greater Dt than OWB-ungrazed (P < 0.01). Teff and OWB-grazed had intermediate Dt values between native and OWB-ungrazed. For the 5–20 cm depth, Dt did not vary among treatments at PWP (P > 0.05). Overall, greater Dt within the upper 0–20 cm soil depths in the west pasture area compared to the east pasture area (Table 4) likely allowed the heat to penetrate deeper into its profile rapidly. Although heat captured at the soil surface needs to be retained to aid forage crop development, greater Dt is also desirable to prevent the occurrence of temperature extremes [88], especially in semiarid environments.

4. Conclusions

The perennial OWB-legume and native pasture systems that contributed to the build-up of SOM and reduced ρb in the upper 0–20 cm soil depth significantly increased ks compared to annual (i.e., teff and alfalfa-TW) pasture systems (P < 0.05). The perennial pasture systems also improved soil water thresholds (i.e., θv at saturation, FC, and PWP, as well as PAW) and thermal properties (λ and Dt) than annual pasture systems (P < 0.05), underscoring the benefits of permanent, perennial cover on soil water storage in semiarid environments. Native and OWB-legume pastures, especially in the clay loam east pasture, showed a similar increase in ks and soil water retention characteristics, owing to their greater SOM contents but lower ρb compared to annual teff and alfalfa-TW (P < 0.05). Soil λ increased with increasing θv (a function of pressure heads); however, there were no discernible changes in Dt with increasing θv since the increase in Cv resulted in very little relative changes in λ and Dt of pasture soils across the range of θv given by SWRCs. Differences in greater λ and Dt with differences in soil water thresholds between perennial and annual pastures, especially at saturation and PWP, may be attributed to differences in SOM and ρb, in addition to a priori differences in soil texture. Grazed pastures decreased ks and soil water retention compared to other treatments (P < 0.05), yet did not affect λ and Dt (P > 0.05), likely due to higher soil ρb and contact areas between particles. Significantly lower soil water retention, ks, λ, and Dt in annual and teff pastures compared to perennial systems (P < 0.05) were attributed to annual disturbance, including tillage practices. Overall, our results suggest that management practices involving continued soil disturbance, including annual forage crops and tillage-based row-crop agriculture, are less beneficial to water storage and heat movement in unsaturated soils than perennial pasture systems, especially in semiarid regions.

Supplementary Materials

The following supporting information can be downloaded at: https://www.mdpi.com/article/10.3390/plants12071491/s1: Table S1: Description of forage and pasture management practices under different treatments over the years in the east pasture area at New Deal, TX, USA. Pasture treatments include native, Old-World Bluestem (OWB) (OWB, Bothriochloa bladhii (Retz) T. Blake)-legume, annual, and alfalfa-tall wheatgrass (TW) (TW, Thinopyrum ponticum (Host) Beauv.). Area is for a single replicate. Table S2: Description of forage and pasture management practices under different treatments over the years in the west pasture area at New Deal, TX, USA. Pasture treatments include native, teff, Old World bluestem (OWB) (OWB, Bothriochloa bladhii (Retz) T. Blake)-ungrazed, and OWB-grazed. Area is for a single replicate.

Author Contributions

Conceptualization, G.K. and S.K.D.; methodology, M.D., G.K. and S.K.D.; software, M.D.; formal analysis, M.D.; investigation, G.K. and S.K.D.; resources, S.K.D. and C.P.W.; data curation, M.D.; writing—original draft preparation, G.K.; writing—review and editing, M.D., S.K.D., L.C.S., C.S. and C.P.W.; visualization, M.D.; supervision, S.K.D.; project administration, S.K.D.; funding acquisition, S.K.D. All authors have read and agreed to the published version of the manuscript.

Funding

This research was partially supported by the USDA Southern Sustainable Agriculture Research and Education (SARE) grant LS17-286.

Data Availability Statement

Not applicable.

Acknowledgments

The authors thank Eduardo Escamilla and Paul Green for their technical assistance in the field and laboratory.

Conflicts of Interest

The authors declare no conflict of interest.

References

  1. Bodner, G.; Nakhforoosh, A.; Kaul, H.-P. Management of crop water under drought: A review. Agron. Sustain. Dev. 2015, 35, 401–442. [Google Scholar] [CrossRef]
  2. Deb, S.K.; Shukla, M.K. Variability of hydraulic conductivity due to multiple factors. Am. J. Environ. Sci. 2012, 8, 489–502. [Google Scholar] [CrossRef] [Green Version]
  3. Jarvis, N.J.; Koestel, J.; Messing, I.; Moeys, J.; Lindahl, A. Influence of soil, land use and climatic factors on the hydraulic conductivity of soil. Hydrol. Earth Syst. Sci. 2013, 17, 5185–5195. [Google Scholar] [CrossRef] [Green Version]
  4. Çerçioğlu, M.; Anderson, S.H.; Udawatta, R.P.; Alagele, S. Effect of cover crop management on soil hydraulic properties. Geoderma 2019, 343, 247–253. [Google Scholar] [CrossRef]
  5. Schwartz, R.C.; Evett, S.R.; Unger, P.W. Soil hydraulic properties of cropland compared with reestablished and native grassland. Geoderma 2003, 116, 47–60. [Google Scholar] [CrossRef]
  6. Fashi, F.H.; Gorji, M.; Shorafa, M. Estimation of soil hydraulic parameters for different land-uses. Model. Earth Syst. Environ. 2016, 2, 1–7. [Google Scholar] [CrossRef] [Green Version]
  7. Meek, B.D.; Rechel, E.R.; Carter, L.M.; DeTar, W.R.; Urie, A.L. Infiltration Rate of a Sandy Loam Soil: Effects of Traffic, Tillage, and Plant Roots. Soil Sci. Soc. Am. J. 1992, 56, 908–913. [Google Scholar] [CrossRef]
  8. Fischer, C.; Roscher, C.; Jensen, B.; Eisenhauer, N.; Baade, J.; Attinger, S.; Scheu, S.; Weisser, W.W.; Schumacher, J.; Hildebrandt, A. How do earthworms, soil texture and plant composition affect infiltration along an experimental plant diversity gradient in grassland? PLoS ONE 2014, 9, e98987. [Google Scholar] [CrossRef]
  9. Widomski, M.K.; Stepniewski, W.; Horn, R.; Bieganowski, A.; Gazda, L.; Franus, M.; Pawlowska, M. Shrink-swell potential, hydraulic conductivity and geotechnical properties of clay materials for landfill liner construction. Int. Agrophysics 2015, 29, 365–375. [Google Scholar] [CrossRef]
  10. Sterpi, D. Effect of freeze–thaw cycles on the hydraulic conductivity of a compacted clayey silt and influence of the compaction energy. Soils Found. 2015, 55, 1326–1332. [Google Scholar] [CrossRef] [Green Version]
  11. Hirose, G.; Ito, Y. Experimental estimation of permeability of freeze-thawed soils in artificial ground freezing. Procedia Eng. 2017, 189, 332–337. [Google Scholar] [CrossRef]
  12. Ahuja, L.R.; Fiedler, F.; Dunn, G.H.; Benjamin, J.G.; Garrison, A. Changes in soil water retention curves due to tillage and natural reconsolidation. Soil Sci. Soc. Am. J. 1998, 62, 1228–1233. [Google Scholar] [CrossRef]
  13. Alaoui, A.; Diserens, E. Changes in soil structure following passage of a tracked heavy machine. Geoderma 2011, 163, 283–290. [Google Scholar] [CrossRef]
  14. Krümmelbein, J.; Peth, S.; Zhao, Y.; Horn, R. Grazing-induced alterations of soil hydraulic properties and functions in Inner Mongolia, PR China. J. Plant Nutr. Soil Sci. 2009, 172, 769–776. [Google Scholar] [CrossRef]
  15. Philip, J.R.; De Vries, D.A. Moisture movement in porous materials under temperature gradients. Eos. Trans. Am. Geophys. Union 1957, 38, 222–232. [Google Scholar] [CrossRef]
  16. Ochsner, T.E.; Horton, R.; Ren, T. A New Perspective on Soil Thermal Properties. Soil Sci. Soc. Am. J. 2001, 65, 1641–1647. [Google Scholar] [CrossRef]
  17. Deb, S.K.; Shukla, M.K.; Sharma, P.; Mexal, J.G. Coupled liquid water, water vapor, and heat transport simulations in an unsaturated zone of a sandy loam field. Soil Sci. 2011, 176, 387–398. [Google Scholar] [CrossRef]
  18. Wierenga, P.J.; Nielsen, D.R.; Hagan, R.M. Thermal properties of a soil based upon field and laboratory measurements. Soil Sci. Soc. Am. J. 1969, 33, 354–360. [Google Scholar] [CrossRef]
  19. Farouki, O.T. Thermal Properties of Soils, CRREL Monograph 81-1; U.S. Army Cold Regions Research and Engineering Laboratory: Hanover, NH, USA, 1981; pp. 1–137. [Google Scholar]
  20. Ghuman, B.S.; Lal, R. Thermal conductivity, thermal diffusivity, and thermal capacity of some Nigerian soils. Soil Sci. 1985, 139, 74–80. [Google Scholar] [CrossRef]
  21. Hopmans, J.W.; Dane, J.H. Temperature dependence of soil hydraulic properties. Soil Sci. Soc. Am. J. 1986, 50, 4–9. [Google Scholar] [CrossRef]
  22. Allen, V.G.; Brown, C.P.; Kellison, R.; Green, P.; Zilverberg, C.J.; Johnson, P.; Weinheimer, J.; Wheeler, T.; Segarra, E.; Acosta-Martinez, V.; et al. Integrating cotton and beef production in the Texas Southern High Plains: I. Water use and measures of productivity. Agron. J. 2012, 104, 1625–1642. [Google Scholar] [CrossRef]
  23. Udawatta, R.P.; Anderson, S.H.; Gantzer, C.J.; Garrett, H.E. Influence of prairie restoration on CT-measured soil pore characteristics. J. Environ. Qual. 2008, 37, 219–228. [Google Scholar] [CrossRef] [PubMed] [Green Version]
  24. Fuentes, J.P.; Flury, M.; Bezdicek, D.F. Hydraulic properties in a silt loam soil under natural prairie, conventional till, and no-till. Soil Sci. Soc. Am. J. 2004, 68, 1679–1688. [Google Scholar] [CrossRef] [Green Version]
  25. Dhakal, D.; Islam, M.A. Grass-legume mixtures for improved soil health in cultivated agroecosystem. Sustainability 2018, 10, 2718. [Google Scholar] [CrossRef] [Green Version]
  26. Gao, D.; Wang, X.; Fu, S.; Zhao, J.; Coleman, D. Legume Plants Enhance the Resistance of Soil to Ecosystem Disturbance Site Description and Experimental. Front. Plant Sci. 2017, 8, 1295. [Google Scholar] [CrossRef] [Green Version]
  27. Dhakal, M.; West, C.P.; Villalobos, C.; Brown, P.; Green, P.E. Interseeding alfalfa into native grassland for enhanced yield and water use efficiency. Agron. J. 2020, 112, 1931–1942. [Google Scholar] [CrossRef]
  28. Porazinska, D.L.; Bardgett, R.D.; Blaauw, M.B.; Hunt, H.W.; Parsons, A.N.; Seastedt, T.R.; Wall, D.H. Relationships at the aboveground–belowground interface: Plants, soil biota, and soil processes. Ecol. Monogr. 2003, 73, 377–395. [Google Scholar] [CrossRef]
  29. Wardle, D.A.; Yeates, G.W.; Williamson, W.M.; Bonner, K.I.; Barker, G.M. Linking aboveground and belowground communities: The indirect influence of aphid species identity and diversity on a three trophic level soil food web. Oikos 2004, 107, 283–294. [Google Scholar] [CrossRef]
  30. Ankenbauer, K.J.; Loheide, S.P. The effects of soil organic matter on soil water retention and plant water use in a meadow of the Sierra Nevada, CA. Hydrol. Process. 2017, 31, 891–901. [Google Scholar] [CrossRef]
  31. Pirastru, M.; Castellini, M.; Giadrossich, F.; Niedda, M. Comparing the hydraulic properties of forested and grassed soils on an experimental hillslope in a Mediterranean environment. Procedia Environ. Sci. 2014, 19, 341–350. [Google Scholar] [CrossRef] [Green Version]
  32. Staff, S.S. Keys to Soil Taxanomy, 12th ed.; USDA-Natural Resources Conservation Service: Washington, DC, USA, 2014; pp. 1–372.
  33. Texas A&M AgriLife Extension: Texas ET Network. Available online: http://texaset.tamu.edu/ (accessed on 30 August 2020).
  34. Baxter, L.L.; West, C.P.; Brown, C.P.; Green, P.E. Stocker beef production on low-water-input systems in response to legume inclusion: I. Forage and animal responses. Crop Sci. 2017, 57, 2294–2302. [Google Scholar] [CrossRef]
  35. Bhandari, K.B.; West, C.P.; Acosta-Martinez, V.; Cotton, J.; Cano, A. Soil health indicators as affected by diverse forage species and mixtures in semi-arid pastures. Appl. Soil Ecol. 2018, 132, 179–186. [Google Scholar] [CrossRef]
  36. Dhakal, M.; West, C.P.; Deb, S.K.; Kharel, G.; Ritchie, G.L. Field calibration of PR2 capacitance probe in Pullman clay-loam soil of Southern High Plains. Agrosystems Geosci. Environ. 2019, 2, 1–7. [Google Scholar] [CrossRef] [Green Version]
  37. Gee, G.W.; Bauder, J.W. Particle-size analysis. In Methods of Soil Analysis: Part 1 Physical and Mineralogical Method, 2nd ed.; Klute, A., Ed.; ASA. Inc., and SSSA, Inc.: Madison, WI, USA, 1986; Agronomy Series 9; pp. 383–411. [Google Scholar]
  38. Blake, G.R.; Hartge, K.H. Bulk Density. In Methods of Soil Analysis: Part 1 Physical and Mineralogical Method, 2nd ed.; Klute, A., Ed.; ASA. Inc., and SSSA, Inc.: Madison, WI, USA, 1986; pp. 336–375. [Google Scholar]
  39. Nelson, D.W.; Sommers, L.E. Total carbon, organic carbon, and organic matter. In Methods of Soil Analysis: Part 3 Chemical Methods; Sparks, D.L., Page, A.L., Helmke, P.A., Loeppert, R.H., Soltanpour, P.N., Tabatabai, M.A., Johnson, C.T., Summer, M.E., Eds.; ASA. Inc., and SSSA, Inc.: Madison, WI, USA, 1996; pp. 961–1010. [Google Scholar]
  40. Klute, A.; Dirksen, C. Hydraulic conductivity and diffusivity. Laboratory methods. In Methods of Soil Analysis: Part 1 Physical and Mineralogical Method, 2nd ed.; Klute, A., Ed.; ASA. Inc., and SSSA, Inc.: Madison, WI, USA, 1986; pp. 687–734. [Google Scholar]
  41. Klute, A. Water Retention: Laboratory Methods. In Methods of Soil Analysis: Part 1 Physical and Mineralogical Method, 2nd ed.; Klute, A., Ed.; ASA. Inc., and SSSA, Inc.: Madison, WI, USA, 1986; pp. 635–660. [Google Scholar]
  42. van Genuchten, M.T. A Closed-form Equation for the Hydraulic conductivity of Unsaturated Soils. Soil Sci. Soc. Am. J. 1980, 44, 892–898. [Google Scholar] [CrossRef] [Green Version]
  43. van Genuchten, M.T.; Leij, F.J.; Yates, S.R. The RETC Code for Quantifying the Hydraulic Functions of Unsaturated Soils, EPA/600/2-91/065 (NTIS 92-119668); U.S. Environmental Protection Agency: Washington, DC, USA, 1991; pp. 1–93.
  44. Pan, T.; Hou, S.; Liu, Y.; Tan, Q. Comparison of three models fitting the soil water retention curves in a degraded alpine meadow region. Sci. Rep. 2019, 9, 18407. [Google Scholar] [CrossRef] [PubMed] [Green Version]
  45. Kluitenberg, G.J.; Ham, J.M.; Bristow, K.L. Error analysis of heat pulse method for measuring soil volumetric heat capacity. Soil Sci. Soc. Am. 1993, 57, 444–1451. [Google Scholar] [CrossRef]
  46. Bristow, K.L.; Kluitenberg, G.J.; Horton, R. Measurement of Soil Thermal Properties with a Dual-Probe Heat-Pulse Technique. Soil Sci. Soc. Am. J. 1994, 58, 1288–1294. [Google Scholar] [CrossRef]
  47. Marquardt, D.W. An algorithm for least-squares estimation of nonlinear parameters. J. Soc. Indust. Appl. Math. 1963, 11, 431–441. [Google Scholar] [CrossRef]
  48. Abramowitz, M.; Stegun, I.A. Handbook of Mathematical Functions: With Formulas, Graphs, and Mathematical Tables; Dover Publications, Inc.: New York, NY, USA, 1972; pp. 1–1046. [Google Scholar]
  49. O’Rourke, N.; Psych, R.; Hatcher, L. SAS® for Factor Analysis and Structural Equation Modeling; SAS Institute Inc.: Cary, NC, USA, 2013. [Google Scholar]
  50. Stroup, W.W. Rethinking the analysis of non-normal data in plant and soil science. Agron. J. 2015, 107, 811–827. [Google Scholar] [CrossRef]
  51. Littell, R.C.; Milliken, G.A.; Stroup, W.W.; Wolfinger, R.D.; Oliver, S. SAS for Mixed Models; SAS Publishing: Cary, NC, USA, 2006. [Google Scholar]
  52. Kenward, M.G.; Roger, J.H. An improved approximation to the precision of fixed effects from restricted maximum likelihood. Comput. Stat. Data Anal. 2009, 53, 2583–2595. [Google Scholar] [CrossRef]
  53. Systat Software. SigmaPlot 10.1 User’s Manual; Systat Software: Point Richmond, CA, USA, 2006. [Google Scholar]
  54. Zobeck, T.M.; Allen, V.G.; Cox, J.J.; Philipp, D. Variation of soil and plant characteristics among old world bluestem species. Agric. Sci. 2011, 2, 347–356. [Google Scholar] [CrossRef] [Green Version]
  55. Philipp, D.; Allen, V.G.; Mitchell, R.B.; Brown, C.P.; Wester, D.B. Forage nutritive value and morphology of three old world bluestems under a range of irrigation levels. Crop Sci. 2005, 45, 2258–2268. [Google Scholar] [CrossRef] [Green Version]
  56. Zobeck, T.M.; Crownover, J.; Dollar, M.; Van Pelt, R.S.; Acosta-Martinez, V.; Bronson, K.F.; Upchurch, D.R. Investigation of soil conditioning index values for southern high plains agroecosystems. J. Soil Water Conserv. 2007, 62, 433–442. [Google Scholar]
  57. Acosta-Martínez, V.; Bell, C.W.; Morris, B.E.L.; Zak, J.; Allen, V.G. Long-term soil microbial community and enzyme activity responses to an integrated cropping-livestock system in a semi-arid region. Agric. Ecosyst. Environ. 2010, 137, 231–240. [Google Scholar] [CrossRef]
  58. Fultz, L.M.; Moore-Kucera, J.; Zobeck, T.M.; Acosta-Martínez, V.; Allen, V.G. Aggregate carbon pools after 13 years of integrated crop-livestock management in semiarid soils. Soil Sci. Soc. Am. J. 2013, 77, 1659–1666. [Google Scholar] [CrossRef]
  59. Tracy, B.F.; Frank, D.A. Herbivore influence on soil microbial biomass and nitrogen mineralization in a northern grassland ecosystem: Yellowstone National Park. Oecologia 1998, 114, 556–562. [Google Scholar] [CrossRef]
  60. Ingram, L.J.; Stahl, P.D.; Schuman, G.E.; Buyer, J.S.; Vance, G.F.; Ganjegunte, G.K.; Welker, J.M.; Derner, J.D. Grazing impacts on soil carbon and microbial communities in a mixed-grass ecosystem. Soil Sci. Soc. Am. J. 2008, 72, 939–948. [Google Scholar] [CrossRef]
  61. Wang, K.-H.; Mcsorley, R.; Bohlen, P.; Gathumbi, S.M. Cattle grazing increases microbial biomass and alters soil nematode communities in subtropical pastures. Soil Biol. Biochem. 2009, 38, 1956–1965. [Google Scholar] [CrossRef]
  62. Hao, M.; Zhang, J.; Meng, M.; Chen, H.Y.H.; Guo, X.; Liu, S.; Ye, L. Impacts of changes in vegetation on saturated hydraulic conductivity of soil in subtropical forests. Sci. Rep. 2019, 9, 8372. [Google Scholar] [CrossRef] [Green Version]
  63. Rasse, D.P.; Smucker, A.J.M.; Santos, D. Alfalfa root and shoot mulching effects on soil hydraulic properties and aggregation. Soil Sci. Soc. Am. J. 2000, 64, 725–731. [Google Scholar] [CrossRef]
  64. Lado, M.; Paz, A.; Ben-Hur, M. Organic matter and aggregate size interactions in infiltration, seal formation, and soil loss. Soil Sci. Soc. Am. J. 2004, 68, 935–942. [Google Scholar] [CrossRef]
  65. Bodner, G.; Loiskandl, W.; Buchan, G.; Kaul, H.P. Natural and management-induced dynamics of hydraulic conductivity along a cover-cropped field slope. Geoderma 2008, 146, 317–325. [Google Scholar] [CrossRef]
  66. Nsabimana, D.; Haynes, R.J.; Wallis, F.M. Size, activity and catabolic diversity of the soil microbial biomass as affected by land use. Appl. Soil Ecol. 2004, 26, 81–92. [Google Scholar] [CrossRef]
  67. Branham, J.E.; Strack, M. Saturated hydraulic conductivity in Sphagnum-dominated peatlands: Do microforms matter? Hydrol. Process. 2014, 28, 4352–4362. [Google Scholar] [CrossRef]
  68. Rachman, A.; Anderson, S.H.; Gantzer, C.J. Computed-tomographic measurement of soil macroporosity parameters as affected by stiff-stemmed grass hedges. Soil Sci. Soc. Am. J. 2005, 69, 1609–1616. [Google Scholar] [CrossRef]
  69. Seobi, T.; Anderson, S.H.; Udawatta, R.P.; Gantzer, C.J. Influence of grass and agroforestry buffer strips on soil hydraulic properties for an Albaqualf. Soil Sci. Soc. Am. J. 2005, 69, 893–901. [Google Scholar] [CrossRef] [Green Version]
  70. Ndiaye, B.; Molénat, J.; Hallaire, V.; Gascuel, C.; Hamon, Y. Effects of agricultural practices on hydraulic properties and water movement in soils in Brittany (France). Soil Till. Res. 2007, 93, 251–263. [Google Scholar] [CrossRef]
  71. Heister, K. How accessible is the specific surface area of minerals? A comparative study with Al-containing minerals as model substances. Geoderma 2016, 263, 8–15. [Google Scholar] [CrossRef]
  72. Leung, A.K.; Garg, A.; Ng, C.W.W. Effects of plant roots on soil-water retention and induced suction in vegetated soil. Eng. Geol. 2015, 193, 183–197. [Google Scholar] [CrossRef] [Green Version]
  73. Gaiser, T.; Graef, F.; Cordeiro, J.C. Water retention characteristics of soils with contrasting clay mineral composition in semi-arid tropical regions. Soil Res. 2000, 38, 523–536. [Google Scholar] [CrossRef]
  74. Al Majou, H.; Bruand, A.; Duval, O.; Le Bas, C.; Vautier, A. Prediction of soil water retention properties after stratification by combining texture, bulk density and the type of horizon. Soil Use Manag. 2008, 24, 383–391. [Google Scholar] [CrossRef] [Green Version]
  75. Abu-Hamdeh, N.H.; Reeder, R.C. Soil thermal conductivity: Effects of density, moisture, salt concentration, and organic matter. Soil Sci. Soc. Am. J. 2000, 64, 1285–1290. [Google Scholar] [CrossRef]
  76. Kaune, A.; Turk, T.; Horn, R. Alteration of soil thermal properties by structure formation. J. Soil Sci. 1993, 44, 231–248. [Google Scholar] [CrossRef]
  77. Alrtimi, A.; Rouainia, M.; Haigh, S. Thermal conductivity of a sandy soil. Appl. Therm. Eng. 2016, 106, 551–560. [Google Scholar] [CrossRef] [Green Version]
  78. Adhikari, A.; Udawatta, R.P.; Anderson, S.H. Soil thermal properties under prairies, conservation buffers, and corn–soybean land use systems. Soil Sci. Soc. Am. J. 2014, 78, 1977–1986. [Google Scholar] [CrossRef]
  79. Usowicz, B.; Lipiec, L.; Łukowski, M.; Marczewski, W.; Usowicz, J. The effect of biochar application on thermal properties and albedo of loess soil under grassland and fallow. Soil Tillage Res. 2016, 164, 45–51. [Google Scholar] [CrossRef]
  80. Nkongolo, N.V.; Johnson, S.; Schmidt, K.; Eivazi, F. Greenhouse gases fluxes and soil thermal properties in a pasture in central Missouri. J. Environ. Sci. 2010, 22, 1029–1039. [Google Scholar] [CrossRef]
  81. Horton, R.; Ochsner, T.E. Soil thermal regime. In Handbook of Soil Sciences, 2nd ed.; Huang, P.M., Li, Y., Summer, M.E., Eds.; CRC Press: Boca Raton, FL, USA, 2011; pp. 9–23. [Google Scholar]
  82. De Vries, D.A. Thermal properties of soils. In Physics of Plant Environment; Van Wijk, W.R., Ed.; North Holland Publishing Company: Amsterdam, The Netherlands, 1963; pp. 210–235. [Google Scholar]
  83. Al Nakshabandi, G.; Kohnke, H. Thermal conductivity and diffusivity of soils as related to moisture tension and other physical properties. Agric. Meteorol. 1965, 2, 271–279. [Google Scholar] [CrossRef]
  84. Lu, Y.; Lu, S.; Horton, R.; Ren, T. An Empirical Model for Estimating Soil Thermal Conductivity from Texture, Water Content, and Bulk Density. Soil Sci. Soc. Am. J. 2014, 78, 1859–1868. [Google Scholar] [CrossRef]
  85. Campbell, G.S.; Norman, J.M. Radiation basics. In An Introduction to Environmental Biophysics, 2nd ed.; Campbell, G.S., Norman, J.M., Eds.; Springer: New York, NY, USA, 1998; pp. 147–165. [Google Scholar]
  86. Kimpe, D.; Bernier-Cardou, M.; Jolicoeur, P. Compaction and setting of Quebec soils in relation to their soil-water properties. Can. J. Soil Sci. 1982, 62, 165–175. [Google Scholar] [CrossRef]
  87. Usowicz, B.; Lipiec, J. The effect of exogenous organic matter on the thermal properties of tilled soils in Poland and the Czech Republic. J. Soils Sediments 2020, 20, 365–379. [Google Scholar] [CrossRef] [Green Version]
  88. Ekwue, E.I.; Stone, R.J.; Maharaj, V.V.; Bhagwat, D. Thermal conductivity and diffusivity of four Trinidadian soils as affected by peat content. Trans. ASAE 2005, 48, 1803–1815. [Google Scholar] [CrossRef]
Figure 1. Monthly precipitation and maximum and minimum air temperatures from January 2016 to December 2017 at the study site, New Deal, TX, USA. The red color line represents long-term (1911–2008) monthly average precipitation for the study area.
Plants 12 01491 g001
Figure 2. Forage crops grown in the experimental treatment plots during the 2016–2017 growing season at New Deal, TX, USA (not drawn to scale). The cultivar of Old-World bluestem (OWB) was WW-B. Dahl. Triangles in the west native grass-mix pasture represent soil sampling locations as an example for all other pastures.
Plants 12 01491 g002
Figure 3. Saturated hydraulic conductivity (ks) at soil depths (D) of 0–10 and 10–20 cm for Old-World bluestem (OWB)-legume, alfalfa-tall wheatgrass (TW), native, and annual treatments (Trt.) in the east pasture area; and native, OWB-grazed, OWB-ungrazed, and teff in the west pasture area. Data were averaged across years (Yr 2016 and 2017), sampling locations, and replicates. LSD (least significant difference), represented by vertical line with the asterisk (*), is considered significant at α = 0.05; ns, LSD (vertical line without the asterisk) is nonsignificant at α = 0.05; §, P value of the interaction.
Plants 12 01491 g003
Figure 4. Measured (symbols) and fitted (lines) van Genuchten soil water retention curves (SWRCs) at 0–5, 5–10, 10–15, and 15–20 cm soil depths for all treatments in the east and west pasture area during a 2-year study period (2016–2017). Measured data represent average value across sampling points, replicates, and years, whereas fitted line was obtained using all sample replicates. OWB, Old-World bluestem; TW, tall wheatgrass.
Plants 12 01491 g004
Figure 5. Measured soil thermal conductivity λ (red symbols) and thermal diffusivity Dt (green symbols) as a function of volumetric water contents (θv) corresponding to different applied pressure heads (i.e., 0, −100, −330, −500, −2000, −3000, −5000, −10,000, and −15,000 cm, as shown in Figure 4) at soil depths of 0–5, 5–10, 10–15, and 15–20 cm for all treatments in the east and west pasture area during a 2-year study period (2016–2017). Data were averaged across sampling points, replicates, and years. OWB, Old-World bluestem; TW, tall wheatgrass.
Plants 12 01491 g005
Figure 6. Relationship between soil thermal conductivity (λ) and volumetric water content (θv) within the 0–20 cm soil depth for all pasture treatments in the east (solid line) and west (dashed line) area during a 2-year study period (2016–2017). The θv is a function of applied pressure heads given by measured soil water retention curves (SWRCs) (Figure 4). Data pooled from years, depths, and pressure heads applied for determining SWRCs.
Plants 12 01491 g006
Table 1. Basic soil properties in the east and west pasture area of the experimental site. Bulk density (ρb) and particle size distribution (soil texture) data were averaged across years. Soil texture, soil organic matter (SOM), and gravimetric water content (θg) were determined in the 0–20 cm soil depth.
EastWest
OWB-LegumeAlfalfa-TWNativeAnnualNativeOWB-GrazedOWB-UngrazedTeff
ParticleParticle size distribution (%)
Sand40 (2.1) †37 (3.0)39 (4.2)39 (3.7)52 (9.2)46 (7.6)48 (4.1)51 (6.0)
Silt25 (5.5)28 (6.9)25 (5.1)27 (6.4)20 (5.4)23 (6.3)23 (5.1)22 (3.5)
Clay35 (3.8)35 (5.3)36 (3.8)34 (4.4)28 (4.2)30 (2.8)29 (1.0)27 (2.5)
YearSOM (g kg−1)
201631 a§19 b27 ab13 c15 ab18 a18 a12 b
201731 a20 b30 a15 b16191714
Trt. × Yr (P value)0.00020.932
Depth, cmρb (g cm−3)
0–51.30 b1.48 a1.40 ab1.44 a1.481.451.381.44
5–101.501.431.461.541.52 ab1.61 a1.46 b1.58 a
10–151.461.441.421.501.50 ab1.54 a1.41 b1.55 a
15–201.451.381.411.451.501.541.471.52
Yearθg during sampling (%)
201612.2 ab9.4 b15.1 a9.8 b7.8 c14.3 ab16.1 a9.7 bc
201711.0 a7.8 b8.2 b6.5 b8.111.113.57.7
Trt. × Yr (P value)0.03700.823
† Numbers in parentheses represent standard deviation. § Means within a row followed by the same lower-case letter are not different at α = 0.05. Abbreviations: Trt., treatment; Yr, year; OWB, Old-World bluestem; TW, tall wheatgrass.
Table 2. Estimated van Genuchten model parameter values obtained from the simultaneous fits of the measured soil water retention curves (SWRCs) data to Equation (3) for all treatments in the east and west pasture area during a 2-year study period (2016–2017).
Soil
Depth
Fitted Parameter §EastWest
OWB-LegumeNativeAnnualAlfalfa-TWNativeTeffOWB-UngrazedOWB-Grazed
0–5 cmθr0.070.080.090.090.080.060.100.09
θs0.540.480.480.440.460.420.470.46
αv0.060.080.110.120.010.010.010.03
n2.961.191.091.092.231.651.141.80
5–10 cmθr0.060.060.090.090.080.070.060.09
θs0.520.460.460.440.440.390.420.40
αv0.010.020.010.080.070.090.010.03
n1.261.131.142.211.081.161.171.14
10–15 cmθr0.060.080.060.080.090.080.080.10
θs0.510.450.480.470.440.420.470.41
αv0.030.010.010.040.050.010.010.06
n1.232.112.251.621.971.721.521.15
15–20 cmθr0.050.060.070.060.060.070.070.08
θs0.520.470.480.490.480.410.460.41
αv0.010.010.030.030.010.030.020.04
n1.561.421.151.152.142.421.541.12
§ θr, residual volumetric water content (cm3 cm−3); θs, volumetric water content at saturation (cm3 cm−3); αv (related to the inverse of air entry pressure head; cm−1) and n (related to pore size distribution; dimensionless) are fitting shape parameters. Abbreviations: OWB, Old-World bluestem; TW, tall wheatgrass.
Table 3. Soil water thresholds, i.e., volumetric water contents (θv) (a function of pressure heads) of pasture soils, at different soil depths for all treatments in the east and west pasture area during a 2-year study period (2016–2017). Data were averaged across sampling points, replicates, and years.
Soil
Depth
EastWest
OWB-LegumeNativeAnnualAlfalfa-TWNativeTeffOWB-UngrazedOWB-Grazed
cmθv at saturation (cm3 cm−3)
0–50.532 a§0.489 ab0.481 bc0.441 c0.460 ab0.422 b0.473 a0.457 ab
5–100.520 a0.463 ab0.466 ab0.436 b0.4370.3880.4240.396
10–150.5130.4520.4800.4710.4370.4230.4680.408
15–200.5220.4740.4840.4870.479 a0.409 b0.458 a0.405 b
Trt. × depth0.999 †0.814
θv at FC (cm3 cm−3)
0–50.440 a0.412 ab0.384 bc0.368 c0.3920.3680.3920.357
5–100.386 ab0.430 a0.382 ab0.350 b0.3610.3440.3790.330
10–150.425 a0.377 ab0.379 ab0.355 b0.354 ab0.364 ab0.395 a0.334 b
15–200.418 a0.372 ab0.388 ab0.353 b0.387 a0.355 ab0.380 a0.341 b
Trt. × depth0.8740.906
θv at PWP (cm3 cm−3)
0–50.223 0.2190.2070.2380.201 b0.224 ab0.220 ab0.256 a
5–100.196 b0.197 b0.214 ab0.232 a0.2040.2070.2270.243
10–150.2160.2150.2070.2300.185 b0.229 ab0.242 a0.252 a
15–200.2380.2150.2160.2240.2170.2170.2210.261
Trt. × depth0.1040.768
PAW (cm3 cm−3)
0–50.217 a0.193 ab0.177 b0.130 c0.191 a0.144 bc0.172 ab0.101 c
5–100.190 b0.233 a0.168 bc0.118 c0.157 a0.137 ab0.152 a0.087 b
10–150.209 a0.162 b0.172 ab0.125 c0.169 a0.135 ab0.153 a0.092 b
15–200.180 a0.157 ab0.172 a0.129 b0.169 a0.138 ab0.159 a0.080 b
Trt. × depth0.8110.956
§ Means within a row followed by the same lower-case letter are not different at α = 0.05. † P-value of the treatment by depth interaction. Abbreviations: Trt., treatment; OWB, Old-World bluestem; TW, tall wheatgrass; PWP, permanent wilting point; FC, field capacity; PAW, plant available water.
Table 4. Soil thermal conductivity (λ) and thermal diffusivity (Dt) at saturation and permanent wilting point (PWP) soil water thresholds obtained from the soil water retention curves (SWRCs) measured at different soil depths in pasture systems with OWB-legume, native grasses, annuals, and alfalfa-tall wheatgrass for the east and west area during 2016–2017.
Soil
Depth
EastWest
OWB-LegumeNativeAnnualAlfalfa-TWNativeTeff OWB-UngrazedOWB-Grazed
cmλ (W m−1 K−1) at saturation
0–51.16 b§1.45 a1.38 ab1.41 a1.64 a1.57 ab1.43 b1.45 b
5–101.501.351.531.451.63 b1.76 a1.68 ab1.76 a
10–151.501.411.521.411.641.741.731.71
15–201.311.431.431.381.501.731.691.67
Trt × depth0.1490.877
λ (W m−1 K−1) at PWP
0–50.78 b1.06 a1.00 ab1.02 a1.261.181.051.06
5–101.120.961.151.071.251.381.321.38
10–151.121.031.141.021.251.361.341.33
15–200.931.051.041.001.121.341.301.29
Trt × depth0.1500.875
Dt (mm2 s−1) at saturation
0–50.42 b0.58 a0.51 ab0.55 a0.670.650.560.61
5–100.580.530.610.560.650.780.690.76
10–150.570.520.580.540.640.660.710.68
15–200.510.550.550.530.610.690.700.69
Trt × depth0.0390.734
Dt (mm2 s−1) at PWP
0–50.42 b0.65 a0.55 ab0.47 b0.70 a0.57 ab0.48 b0.62 ab
5–100.62 a0.59 ab0.62 a0.52 b0.690.670.710.69
10–150.570.520.560.560.650.600.710.66
15–200.540.550.570.520.660.580.700.65
Trt × depth0.0520.401
§ Means those sharing lower-case letters within a row are not different at α = 0.05. Abbreviations: Trt., treatment; OWB, Old-World bluestem; TW, tall wheatgrass.
Disclaimer/Publisher’s Note: The statements, opinions and data contained in all publications are solely those of the individual author(s) and contributor(s) and not of MDPI and/or the editor(s). MDPI and/or the editor(s) disclaim responsibility for any injury to people or property resulting from any ideas, methods, instructions or products referred to in the content.

