Article

Growth and Leaf Gas Exchange Upregulation by Elevated [CO2] Is Light Dependent in Coffee Plants

by
Antonio H. de Souza
1,
Ueliton S. de Oliveira
1,
Leonardo A. Oliveira
1,
Pablo H. N. de Carvalho
1,
Moab T. de Andrade
1,
Talitha S. Pereira
1,
Carlos C. Gomes Junior
1,
Amanda A. Cardoso
2,
José D. C. Ramalho
3,4,
Samuel C. V. Martins
1 and
Fábio M. DaMatta
1,*
1
Departamento de Biologia Vegetal, Universidade Federal de Viçosa, Viçosa 36570-900, MG, Brazil
2
Department of Crop and Soil Sciences, North Carolina State University, Raleigh, NC 27695, USA
3
PlantStress & Biodiversity Lab., Centro de Estudos Florestais (CEF), Laboratório Associado Terra, Departamento de Recursos Naturais, Ambiente e Território (DRAT), Instituto Superior de Agronomia (ISA), Universidade de Lisboa (ULisboa), Quinta do Marquês, Av. da República, 2784-505 Oeiras, Portugal
4
Unidade de Geobiociências, Geoengenharias e Geotecnologias (GeoBioTec), Faculdade de Ciências e Tecnologia (FCT), Universidade NOVA de Lisboa (UNL), Monte de Caparica, 2829-516 Caparica, Portugal
*
Author to whom correspondence should be addressed.
Plants 2023, 12(7), 1479; https://doi.org/10.3390/plants12071479
Submission received: 8 March 2023 / Revised: 23 March 2023 / Accepted: 25 March 2023 / Published: 28 March 2023
(This article belongs to the Special Issue Coffee Breeding and Stress Biology)

Abstract

:
Coffee (Coffea arabica L.) plants have been assorted as highly suitable to growth at elevated [CO2] (eCa), although such suitability is hypothesized to decrease under severe shade. We herein examined how the combination of eCa and contrasting irradiance affects growth and photosynthetic performance. Coffee plants were grown in open-top chambers under relatively high light (HL) or low light (LL) (9 or 1 mol photons m−2 day−1, respectively), and aCa or eCa (437 or 705 μmol mol–1, respectively). Most traits were affected by light and CO2, and by their interaction. Relative to aCa, our main findings were (i) a greater stomatal conductance (gs) (only at HL) with decreased diffusive limitations to photosynthesis, (ii) greater gs during HL-to-LL transitions, whereas gs was unresponsive to the LL-to-HL transitions irrespective of [CO2], (iii) greater leaf nitrogen pools (only at HL) and higher photosynthetic nitrogen-use efficiency irrespective of light, (iv) lack of photosynthetic acclimation, and (v) greater biomass partitioning to roots and earlier branching. In summary, eCa improved plant growth and photosynthetic performance. Our novel and timely findings suggest that coffee plants are highly suited for a changing climate characterized by a progressive elevation of [CO2], especially if the light is nonlimiting.

1. Introduction

The atmospheric CO2 concentration (Ca) has progressively increased since the industrial revolution and currently approaches 420 μmol mol−1. Plants under elevated Ca (eCa) often display decreased stomatal density (SD) and aperture, potentially reducing stomatal conductance (gs) and leaf transpiration [1,2]. Despite the lower gs, the net rate of CO2 assimilation (A) increases at eCa due to a greater CO2 supply to the catalytic sites of ribulose-1,5-bisphosphate carboxylase/oxygenase (RuBisCO), which uplifts RuBisCO carboxylation over oxygenation [1,2]. Concurrently, rates of photorespiration and transpiration per unit leaf area decrease, whereas water- and light-use efficiency, as well as biomass accumulation are improved [2,3,4]. However, greater biomass under eCa can bring about nutrients and minerals “dilution” in plant tissues, especially nitrogen (N) [5,6,7]. In addition, impairments in N uptake and assimilation suppression at eCa may also exacerbate the decrease of shoot N pools [8]. In the long-term, lower N levels may decrease the investment in RuBisCO coupled to a lower maximum apparent carboxylation capacity (Vcmax) and these decreases are often associated with a build-up of nonstructural carbohydrate (NSC) pools [2]. Collectively, these alterations may lead to a decreased photosynthetic capacity known as photosynthetic down-regulation [9].
Coffee (Coffea arabica L.) is one of the most important traded commodities on a global scale. This species evolved in the understories of African highland forests, but it has been cultivated worldwide over distinct light environments, ranging from full sun exposure (e.g., Brazil) to relatively dense shade (e.g., some regions of Central America and India). Coffee plantations at full sunlight often outyield those under shade in regions with satisfactory edaphoclimatic conditions for crop production [10,11]. Accordingly, both A and gs, as well as mesophyll conductance (gm), are greater in high light (HL) than in low light (LL) conditions, particularly when vapor pressure deficit (VPD) is low [10,11,12]. However, given the coffee’s origin in understory forests, unshaded plants are believed to be under a higher threat in face of environmental stresses (e.g., drought and extreme temperatures) than their shaded counterparts. If that holds true, the negative consequences of climate change and global warming on coffee plantations will be considerably magnified in full sunlight coffee farms [13]. Under this perspective, the use of shelter trees in coffee plantations, namely with the implementation of tree intercropping or agroforestry systems, has been routinely invoked as a management strategy to ameliorate the sustainability of the coffee crop in a climate change scenario [11,14,15]. Notably, a recent meta-analysis (without considering the effects of eCa), has suggested that coffee yields tended to be the highest in full sunlight or in “low to moderate” shaded environments (no more than 40% of shade cover), while “very high” shade (above 70%) led to the lowest yields for most coffee cultivars [14].
Irrespective of the light levels, coffee plants have been assorted as highly susceptible to several stresses at current ambient Ca (aCa) [16,17,18]. Nevertheless, a greater intrinsic resilience of some coffee genotypes than anticipated, as well as the positive impact of eCa, can significantly attenuate stress impairments, namely of supraoptimal temperatures [19,20,21], and drought [22,23,24,25,26,27] in coffee. This mitigation by eCa has been linked to an amplified acclimation response associated with improved antioxidant system and other protective molecules, together with greater lipid dynamics, and enhanced photosynthetic performance with no apparent photosynthetic down-regulation [20,21,22,28,29,30,31]. Interestingly, in contrast to most species so far investigated, which often display marked reductions in gs at eCa (see [2,32]), gs in coffee seems to be mostly unresponsive to eCa [20,22,28,30]. In fact, in some cases, gs has even been shown to increase at eCa, as circumstantially noted in free-air CO2 enrichment (FACE) trials in the upper (but not in the lower) canopy leaves that are more exposed to direct sunlight [31]. More recently, Marçal et al. [33] compared coffee plants that were grown under two light conditions [moderate LL (53% light restriction) and HL (no light restriction)] and two Ca conditions [ambient Ca (aCa; 400 µmol CO2 mol−1) and eCa (700 µmol CO2 mol−1); the authors found that gs did not respond to the Ca per se, but gs was only significantly higher in HL at eCa. This lack of response of gs to light at aCa contrasts with several studies showing higher gs (and A) in HL over LL when shading is more severe (e.g., 90% light restriction) [12,34,35]. At a first glance, these findings suggest an interplay between light intensity and Ca on stomatal function in coffee, with consequences to the photosynthetic performance and ultimately plant growth.
The understanding of the underlying mechanisms by which coffee plants cope with light and Ca supplies at both the leaf and whole-plant scales is of paramount importance for crop sustainability in face of ongoing climate changes. In a first attempt to understand these mechanisms, Marçal et al. [33] have demonstrated that young coffee plants grown under moderate LL displayed lower growth and photosynthetic performance relative to those grown under HL. These impacts were partially reversed by an eCa, although most effects of light and Ca on growth and photosynthetic performance occurred independently [33]. Here, we further explored the mechanisms by which the photosynthetic machinery adjusts to more contrasting light conditions (with a reduction of irradiance up to 90%, LL), and how these adjustments could be modulated under eCa. Specifically, our main objectives were to examine how the interplay of light levels and Ca could affect (i) the stomatal function, (ii) the relative contributions of photochemical, diffusional, and biochemical limitations of photosynthesis at the leaf level, (iii) the N partitioning into the major components of the photosynthetic apparatus, (iv) as well as the coffee growth performance.

2. Results

Most variables analyzed remarkably responded to light and/or Ca. Key traits of leaf gas exchange and photosynthesis [A, gs, and electron transport rate (ETR)] and growth [total biomass (TB) and total leaf area (TLA)] were not only affected by light and Ca factors, but also by their interaction (p < 0.001) (Table A1).

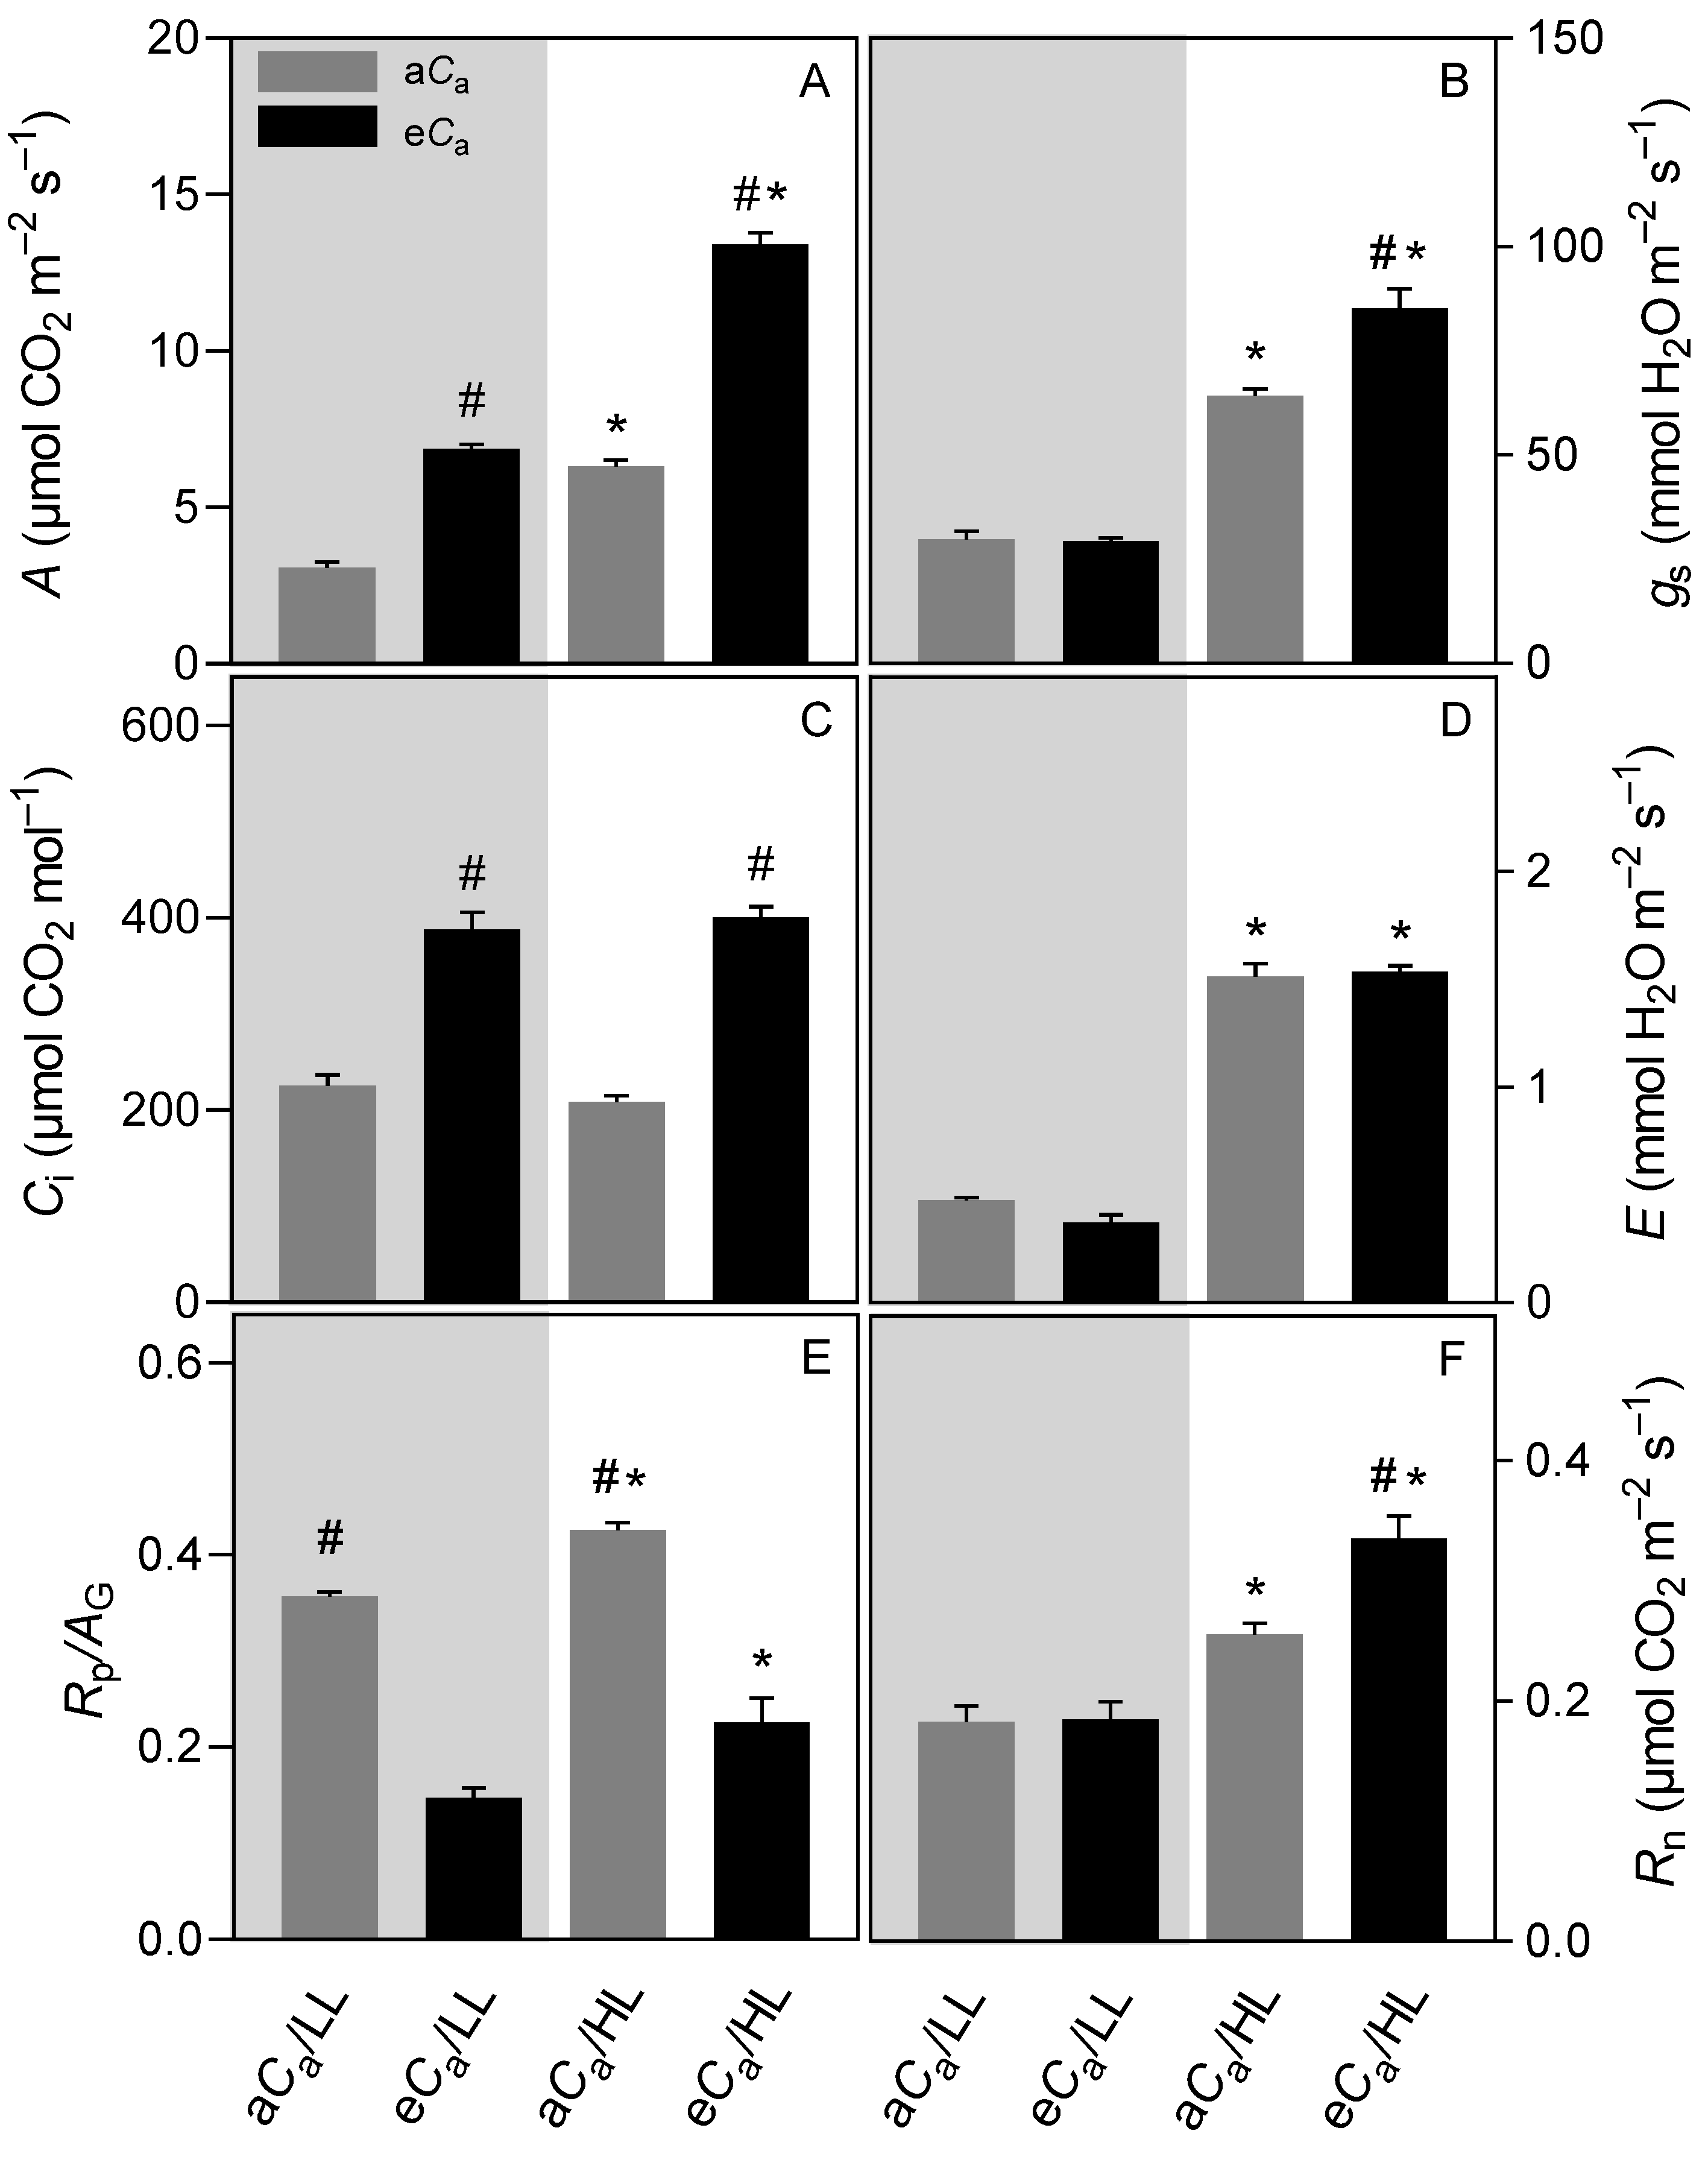
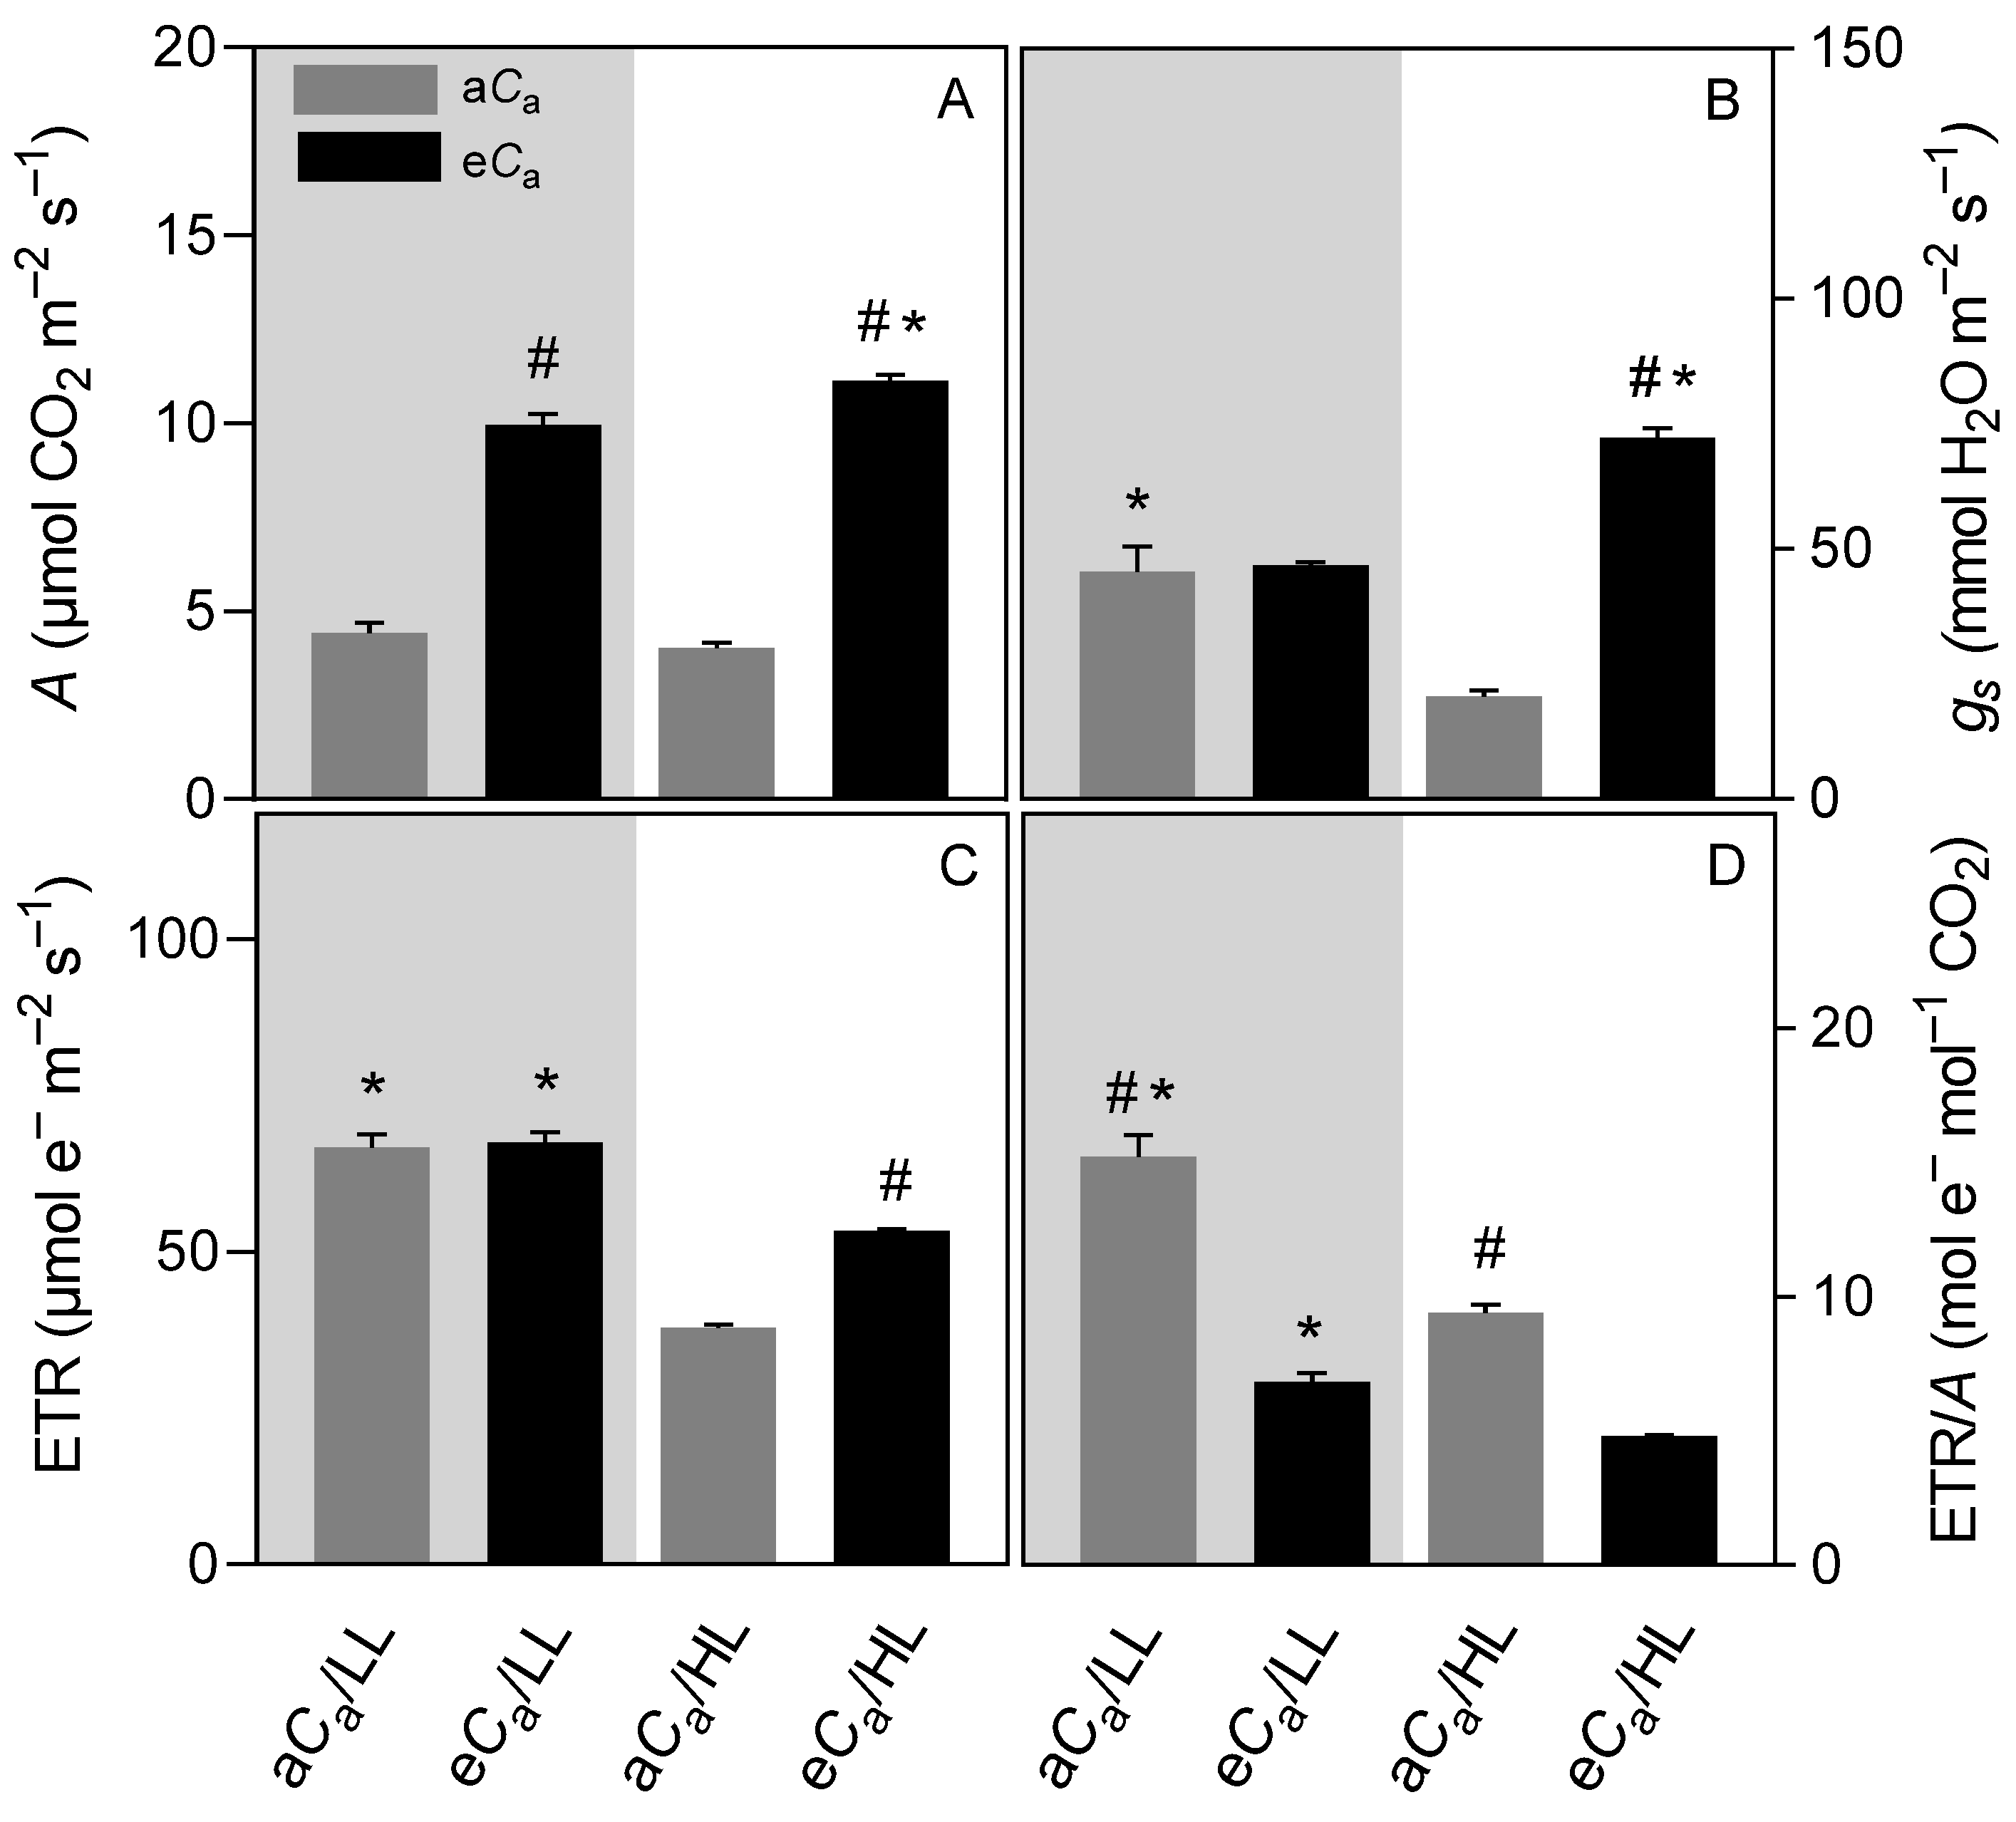
2.1. Gas Exchanges and Chlorophyll a Fluorescence Parameters
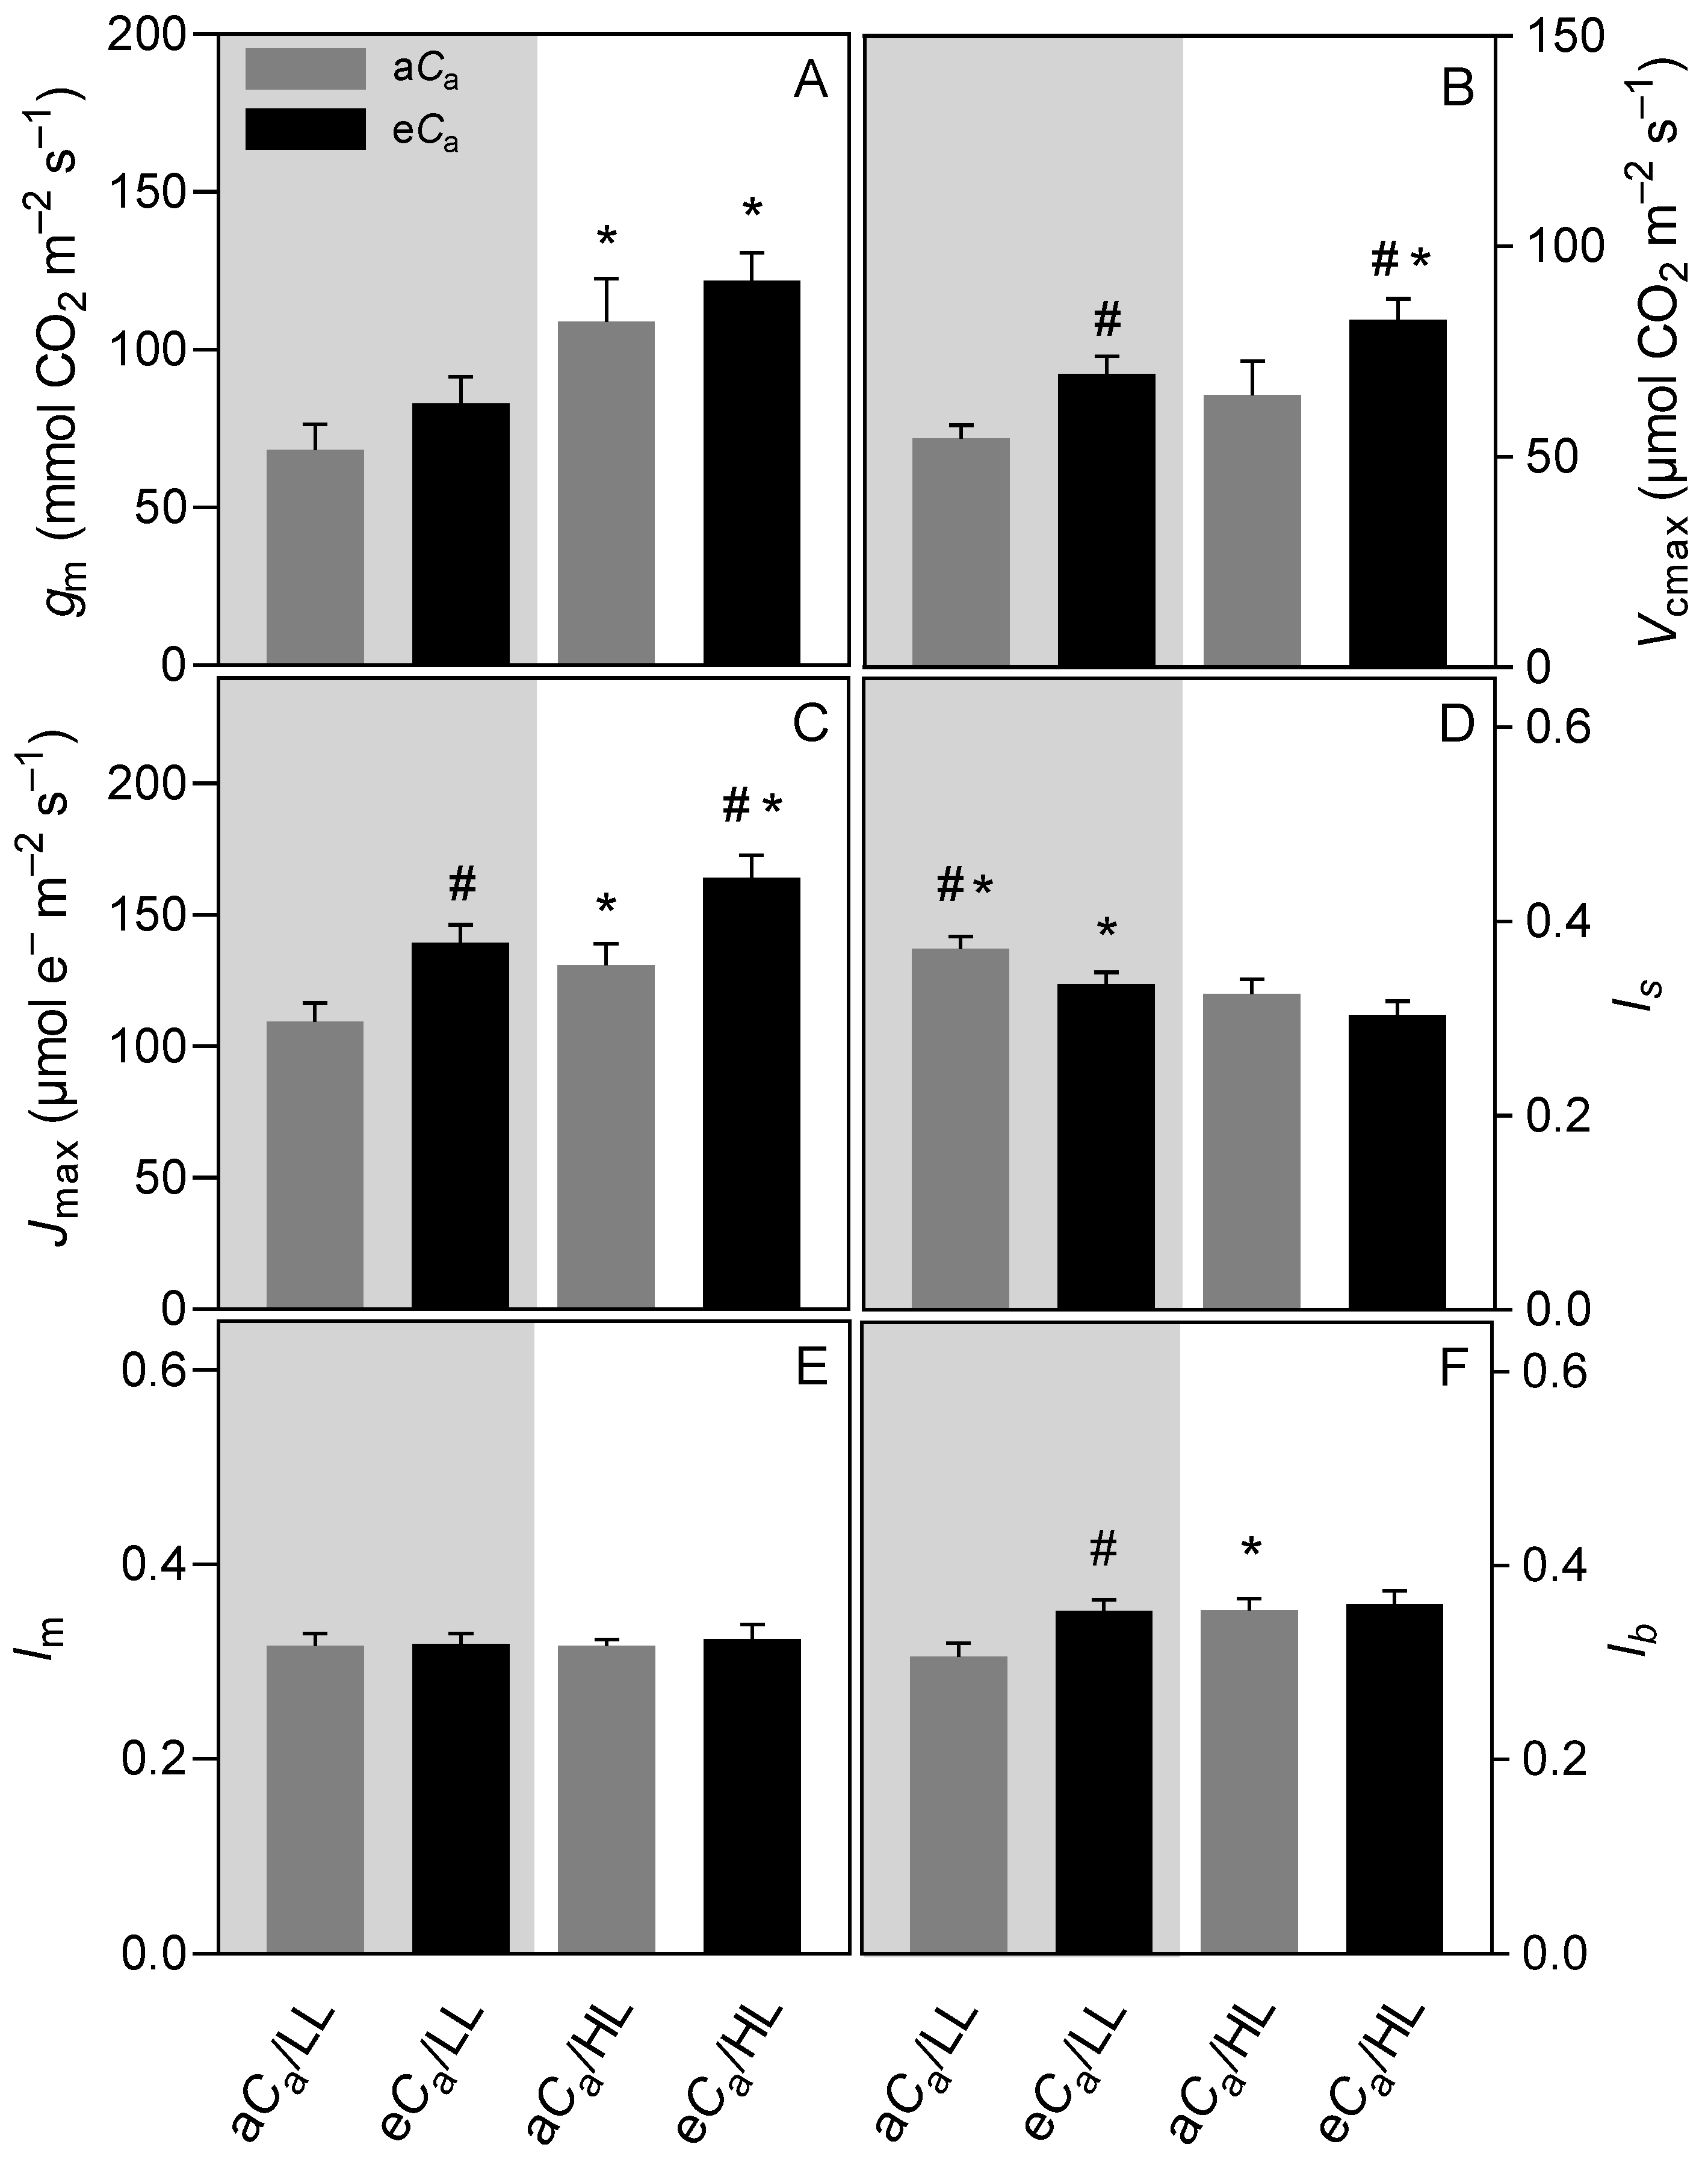
Shading markedly affected the magnitude of gas exchange, with lower A in LL plants (eCa: 49%, aCa: 51%) than those of HL ones (values within parentheses throughout the results represent the percentage changes of a given treatment with regards to its direct counterpart). The lower A was accompanied by lower values of gs (eCa: 66%, aCa: 53%), transpiration rate (E) (eCa: 76%, aCa: 68%), nocturnal respiration rate (Rn) (eCa: 45%, aCa: 28%), and photorespiration-to-gross photosynthesis ratio (RP/AG) (eCa: 34%, aCa: 16%) relative to HL plants (Figure 1).
Regardless of irradiance, A more than doubled in eCa relative to aCa plants (HL: 112%, LL: 124%), paralleling significant increases in internal Ca (Ci) (HL: 92%, LL: 72%). As expected, eCa decreased RP/AG (HL: 47%, LL: 59%). Notably, gs (as also Rn) from HL/eCa plants was ca. 25% higher than that of their HL/aCa counterparts, but no differences were found between Ca conditions under LL (Figure 1).
The LL plants, when evaluated at 1000 µmol photons m−2 s−1 (Figure 2), displayed increases in A (eCa: 45%, aCa: 44%), gs (eCa: 60%, aCa: 51%), ETR (eCa: 59%, aCa: 60%) and ETR/A (eCa: 23%, aCa: 39%), as compared with their values obtained at growth irradiance (Figure 1). Conversely, the HL plants when evaluated at 200 µmol photons m−2 s−1 showed, in general, greater reductions in those parameters (especially in gs) at aCa than at eCa: decreases in A (eCa: 17%, aCa: 36%), gs (eCa: 15%, aCa: 67%), ETR (eCa: 45%, aCa: 51%), and ETR/A (eCa: 10%, aCa: 19%) (Figure 2).
The maximum photochemical efficiency of photosystem II (Fv/Fm) ratio was unresponsive to the treatments and averaged close to 0.8. LL plants, as compared to HL ones, exhibited greater values of the actual photochemical efficiency of photosystem II (Fv′/Fm′) (eCa: 6%, aCa: 8%), the actual quantum yield of PSII (ΦPSII) (eCa: 129%, aCa: 152%), and qp (eCa: 84%, aCa: 115%), but with substantially lower ETR values (eCa: 59%, aCa: 51%). That resulted in a lower ETR/A (eCa: 21%, aCa: 8%) (Table A2).
In HL individuals, eCa promoted an increase in ΦPSII (13%) and ETR (23%), whereas in LL plants these parameters were unresponsive to eCa. In contrast, eCa led to reductions in the ETR/A ratio (HL: 44%, LL: 52%) (Table A2).

2.2. A/Ci Curves

The LL plants showed lower values of Vcmax (eCa: 15%, aCa: 16%), maximum rate of carboxylation that is limited by electron transport (Jmax) (eCa: 15%, aCa: 17%), and gm (eCa: 32%, aCa: 37%) relative to the HL ones. Regardless of treatments, photosynthetic performance was mainly constrained by diffusive components [i.e., stomatal limitation (ls) + mesophyll limitation (lm); ≈67%]. Notably, the LL plants, regardless of Ca, showed higher ls (13% on average) than those of HL individuals (Figure 3).
The eCa promoted overall increases in Vcmax (HL: 27%, LL: 28%) and Jmax (HL: 25%, LL: 28%). The Jmax/Vcmax ratio did not respond to the treatments and averaged on ca. 2.0, as can be deduced from Figure 3.

2.3. Photosynthetic N-Use Efficiency and N Partitioning

The HL/eCa plants had the highest leaf N concentration on both a per mass and area bases (37.9 g kg−1 and 2.16 g m−2, respectively) relative to plants from the other treatments (averaging on 32 g kg−1 and 1.64 g m−2; Table 1). Overall, the LL plants invested approx. half of their total leaf N pools in photosynthesis (PP) against ca. 41% in HL plants, irrespective of Ca (Table 1). Accordingly, LL plants, relative to their HL counterparts, displayed higher leaf N fraction allocated to RuBisCO (PR) (eCa: 23%, aCa: 17%), leaf N fraction allocated to bioenergetics (PB) (eCa: 20%, aCa: 42%) and leaf N fraction allocated to thylakoid light-harvesting components (PL) (eCa: 27%, aCa: 12%, significant only for eCa), implying in concordant decreases in leaf N fraction allocated to non-photosynthetic tissues (PNP) (eCa: 17%, aCa: 11%). Photosynthetic-N use efficiency (PNUE) did not respond to light availability in eCa plants but increased by 34% in aCa/HL individuals relative to aCa/LL ones (Table 1).
The eCa condition promoted an increase in PP (10%) in LL plants with a concomitant increase only in PR (14%). In HL plants eCa did not affect PP, despite the increments in PB (23%), whereas PL and PR were unresponsive to Ca. Regardless of light, PNUE strongly responded to eCa, with increases of 68% (HL) and 133% (LL) (Table 1).

2.4. Metabolites

The LL plants, compared with HL ones, had higher concentrations of total chlorophylls (Chl) (eCa: 52%, aCa: 23%), as well as lower concentrations of starch (eCa: 11%, aCa: 17%), glucose (eCa: 31%, aCa: 14%), fructose (eCa: 27%, aCa: 12%), NSC (eCa: 12%, aCa: 14%) and total amino acids (TAA) (eCa: 31%, aCa: 40%) (Table 2).
In LL plants, eCa led to a decline in fructose (11%) concentration, and increases in sucrose (17%), TAA (79%), and proteins (20%) pools. In HL plants, eCa caused increases in the levels of TAA (61%), proteins (21%), glucose (20%), and fructose (7%) (Table 2).

2.5. Morphoanatomical Traits

The LL individuals displayed lower values of SD (eCa: 53%, aCa: 51%), stomatal index (SI) (eCa: 26%, aCa: 17%), and maximum theoretical stomatal conductance to water vapor (gwmax) (eCa: 56%, aCa: 49%) than those of HL ones. These traits were unaffected by Ca, except gwmax which was 21% higher in eCa than in aCa plants at HL. The stomatal size (SS) did not respond significantly to the treatments, although a tendency to increase (20%) was observed in eCa when compared with aCa, only under HL conditions (Table 3).

2.6. Growth Traits and Biomass Partitioning

Total biomass (TB) and total leaf area (TLA) were markedly affected by light and Ca (p < 0.001), and by their interaction (Table A1). Light availability did not significantly affect root mass ratio (RMR), stem mass ratio (SMR) and leaf mass ratio (LMR), in contrast to the Ca factor, which increased RMR at the expense of reductions in LMR (Table 4). Despite unchanging SMR, qualitative changes were observed when this SMR was broken down into orthotropic mass ratio (OMR) (which varied negligibly in response to the treatments) and plagiotropic mass ratio (PMR): PMR was higher in HL than in LL conditions and increased in response to eCa (Table 4).
The LL conditions provoked dramatic declines in growth and TB, especially at aCa (Table 4). Relative to HL plants, the LL ones showed reductions in height (eCa and aCa: 47%) and TLA (eCa: 71%, aCa: 68%), with concordant lower TB (eCa: 84%, aCa: 79%), although with greater leaf area ratio (LAR) (eCa: 80%, aCa: 63%) (Table 4).
Plant phenotypes were significantly altered by eCa, as deduced from the greater height (HL and LL: 23%), TLA (HL: 62%, LL: 42%), and TB (HL: 102%, LL: 53%) than at aCa (Table 4). RMR increased dramatically (HL: 103%, LL: 41%) at the expense of a lower LMR (HL: 21%, LL: 10%), whereas SMR and LAR remained unchanging independently of Ca (Table 4).

3. Discussion

We here demonstrated that the positive effects of eCa on coffee performance were particularly evident under moderate to high light levels. In any case, we must contend that the “HL” conditions herein employed were approx. half relative to that found outdoors in the same experimental site [34], and thus our HL treatment is more moderate relative to agricultural conditions. Notably, however, we must emphasize that (i) the usual levels of shade cover for coffee cultivation often range from 20 to 50% [10,13], and that (ii) young plants remarkably display less self-shading than adult individuals, implying that the levels of proper shade cover could exceed those for adult coffee plants. We, therefore, contend that, within the given limits, our major findings may be properly applied to agricultural conditions such as agroforestry systems.

3.1. The eCa Increases Stomatal Conductance Only in High-Light-Grown Plants

Despite having evolved in shady environments, coffee plants often display higher gs (associated with higher SD and SI) at HL than at LL conditions [10,12,33], in agreement with our results. The dependence of stomatal aperture on light intensity appears to be independent of Ca, as noted both under moderate irradiance [28,34] and a severe shade (this study). Notably, we determined gs using an infrared gas analyzer and the gwmax using anatomical traits [36] and both traits responded similarly to the applied treatments. However, as there were no significant variations in SD, SI, and SS (as well as in unitary leaf area; data not shown), in good agreement with our previous reports [20], we contend that the stomatal aperture played major roles in governing the changes in gs in response to light and Ca. Most importantly, we herein showed for the first time an increase in gs at eCa in HL plants (Figure 1). Similar results were also observed in field-grown coffee trees by Rakočević et al. [31], as well as in some woody taxa adapted to warm, low-humidity conditions [37]. Taking all these findings together, we suggest that responses of gs to eCa might be species-specific, implying that some caution should be exercised against the well-established universal belief that gs is downregulated by eCa [1,2,3].
The interactive effects of light and CO2 availability on stomatal behavior were immediately evident when we assessed gas exchanges of HL plants under LL (and vice-versa) (Figure 2). During the HL-to-LL transitions, we observed decreases in gs, but to a much lesser extent in eCa plants than in aCa individuals; in contrast, in the LL-to-HL transitions we found increases in gs that seemed independent of Ca. Although the underlying physiological mechanisms that could explain this differential stomatal behavior remain to be elucidated, our results have direct practical implications and help explain the greater carbon gain (and biomass) over time in the HL/eCa individuals. It is important to emphasize that coffee plants display inherently low gs and stomatal constraints comprise the main limitation to photosynthesis, particularly in LL leaves (Figure 1 and Figure 3) [12]. In this context, maintenance of higher gs under partial shading can guarantee a greater CO2 inflow, ultimately improving whole-canopy photosynthesis [38]. In fact, A was a little constrained during the HL-to-LL transition in eCa plants (Figure 2). Extrapolating this information to the field, where the intercepted irradiance along the day varies dramatically throughout the coffee canopy [39], an eCa would favor carbon gain via higher gs when the foliage becomes momentarily more shaded. This might partly explain the improved coffee growth and production at eCa, as observed in FACE-grown coffee trees [11,29]. Additionally, higher gs at eCa may result in lower leaf temperature (data not shown), which may translate into lower rates of maintenance respiration and photorespiration [2], further contributing to improving carbon balance and biomass accumulation.

3.2. The eCa Improves Photosynthetic Performance by Decreasing Diffusional Limitations without Causing Photosynthetic Down-Regulation

As already demonstrated in previous studies with coffee [12,30,34], diffusive limitations (ls + lm) comprised the largest fraction of total constraints to photosynthesis, as can be deduced from Figure 3. LL plants showed lower gs in parallel to higher ls than HL plants, regardless of Ca. In LL plants, since there were no significant differences in gs and gm (and lm) in response to Ca, the CO2 enrichment resulted in higher A likely associated with a higher CO2 availability in the chloroplasts and hence lower photorespiration. However, it should be noted that the ls of LL plants under eCa was even greater than the ls of their HL counterparts (Figure 3), underlining the limitations imposed by the lower gs on the photosynthetic performance by LL conditions. Indeed, another indicator of the magnitude of the diffusive limitations in LL plants, in both CO2 conditions, was the highest values of ETR/A ratio when these plants were evaluated under HL (Figure 2), indicating a higher presence of alternative electron sinks.
Overall, both HL and particularly eCa provoked adjustments in RuBisCO activity (as noted by Vcmax) and RuBP regeneration capacity (Jmax) (Figure 3). However, Vcmax and Jmax varied in parallel regardless of treatments, resulting in an unchanged Jmax/Vcmax ratio, in contrast to meta-analysis studies which have shown that such a ratio increased slightly (5.7% on average) but significantly at eCa [9,40]. In addition, in good agreement with our previous studies [22,28,30,34], we found no signs of photosynthetic acclimation at eCa, as denoted by the up-, rather than down-regulation, of Vcmax and Jmax, lack of decreases in N levels and relatively small changes in NSC pools. In fact, increased A values in eCa coffee plants have been shown to be supported not only by the greater CO2 availability at the carboxylation sites (with concordant decreases in photorespiration), but also by greater in vivo thylakoid electron transport rates at both photosystems I and II levels, and some further investment in photosynthetic components (among them RuBisCO) [20,26]. Most importantly, photosynthetic up-regulation at eCa was herein observed even when growth was severely impaired (low sink demand) by LL conditions (see below), which additionally lends support for the suitability of coffee plants in a scenario of increasing Ca.

3.3. The eCa Improves Photosynthetic-N Use Efficiency Irrespective of Light Levels via Increases in Photosynthetic Performance Rather Than Alterations in N Partitioning

Most studies have reported unchanging foliar N pools in coffee at eCa [29,30,34], although a “dilution effect” of N was also observed in a genotype-dependent manner [10]. Unexpectedly, we noted an increased N concentration in HL/eCa plants (Table 1), which might be associated with improved N acquisition due to increased soil exploitation (higher RMR, Table 4), and higher N mass flow to the foliage due to the greater E (Figure 1) in those plants. We also noted a higher protein concentration under eCa (and even greater as regards amino acids) irrespective of the light regime, suggesting a differential partitioning of N towards protein synthesis. Since the greatest proportion of leaf proteins is associated with RuBisCO [41], we suggest that eCa improved RuBisCO content, which is consistent with the eCa-related increases in Vcmax in both LL plants (unchanging foliar N but with increased PR) and HL ones (increased N but with unchanging PR), in line with the above-mentioned reports that found a significant up-regulation of total RuBisCO activity in eCa coffee plants grown at moderate irradiance [20,26].
The marked eCa-related improvement in PNUE found here (68–133%) was much greater than the average increase (31%) reported by Leakey et al. [4] when analyzing several species grown under FACE conditions. Despite being improved markedly by eCa, PNUE in coffee is quite low in comparison with other woody species [42,43,44]. At a first glance, such a low PNUE in coffee leaves might be linked to a poor investment of N (41–52%) in the photosynthetic machinery [45,46] and, especially, due to the inherently low A. Given that the greater PP in LL plants was not translated into improved PNUE relative to that of the HL individuals, we suggest that varying patterns of N allocation to photosynthesis had a minor role in explaining the intrinsic low coffee’s PNUE. Furthermore, to maximize PNUE at eCa, it has been proposed that leaf N pools should be reallocated from RuBisCO (thus leading to a lower PR) to the RuBP regeneration (higher PB) and/or light-harvesting pigments (higher PL) [47]. Here we observed that eCa provoked increases in PR without affecting PB or PL only in LL plants, whereas in HL individuals eCa led to increases in PB with unchanging PR (Table 1). Altogether, we contend that eCa could improve PNUE by fundamentally decreasing the diffusive limitations of photosynthesis (and decreasing Rp) rather than by altering N allocation to the photosynthetic apparatus.

3.4. The eCa Interacts with High Light to Promote Growth, but Changes in Biomass Partitioning Are Only Affected by the CO2 Supply

Both higher light and CO2 availabilities improved biomass gain (and A), and the positive effects of eCa were much less evident in LL conditions. These results suggest that the revenues in terms of growth and photosynthetic performance at eCa are expected to be decreased at deep shade, especially in coffee plants with dense canopies grown at closer spacings. We also found that the overall biomass partitioning between roots, leaves, and stems was unaffected by light, which accords with our previous findings [34]. However, in sharp contrast with results reported by Marçal et al. [33], who observed an unchanged partitioning in response to varying Ca, we herein found an increased biomass partitioning to roots (higher RMR) at the expense of leaves (lower LMR) at eCa (Table 4). Possibly, differences in the age of plants (six-month-old plants in [33] against 15-month-old in this current study) could result in ontogenetic drifts that might explain these apparent discrepancies (see [34,48]). In any case, increases in RMR at eCa have been documented in other woody species such as eucalyptus [49] and could significantly improve water and nutrient acquisition [2,48], thus leading to better fitness, as particularly noted in HL/eCa plants. Interestingly, eCa provoked earlier branching, especially in HL, thus allowing a greater node formation that in turn could anchor a greater number of leaves. Given that the unitary leaf area was unaffected by eCa (in contrast to the general increase that has been observed at eCa) (see [2]), we contend that the greater total leaf area was to a large extent associated with more nodes per branch. Additionally, if the number of nodes is the key component of coffee production [10], crop yields should then increase at eCa, as has been reported for FACE-grown coffee trees [11,29].
Plant biomass can be regarded as the most direct measure of performance as a product of growth [50]. Biomass accumulation increases with increasing relative growth rate, which is the product of LAR and net assimilation rate (NAR) (which in turn is directly associated with the time-integrated whole-plant A) [51]. The increases in biomass we found were accompanied by decreased LAR (HL conditions) or unchanging LAR (eCa conditions). Thus, it is tempting to suggest that physiological adjustments, leading to a higher NAR, should greatly explain the differences in biomass observed due to the varying supplies of both light and CO2. If computing solely the effects of eCa on growth under non-limiting light, we found in eCa relative to aCa individuals: (i) a remarkably greater biomass (107%) with the same LAR; (ii) a higher proportion of non-photosynthetic tissues (48% against 35%; as deduced from the biomass partitioning among leaves, stems and roots), which consume but do not produce photoassimilates, thus contributing negatively to the whole-plant carbon balance at an eCa condition; and (iii) no differences in foliar NSC pools. Collectively, this information reinforces the prominent role of photosynthesis, and probably NAR, to support the higher growth rates and biomass gain in an eCa scenario when light is not limiting. At last, we speculate to what extent the higher RMR under eCa improved water acquisition thus allowing a longer stomatal aperture, and, consequently, increased the time-integrated whole-plant A. In this context, whereas the higher RMR seems advantageous for HL/eCa plants, it might be a penalty for LL/eCa plants that would benefit more from an investment in TLA prioritizing light capture.

4. Materials and Methods

4.1. Plant Material, Growth Conditions, and Sampling

The experiment was carried out in Viçosa (20°45′17″ S, 42°52′57″ W, 650 m above sea level), southeastern Brazil. Coffee seedlings (C. arabica cv. Catuaí Vermelho IAC 44, obtained from the “Empresa de Pesquisa Agropecuária de Minas Gerais”—EPAMIG, Viçosa, Minas Gerais State, Brazil) with four leaf pairs were transplanted into 12-L pots containing soil, sand, and composted manure (3:2:1; v:v:v). This substrate, with a pH of 5.8, had the following macronutrient composition: N, P, K, S (600, 12.4, 179, 53.7 mg kg−1, respectively), and Ca and Mg (0.97 and 0.62 cmolc dm−3, respectively). The substrate was fortnightly fertilized with 2 g of ammonium sulfate and 100 mL of Hoagland’s nutrient solution [52]. When 3-month-old (5–6 leaf pairs), 28 plants (one plant per pot) were distributed among four open top chambers (OTC) (1.15 m in diameter and 1.40 m in height). The Ca levels were 437 ± 9 μmol mol–1 (aCa) or 705 ± 18 μmol mol–1 (eCa). Detailed information on CO2 enrichment (from 06:00 to 18:00 h) and Ca checking inside the OTCs have been reported by Ávila et al. [22]. The OTCs were maintained in a greenhouse with controlled temperature (ca. 30/25 °C, day/night) and naturally fluctuating conditions of air humidity and irradiance. After 150 days in the OTCs, the least uniform plant inside each OTC was discarded and the remaining six plants in individual pots were maintained in each chamber. During the entire period over which the plants remained inside the OTCs, plants were subjected to two irradiance levels (in either aCO2 and eCO2), as measured inside the OTCs: (i) HL [natural, direct photosynthetic photon flux density (PPFD) passed on by the greenhouse (approx. 9.0 mol photons m−2 day−1)], and (ii) LL [ca. 90% restriction of HL level, which gave approx. 1.0 mol photons m−2 day−1 at the top of the plants]. The light restriction was obtained using neutral-density black nylon nettings (Sombrite®). PPFD, air temperature (Tair), and air relative humidity inside the OTCs were registered with sensors (positioned above the plant canopies) every minute and stored as 15 min averages in a data logger (Li-1400, Li-Cor, Lincoln, NE, USA). Over the course of the experiment, the diurnal Tair averaged 24.3 and 22.8 °C, whereas VPD averaged 1.03 and 0.84 kPa, respectively in HL and LL conditions. Both Tair and VPD were unaffected by Ca within each light environment. The pots inside the OTCs were rotated weekly to minimize any spatial variation in light and CO2.
Sampling and measurements were carried out in October and November 2021, when plants were approximately 15 months old. For anatomical and physiological analyses, fully expanded leaves from the third or fourth node from the apex of the plagiotropic branches were used.

4.2. Gas Exchanges and Chlorophyll a Fluorescence Analysis

Leaf gas exchanges and Chl a fluorescence parameters were concurrently assessed using a gas exchange system equipped with an integrated fluorescence chamber (LI-6400XT, LI-Cor, Lincoln, NE, USA). The A, gs, Ci, and E were measured under artificial PPFD of 1000 µmol m−2 s−1 for HL plants, and 200 µmol m−2 s−1 for LL plants. These PPFD intensities resembled roughly the maximum ambient PPFD intercepted by the sampled leaves in their natural angles during evaluations (the LL plants had more planophile leaves than the HL ones, thus intercepting the incident light beams more efficiently). Measurements were also conducted under a PPFD of 200 µmol m−2 s−1 for HL and a PPFD of 1000 µmol m−2 s−1 for LL plants. The amount of blue light was fixed at 10% of PPFD to favor the stomatal aperture. The block temperature was maintained at 25 °C, and the VPD was kept at ca. 1.0 kPa. All the evaluations, including Rn (see below), were conducted at either 400 or 700 µmol CO2 mol−1, according to each CO2 treatment. Corrections for the leakage of CO2 into and out of the leaf chamber of the LI-6400XT were carried out for all gas exchange gauges [53]. Additional details are described in DaMatta et al. [30].
The Chl a fluorescence parameters were measured in both dark- and light-acclimated leaf tissues exactly as described elsewhere [34], from which Fv/Fm, Fv′/Fm′, ΦPSII, and ETR were calculated.
The Rn was measured at midnight using the same gas exchange system described above and divided by two (Rn/2) to estimate the daytime mitochondrial respiration rate (Rl) [54]. The Rl values were rectified for leaf temperature using the temperature response equations given by Sharkey et al. [55]. The RuBisCO photorespiratory rate (RP) was calculated as RP = 1/12[ETR − 4(A + Rl)] following [56], after which RP/AG was computed by considering the values of RP, A, and Rl [30]. Afterward, gm was estimated according to the methodology outlined by [57], for which gas exchange (A, Ci, and Rl) and Chl a fluorescence (ETR) data were used. Additionally, the conservative parameter Γ* (chloroplastic CO2 compensation point in the absence of mitochondrial respiration) for coffee was taken from Martins et al. [58]. The gm was then calculated as follows:
gm = A/(Ci − (Γ*(ETR + 8(A + Rl))/(ETR − 4(A + Rl))))
Six in situ A/Ci curves, produced in the morning exactly as described elsewhere [12,30,34], were performed under a PPFD of 1000 μmol m–2 s–1 at the leaf level, which is sufficient to saturate the photosynthetic machinery of coffee leaves without causing photoinhibition [40]. From these curves, Vcmax and the maximum rate of carboxylation limited by electron transport (Jmax), both on a Cc basis, were calculated by fitting the mechanistic model of CO2 assimilation described by Farquhar et al. [59] using the Cc-based temperature dependence of the kinetic parameters of RuBisCO [60]. The values of Vcmax, Jmax, and gm were normalized to 25 °C using the temperature response equations proposed by Sharkey et al. [55].
The overall photosynthetic limitations, fractionated into their functional components [stomatal (ls), mesophyll (lm), and biochemical (lb)], were estimated following the equations given in Grassi and Magnani [61] and comprehensively described by Martins et al. [12].

4.3. Nitrogen-Use Efficiency and N Partitioning

Total leaf N was determined using the Kjeldahl method as reported elsewhere [62]. The PNUE was estimated from the ratio of light-saturated A (measured at 1000 µmol photons m−2 s−1 for both LL and HL leaves) to total leaf N concentration on a per-area basis. The leaf N fractions that were allocated into the major photosynthetic components (PR; PB, i.e., other Calvin cycle enzymes, ATP synthase, and electron carriers; and PL) were calculated according to [63], for which the specific leaf mass, N, and Chl concentrations (see below), and values of Jmax and Vcmax (Cc basis) were used. The sum of PR + PB + PL reflects the N fraction allocated into the photosynthetic machinery (PP), whereas the fraction of N partitioned into non-photosynthetic components (PNP) was quantified as PNP = 1 − PP.

4.4. Metabolites

Leaf samples, collected at midday, were lyophilized at −48 °C and crushed in a ball mill, from which the concentrations of some metabolites were assessed. Briefly, pure methanol (700 μL) was added to a 10-mg sample of pulverized tissue, followed by incubation at 70 °C for 30 min. The mixture was then centrifuged (16,200× g, 5 min), and the supernatant was added to new tubes with the addition of chloroform (375 μL) and ultrapure water (600 μL). After new centrifugation (10,000× g, 10 min), the concentrations of hexoses (glucose and fructose) and sucrose were assessed in the soluble phase by a three-step reaction in which hexokinase, phosphoglucose isomerase and invertase were subsequently added to a reaction buffer containing ATP, NADH and glucose dehydrogenase (all from Sigma Aldrich). TAA was also quantified from the soluble phase using a standard curve with an equimolecular mixture of glycine, glutamic acid, phenylalanine, and arginine in 70% (v/v) aqueous ethanol. The methanol-insoluble pellet was used to quantify proteins and starch. The pellet was treated with KOH 0.2 M (1 mL), and then resuspended and incubated at 95 °C. Proteins were quantified afterward (Bradford method). Starch was determined after the sequential addition of acetic acid (2 M, 160 μL) and hexokinase in a buffer reaction as described above for sugars. Further details have been described elsewhere [64,65]. Chl (a + b) was extracted using aqueous acetone (80%, v/v) and quantified according to Wellburn [66].

4.5. Morphoanatomical Analyses

Samples from the middle portion of leaf blades (avoiding the midrib) were obtained, and then stored and processed for posterior analyses exactly as described elsewhere [67]. For each sample, five fields of view were used for measuring SD, SI, and SS. Magnifications were 10× for SD, and 20× for SI and SS. The SD was computed as the total number of stomata per area, and SI was calculated as the stomatal number-to-epidermal cell number ratio. The SS was calculated as guard cell length multiplied by the width of the guard cell pair according to Franks & Beerling [68]. The slides were photographed using a digital camera (Zeis AxioCan HRc, Göttingen, Germany) mounted on a light microscope (AX70 TRF, Olympus Optical, Tokyo, Japan); images were captured and analyzed using the Image-Pro Plus 4.5 software (Media Cybernetics, Silver Spring, ML, USA). Additionally, gwmax was calculated based on anatomical traits, exactly as described in [12].

4.6. Growth Attributes

At the end of the experiment, growth traits, i.e., plant height, leaf area, and diameter of the orthotropic branch (5 cm above the ground) were quantified. TLA was measured using a leaf area integrator (Model 3100, LI-Cor, Lincoln, NE, USA). Roots were carefully washed with tap water over a 0.5 mm sieve. Additionally, leaves (including those that had eventually abscised during the experiment), stems (orthotropic and plagiotropic branches), and roots were oven-dried at 70 °C for 72 h to obtain their respective dry masses. Based on these data, TB, LMR, SMR (which was fractionated into OMR and PMR), and LAR were calculated [48].

4.7. Statistical Analysis

Data were subjected to a two-way ANOVA to assess the effects of factors Ca and light, and their interaction, using the following model:
yijk = μ + αi + γj + (αγ)ij + eijk
where yijk is the observation value of ijkth experimental unit; μ is the overall mean; αi is the fixed effect of ith level of factor Ca; γj is the fixed effect of jth level of factor light; (αγ)ij is the fixed effect of interaction between ith level of factor Ca and jth level of factor light; eijk is the random error of ijkth experimental unit, with eijk~N(0, σ 2 ). Afterward, a t test (p ≤ 0.05) was performed for mean comparisons using the SISVAR software version 5.6 [69]. Data were expressed as means ± standard error.

5. Conclusions

We demonstrate that an eCa improves the growth and photosynthetic performance of coffee plants, but these improvements decrease at deep shade. Coffee plants are apparently highly suited for a changing climate characterized by a continuing elevation of Ca, especially if the light is non-limiting. Some findings that support this idea are (i) greater gs at eCa in parallel with decreased diffusive limitations to photosynthesis, (ii) greater gs during sharp HL-to-LL transitions, (iii) greater leaf N pools and PNUE, (iv) lack of photosynthetic acclimation, even when sink demand is severely restricted, (v) greater biomass partitioning to roots, which can improve water and nutrient acquisition, and (vi) earlier branching, which may be reflected in improved plant fitness and crop yield. In summary, our novel and timely findings provide relevant information on the roles of eCa to improve coffee growth and yield in a changing climate scenario.

Author Contributions

Conceptualization, J.D.C.R., S.C.V.M. and F.M.D.; validation, A.H.d.S., U.S.d.O., L.A.O., P.H.N.d.C., M.T.d.A., T.S.P., C.C.G.J., S.C.V.M. and F.M.D.; formal analysis, A.H.d.S., U.S.d.O., L.A.O., A.A.C., J.D.C.R., S.C.V.M. and F.M.D.; investigation, A.H.d.S., U.S.d.O., L.A.O., P.H.N.d.C., M.T.d.A., T.S.P., C.C.G.J., S.C.V.M. and F.M.D.; writing—original draft preparation, A.H.d.S., A.A.C., J.D.C.R., S.C.V.M. and F.M.D.; writing—review and editing, A.H.d.S., J.D.C.R. and F.M.D.; visualization, A.H.d.S., U.S.d.O., L.A.O., P.H.N.d.C., M.T.d.A., T.S.P., C.C.G.J., J.D.C.R., S.C.V.M. and F.M.D.; supervision, A.A.C., S.C.V.M. and F.M.D.; project administration, F.M.D.; funding acquisition, J.D.C.R. and F.M.D. All authors have read and agreed to the published version of the manuscript.

Funding

FMD acknowledges research fellowships granted by the National Council for Scientific and Technological Development, Brazil (CNPq, Grant 305327/2019-4) and the Foundation for Research Assistance of Minas Gerais State, Brazil (FAPEMIG, Project CRA-RED-00053-16; APQ01512-18). We thank the scholarships that were granted by the Brazilian Federal Agency for the Support and Evaluation of Graduate Education (CAPES; Financial Code 001), the Foundation for Research Assistance of Minas Gerais State, Brazil (FAPEMIG) and CNPq. We are also thankful to the Fundação para a Ciência e a Tecnologia, Portugal, for funding support to JDCR through the research units UIDB/00239/2020 (CEF), UIDP/04035/2020 (GeoBioTec), and Laboratório Associado TERRA (LA/P/0092/2020).

Data Availability Statement

Not applicable.

Conflicts of Interest

The authors declare no conflict of interest.

Abbreviations

A, net CO2 assimilation rate; aCa, ambient atmospheric CO2 concentration; Ca, atmospheric CO2 concentration; Cc, chloroplastic CO2 concentration; Chl, chlorophyll; Ci, internal CO2 concentration; eCa, elevated CO2 concentration; ETR, electron transport rate; Fm, Fm, maximum fluorescence in dark- and light-adapted conditions, respectively; Fs, steady-state fluorescence; F0, minimum fluorescence; Fv/Fm, Fv′/Fm′, maximum and actual photochemical efficiency of photosystem II in dark- and light-adapted conditions, respectively; gm, mesophyll conductance to CO2; gs, stomatal conductance to water vapor; gwmax, maximum theoretical stomatal conductance to water vapor; HL, high light; Jmax, maximum rate of carboxylation that is limited by electron transport; LAR, leaf area ratio; lb, biochemical limitations; LL, low light; lm, mesophyll limitations; LMR, leaf mass ratio; ls, stomatal limitations; N, nitrogen; NSC, nonstructural carbohydrates; OMR, orthotropic branch mass ratio; OTC, open top chamber; PB, leaf N fraction allocated to bioenergetics; PL, leaf N fraction allocated to thylakoid light-harvesting components; PMR, plagiotropic branch mass ratio; PNUE, photosynthetic N-use efficiency; PNP, leaf N fraction allocated to non-photosynthetic tissues; PP, leaf N fraction allocated to the photosynthetic apparatus; PPFD, photosynthetic photon flux density; PR, leaf N fraction allocated to RuBisCO; PS, photosystem; Rl, daytime (light) respiration rate; RMR, root mass ratio; Rn; nocturnal respiration rate; RP, photorespiration rate; Rp/AG, photorespiration-to-gross photosynthesis ratio; RuBisCO, ribulose-1,5-bisphosphate carboxylase/oxygenase; RuBP, ribulose-1,5-bisphosphate; SD, stomatal density; SI, stomatal index; SS, stomatal size; TAA, total amino acids; Tair, air temperature; TB, total biomass; TLA, total leaf area; Vcmax, maximum apparent carboxylation capacity; VPD, vapor pressure deficit; ΦPSII, actual quantum yield of PSII non-cyclic electron transport.

Appendix A. Supplementary Data

Table A1. The proportion of explained variance by light and atmospheric [CO2] (Ca) factors and by the interaction between these factors (two-way ANOVA) of morphological, physiological, and biochemical traits of coffee plants grown under changing light and Ca supplies (F test: ns, not significant; * p < 0.05; ** p < 0.01; *** p < 0.001). See details for abbreviations in the abbreviation list.
ParametersFactors
LightCaLight x Ca Interaction
Gas exchange
A*********
gs*******
Cins***ns
E***nsns
Rp/AG******ns
Rn******
Gas exchange (light transition)
Ans*****
gsns******
ETR*********
ETR/A*********
Chlorophyll a fluorescence
Fv/Fmnsnsns
Fv′/Fm***nsns
ΦPSII***nsns
ETR*********
ETR/A******ns
NPQ*****ns
qp***nsns
A/Ci curves
gm***nsns
Vcmax****ns
Jmax****ns
ls***ns
lmnsnsns
lb**ns
Nitrogen, use efficiency and partitioning
Nm (g kg−1)*****ns
Na (g m−2)*******
PR*****ns
PB***nsns
PL***nsns
PP****ns
PNP****ns
PNUE*****ns
Metabolites
Chl a + b******ns
Chl/N*nsns
Strach***ns*
Glu***ns*
Fru***ns***
Sucns***ns
NSC***nsns
TAA******ns
Proteinsns***ns
Morphoanatomical traits
SD***nsns
SI***nsns
SSnsnsns
SPDnsnsns
gwmax*****ns
Growth attributes
TDM*********
TLA*********
SLA***nsns
LMRns****
SMRnsnsns
OMR**nsns
PMR****ns
RMRns***ns
LAR****ns
Table A2. The effect of light intensity [low (LL) or high (HL)] and CO2 supply [ambient (aCa) or elevated (eCa)] on photosynthetic traits of coffee plants: the maximum photochemical quantum efficiency (Fv/Fm), capture efficiency of excitation energy by open PSII reaction centers (Fv′/Fm′), actual PSII photochemical efficiency (ΦPSII), electron transport rate (ETR), ratio of electron transport rate-to-net carbon assimilation rate (ETR/A), nonphotochemical quenching coefficient (NPQ), and photochemical quenching coefficient (qp). Asterisk (*), when shown, indicates differences between light regimes within the same CO2 supply. Pound (#), when shown, indicates differences between CO2 treatments within the same light regime (p ≤ 0.05, F test, n = 6 ± SE).
ParametersLLHL
aCaeCaaCaeCa
Fv/Fm0.80 ± 0.0020.79 ± 0.0030.80 ± 0.0040.80 ± 0.004
Fv ′/Fm0.62 ± 0.0090.60 ± 0.0050.57 ± 0.008 *0.57 ± 0.004 *
ΦPSII0.46 ± 0.0030.47 ± 0.0040.18 ± 0.006 *0.20 ± 0.001 *
ETR (µmol e m−2 s−1)41.6 ± 0.342.6 ± 0.284.3 ± 2.8 *103.3 ± 2.9 #*
ETR/A (mol e mol−1 CO2)12.8 ± 0.66.2 ± 0.2 #13.9 ± 0.4 *7.9 ± 0.4 #*
NPQ1.52 ± 0.041.34 ± 0.04 #2.00 ± 0.05 *1.79 ± 0.08 #*
qp0.70 ± 0.0040.69 ± 0.0030.33 ± 0.012 *0.37 ± 0.012 #*

References

  1. Ainsworth, E.A.; Rogers, A. The response of photosynthesis and stomatal conductance to rising [CO2]: Mechanisms and environmental interactions. Plant Cell Environ. 2007, 30, 258–270. [Google Scholar] [CrossRef]
  2. Poorter, H.; Knopf, O.; Wright, I.J.; Temme, A.A.; Hogewoning, S.W.; Graf, A.; Cernusak, L.A.; Pons, T.L. A meta-analysis of responses of C3 plants to atmospheric CO2: Dose–response curves for 85 traits ranging from the molecular to the whole-plant level. New Phytol. 2022, 233, 1560–1596. [Google Scholar] [CrossRef]
  3. Ainsworth, E.A.; Long, S.P. 30 years of free-air carbon dioxide enrichment (FACE): What have we learned about future crop productivity and its potential for adaptation? Global Change Biol. 2021, 27, 27–49. [Google Scholar] [CrossRef] [PubMed]
  4. Leakey, A.D.B.; Ainsworth, E.A.; Bernacchi, C.J.; Rogers, A.; Long, S.P.; Ort, D.R. Elevated CO2 effects on plant carbon, nitrogen, and water relations: Six important lessons from FACE. J. Exp. Bot. 2009, 60, 2859–2876. [Google Scholar] [CrossRef] [PubMed]
  5. Martins, L.D.; Tomaz, M.A.; Lidon, F.C.; DaMatta, F.M.; Ramalho, J.C. Combined effects of elevated [CO2] and high temperature on leaf mineral balance in Coffea spp. plants. Clim. Change 2014, 126, 365–379. [Google Scholar] [CrossRef]
  6. Kitao, M.; Tobita, H.; Kitaoka, S.; Harayama, H.; Yazaki, K.; Komatsu, M.; Koike, T. Light energy partitioning under various environmental stresses combined with elevated CO2 in three deciduous broadleaf tree species in Japan. Climate 2019, 7, 79. [Google Scholar] [CrossRef] [Green Version]
  7. Birami, B.; Nägele, T.; Gattmann, M.; Preisler, Y.; Gast, A.; Arneth, A.; Ruehr, N.K. Hot drought reduces the effects of elevated CO2 on tree water use efficiency and carbon metabolism. New Phytol. 2020, 226, 1607–1621. [Google Scholar] [CrossRef] [Green Version]
  8. Bloom, A.J.; Asensio, J.S.R.; Randall, L.; Rachmilevitch, S.; Cousins, A.B.; Carlisle, E.A. CO2 enrichment inhibits shoot nitrate assimilation in C3 but not C4 plants and slows growth under nitrate in C3 plants. Ecology 2012, 93, 355–367. [Google Scholar] [CrossRef]
  9. Ainsworth, E.A.; Long, S.P. What have we learned from 15 years of free-air CO2 enrichment (FACE)? A meta-analytic review of the responses of photosynthesis, canopy properties and plant production to rising CO2. New Phytol. 2005, 165, 351–372. [Google Scholar] [CrossRef] [PubMed]
  10. DaMatta, F.M. Ecophysiological constraints on the production of shaded and unshaded coffee: A review. Field Crops Res. 2004, 86, 99–114. [Google Scholar] [CrossRef]
  11. DaMatta, F.M.; Rahn, E.; Läderach, P.; Ghini, R.; Ramalho, J.C. Why could the coffee crop endure climate change and global warming to a greater extent than previously estimated? Clim. Change 2019, 152, 167–178. [Google Scholar] [CrossRef] [Green Version]
  12. Martins, S.C.V.; Galmés, J.; Cavatte, P.C.; Pereira, L.F.; Ventrella, M.C.; DaMatta, F.M. Understanding the low photosynthetic rates of sun and shade coffee leaves: Bridging the gap on the relative roles of hydraulic, diffusive and biochemical constraints to photosynthesis. PLoS ONE 2014, 9, e95571. [Google Scholar] [CrossRef] [PubMed]
  13. DaMatta, F.M.; Avila, R.T.; Cardoso, A.A.; Martins, S.C.; Ramalho, J.C. Physiological and agronomic performance of the coffee crop in the context of climate change and global warming: A review. J. Agric. Food Chem. 2018, 66, 5264–5274. [Google Scholar] [CrossRef] [PubMed]
  14. Koutouleas, A.; Sarzynski, T.; Bertrand, B.; Bordeaux, M.; Bosselmann, A.S.; Campa, C.; Etienne, H.; Turreira-García, N.; Léran, S.; Markussen, B.; et al. Shade effects on yield across different Coffea arabica cultivars—How much is too much? A meta-analysis. Agron. Sustain. Dev. 2022, 42, 55. [Google Scholar] [CrossRef]
  15. Koutouleas, A.; Sarzynski, T.; Bordeaux, M.; Bosselmann, A.S.; Campa, C.; Etienne, H.; Turreira-García, N.; Rigal, C.; Vaast, P.; Ramalho, J.C.; et al. Shaded-coffee: A nature-based strategy for coffee production under climate change? A review. Front. Sustain. Food Syst. 2022, 6, 877476. [Google Scholar] [CrossRef]
  16. Bunn, C.; Läderach, P.; Ovalle Rivera, O.; Kirschke, D. A bitter cup: Climate change profile of global production of Arabica and Robusta coffee. Clim. Change 2015, 129, 89–101. [Google Scholar] [CrossRef] [Green Version]
  17. Moat, J.; Williams, J.; Baena, S.; Wilkinson, T.; Gole, T.W.; Challa, Z.K.; Demissew, S.; Davis, A.P. Resilience potential of the Ethiopian coffee sector under climate change. Nat. Plants 2017, 3, 17081. [Google Scholar] [CrossRef]
  18. Gomes, L.C.; Bianchi, F.J.J.A.; Cardoso, I.M.; Fernandes, R.B.A.; Fernandes Filho, E.I.; Schulte, R.P.O. Agroforestry systems can mitigate the impacts of climate change on coffee production: A spatially explicit assessment in Brazil. Agric. Ecosyst. Environ. 2020, 294, 106858. [Google Scholar] [CrossRef]
  19. Martins, M.Q.; Rodrigues, W.P.; Fortunato, A.S.; Leitão, A.E.; Rodrigues, A.P.; Pais, I.P.; Martins, L.D.; Silva, M.J.; Reboredo, F.H.; Partelli, F.L.; et al. Protective response mechanisms to heat stress in interaction with high [CO2] conditions in Coffea spp. Front. Plant Sci. 2016, 7, 947. [Google Scholar] [CrossRef] [Green Version]
  20. Rodrigues, W.P.; Martins, M.Q.; Fortunato, A.S.; Rodrigues, A.P.; Semedo, J.N.; Simões-Costa, M.C.; Pais, I.P.; Leitão, A.E.; Colwell, F.; Goulao, L.; et al. Long-term elevated air [CO2] strengthens photosynthetic functioning and mitigates the impact of supraoptimal temperatures in tropical Coffea arabica and C. canephora species. Global Change Biol. 2016, 22, 415–431. [Google Scholar] [CrossRef]
  21. Scotti-Campos, P.; Pais, I.P.; Ribeiro-Barros, A.I.; Martins, L.D.; Tomaz, M.A.; Rodrigues, W.P.; Campostrini, E.; Semedo, J.N.; Fortunato, A.S.; Martins, M.Q.; et al. Lipid profile adjustments may contribute to warming acclimation and to heat impact mitigation by elevated [CO2] in Coffea spp. Environ. Exp. Bot. 2019, 167, 103856. [Google Scholar] [CrossRef]
  22. Ávila, R.T.; Almeida, W.L.; Costa, L.C.; Machado, K.L.; Barbosa, M.L.; de Souza, R.P.; Martino, P.B.; Juárez, M.A.T.; Marçal, D.M.S.; Martins, S.C.V.; et al. Elevated air [CO2] improves photosynthetic performance and alters biomass accumulation and partitioning in drought-stressed coffee plants. Environ. Exp. Bot. 2020, 177, 104137. [Google Scholar] [CrossRef]
  23. Ávila, R.T.; Martins, S.C.; Sanglard, L.M.; Dos Santos, M.S.; Menezes-Silva, P.E.; Detman, K.C.; Sanglard, M.L.; Cardoso, A.A.; Morais, L.E.; Vital, C.E.; et al. Starch accumulation does not lead to feedback photosynthetic downregulation in girdled coffee branches under varying source-to-sink ratios. Trees 2020, 34, 1–16. [Google Scholar] [CrossRef]
  24. Catarino, I.A.C.; Monteiro, G.B.; Ferreira, M.J.; Torres, L.M.B.; Domingues, D.S.; Centeno, D.C.; Lobo, A.K.M.; Silva, E.A. Elevated [CO2] mitigates drought effects and increases leaf 5-o-caffeoylquinic acid and caffeine concentrations during the early growth of Coffea arabica plants. Front. Sustain. Food Syst. 2021, 5, 676207. [Google Scholar] [CrossRef]
  25. Rodrigues, A.M.; Jorge, T.; Osorio, S.; Pott, D.M.; Lidon, F.C.; DaMatta, F.M.; Marques, I.; Ribeiro-Barros, A.I.; Ramalho, J.C.; António, C. Primary metabolite profile changes in Coffea spp. promoted by single and combined exposure to drought and elevated CO2 concentration. Metabolites 2021, 11, 427. [Google Scholar] [CrossRef] [PubMed]
  26. Semedo, J.N.; Rodrigues, A.P.; Lidon, F.C.; Pais, I.P.; Marques, I.; Gouveia, D.; Armengaud, J.; Silva, M.J.; Martins, S.; Semedo, M.C.; et al. Intrinsic non-stomatal resilience to drought of the photosynthetic apparatus in Coffea spp. is strengthened by elevated air [CO2]. Tree Physiol. 2021, 41, 708–727. [Google Scholar] [CrossRef]
  27. Marques, I.; Rodrigues, A.P.; Gouveia, D.; Lidon, F.C.; Martins, S.; Semedo, M.C.; Gaillard, J.C.; Pais, I.P.; Semedo, J.N.; Scotti-Campos, P.; et al. High-resolution shotgun proteomics reveals that increased air [CO2] amplifies the acclimation response of Coffea species to drought regarding antioxidative, energy, sugar, and lipid dynamics. J. Plant Physiol. 2022, 276, 153788. [Google Scholar] [CrossRef] [PubMed]
  28. Ramalho, J.C.; Rodrigues, A.P.; Semedo, J.N.; Pais, I.P.; Martins, L.D.; Simões-Costa, M.C.; Leitão, A.E.; Fortunato, A.S.; Batista-Santos, P.; Palos, I.M.; et al. Sustained photosynthetic performance of Coffea spp. under long-term enhanced [CO2]. PLoS ONE 2013, 8, e82712. [Google Scholar] [CrossRef] [Green Version]
  29. Ghini, R.; Torre-Neto, A.; Dentzien, A.F.M.; Guerreiro-Filho, O.; Iost, R.; Patrício, F.R.A.; Prado, J.S.M.; Thomaziello, R.A.; Bettiol, W.; DaMatta, F.M. Coffee growth, pest and yield responses to free-air CO2 enrichment. Clim. Change 2015, 132, 307–320. [Google Scholar] [CrossRef]
  30. DaMatta, F.M.; Godoy, A.G.; Menezes-Silva, P.E.; Martins, S.C.V.; Sanglard, L.M.V.P.; Morais, L.E.; Torre-Neto, A.; Ghini, R. Sustained enhancement of photosynthesis in coffee trees grown under free-air CO2 enrichment conditions: Disentangling the contributions of stomatal, mesophyll, and biochemical limitations. J. Exp. Bot. 2016, 67, 341–352. [Google Scholar] [CrossRef] [Green Version]
  31. Rakočević, M.; Ribeiro, R.V.; Marchiori, P.E.R.; Filizola, H.F.; Batista, E.R. Structural and functional changes in coffee trees after 4 years under free air CO2 enrichment. Ann. Bot. 2018, 21, 1065–1078. [Google Scholar] [CrossRef] [PubMed]
  32. Engineer, C.B.; Hashimoto-Sugimoto, M.; Negi, J.; Israelsson-Nordström, M.; Azoulay-Shemer, T.; Rappel, W.J.; Iba, K.; Schroeder, J.I. CO2 sensing and CO2 regulation of stomatal conductance: Advances and open questions. Trends Plant Sci. 2016, 21, 16–30. [Google Scholar] [CrossRef] [PubMed] [Green Version]
  33. Marçal, D.M.; Avila, R.T.; Quiroga-Rojas, L.F.; de Souza, R.P.; Junior, C.C.G.; Ponte, L.R.; Barbosa, M.L.; Oliveira, L.A.; Martins, S.C.V.; Ramalho, J.D.C.; et al. Elevated [CO2] benefits coffee growth and photosynthetic performance regardless of light availability. Plant Physiol. Biochem. 2021, 158, 524–535. [Google Scholar] [CrossRef] [PubMed]
  34. Cavatte, P.C.; Oliveira, A.A.G.; Morais, L.E.; Martins, S.C.V.; Sanglard, L.M.V.P.; DaMatta, F.M. Could shading reduce the negative impacts of drought on coffee? A morphophysiological analysis. Physiol. Plant. 2012, 144, 11–22. [Google Scholar] [CrossRef]
  35. Rodríguez-López, N.F.; Martins, S.C.; Cavatte, P.C.; Silva, P.E.; Morais, L.E.; Pereira, L.F.; Reis, J.V.; Ávila, R.T.; Godoy, A.G.; Lavinski, A.O.; et al. Morphological and physiological acclimations of coffee seedlings to growth over a range of fixed or changing light supplies. Environ. Exp. Bot. 2014, 102, 1–10. [Google Scholar] [CrossRef]
  36. Franks, P.J.; Farquhar, G.D. The mechanical diversity of stomata and its significance in gas exchange control. Plant Physiol. 2007, 143, 78–87. [Google Scholar] [CrossRef] [PubMed] [Green Version]
  37. Purcell, C.; Batke, S.P.; Yiotis, C.; Caballero, R.; Soh, W.K.; Murray, M.; McElwain, J.C. Increasing stomatal conductance in response to rising atmospheric CO2. Ann. Bot. 2018, 121, 1137–1149. [Google Scholar] [CrossRef] [PubMed] [Green Version]
  38. Long, S.P.; Taylor, S.H.; Burgess, S.J.; Carmo-Silva, E.; Lawson, T.; Souza, A.P.; Leonelli, L.; Wang, Y. Into the shadows and back into sunlight: Photosynthesis in fluctuating light. Annu. Rev. Plant Biol. 2022, 73, 617–648. [Google Scholar] [CrossRef] [PubMed]
  39. Matos, F.S.; Wolfgramm, R.; Gonçalves, F.V.; Cavatte, P.C.; Ventrella, M.C.; DaMatta, F.M. Phenotypic plasticity in response to light in the coffee tree. Environ. Exp. Bot. 2009, 67, 421–427. [Google Scholar] [CrossRef]
  40. Long, S.P.; Bernacchi, C.J. Gas exchange measurements, what can they tell us about the underlying limitations to photosynthesis? Procedures and sources of error. J. Exp. Bot. 2003, 54, 2393–2401. [Google Scholar] [CrossRef] [Green Version]
  41. Evans, J.R.; Clarke, V.C. The nitrogen cost of photosynthesis. J. Exp. Bot. 2019, 70, 7–15. [Google Scholar] [CrossRef] [PubMed]
  42. Gómez-Vera, P.; Blanco-Flores, H.; Francisco, A.M.; Castillo, J.; Tezara, W. Silicon dioxide nanofertilizers improve photosynthetic capacity of two Criollo cocoa clones (Theobroma cacao L.). Exp. Agric. 2021, 57, 85–102. [Google Scholar] [CrossRef]
  43. Lei, Z.Y.; Wang, H.; Wright, I.J.; Zhu, X.G.; Niinemets, Ü.; Li, Z.L.; Sun, D.S.; Dong, N.; Zhang, W.F.; Zhou, Z.L.; et al. Enhanced photosynthetic nitrogen use efficiency and increased nitrogen allocation to photosynthetic machinery under cotton domestication. Photosynth. Res. 2021, 150, 239–250. [Google Scholar] [CrossRef] [PubMed]
  44. Huang, L.Y.; Xiao, L.X.; Zhang, Y.B.; Fahad, S.; Wang, F. dep1 improves rice grain yield and nitrogen use efficiency simultaneously by enhancing nitrogen and dry matter translocation. J. Integr. Agric. 2022, 21, 3185–3198. [Google Scholar] [CrossRef]
  45. Onoda, Y.; Wright, I.J.; Evans, J.R.; Hikosaka, K.; Kitajima, K.; Niinemets, Ü.; Poorter, H.; Tosens, T.; Westoby, M. Physiological and structural tradeoffs underlying the leaf economics spectrum. New Phytol. 2017, 214, 1447–1463. [Google Scholar] [CrossRef] [Green Version]
  46. Yin, L.; Xu, H.; Dong, S.; Chu, J.; Dai, X.; He, M. Optimized nitrogen allocation favors improvement in canopy photosynthetic nitrogen-use efficiency: Evidence from late-sown winter wheat. Environ. Exp. Bot. 2019, 159, 75–86. [Google Scholar] [CrossRef]
  47. Kanno, K.; Suzuki, Y.; Makino, A. A small decrease in Rubisco content by individual suppression of RBCS genes leads to improvement of photosynthesis and greater biomass production in rice under conditions of elevated CO2. Plant Cell Physiol. 2017, 58, 635–642. [Google Scholar] [CrossRef] [Green Version]
  48. Poorter, H.; Nagel, O. The role of biomass allocation in the growth response of plants to different levels of light, CO2, nutrients and water: A quantitative review. Funct. Plant Biol. 2000, 27, 1191. [Google Scholar] [CrossRef] [Green Version]
  49. Apgaua, D.M.; Tng, D.Y.; Forbes, S.J.; Ishida, Y.F.; Vogado, N.O.; Cernusak, L.A.; Laurance, S.G. Elevated temperature and CO2 cause differential growth stimulation and drought survival responses in eucalypt species from contrasting habitats. Tree Physiol. 2019, 39, 1806–1820. [Google Scholar] [CrossRef]
  50. Dawson, W.; Rohr, R.P.; van Kleunen, M.; Fischer, M. Alien plant species with a wider global distribution are better able to capitalize on increased resource availability. New Phytol. 2012, 194, 859–867. [Google Scholar] [CrossRef] [Green Version]
  51. Poorter, H.; Lambers, H.; Evans, J.R. Trait correlation networks: A whole-plant perspective on the recently criticized leaf economic spectrum. New Phytol. 2013, 201, 378–382. [Google Scholar] [CrossRef]
  52. Hoagland, D.R.; Arnon, D.I. The water culture method for growing plants without soil. Circ. Calif. Agric. Exp. Stn. 1950, 347, 1–39. [Google Scholar]
  53. Rodeghiero, M.; Niinemets, U.; Cescatti, A. Major diffusion leaks of clampon leaf cuvettes still unaccounted: How erroneous are the estimates of Farquhar et al. model parameters? Plant Cell Environ. 2007, 30, 1006–1022. [Google Scholar] [CrossRef] [PubMed]
  54. Niinemets, U.; Cescatti, A.; Rodeghiero, M.; Tosens, T. Complex adjustments of photosynthetic potentials and internal diffusion conductance to current and previous light availabilities and leaf age in Mediterranean evergreen species Quercus ilex. Plant Cell Environ. 2006, 29, 1159–1178. [Google Scholar] [CrossRef] [PubMed] [Green Version]
  55. Sharkey, T.D.; Bernacchi, C.J.; Farquhar, G.D.; Singsaas, E.L. Fitting photosynthetic carbon dioxide response curves for C3 leaves. Plant Cell Environ. 2007, 30, 1035–1040. [Google Scholar] [CrossRef]
  56. Valentini, R.; Epron, D.; Deangelis, P.; Matteucci, G.; Dreyer, E. In-Situ estimation of net CO2 assimilation, photosynthetic electron flow and photorespiration in Turkey Oak (Q. cerris L.) leaves-diurnal cycles under different levels of water-supply. Plant Cell Environ. 1995, 18, 631–640. [Google Scholar] [CrossRef]
  57. Harley, P.C.; Loreto, F.; Di Marco, G.; Sharkey, T.D. Theoretical considerations when estimating the mesophyll conductance to CO2 flux by analysis of the response of photosynthesis to CO2. Plant Physiol. 1992, 98, 1429–1436. [Google Scholar] [CrossRef] [Green Version]
  58. Martins, S.C.V.; Galmés, J.; Molins, A.; DaMatta, F.M. Improving the estimation of mesophyll conductance to CO2: On the role of electron transport rate correction and respiration. J. Exp. Bot. 2013, 64, 3285–3298. [Google Scholar] [CrossRef] [Green Version]
  59. Farquhar, G.D.; von Caemmerer, S.; Berry, J.A. A biochemical model of photosynthetic CO2 assimilation in leaves of C3 species. Planta 1980, 149, 78–90. [Google Scholar] [CrossRef] [Green Version]
  60. Bernacchi, C.J.; Portis, A.R.; Nakano, H.; Von Caemmerer, S.; Long, S.P. Temperature response of mesophyll conductance. Implications for the determination of Rubisco enzyme kinetics and for limitations to photosynthesis in vivo. Plant Physiol. 2012, 130, 1992–1998. [Google Scholar] [CrossRef] [Green Version]
  61. Grassi, G.; Magnani, F. Stomatal, mesophyll conductance and biochemical limitations to photosynthesis as affected by drought and leaf ontogeny in ash and oak trees. Plant Cell Environ. 2005, 28, 834–849. [Google Scholar] [CrossRef]
  62. Matos, E.S.; Mendonça, E.S. Nitrogênio total, amônio e nitrato. In Matéria Orgânica do Solo: Métodos de Análises; Mendonça, E.S., Matos, E.S., Eds.; Ed. UFV: Viçosa, Brasil, 2017; Volume 221, pp. 61–69. [Google Scholar]
  63. Niinemets, Ü.; Tenhunen, J.D. A model separating leaf structural and physiological effects on carbon gain along light gradients for the shade-tolerant species Acer saccharum. Plant Cell Environ. 1997, 20, 845–866. [Google Scholar] [CrossRef]
  64. Praxedes, S.C.; DaMatta, F.M.; Loureiro, M.E.; Ferrão, M.A.G.; Cordeiro, A.T. Effects of long-term soil drought on photosynthesis and carbohydrate metabolism in mature robusta coffee (Coffea canephora Pierre var. kouillou) leaves. Environ. Exp. Bot. 2006, 56, 263–273. [Google Scholar] [CrossRef]
  65. Ronchi, C.P.; DaMatta, F.M.; Batista, K.D.; Moraes, G.A.B.K.; Loureiro, M.E.; Ducatti, C. Growth and photosynthetic down-regulation in Coffea arabica in response to restricted root volume. Funct. Plant Biol. 2006, 33, 1013–1023. [Google Scholar] [CrossRef]
  66. Wellburn, A.R. The spectral determination of chlorophylls a and b, as well as total carotenoids, using various solvents with spectrophotometers of different resolution. J. Plant Physiol. 1994, 144, 307–313. [Google Scholar] [CrossRef]
  67. Andrade, M.T.; Oliveira, L.A.; Pereira, T.S.; Cardoso, A.A.; Batista-Silva, W.; DaMatta, F.M.; Zsögön, A.; Martins, S.C.V. Impaired auxin signaling increases vein and stomatal density but reduces hydraulic efficiency and ultimately net photosynthesis. J. Exp. Bot. 2022, 558, 531–539. [Google Scholar] [CrossRef]
  68. Franks, P.J.; Beerling, D.J. Maximum leaf conductance driven by CO2 effects on stomatal size and density over geologic time. Proc. Natl. Acad. Sci. USA 2009, 106, 10343–10347. [Google Scholar] [CrossRef] [Green Version]
  69. Ferreira, D.F. SISVAR: Um sistema computacional de análise estatística. Cienc. Agrotecnol. 2011, 35, 1039–1042. [Google Scholar] [CrossRef] [Green Version]
Figure 1. The effect of light intensity [low (grey area) or high (white area) light] and CO2 supply [ambient (aCa) or elevated (eCa) supply] on (A) net carbon assimilation rate (A), (B) stomatal conductance (gs), (C) internal CO2 concentration (Ci), (D) transpiration rate (E), (E) photorespiration-to-gross photosynthetic rate ratio (Rp/AG), and (F) nocturnal respiration (Rn). Asterisk (*), when shown, indicates differences between light regimes within the same CO2 supply. Pound (#), when shown, indicates differences between CO2 treatments within the same light regime (p ≤ 0.05, F test, n = 6 ± SE).
Plants 12 01479 g001
Figure 2. The effect of light transitions (grey area: plants grown at low light but evaluated at high light, 1000 µmol photons m−2 s−1; white area: plants grown at high light but evaluated at low light, 200 µmol photons m−2 s−1) and CO2 supply [ambient (aCa) or elevated (eCa) supply] on the (A) net carbon assimilation rate (A), (B) stomatal conductance (gs), (C) electron transport rate (ETR), and (D) ETR/A ratio. Asterisk (*), when shown, indicates differences between light regimes within the same CO2 supply. Pound (#), when shown, indicates differences between CO2 treatments within the same light regime (p ≤ 0.05, F test, n = 6 ± SE).
Plants 12 01479 g002
Figure 3. The effect of light intensity [low (grey area) or high (white area) light] and CO2 supply [ambient (aCa) or elevated (eCa) supply] on photosynthetic traits of coffee plants: (A) mesophyll conductance to CO2 (gm), (B) maximum apparent carboxylation capacity (Vcmax), and (C) maximum rate of carboxylation limited by electron transport (Jmax), both on a chloroplast [CO2] basis, and the functional components of the overall limitations to photosynthesis [(D) stomatal (ls), (E) mesophyll (lm), and (F) biochemical (lb) limitations]. Asterisk (*), when shown, indicates differences between light regimes within the same CO2 supply. Pound (#), when shown, indicates differences between CO2 treatments within the same light regime (p ≤ 0.05, F test, n = 6 ± SE).
Plants 12 01479 g003
Table 1. The effect of light intensity [low (LL) or high (HL) light] and CO2 supply [ambient (aCa) or elevated (eCa)] on nitrogen traits of coffee plants: foliar N on a per mass (Nm) and area (Na) basis, the leaf N fractions that were allocated into the major photosynthetic components [(RuBisCO (PR), bioenergetics (PB), and thylakoid light-harvesting components (PL)], the N fraction that was allocated into the photosynthetic machinery (PP), and the fraction of N that was partitioned into non-photosynthetic components (PNP). The photosynthetic N-use efficiency is also shown. Asterisk (*), when shown, indicates differences between light regimes within the same CO2 supply. Pound (#), when shown, indicates differences between CO2 treatments within the same light regime (p ≤ 0.05, F test, n = 6 ± SE).
ParametersLLHL
aCaeCaaCaeCa
Nm (g kg−1)30.6 ± 0.0132.8 ± 0.132.6 ± 0.137.9 ± 0.1 #*
Na (g m−2)1.56 ± 0.041.65 ± 0.081.73 ± 0.082. 16 ± 0.08 #*
PR0.26 ± 0.000.29 ± 0.02 #0.22 ± 0.01 *0.23 ± 0.01 *
PB0.036 ± 0.0030.037 ± 0.0020.026 ± 0.001 *0.032 ± 0.001 #*
PL0.18 ± 0.000.19 ± 0.010.16 ± 0.010.15 ± 0.01 *
PP0.47 ± 0.010.52 ± 0.02 #0.41 ± 0.02 *0.42 ± 0.02 *
PNP0.52 ± 0.010.48 ± 0.01 #0.59 ± 0.02 *0.58 ± 0.02 *
PNUE (µmol CO2 g−1 N)2.85 ± 0.126.08 ± 0.27 #3.81 ± 0.15 *6.41 ± 0.34 #
Table 2. The effect of light intensity [low (LL) or high (HL) light] and CO2 supply [ambient (aCa) or elevated (eCa)] on foliar pigments and metabolites (on a dry weight basis) of coffee plants: total chlorophylls (Chl a + b), starch, glucose, fructose, sucrose, nonstructural carbohydrates (NSC), total amino acids (TAA), and proteins. The Chl/N ratio is also presented. When shown, asterisk (*) indicates differences between light regimes within the same CO2 supply, whereas hash (#) indicates differences between CO2 treatments within the same light regime (p ≤ 0.05, t test, n = 6 ± SE).
ParametersLLHL
aCaeCaaCaeCa
Chl a + b (mg g−1)7.8 ± 0.36.9 ± 0.36.4 ± 0.9 *4.5 ± 0.2 #*
Chl/N (mmol mol−1)2.5 ± 0.12.1 ± 0.1 #2.0 ± 0.21.2 ± 0.1 #*
Strach (µmol eq. glucose g−1)568 ± 9571 ± 10684 ± 28 *641 ± 10 #*
Glucose (µmol g−1)24.9 ± 1.223.9 ± 0.628.8 ± 3.5 *34.7 ± 1.5 #*
Fructose (µmol g−1)29.6 ± 0.626.3 ± 0.6 #33.5 ± 1.6 *35.9 ± 0.5 #*
Sucrose (µmol g−1)64.9 ± 1.975.3 ± 2.1 #63.3 ± 1.979.5 ± 1.8 #
NSC687 ± 11696 ± 12810 ± 11 *791 ± 9 *
TAA (µmol g−1)11.3 ± 1.520.3 ± 0.9 #18.7 ± 3.29 *29.6 ± 1.2 #*
Proteins (mg g−1)95 ± 5114 ± 4 #100 ± 12121 ± 4 #
Table 3. The effect of light intensity [low (LL) or high (HL) light] and CO2 supply [ambient (aCa) or elevated (eCa)] on stomatal density (SD), stomatal index (SI), stomatal size (SS), and maximum (theoretical) stomatal conductance to water vapor (gwmax) of coffee plants. When shown, asterisk (*) indicates differences between light regimes within the same CO2 supply, whereas hash (#) indicates differences between CO2 treatments within the same light regime (p ≤ 0.05, t test, n = 6 ± SE).
ParametersLLHL
aCaeCaaCaeCa
SD (mm−2)83 ± 687 ± 5167 ± 10 *186 ± 6 *
SI (%)15.5 ± 0.416.0 ± 0.318.8 ± 0.5 *20.1 ± 0.7 *
SS (µm2)172 ± 11164 ± 12161 ± 13193 ± 9
gwmax (mol m−2 s−1)0.68 ± 0.050.70 ± 0.051.32 ± 0.08 *1.61 ± 0.02 #*
Table 4. The effect of light intensity [low (LL) or high (HL)] and CO2 supply [ambient (aCa) or elevated (eCa)] on growth traits of coffee plants: height, total biomass (TB), height, total leaf area (TLA), leaf mass ratio (LMR), stem mass ratio (SMR), orthotropic branch mass ratio (OMR), plagiotropic branch mass ratio (PMR), root mass ratio (RMR), and leaf area ratio (LAR). When shown, asterisk (*) indicates differences between light regimes within the same CO2 supply, whereas hash (#) indicates differences between CO2 treatments within the same light regime (p ≤ 0.05, t test, n = 6 ± SE).
ParametersLLHL
aCaeCaaCaeCa
TB (g)25.3 ± 1.138.7 ± 1.3 #119 ± 7.7 *240 ± 7.4 #*
Height (cm)44 ± 2.155 ± 1.0 #84 ± 3.6 *103 ± 0.7 #*
TLA (m2)0.26 ± 0.010.37 ± 0.01 #0.78 ± 0.05 *1.26 ± 0.04 #*
LMR0.61 ± 0.020.55 ± 0.01 #0.65 ± 0.020.52 ± 0.02 #
SMR0.27 ± 0.020.27 ± 0.010.24 ± 0.010.26 ± 0.01
OMR0.21 ± 0.010.21 ± 0.010.17 ± 0.01 *0.18 ± 0.01
PMR0.056 ± 0.0040.068 ± 0.005 #0.070 ± 0.039 *0.082 ± 0.003 #*
RMR0.12 ± 0.010.18 ± 0.02 #0.11 ± 0.010.22 ± 0.02 #
LAR (m2 kg−1)10.5 ± 0.89.5 ± 0.46.4 ± 0.2 *5.3 ± 0.3 *
Disclaimer/Publisher’s Note: The statements, opinions and data contained in all publications are solely those of the individual author(s) and contributor(s) and not of MDPI and/or the editor(s). MDPI and/or the editor(s) disclaim responsibility for any injury to people or property resulting from any ideas, methods, instructions or products referred to in the content.

