
Functional Groups Response to Water Deficit in Mediterranean Ecosystems


Abstract
:1. Introduction
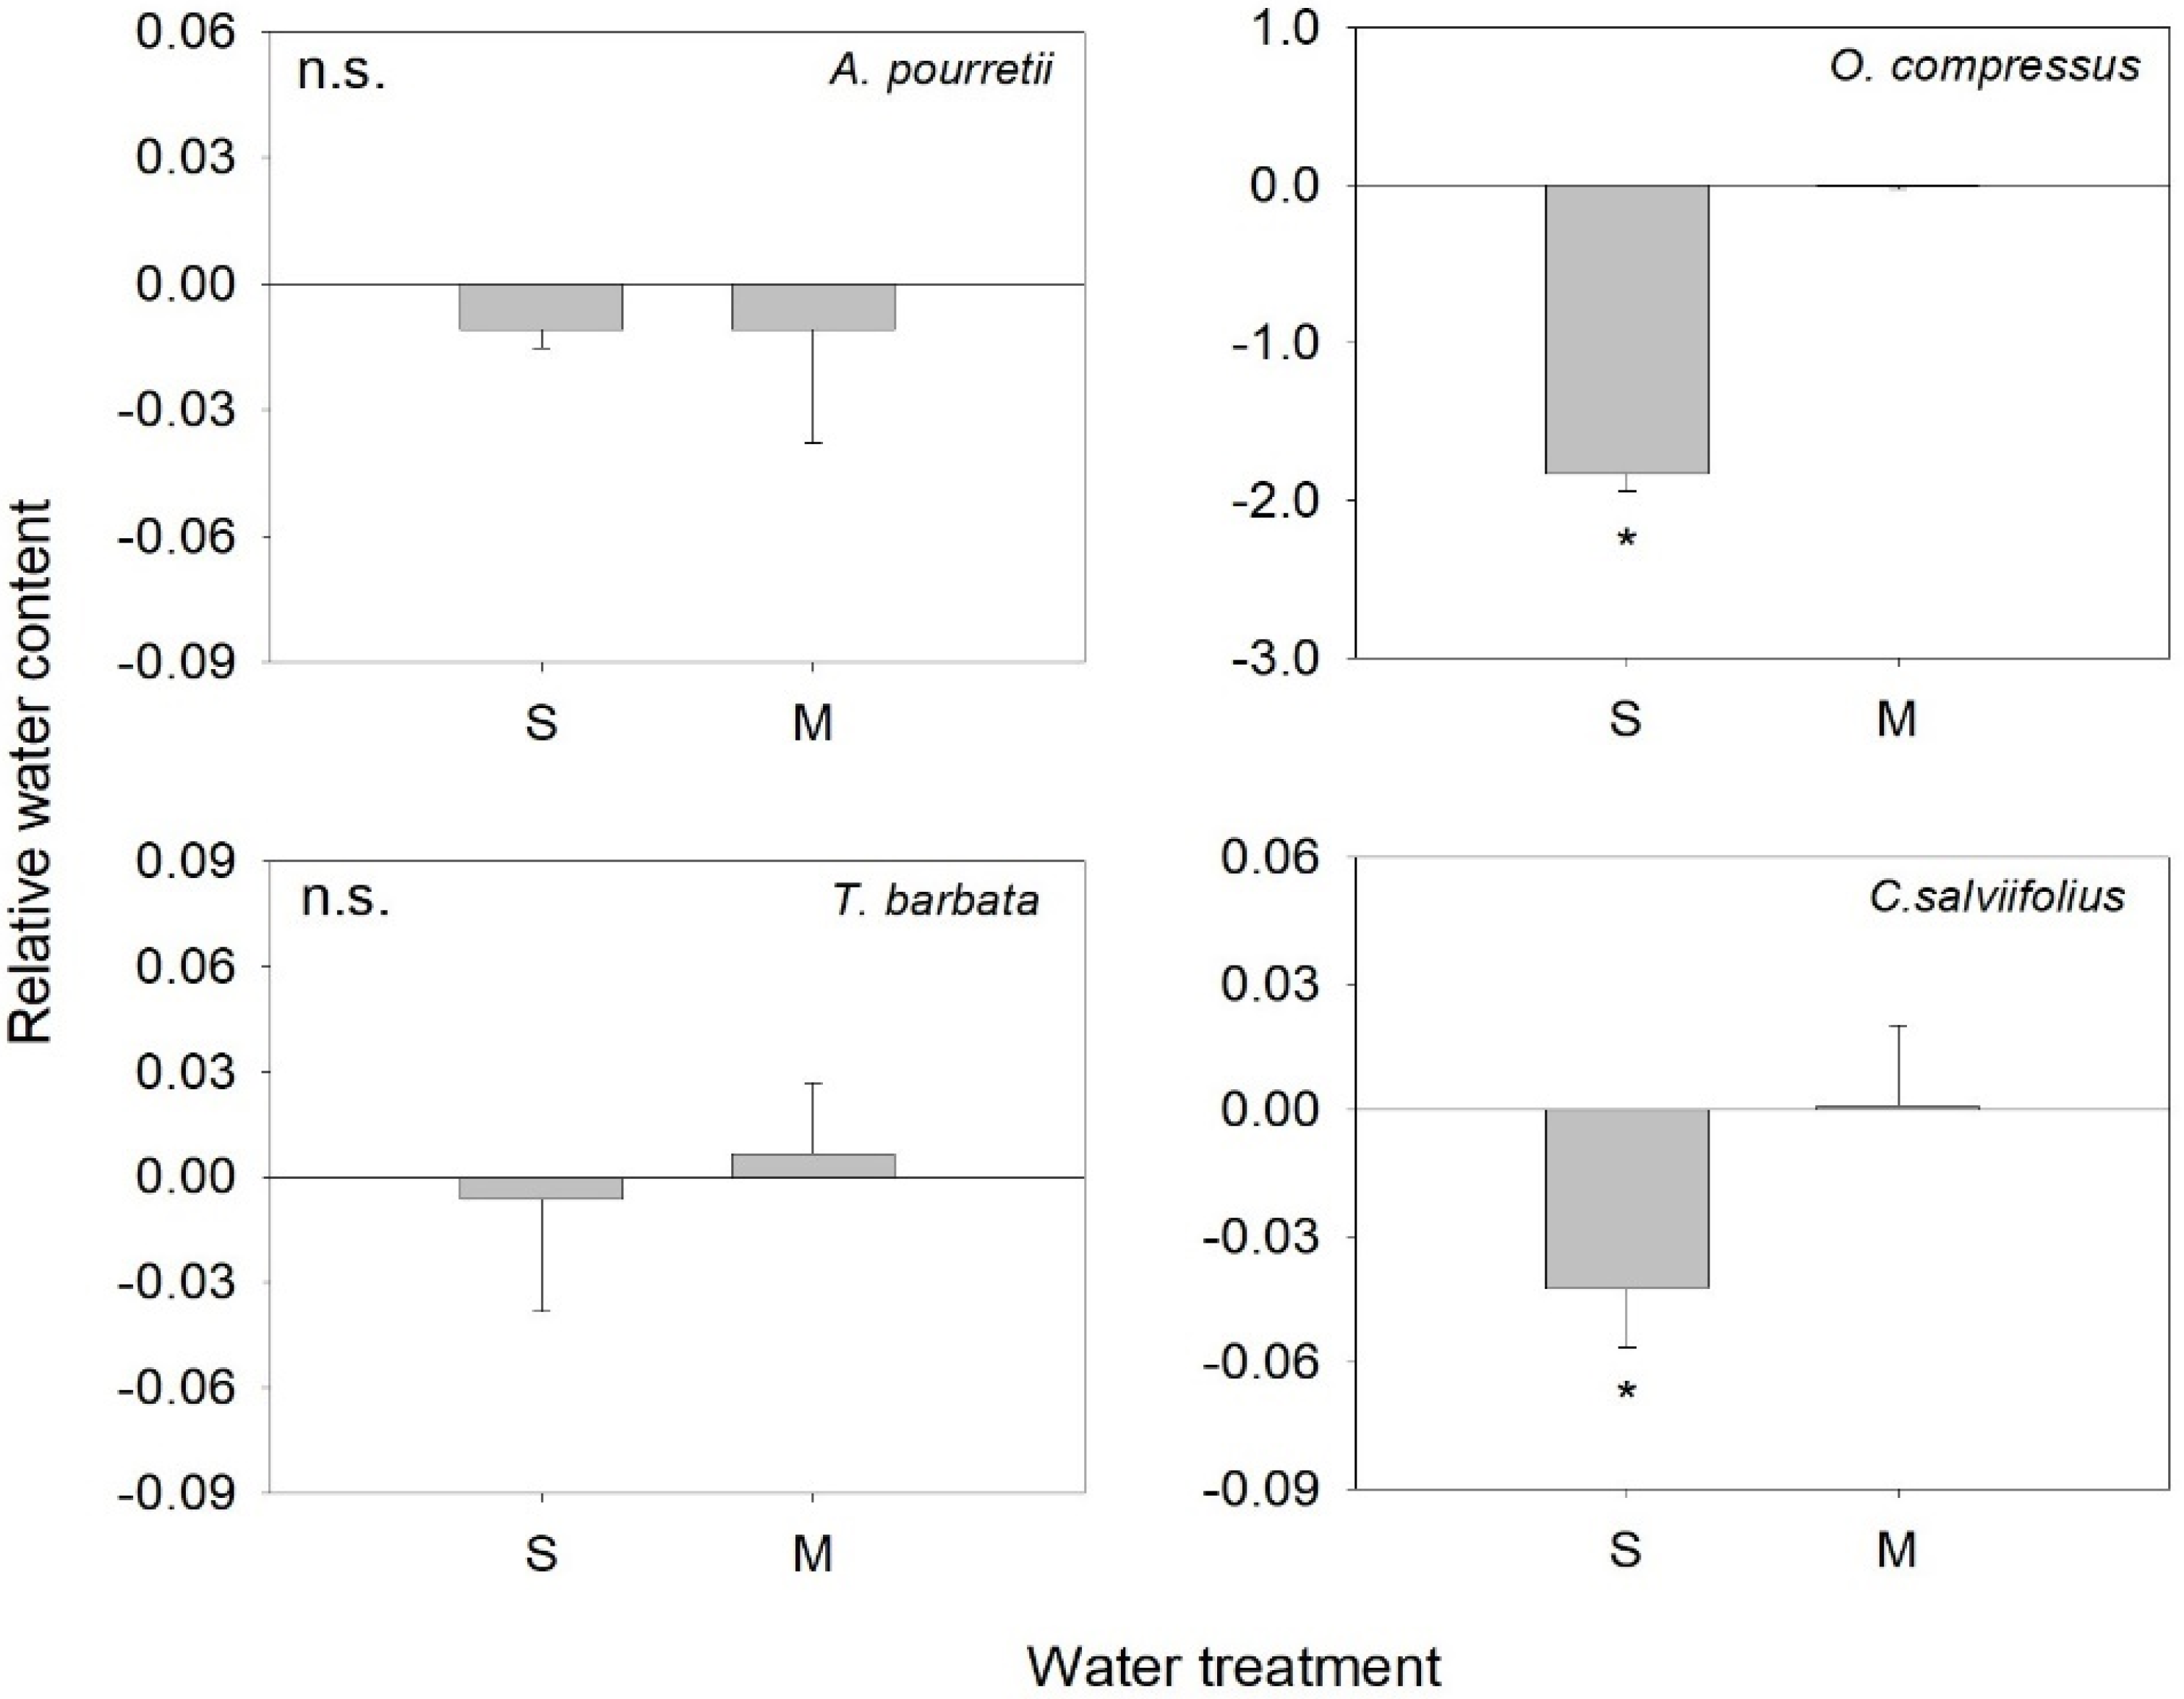
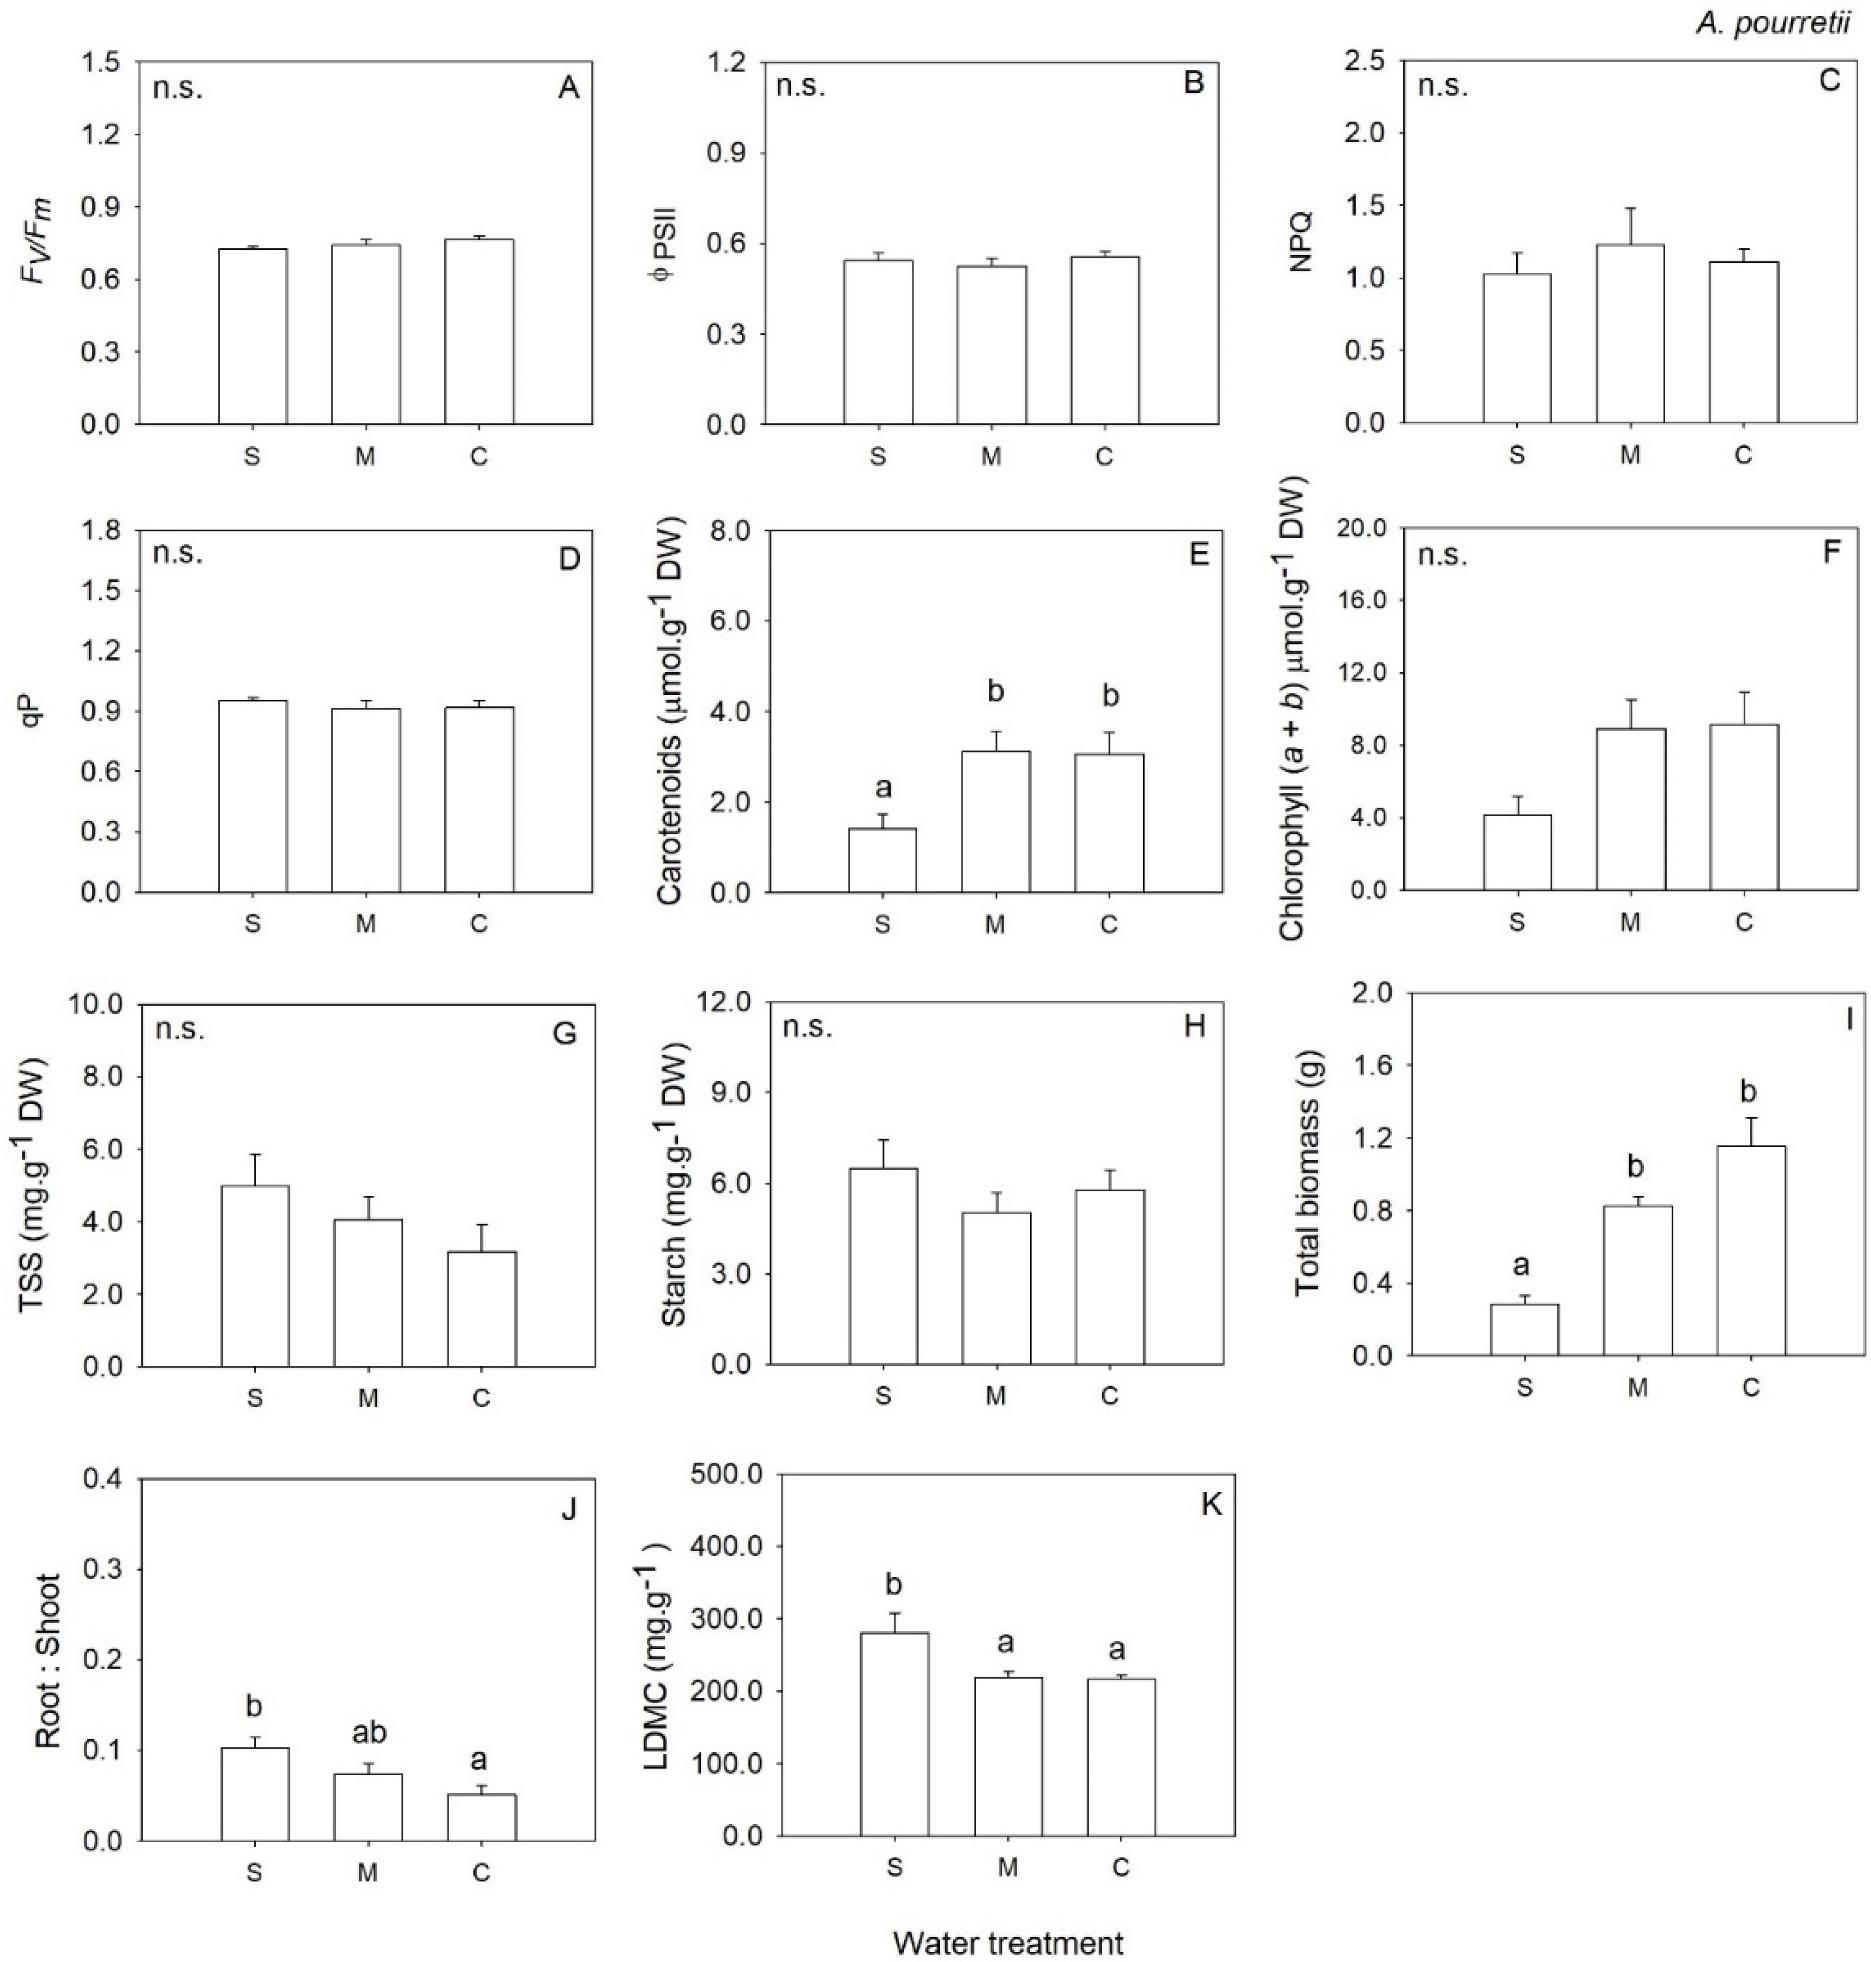
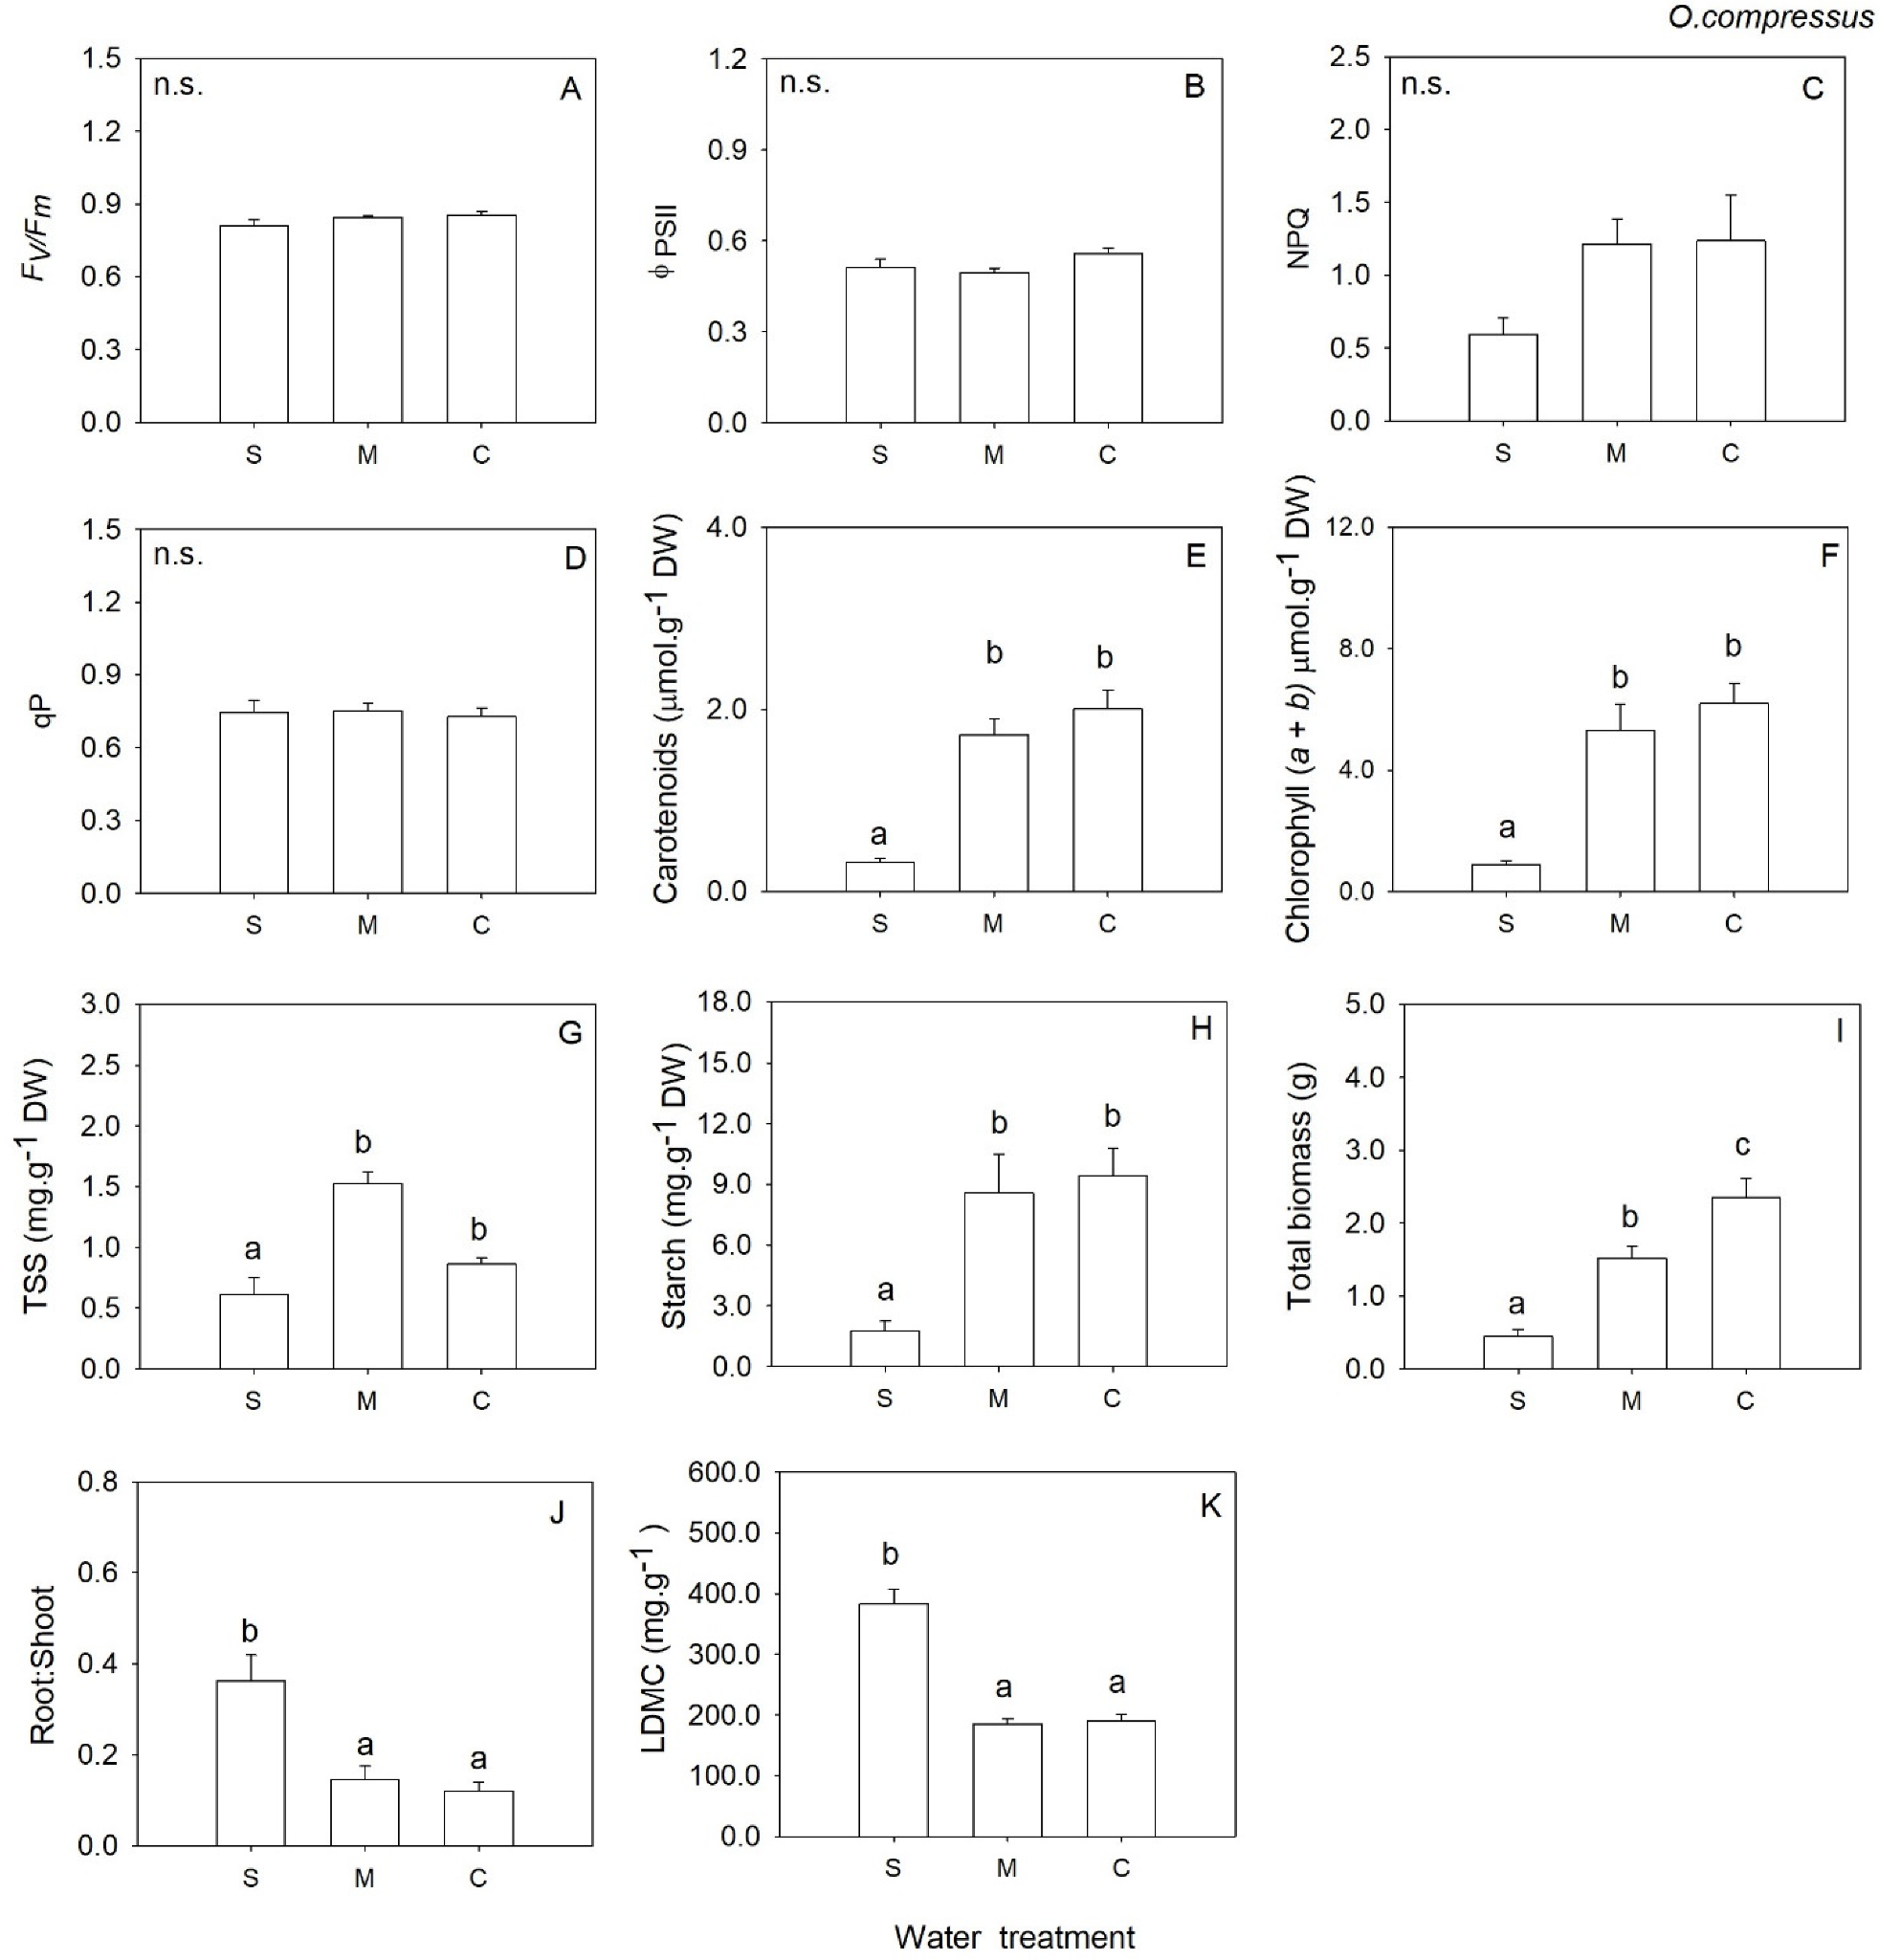
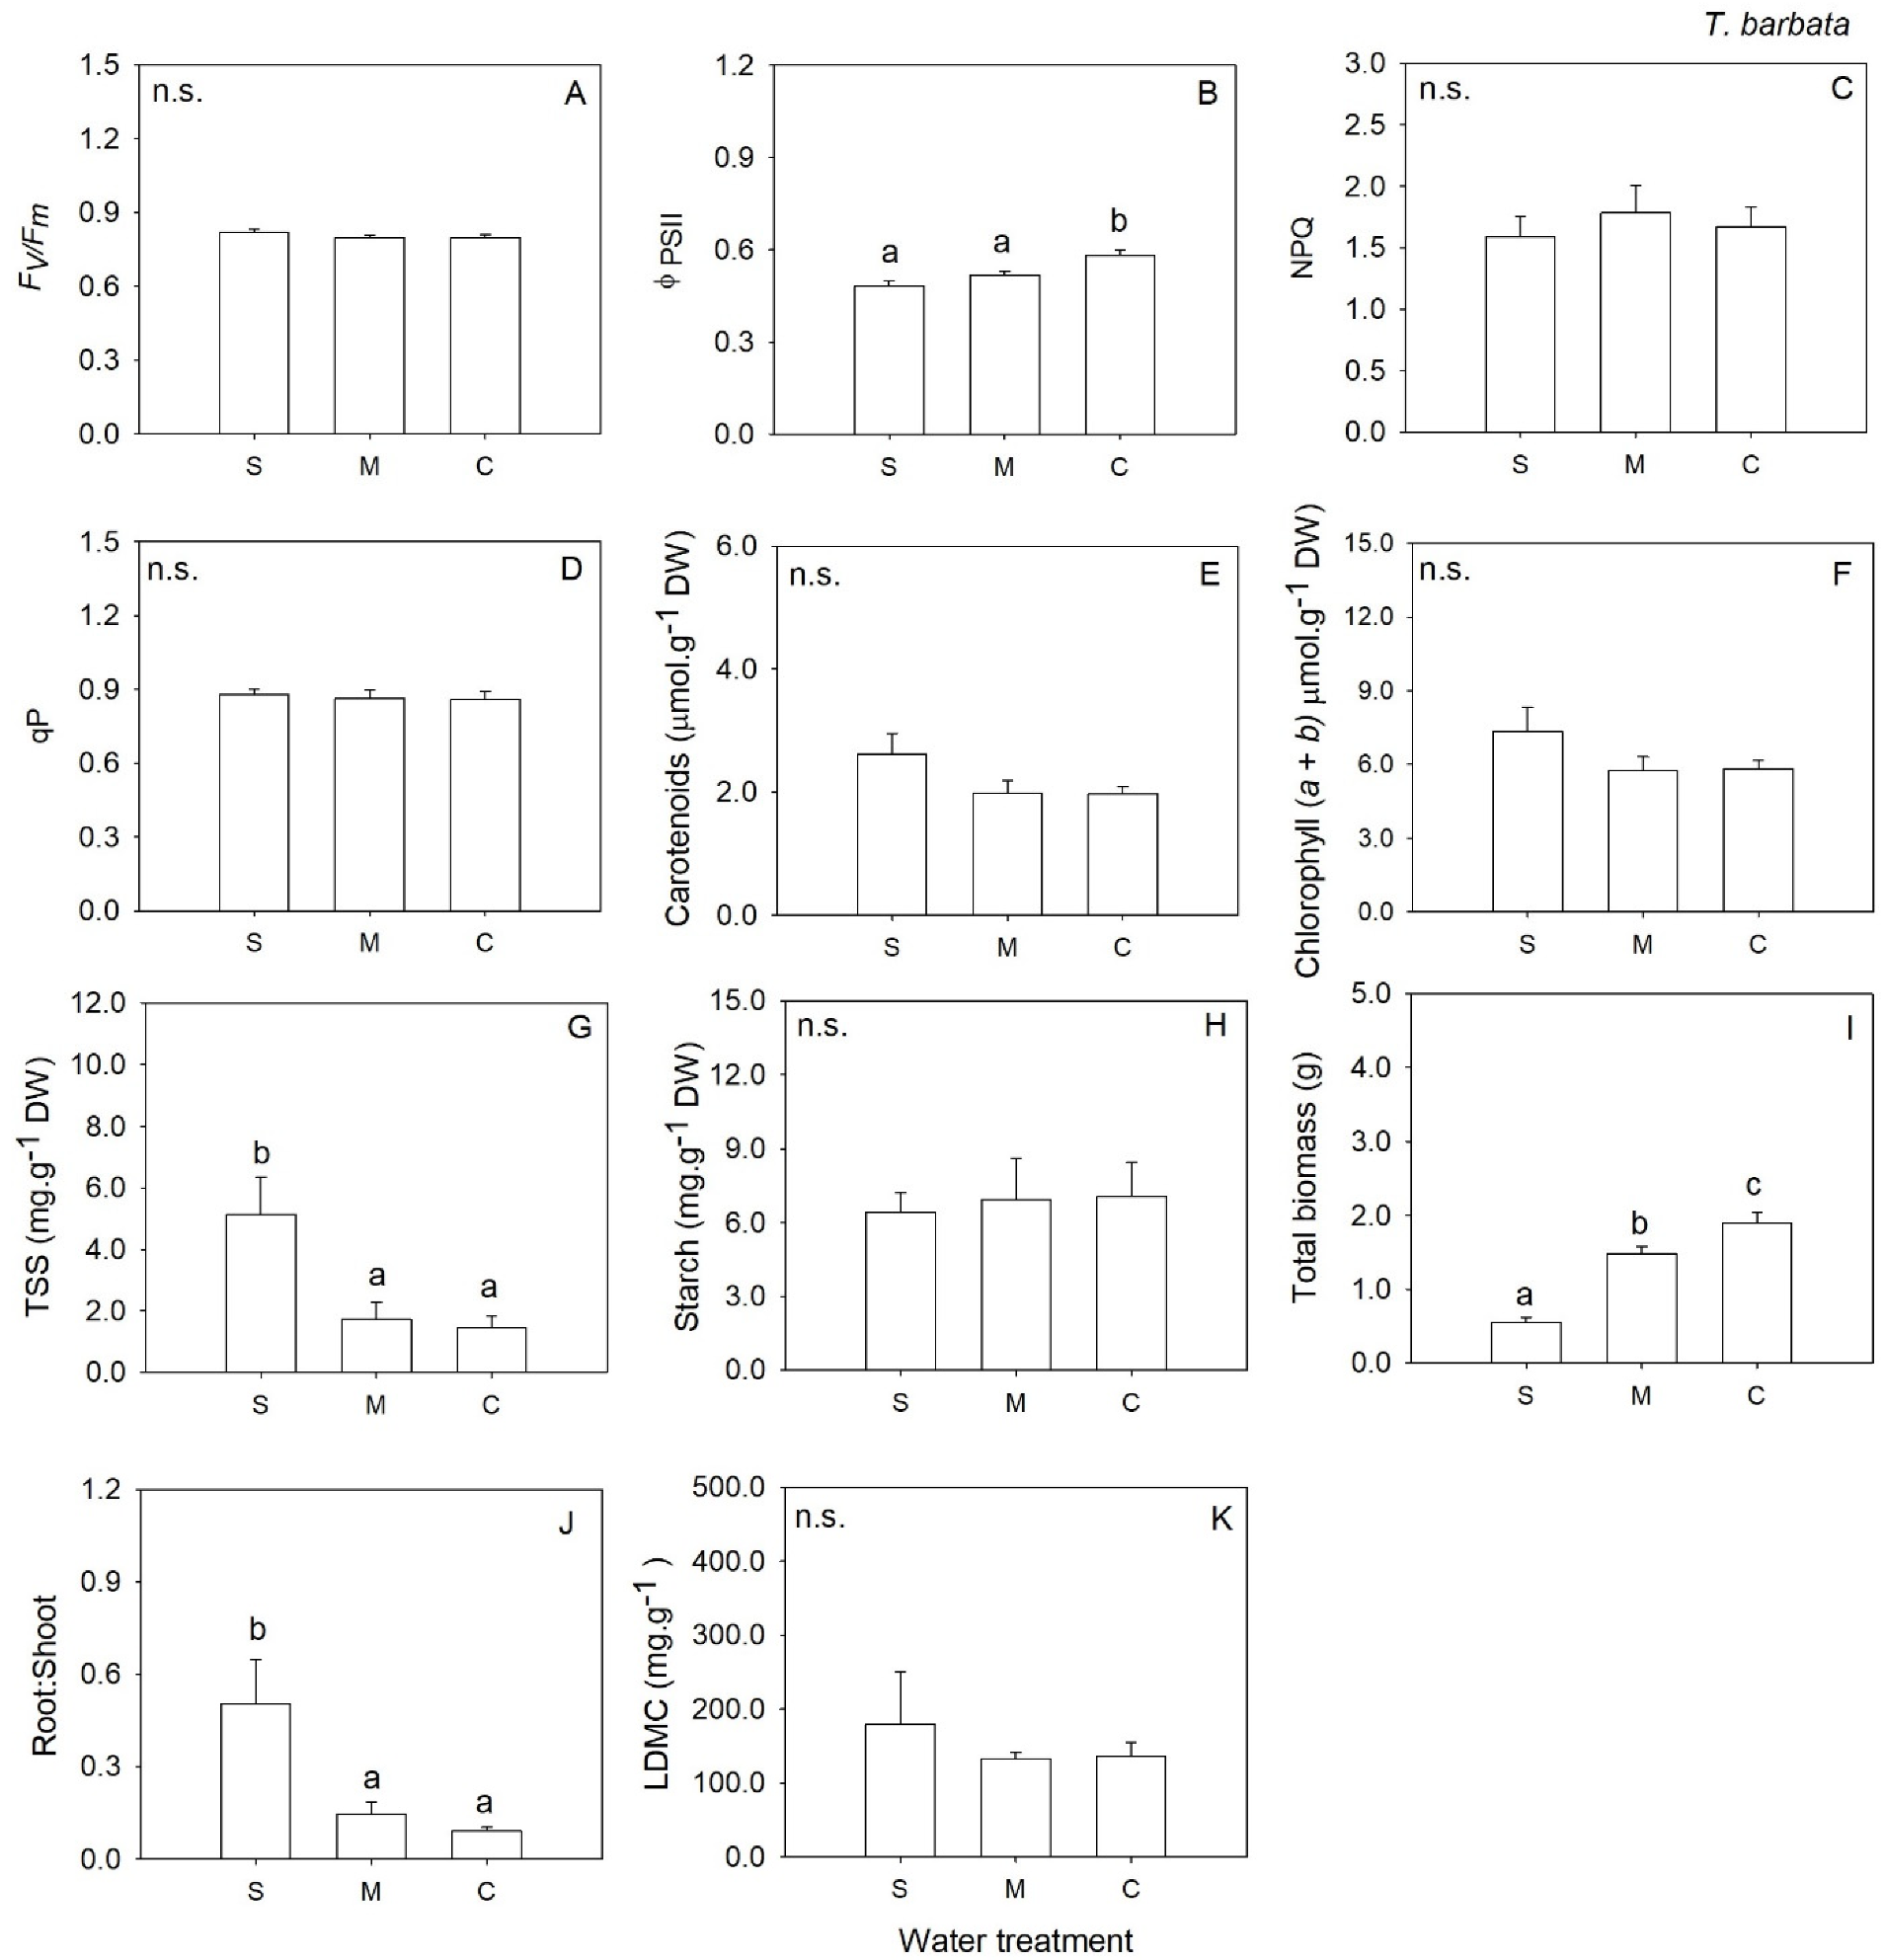
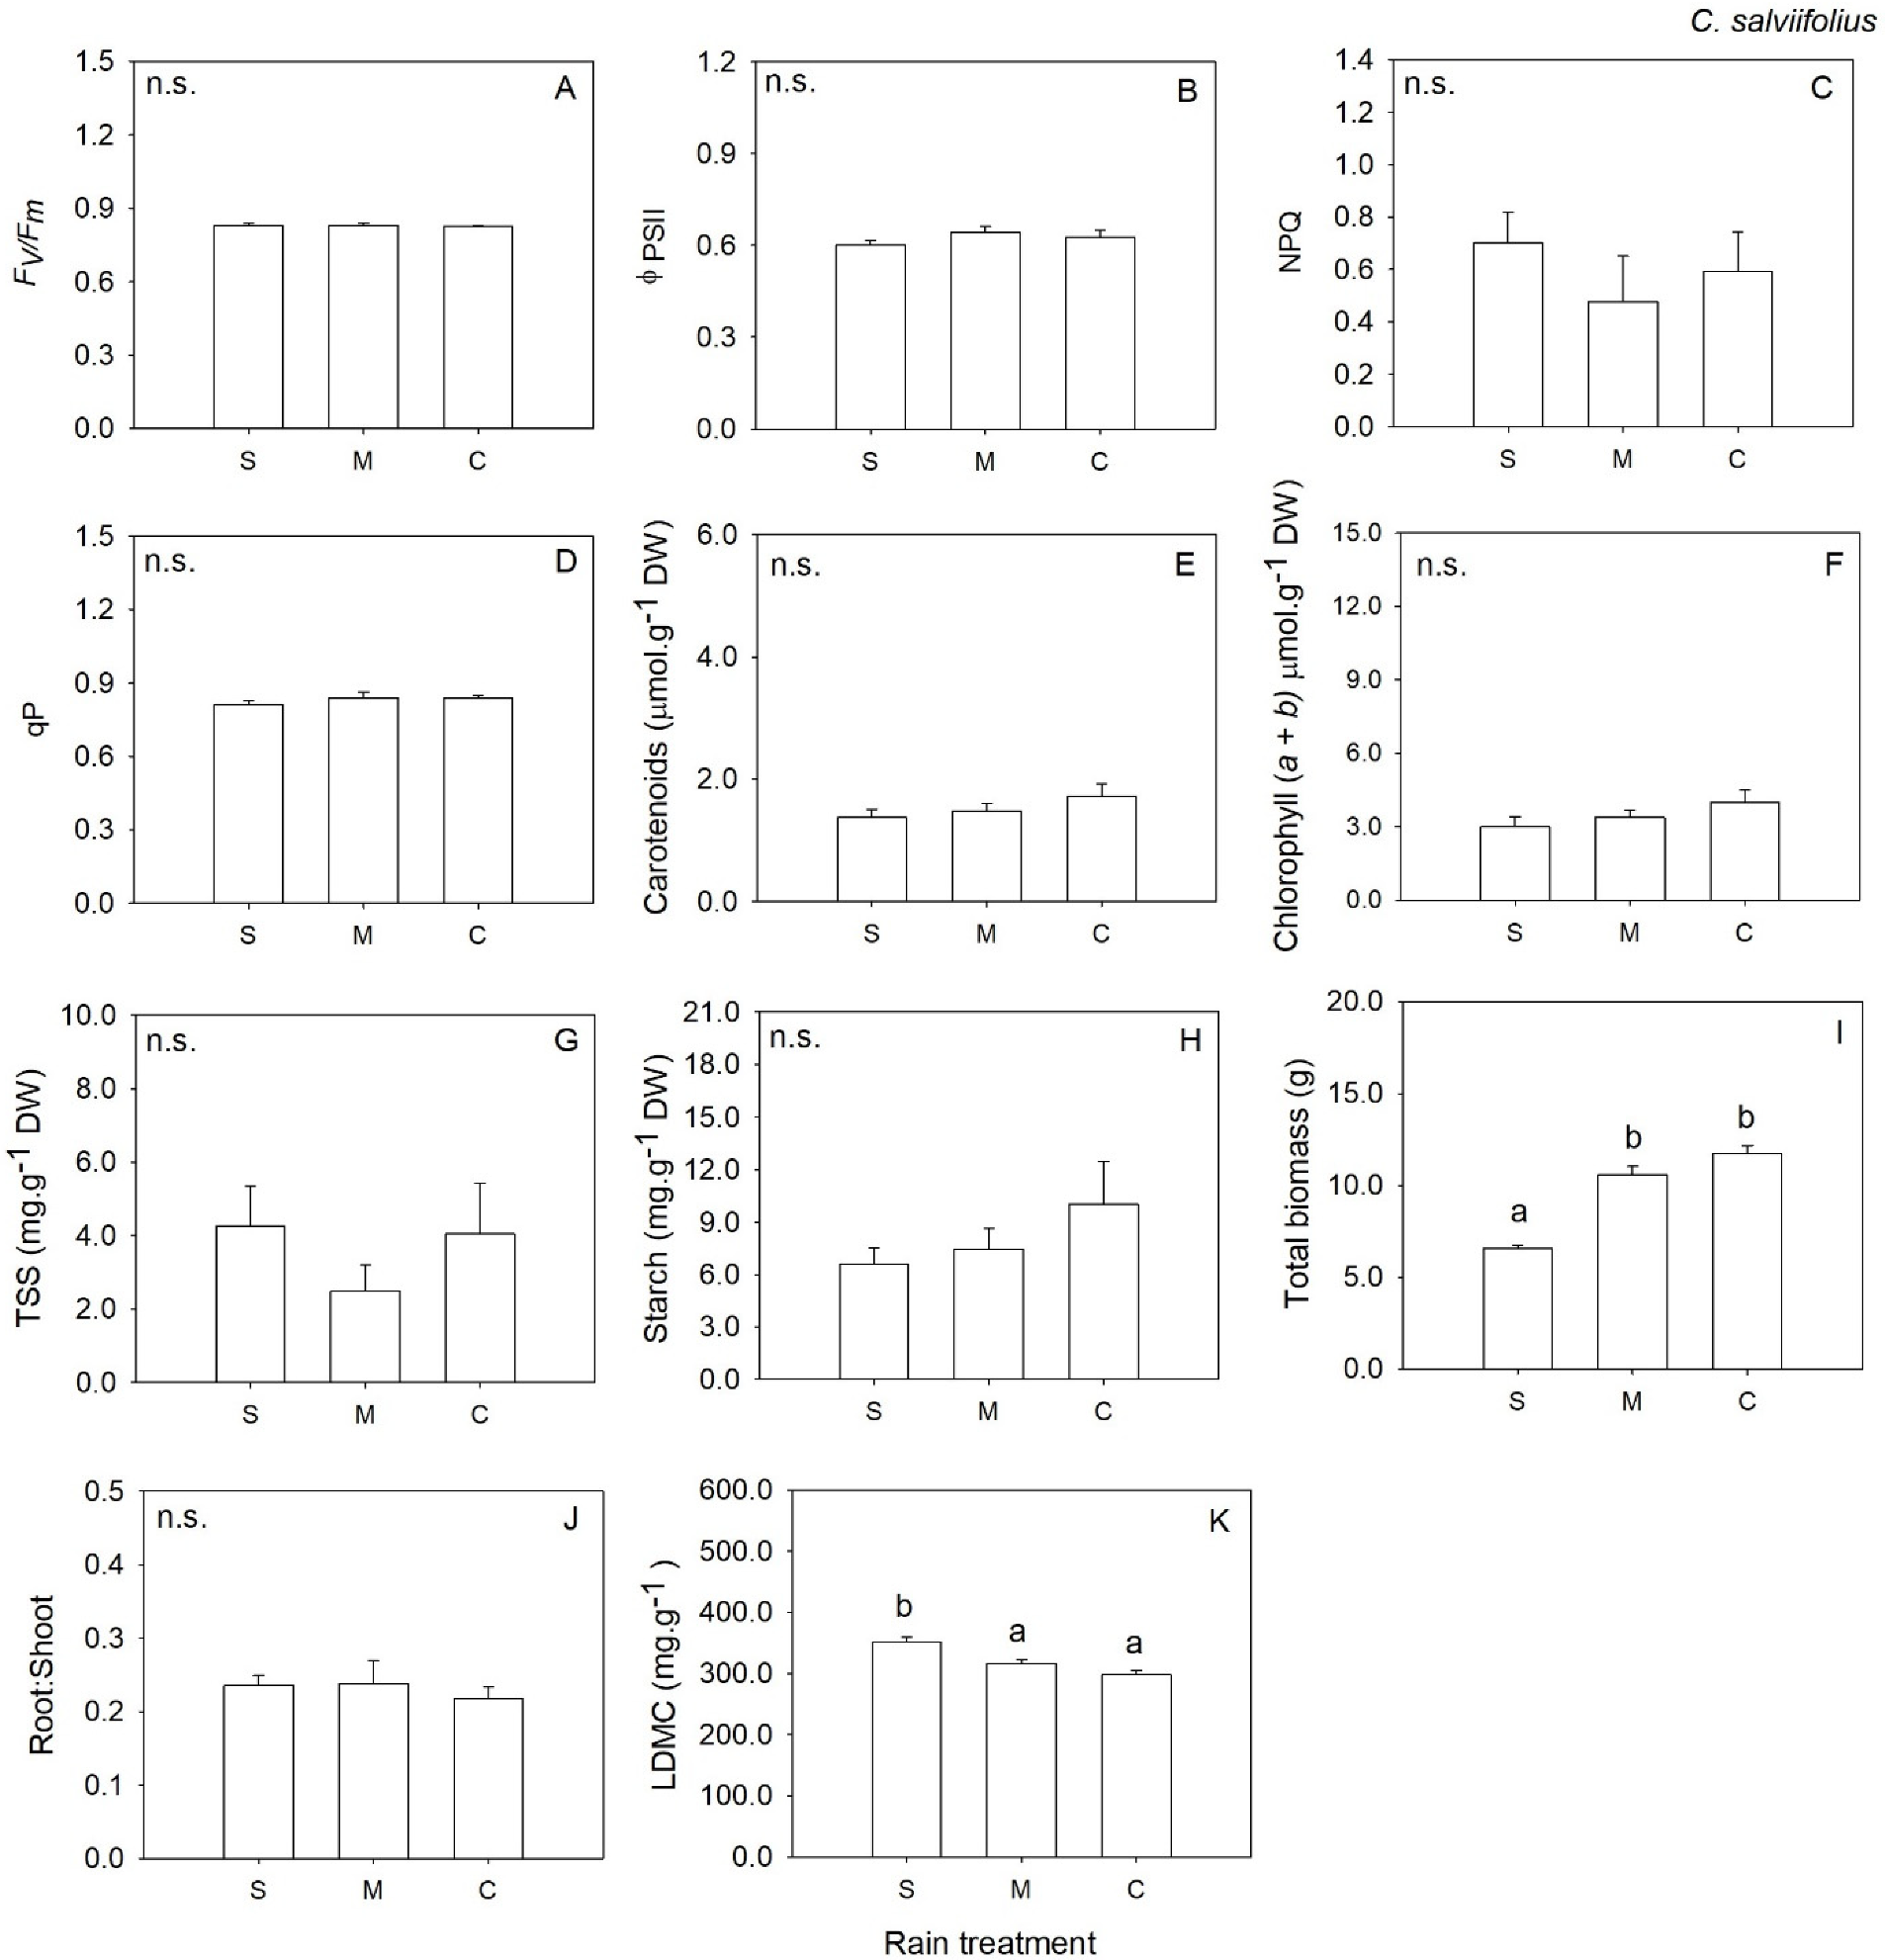
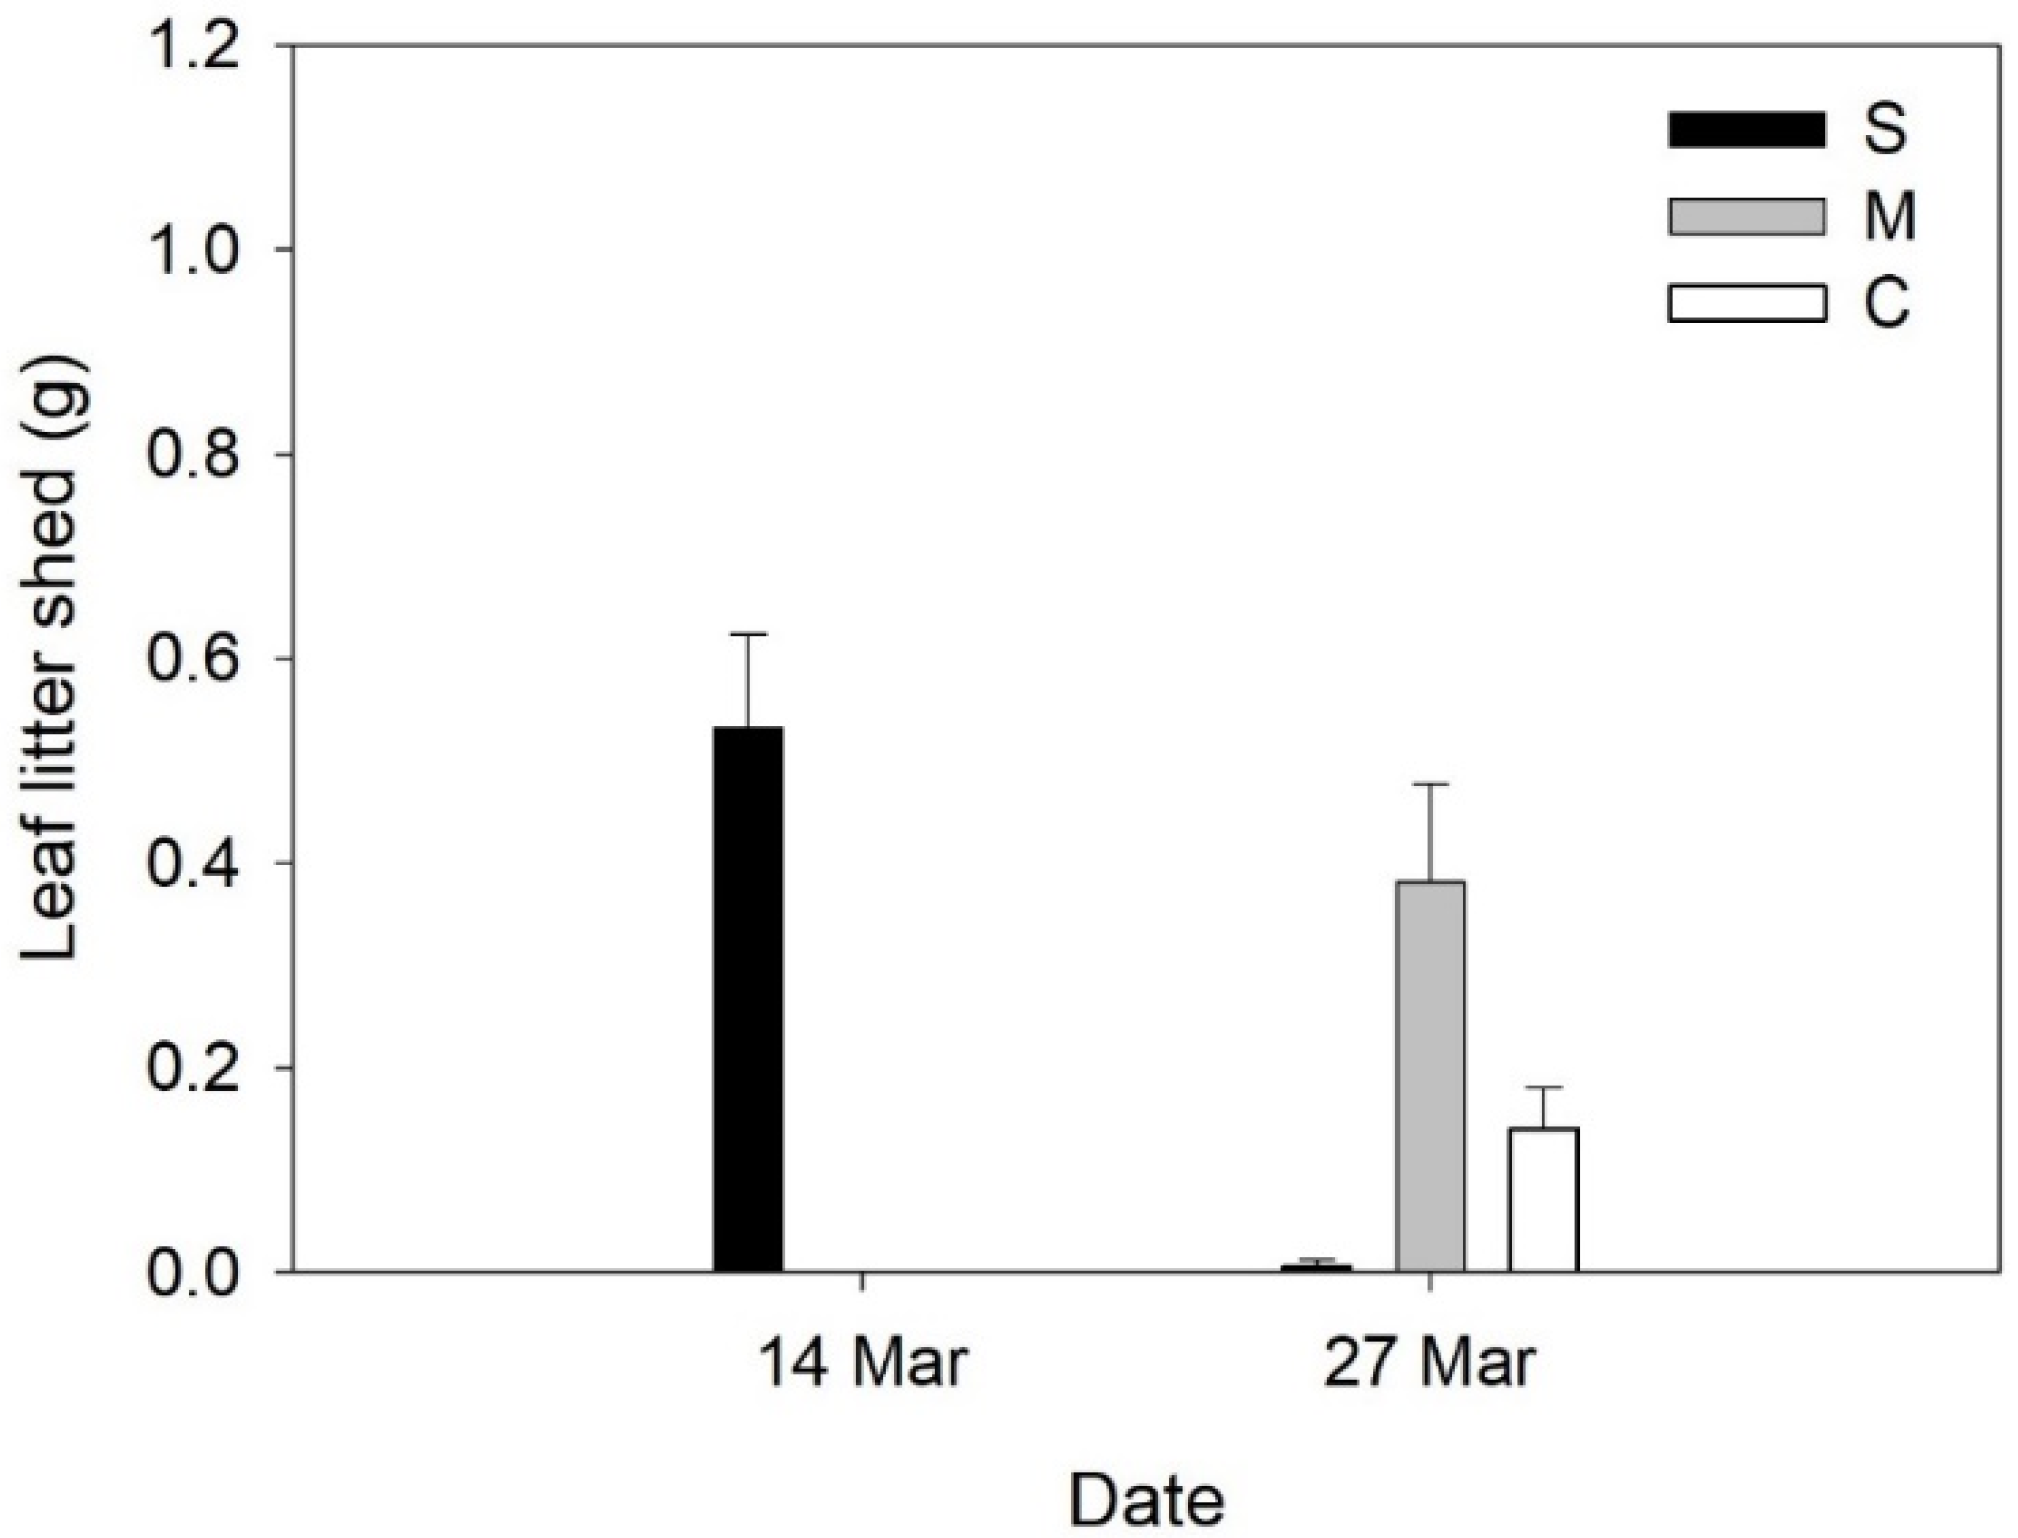
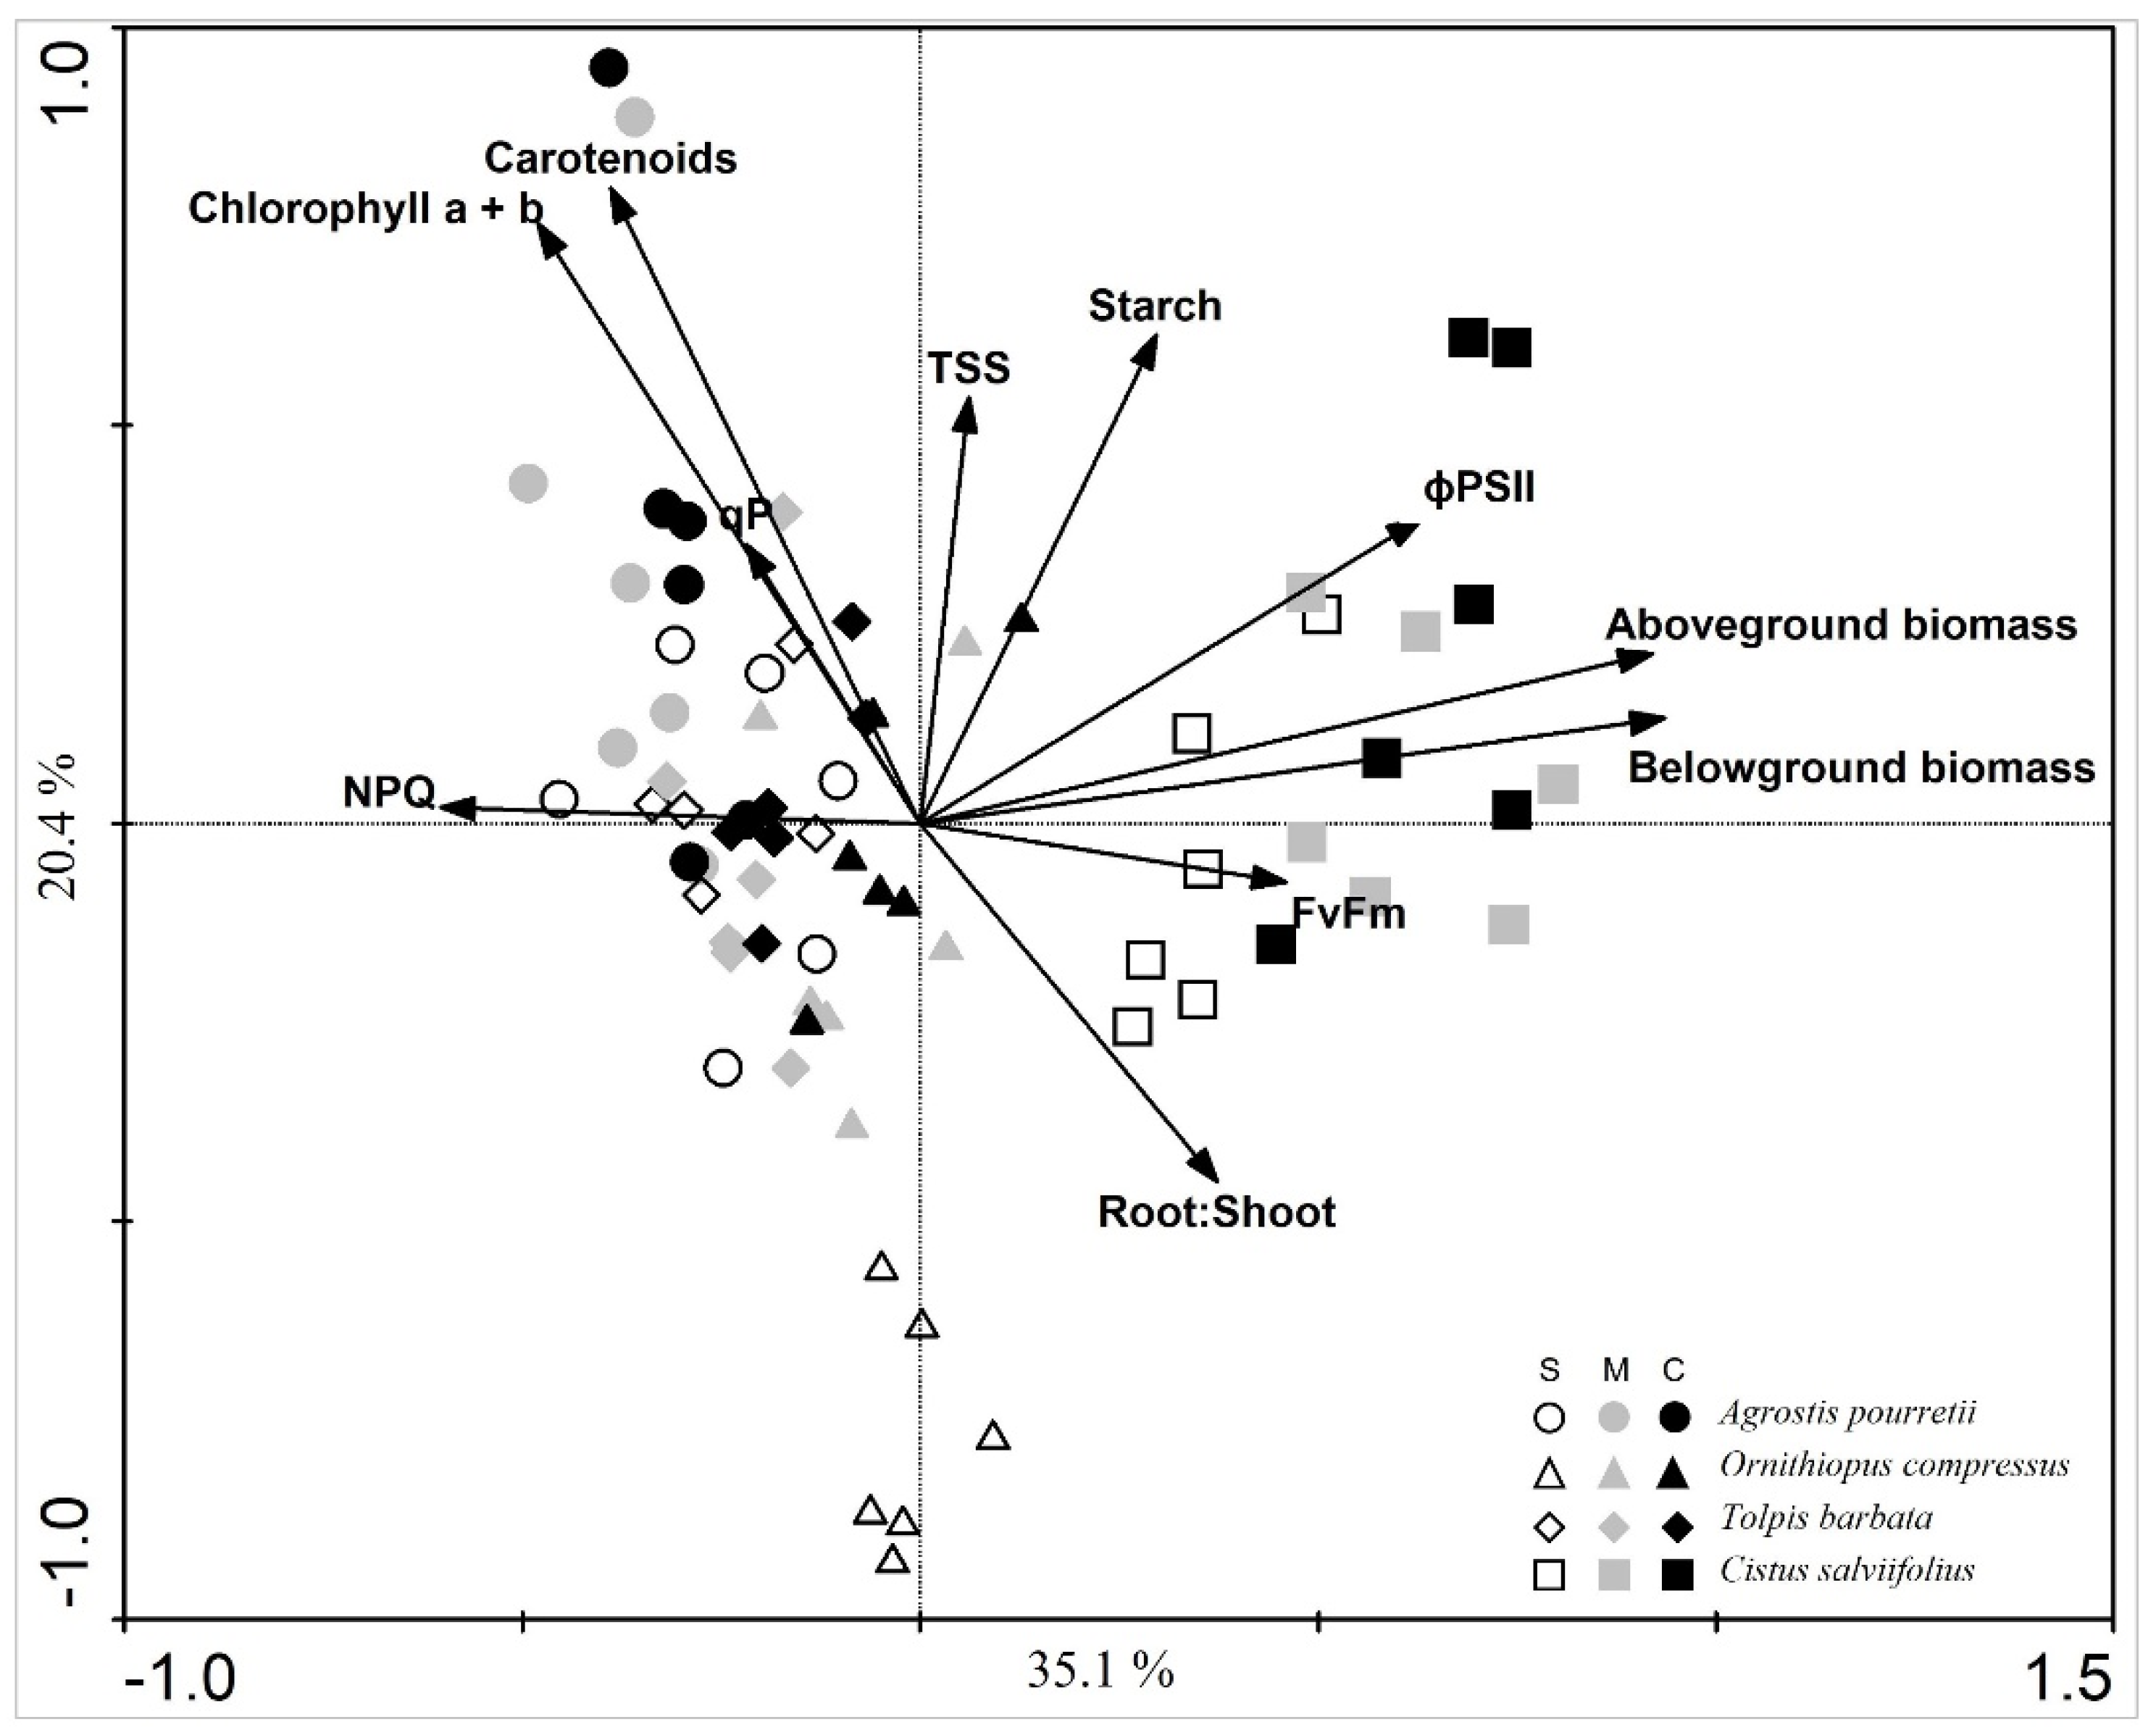
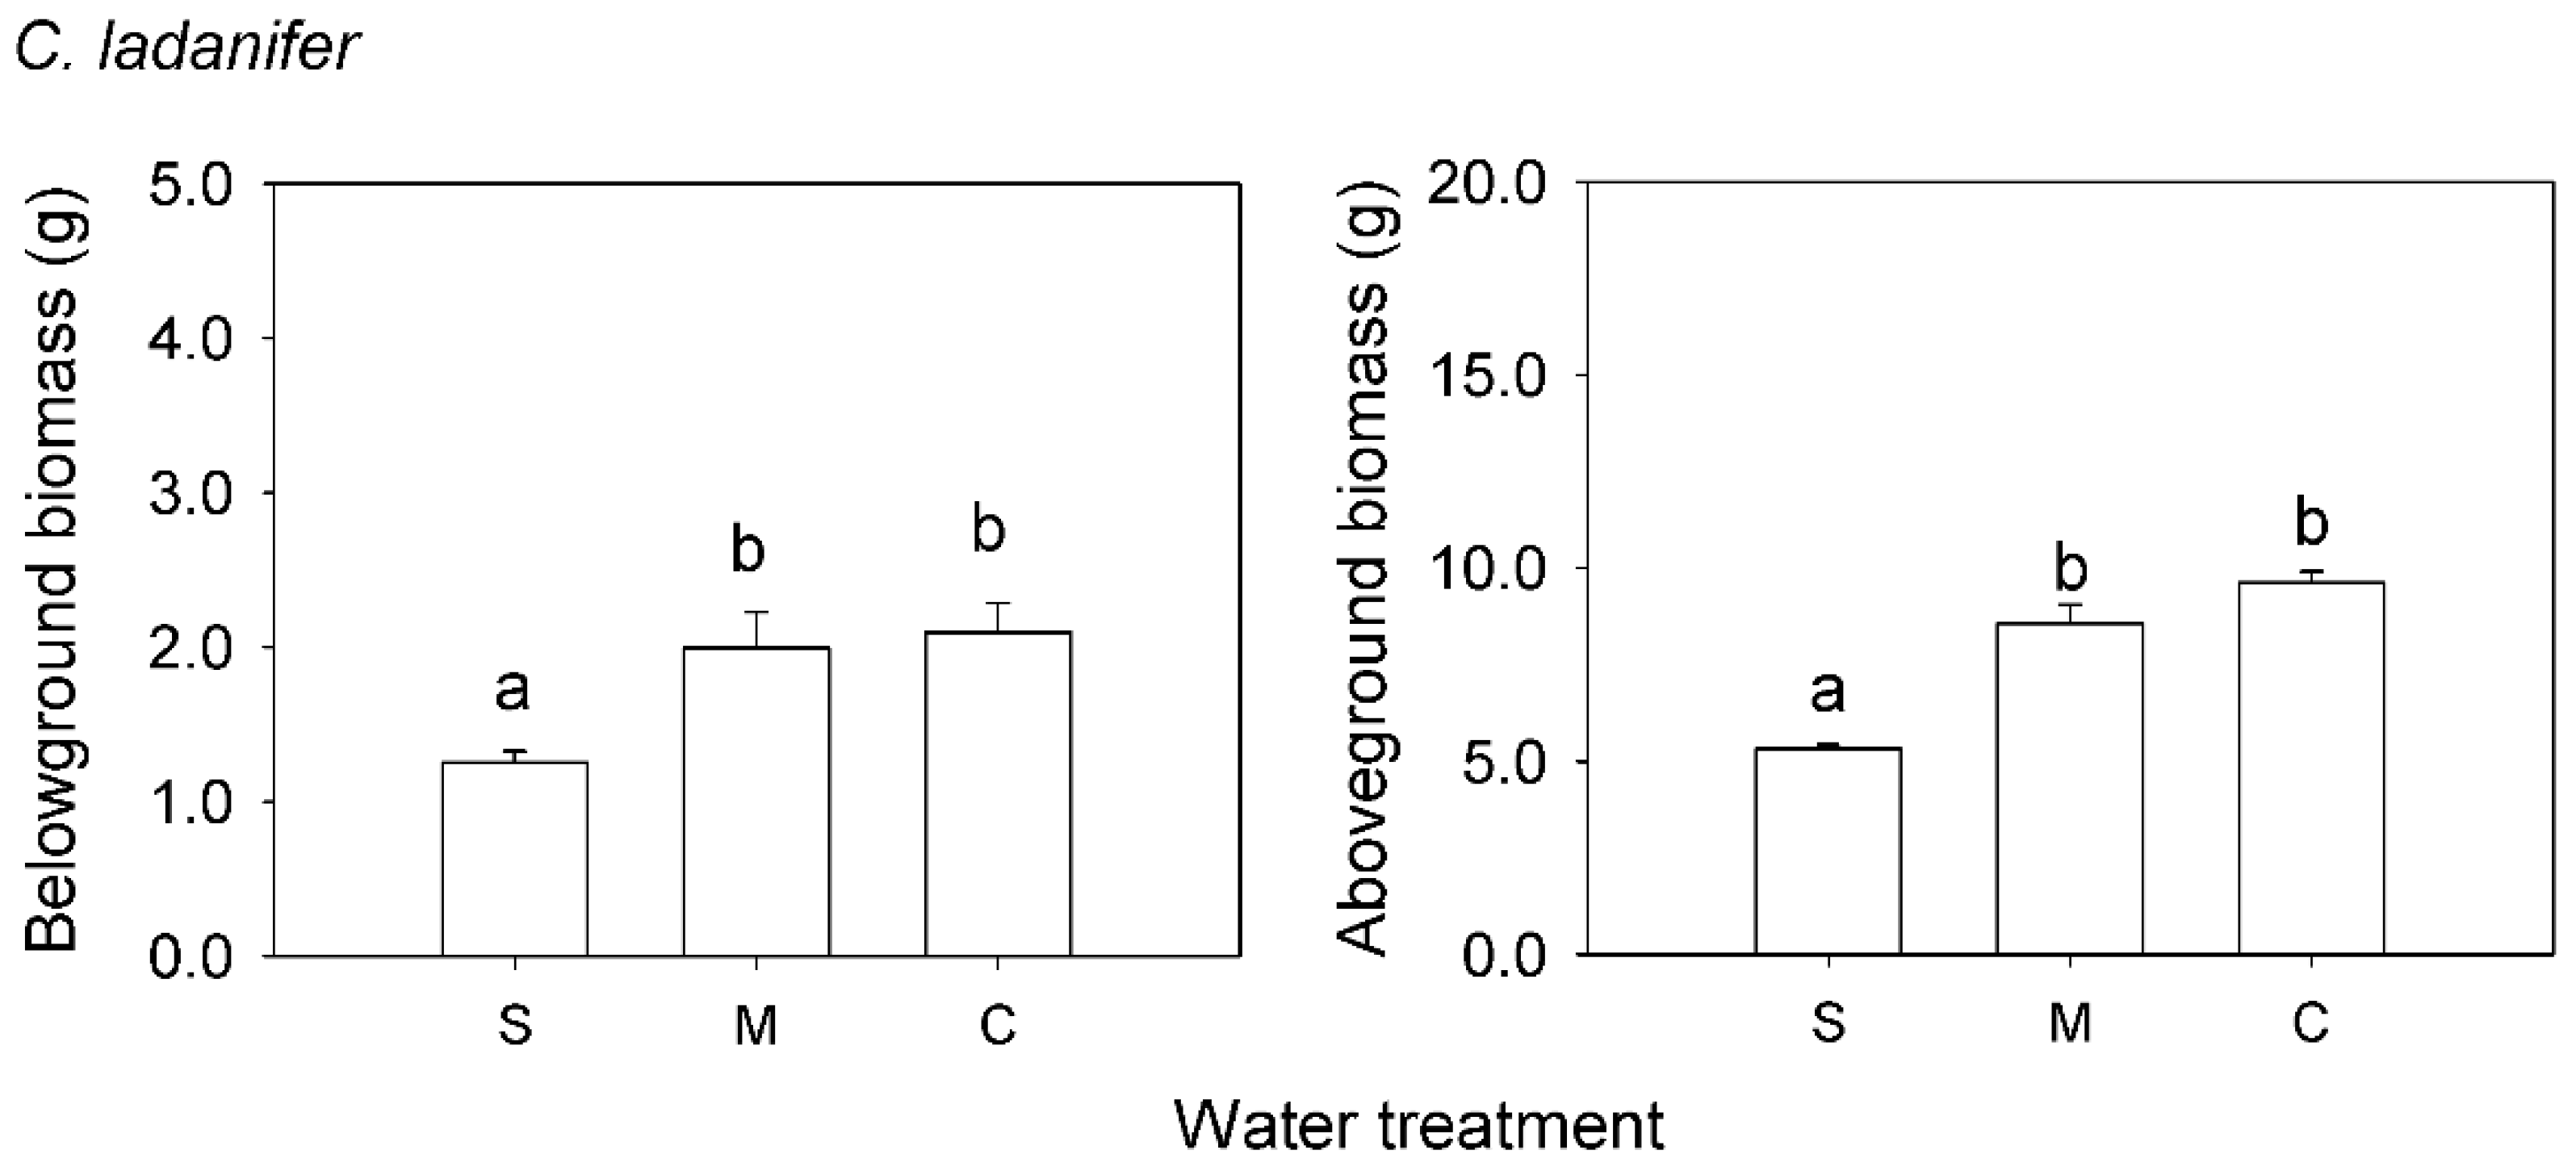
2. Results
3. Discussion
4. Materials and Methods
4.1. Experimental Set Up
4.2. Water Deficit Treatment
4.3. Sampling and Measurements
4.3.1. Plant Water Content, Chlorophyll a Fluorescence and Pigments Content
4.3.2. Plant Carbohydrates Contents
4.4. Statistical Analyses
5. Conclusions
Author Contributions
Funding
Data Availability Statement
Conflicts of Interest
Appendix A


References
- IPCC. Contribution of Working Group I to the Sixth Assessment Report of the Intergovernmental Panel on Climate Change. In Climate Change 2021: The Physical Science Basis; Cambridge University Press: Cambridge, UK, 2021. [Google Scholar]
- Castro, H.; Barrico, L.; Rodríguez-Echeverría, S.; Freitas, H. Trends in Plant and Soil Microbial Diversity Associated with Mediterranean Extensive Cereal-Fallow Rotation Agro-Ecosystems. Agric. Ecosyst. Environ. 2016, 217, 33–40. [Google Scholar] [CrossRef]
- García-Palacios, P.; Shaw, E.A.; Wall, D.H.; Hättenschwiler, S. Temporal Dynamics of Biotic and Abiotic Drivers of Litter Decomposition. Ecol. Lett. 2016, 217, 33–40. [Google Scholar] [CrossRef] [PubMed]
- Chomel, M.; Guittonny-Larchevêque, M.; Fernandez, C.; Gallet, C.; DesRochers, A.; Paré, D.; Jackson, B.G.; Baldy, V. Plant Secondary Metabolites: A Key Driver of Litter Decomposition and Soil Nutrient Cycling. J. Ecol. 2016, 104, 1527–1541. [Google Scholar] [CrossRef] [Green Version]
- Castro, H.; Castro, P. Mediterranean Marginal Lands in Face of Climate Change: Biodiversity and Ecosystem Services. In Climate Change Management; Castro, P., Azul, A., Leal Filho, W., Azeiteiro, U., Eds.; Springer: Cham, Switzerland, 2009; pp. 175–187. [Google Scholar] [CrossRef]
- Chaves, M.M.; Pereira, J.S.; Maroco, J.; Rodrigues, M.L.; Ricardo, C.P.P.; Osório, M.L.; Carvalho, I.; Faria, T.; Pinheiro, C. How Plants Cope with Water Stress in the Field. Photosynthesis and Growth. Ann. Bot. 2002, 89, 907–916. [Google Scholar] [CrossRef] [Green Version]
- de Dato, G.D.; Micali, M.; Abou Jaoudé, R.; Liberati, D.; De Angelis, P. Earlier Summer Drought Affects Leaf Functioning of the Mediterranean Species Cistus monspeliensis L. Environ. Exp. Bot. 2013, 93, 13–19. [Google Scholar] [CrossRef]
- Castro, H.; Freitas, H. Aboveground Biomass and Productivity in the Montado: From Herbaceous to Shrub Dominated Communities. J. Arid Environ. 2009, 73, 506–511. [Google Scholar] [CrossRef] [Green Version]
- Turner, N.C. Adaptation to Water Deficits: A Changing Perspective. Aust. J. Plant Physiol. 1986, 13, 175–190. [Google Scholar] [CrossRef]
- Dodd, I.C.; Ryan, A.C. Whole-Plant Physiological Responses to Water-Deficit Stress. In eLS; Wiley: Hoboken, NJ, USA, 2016; pp. 1–9. ISBN 9780470015902. [Google Scholar]
- Chaves, M.M.; Maroco, J.P.; Pereira, J.S. Understanding Plant Responses to Drought—From Genes to the Whole Plant. Funct. Plant Biol. 2003, 30, 239. [Google Scholar] [CrossRef]
- Takahashi, S.; Badger, M.R. Photoprotection in Plants: A New Light on Photosystem II Damage. Trends Plant Sci. 2011, 16, 53–60. [Google Scholar] [CrossRef]
- Pintó-Marijuan, M.; Munné-Bosch, S. Photo-Oxidative Stress Markers as a Measure of Abiotic Stress-Induced Leaf Senescence: Advantages and Limitations. J. Exp. Bot. 2014, 65, 3845–3857. [Google Scholar] [CrossRef] [Green Version]
- dos Santos, T.B.; Ribas, A.F.; de Souza, S.G.H.; Budzinski, I.G.F.; Domingues, D.S. Physiological Responses to Drought, Salinity, and Heat Stress in Plants: A Review. Stresses 2022, 2, 113–135. [Google Scholar] [CrossRef]
- Demmig-Adams, B.; Stewart, J.J.; Adams, W.W.; López-Pozo, M.; Polutchko, S.K. Zeaxanthin, a Molecule for Photoprotection in Many Different Environments. Molecules 2020, 25, 5825. [Google Scholar] [CrossRef]
- Acebron, K.; Matsubara, S.; Jedmowski, C.; Emin, D.; Muller, O.; Rascher, U. Diurnal Dynamics of Nonphotochemical Quenching in Arabidopsis Npq Mutants Assessed by Solar-Induced Fluorescence and Reflectance Measurements in the Field. New Phytol. 2021, 229, 2104–2119. [Google Scholar] [CrossRef] [PubMed]
- Dias, M.C.; Correia, S.; Serôdio, J.; Silva, A.M.S.; Freitas, H.; Santos, C. Chlorophyll Fluorescence and Oxidative Stress Endpoints to Discriminate Olive Cultivars Tolerance to Drought and Heat Episodes. Sci. Hortic. 2018, 231, 31–35. [Google Scholar] [CrossRef]
- Munné-Bosch, S.; Peñuelas, J. Drought-Induced Oxidative Stress in Strawberry Tree (Arbutus unedo L.) Growing in Mediterranean Field Conditions. Plant Sci. 2004, 166, 1105–1110. [Google Scholar] [CrossRef]
- Munné-Bosch, S.; Alegre, L. Changes in Carotenoids, Tocopherols and Diterpenes during Drought and Recovery, and the Biological Significance of Chlorophyll Loss in Rosmarinus officinalis Plants. Planta 2000, 210, 925–931. [Google Scholar] [CrossRef]
- Balaguer, L.; Pugnaire, F.I.; Armas, C.; Valladares, F.; Manrique, E. Ecophysiological Signi Cance of Chlorophyll Loss and Reduced Photochemical Ef Ciency under Extreme Aridity In. Plant Soil 2002, 240, 343–352. [Google Scholar] [CrossRef]
- Jones, M.; Osmond, C.; Turner, N. Accumulation of Solutes in Leaves of Sorghum and Sunflower in Response to Water Deficits. Funct. Plant Biol. 1980, 7, 193. [Google Scholar] [CrossRef]
- Farooq, M.; Wahid, A.; Kobayashi, H.; Fujita, D.; Basra, S. Review Article Plant Drought Stress: Effects, Mechanisms and Management. Agron. Sustain. Dev. 2009, 29, 185–212. [Google Scholar] [CrossRef] [Green Version]
- Magaña Ugarte, R.; Escudero, A.; Gavilán, R.G. Assessing the Role of Selected Osmolytes in Mediterranean High-Mountain Specialists. Front. Ecol. Evol. 2021, 9, 1–12. [Google Scholar] [CrossRef]
- González-Orenga, S.; Al Hassan, M.; Llinares, J.V.; Lisón, P.; López-Gresa, M.P.; Verdeguer, M.; Vicente, O.; Boscaiu, M. Qualitative and Quantitative Differences in Osmolytes Accumulation and Antioxidant Activities in Response to Water Deficit in Four Mediterranean Limonium Species. Plants 2019, 8, 506. [Google Scholar] [CrossRef] [PubMed] [Green Version]
- Silva, S.; Santos, C.; Serodio, J.; Silva, A.M.S.; Dias, M.C. Physiological Performance of Drought-Stressed Olive Plants When Exposed to a Combined Heat–UV-B Shock and after Stress Relief. Funct. Plant Biol. 2018, 45, 1233. [Google Scholar] [CrossRef]
- Wang, J.Y.; Turner, N.C.; Liu, Y.X.; Siddique, K.H.M.; Xiong, Y.C. Effects of Drought Stress on Morphological, Physiological and Biochemical Characteristics of Wheat Species Differing in Ploidy Level. Funct. Plant Biol. 2017, 44, 219. [Google Scholar] [CrossRef] [PubMed]
- Grant, O.M.; Tronina, Ł.; García-Plazaola, J.I.; Esteban, R.; Pereira, J.S.; Manuela Chaves, M. Resilience of a Semi-Deciduous Shrub, Cistus Salvifolius, to Severe Summer Drought and Heat Stress. Funct. Plant Biol. 2015, 42, 219–228. [Google Scholar] [CrossRef]
- Puglielli, G.; Catoni, R.; Spoletini, A.; Varone, L.; Gratani, L. Short-Term Physiological Plasticity: Trade-off between Drought and Recovery Responses in Three Mediterranean Cistus Species. Ecol. Evol. 2017, 7, 10880–10889. [Google Scholar] [CrossRef]
- Catoni, R.; Gratani, L.; Varone, L. Physiological, Morphological and Anatomical Trait Variations between Winter and Summer Leaves of Cistus Species. Flora Morphol. Distrib. Funct. Ecol. Plants 2012, 207, 442–449. [Google Scholar] [CrossRef]
- Jongen, M.; Hellmann, C.; Unger, S. Species-Specific Adaptations Explain Resilience of Herbaceous Understorey to Increased Precipitation Variability in a Mediterranean Oak Woodland. Ecol. Evol. 2015, 5, 4246–4262. [Google Scholar] [CrossRef] [PubMed] [Green Version]
- Dias, M.C.; Pinto, G.; Correia, C.M.; Moutinho-Pereira, J.; Silva, S.; Santos, C. Photosynthetic Parameters of Ulmus minor Plantlets Affected by Irradiance during Acclimatization. Biol. Plant. 2013, 57, 33–40. [Google Scholar] [CrossRef]
- Jongen, M.; Unger, S.; Fangueiro, D.; Cerasoli, S.; Silva, J.M.N.; Pereira, J.S. Resilience of Montado Understorey to Experimental Precipitation Variability Fails under Severe Natural Drought. Agric. Ecosyst. Environ. 2013, 178, 18–30. [Google Scholar] [CrossRef] [Green Version]
- Poorter, H.; Bühler, J.; Van Dusschoten, D.; Climent, J.; Postma, J.A. Pot Size Matters: A Meta-Analysis of the Effects of Rooting Volume on Plant Growth. Funct. Plant Biol. 2012, 39, 839–850. [Google Scholar] [CrossRef] [Green Version]
- Dovrat, G.; Meron, E.; Shachak, M.; Golodets, C.; Osem, Y. Plant Size Is Related to Biomass Partitioning and Stress Resistance in Water-Limited Annual Plant Communities. J. Arid Environ. 2019, 165, 1–9. [Google Scholar] [CrossRef]
- de Oliveira, J.M.P.F.; Santos, C.; Araújo, M.; Oliveira, M.M.; Dias, M.C. High-Salinity Activates Photoprotective Mechanisms in Quercus Suber via Accumulation of Carbohydrates and Involvement of Non-Enzymatic and Enzymatic Antioxidant Pathways. New For. 2022, 53, 285–300. [Google Scholar] [CrossRef]
- Hsiao, T.C.; Xu, L.K. Sensitivity of with of Roots versus Leaves to Water Stress: Biophysical Analysis and Relation to Water. J. Exp. Bot. 2000, 51, 1595–1616. [Google Scholar] [CrossRef] [PubMed]
- Franco, J.A.; Bañón, S.; Vicente, M.J.; Miralles, J.; Martínez-Sánchez, J.J. Root Development in Horticultural Plants Grown under Abiotic Stress Conditions—A Review. J. Hortic. Sci. Biotechnol. 2011, 86, 543–556. [Google Scholar] [CrossRef]
- Garnier, E.; Lavorel, S.; Ansquer, P.; Castro, H.; Cruz, P.; Dolezal, J.; Eriksson, O.; Fortunel, C.; Freitas, H.; Golodets, C.; et al. Assessing the Effects of Land-Use Change on Plant Traits, Communities and Ecosystem Functioning in Grasslands: A Standardized Methodology and Lessons from an Application to 11 European Sites. Ann. Bot. 2007, 99, 967–985. [Google Scholar] [CrossRef] [Green Version]
- van Kooten, O.; Snel, J.F.H. The Use of Chlorophyll Fluorescence Nomenclature in Plant Stress Physiology. Photosynth. Res. 1990, 25, 147–150. [Google Scholar] [CrossRef] [PubMed]
- Sims, D.A.; Gamon, J.A. Relationships between Leaf Pigment Content and Spectral Reflectance across a Wide Range of Species, Leaf Structures and Developmental Stages. Remote Sens. Environ. 2002, 81, 337–354. [Google Scholar] [CrossRef]
- Osaki, M.; Shinano, T.; Tadano, T. Redistribution of Carbon and Nitrogen Compounds from the Shoot to the Harvesting Organs during Maturation in Field Crops. Soil Sci. Plant Nutr. 1991, 37, 117–128. [Google Scholar] [CrossRef]
- Hedges, L.V.; Gurevitch, J.; Curtis, P.S. The Meta-Analysis of Response Ratios in Experimental Ecology. Ecology 1999, 80, 1150–1156. [Google Scholar] [CrossRef]
- Core Development Team. R: A Language and Environment for Statistical Computing; R Foundation for Statistical Computing: Vienna, Austria, 2016. [Google Scholar]


| Effect | Water Treatment | |||||||||||
|---|---|---|---|---|---|---|---|---|---|---|---|---|
| Species | A. pourretti | O. compressus | T. barbata | C. salviifolius | ||||||||
| Response Variables | df | F | p | df | F | p | df | F | p | df | F | p |
| Physiological | ||||||||||||
| Fv/Fm | 2 | 1.20 | 0.327 | 2 | 2.10 | 0.157 | 2 | 0.91 | 0.425 | 2 | 0.23 | 0.800 |
| ΦPSII | 2 | 0.44 | 0.653 | 2 | 0.55 | 0.589 | 2 | 9.31 | 0.003 | 2 | 1.28 | 0.306 |
| NPQ | 2 | 0.31 | 0.735 | 2 | 2.79 | 0.094 | 2 | 0.11 | 0.899 | 2 | 0.56 | 0.584 |
| qP | 2 | 0.41 | 0.671 | 2 | 0.09 | 0.919 | 2 | 0.15 | 0.859 | 2 | 0.61 | 0.559 |
| Chl (a + b) | 2 | 3.50 | 0.057 | 2 | 20.02 | <0.001 | 2 | 0.97 | 0.404 | 2 | 1.43 | 0.275 |
| Carotenoids | 2 | 5.30 | 0.018 | 2 | 34.75 | <0.001 | 2 | 1.46 | 0.265 | 2 | 1.24 | 0.321 |
| Total Soluble Sugars | 2 | 1.44 | 0.270 | 2 | 19.39 | <0.001 | 2 | 8.29 | 0.004 | 2 | 0.79 | 0.471 |
| Starch | 2 | 0.93 | 0.417 | 2 | 19.25 | <0.001 | 2 | 0.04 | 0.961 | 2 | 1.16 | 0.339 |
| Morphological | ||||||||||||
| LDMC | 2 | 7.07 | 0.009 | 2 | 48.09 | <0.001 | 2 | 0.67 | 0.528 | 2 | 15.66 | <0.001 |
| Total biomass | 2 | 30.01 | <0.001 | 2 | 25.65 | <0.001 | 2 | 36.01 | <0.001 | 2 | 62.99 | <0.001 |
| Root: Shoot | 2 | 4.95 | 0.022 | 2 | 12.62 | 0.001 | 2 | 9.12 | 0.003 | 2 | 0.27 | 0.764 |
| Belowground biomass | 2 | 2.34 | 0.131 | 2 | 6.02 | 0.012 | 2 | 0.13 | 0.877 | 2 | 6.69 | 0.008 |
| Aboveground biomass | 2 | 32.72 | <0.001 | 2 | 39.1 | <0.001 | 2 | 38.01 | <0.001 | 2 | 58.08 | <0.001 |
| Species | Water Treatment | |||
|---|---|---|---|---|
| Severe Stress | Moderate Stress | Control | ANOVA Results | |
| A. pourretti | 6.17 ± 0.54 (a) | 22.50 ± 2.69 (b) | 28.33 ± 2.29 (b) | F = 30.97, p < 0.001 |
| O. compressus | 0.00 ± 0.00 (a) | 15.17 ± 1.92 (b) | 17.67 ± 2.62 (b) | F = 26.02, p < 0.001 |
| T. barbata | 10.80 ± 3.6 (a) | 42.67 ± 4.5 (b) | 47.67 ± 4.17 (b) | F = 21.41, p < 0.001 |
Disclaimer/Publisher’s Note: The statements, opinions and data contained in all publications are solely those of the individual author(s) and contributor(s) and not of MDPI and/or the editor(s). MDPI and/or the editor(s) disclaim responsibility for any injury to people or property resulting from any ideas, methods, instructions or products referred to in the content. |
© 2023 by the authors. Licensee MDPI, Basel, Switzerland. This article is an open access article distributed under the terms and conditions of the Creative Commons Attribution (CC BY) license (https://creativecommons.org/licenses/by/4.0/).
Share and Cite
Castro, H.; Dias, M.C.; Sousa, J.P.; Freitas, H. Functional Groups Response to Water Deficit in Mediterranean Ecosystems. Plants 2023, 12, 1471. https://doi.org/10.3390/plants12071471
Castro H, Dias MC, Sousa JP, Freitas H. Functional Groups Response to Water Deficit in Mediterranean Ecosystems. Plants. 2023; 12(7):1471. https://doi.org/10.3390/plants12071471
Chicago/Turabian StyleCastro, Helena, Maria Celeste Dias, José Paulo Sousa, and Helena Freitas. 2023. "Functional Groups Response to Water Deficit in Mediterranean Ecosystems" Plants 12, no. 7: 1471. https://doi.org/10.3390/plants12071471