Article

Genome Size Variation across a Cypriot Fabeae Tribe Germplasm Collection

by
Iliana Charalambous
1,†,
Nektaria Ioannou
1,†,
Angelos C. Kyratzis
2,†,
Dimitrios Kourtellarides
2,
Marianna Hagidimitriou
3 and
Nikolaos Nikoloudakis
1,*
1
Department of Agricultural Science, Biotechnology and Food Science, Cyprus University of Technology, 3036 Limassol, Cyprus
2
Vegetable Crop Sector, Agricultural Research Institute-Ministry of Agriculture, Rural Development and Environment, 1516 Nicosia, Cyprus
3
Department of Biotechnology, Agricultural University of Athens, 10561 Athens, Greece
*
Author to whom correspondence should be addressed.
These authors contributed equally to this work.
Plants 2023, 12(7), 1469; https://doi.org/10.3390/plants12071469
Submission received: 3 March 2023 / Revised: 23 March 2023 / Accepted: 23 March 2023 / Published: 27 March 2023
(This article belongs to the Special Issue Mediterranean Plants II)

Abstract

:
DNA content is an important trait linked to the evolutionary routes of taxa and often connected to speciation. In the present study, we studied C-values variation across the Cypriot Fabeae gene pool. Several hundred plants (Vicia spp., Lens spp., Pisum spp.) were sampled across Cyprus. Accurate estimates were established by flow cytometry and propidium iodine staining for 155 discrete populations/accessions. A ten-fold variation was detected across lineages with 1C DNA content varying from 1.584 pg for V. cretica (ARI02420) to 13.983 pg for V. faba (ARI00187). In general, flow cytometry was precise for the characterization of species, even though there were instances of genome overlapping across taxa. Most analyses in the current work refer to species that have not been characterized before by flow cytometry (or any other DNA content estimation method). Still, a correlation to C-values previously reported in Kew Plant DNA C-values database was attempted. A high degree of correlation except for V. dalmatica was established. The evaluation of genome size trait in relation with the Fabeae phylogeny, revealed that Pisum and Lens genera were rather homogenous, but an astonishing fluctuation was shown for Vicia spp. Moreover, it was established that genome up- or down-scaling was not directly linked to speciation drivers. The genomic size measurements presented here could deliver extra quality control for the identification and characterization of taxa in germplasm collections, particularly in cases where species share morphological characters.

1. Introduction

The inconsistency of DNA concentration within a haploid nucleus (C-value) and the functional complexity of eukaryotic organisms has been recognized as the C-value paradox [1]. The fact that the DNA amount is not correlated to the complexity of an organism or the number of required genes, despite initial theories, has been an enigma, perplexing geneticists across the decades. Nowadays, complementary to last eras’ C0t analysis (a technique based on reassociation kinetics of DNA fragments), next generation sequencing (NGS) has provided solid evidence that genome augmentation is due to repetitive DNA sequences, formerly believed to be ‘junk DNA’ [2].
Angiosperms (flowering plants) are generally accepted as ideal candidates to study the influence of such repetitive sequences on the evolution of genomes [3] since there is an astonishing difference across genome sizes, spanning over three orders of magnitude (starting from approximately 0.59 Gbp/1C) in the carnivorous plant Genlisea tuberosa Rivadavia, Gonella & A. Fleischm [4] to 148.90 Gbp/1C in Paris japonica Franchet [5]. Even though C-values greatly fluctuate across taxonomic families, there is general uniformity within families, tribes, or species.
Nonetheless, this is not the case for the legume family (Leguminosae) where great dissimilarities of genome size are reported; C-values fluctuate from approximately 400 Mbp to more than 26,000 Mbp (per 1C) [6]. In particular, smaller genomes (0.34 pg/1C) have been reported for Trifolium ligusticum Balb. ex Loisel. [7], while Vicia faba L. has been recognized as having the largest genome (27.40 pg/1C) [8]. Ancestral forms of legumes (such as Trifolium spp) are alleged to have had smaller genomes, while DNA content across the Fabeae tribe has staggeringly increased after the divergence from common progenitors [6]. The Fabeae tribe contains economically/agronomically significant taxa for human, as well as animal, consumption (such as Lathyrus L., Lens Mill., Pisum L. and Vicia L.). The accumulation of available molecular data for Fabeae, such as genetic linkage maps [9,10,11,12], genome sequencing [13,14,15], and diversity arrays technology (DArT) [16] has provided valuable insights for these genetic resources. Still, a basic understanding regarding the nature of a given genome necessitates information concerning the DNA amount and must be considered as a critical feature in any inclusive program for comparative genomic investigations [17]. Nonetheless, despite the fact that hundreds of different taxa have been reported in the literature for Fabeae taxa, very few data regarding genomic size are reported and available [18].
The first evaluation on genome size for Fabeae was reported by Rees et al. [19] for V. sativa (1.13 pg). The genus Pisum comprises three species: P. abyssinicum (Abyssinian pea), P. fulvum (red yellow pea), and P. sativum (garden pea), with two subspecies, wild P. sativum subsp. biflorum and cultivated P. sativum subsp. sativum [20,21]. The genus Lens includes seven taxa clustered in four species namely: L. ervoides, L. lamottei, L. nigricans, L. culinaris (L. culinaris subsp. culinaris), L. odemensis (L. culinaris subsp. odemensis), L. orientalis (L. culinaris subsp. orientalis), and L. tomotosus (L. culinaris subsp. tomotosus) [22]. Oppositely, the Vicia genus is a multitudinous taxonomical unit [23], having extensive germplasm resources spanning to 216 species [24]. Until present-day, 84 Vicia, 3 Pisum, and 2 Lens species have had their nuclear DNA content assessed (https://cvalues.science.kew.org/ (accessed on 3 March 2023)), which signifies a limited amount considering the large number of designated Fabeae taxa.
The study of the genome is a significant approach to comprehend the evolutionary mechanisms of plant species [25]. Yet, the knowledge of Fabeae diversity has mainly focused on chromosomal analyses and/or morphological characters [26,27,28,29,30,31,32,33,34,35,36,37]. Moreover, most reports on Fabeae C-value have been provided by Feulgen microdensitometry. In particular, 83 reports for Vicia spp. prime estimates (out of 86) resulted from Feulgen densitometric analysis (https://cvalues.science.kew.org/ (accessed on 3 March 2023)). Indeed, historically in the Kew Plant DNA C-values database, DNA content was regularly assessed by means of Feulgen microdensitometry [38]. Nevertheless, this method is quite slow, laborious, and frequently has limited precision [39]. Due to its increased applicability, accuracy, high throughput, and speed, flow cytometry has gained attention for genome size estimation. [40]. As a result, nowadays flow cytometry has become the ‘gold standard’ methodology employed for calculating C-values and GC content across lineages [41,42]. Accordingly, out of the 12,273 prime estimates registered in the Kew Plant DNA C-values database, 8643 have been calculated via flow cytometry (database accessed in February 2023).
Cyprus is an island located between three continents, a hotspot of biodiversity and within the center of Fabeae taxa origin/domestication [43]. Geographical isolation in correlation to different microclimates, as well as the presence of civilization, trade, and agriculture since antiquity, has contributed to the formation of several unique genotypes across different local crops [44,45,46,47,48,49]. Hence, under an evolutionary prism, and in terms of genetic resources exploration/exploitation, there is a scientific interest for characterizing these indegenous genotypes and the Cypriot gene pool.
The aims of the current study were to provide information in the complex taxonomic Fabeae tribe by delivering precise estimations of the genome size of 29 species (155 accessions/465 plants) collected across Cyprus, the Southernmost European boarder. Multiple accessions per species were employed in order to unravel possible evolutionary insights of genome size, and to assess inter- and intra-genome size variation. Additionally, flow cytometry was evaluated as an analytical method for use in the Cypriot legume germplasm classification.

2. Materials and Methods
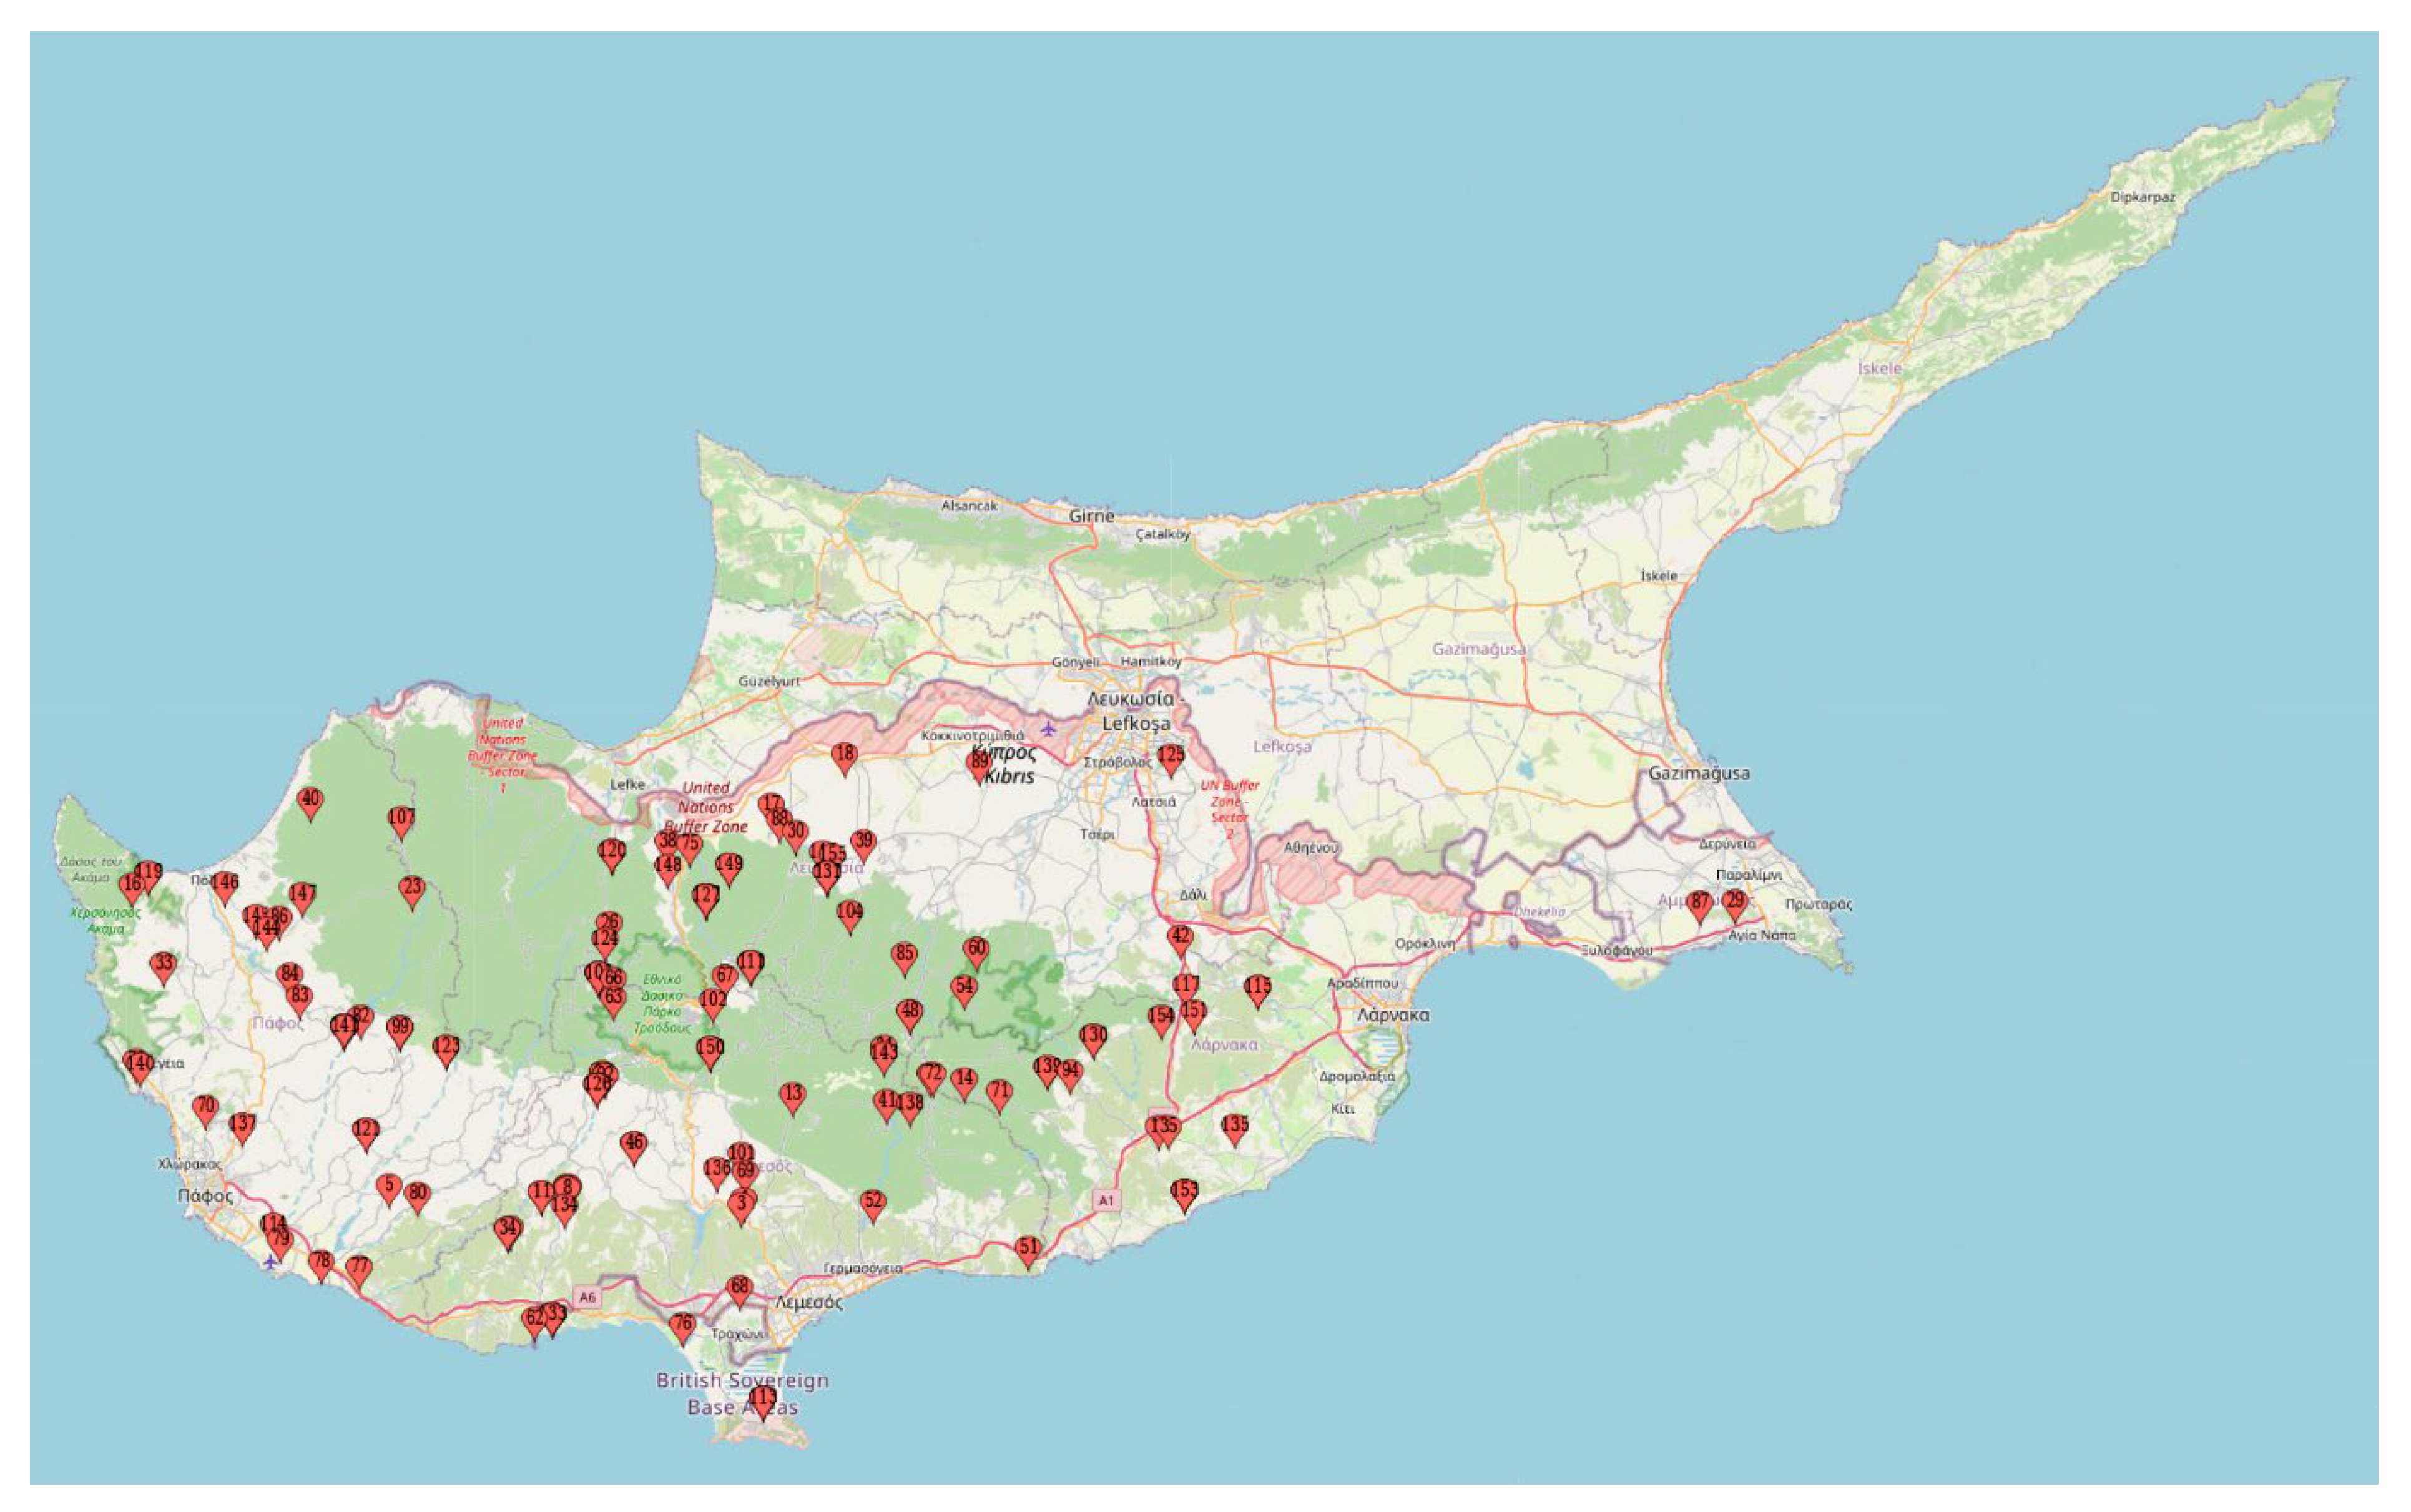
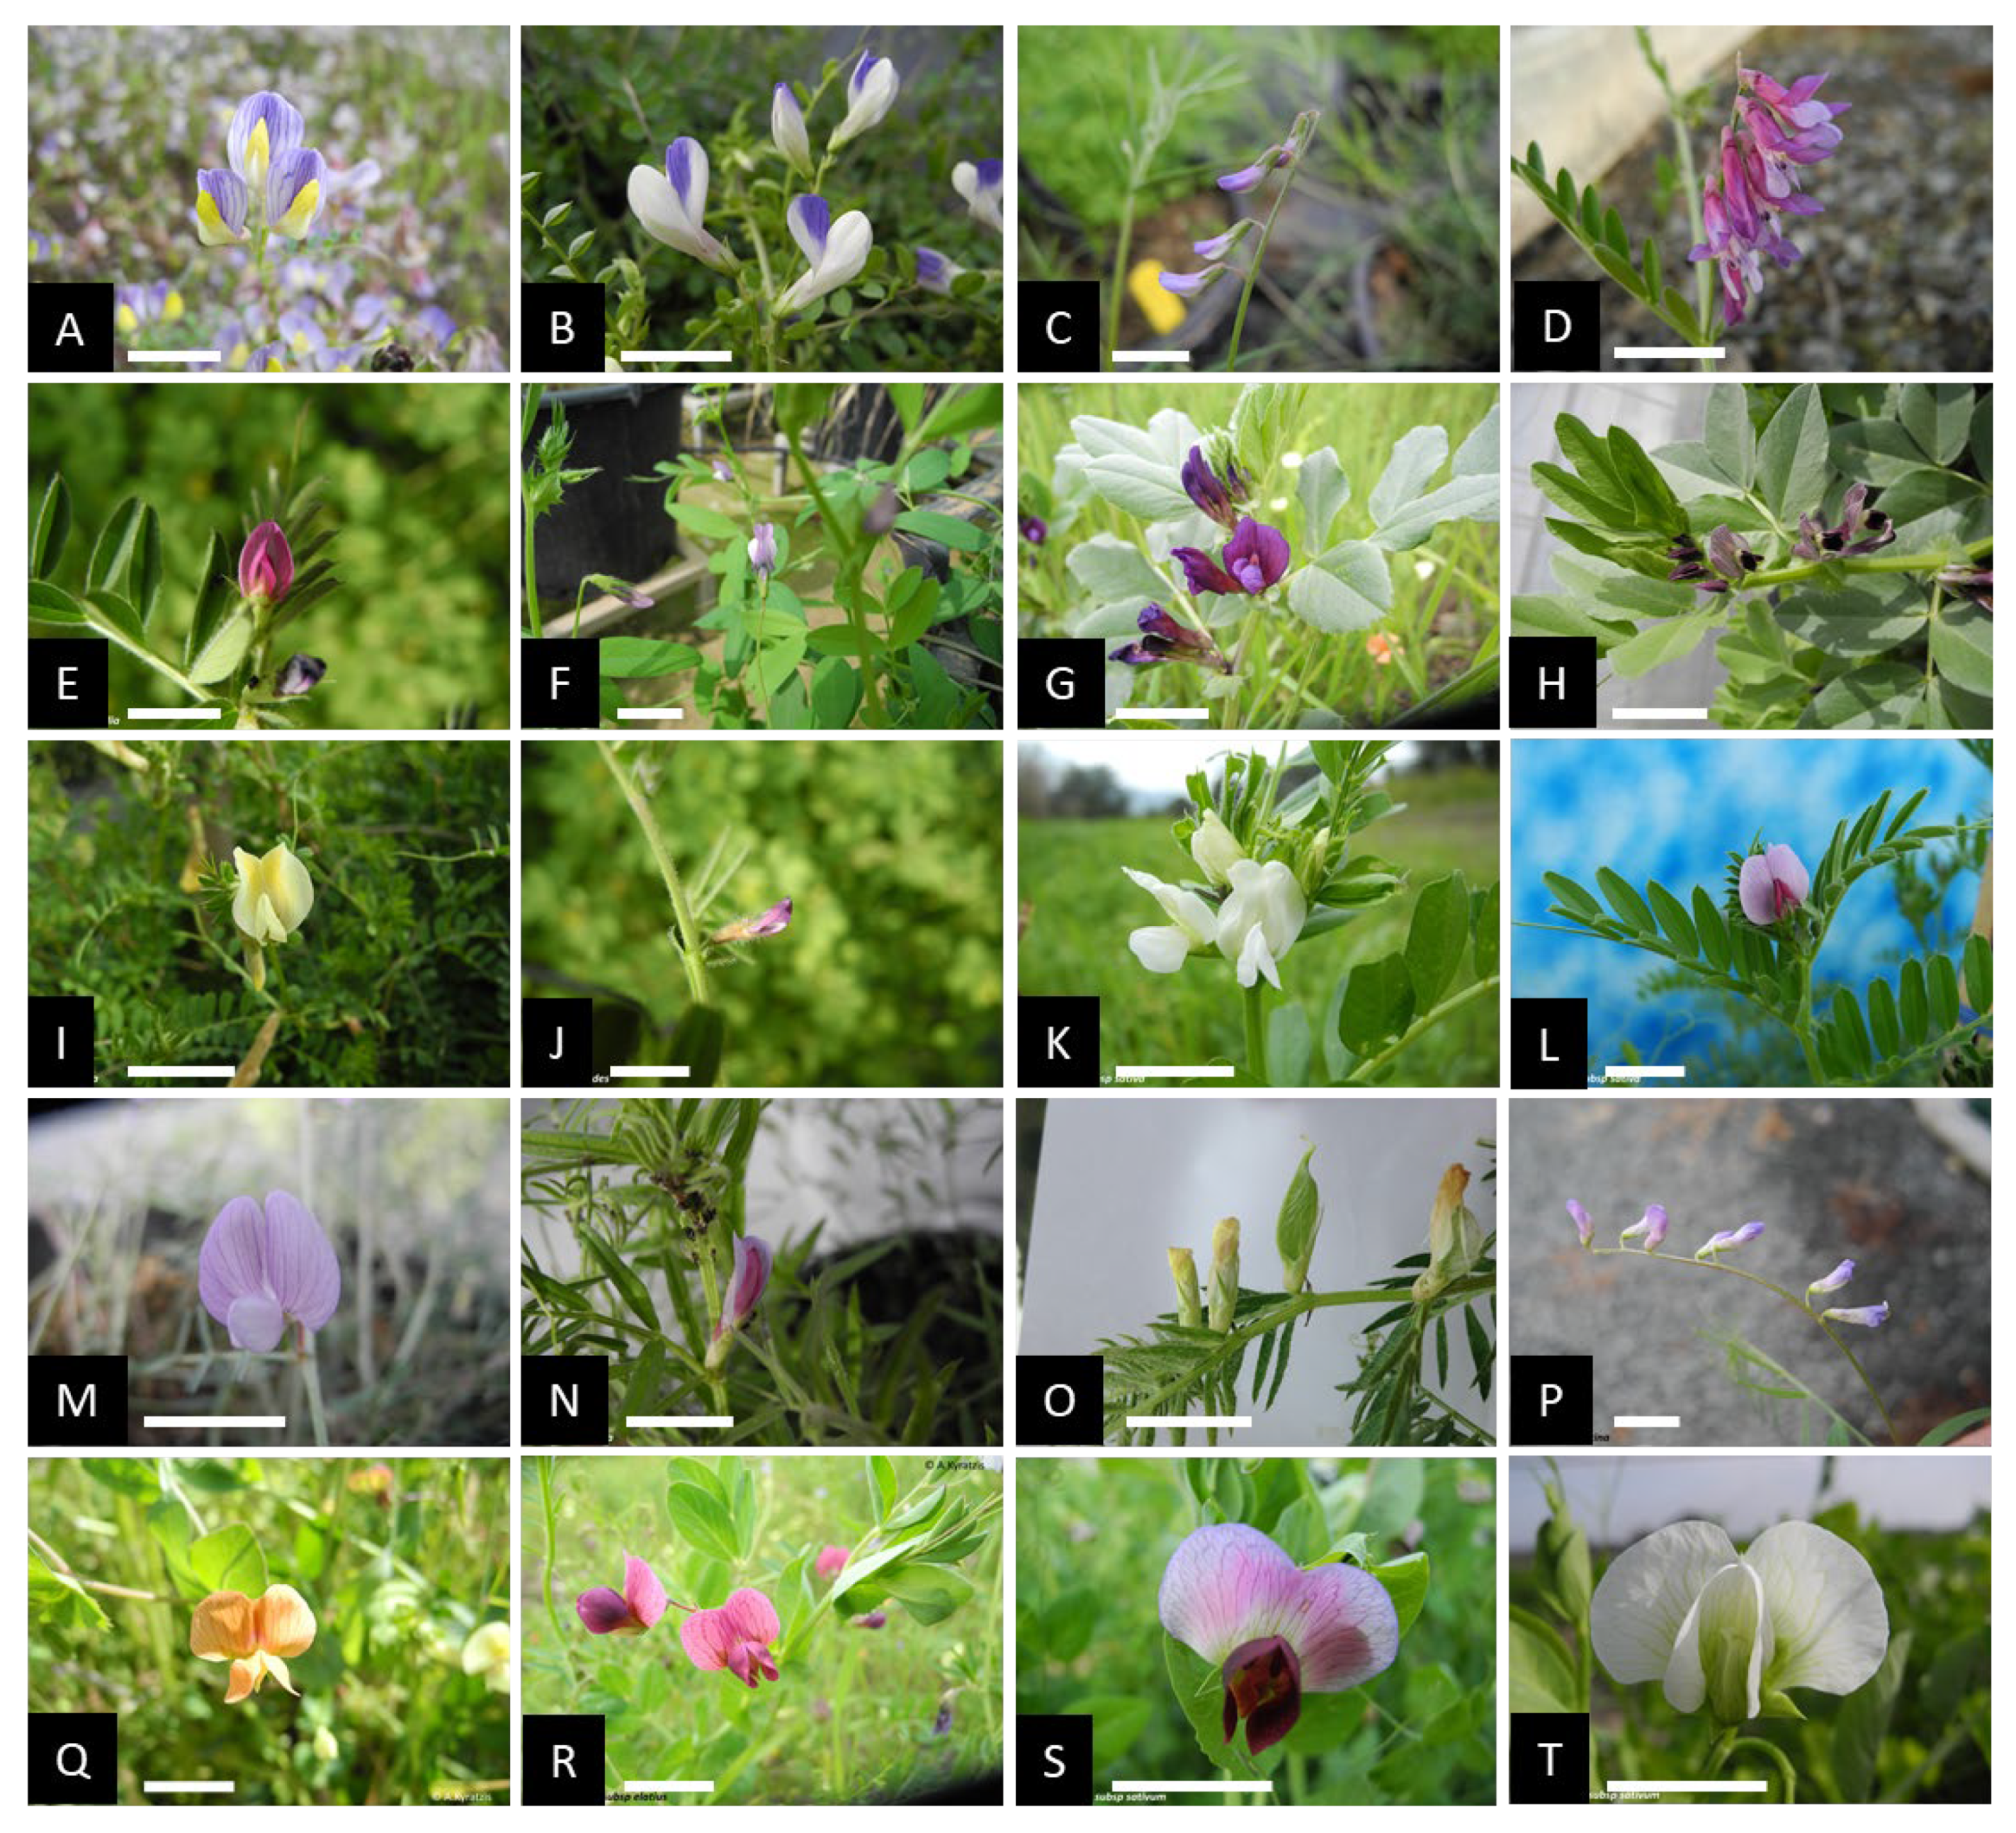
2.1. Plant Material

For the collection of the plant material, a two-year expedition (2019–2020) was directed across regions of Cyprus (Figure 1). Plants were marked in situ (during the flowering period), identified following the flora of Cyprus keys [50,51], and pods from multiple plants across 155 Fabeae populations (Vicia spp., Lens spp. and Pisum spp.) were collected (Supplementary Table S1). Seeds were physically purified and deposited to the Cypriot Genebank/Herbarium (Agricultural Research Institute). Subsequently, seeds were dried to a humidity percentage of approximately 10% and stored at −20 °C. Taxa used as internal flow cytometry standards [52] were provided by Prof Doležel and the Centre of Plant Structural and Functional Genomics (Šlechtitelů 31, Holice, 779 00 Olomouc, Czechia). All internal standards used [Solanum lycopersicon cv. Stupické polní tyčkové rané (1C = 0.98 pg), Glycine max cv. Polanka (1C = 1.25 pg), Zea mays cv. CE-777 (1C = 2.715 pg), Pisum sativum cv. Ctirad (1C = 4.545 pg), and Secale cereale cv. Dankovské (1C = 8.095 pg)] were designated based on genomic size proximity to Fabeae samples but with no-overlapping 2C and/or 4C-values.

2.2. Sample Preparation
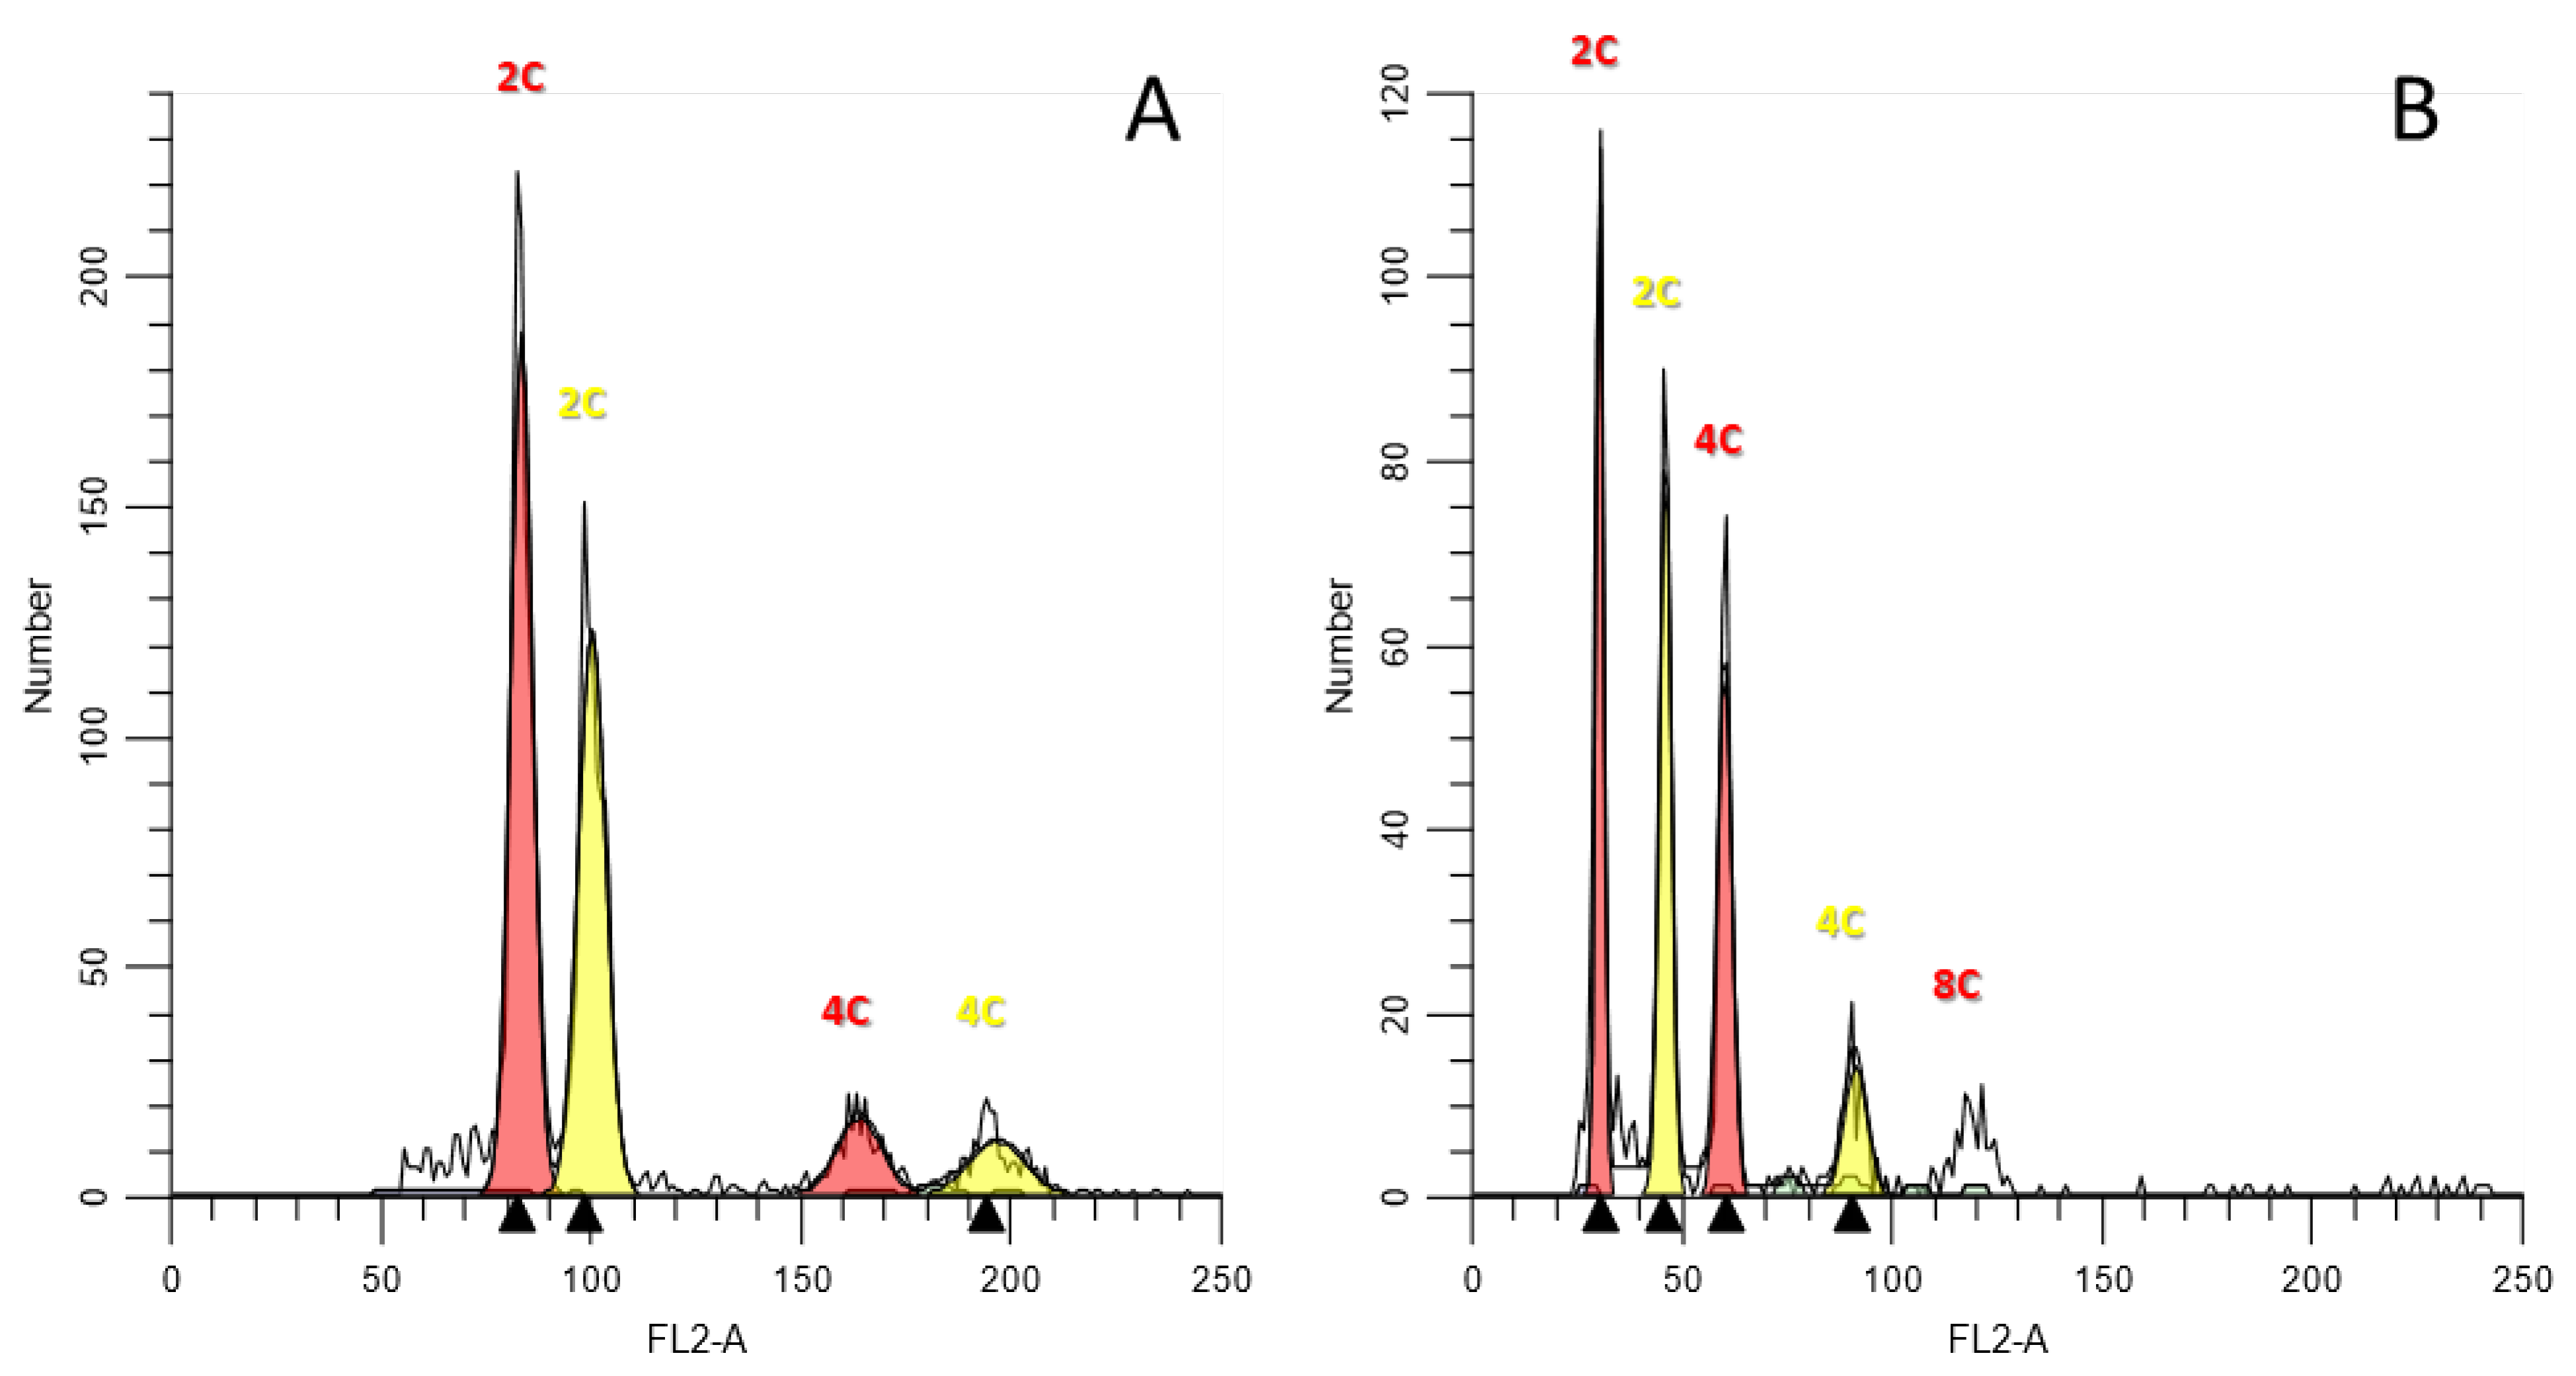
Ten seeds per accession were treated by mechanical scarification and germinated in petri dishes containing moist Whatman® cellulose filter papers. Plantlets were transferred to pots containing a commercial peat/perlite mix and grown in walk-in cabinets at 20–25 °C, under a 16 h day/8 h night photoperiod. Fresh and healthy leaf tissues were collected from young plants (three discrete plants for each accession were used for sampling) and kept between humid paper towels in a fridge until chopping (within the day). A leaf area (roughly 0.5 cm2) of samples and standards were chopped together using a sterile double-edge razor blade for 5 to 10 s in a petri dish (placed on top of ice). Tissues were submerged at all times in one mL of pre-chilled Lysis buffer-LB01 [15 mM Tris, 2 mM Na2EDTA, 0.5 mM spermine tetrahydrochloride, 80 mM KCl, 20 mM NaCl, 0.1% (v/v) Tween-20, 50 µg/mL propidium iodide (PI), 50 µg/mL RNase, and 0.1% ß-mercaptoethanol] as previously reported [53]. Homogenates were passed through 50 μm Celltrics nylon filters (Sysmex, Lincolnshire, IL, USA) into 1.5 mL Eppendorfs and kept at 8 °C for 20 min to enhance staining. In total, 114 Vicia spp., 28 Lens spp. and 13 Pisum spp. accessions were analyzed (Table 1).

2.3. Flow Cytometry

C-values were assessed utilizing an Accuri C6 flow cytometer (Accuri Cytometers, Inc., Ann Arbor, MI, USA), following a previously described procedure [55]. Analysis was based on light-scatter and fluorescence signals emitted from a 20-mW laser illumination at 488 nm. The precision of the cytometer was established using 6-peak Spherotech fluorescent beads, as indicated by the vender (CFlow User Guide, Accuri, Franklin Lakes, NJ, USA). Double threshold levels were determined (80,000 on FSC-H and 1000 FL-2) to exclude irrelevant debris from detection. Fluidics were set on slow, and measurements were accumulated to an overall number of 3000 nuclei. The areas of nuclei were diagonally gated using an FL3-A/FL2-A plot and peaks were displayed via a count events/FL2-A plot. For each accession, three different measures were performed for three consecutive days. Replicates were well reproducible having minor systematic errors. Flow files were exported and analyzed using Modfit LT version 5.0 (Verity Software House, Topsham, ME, USA) to identify modelled peaks and calculate C-values. The flow histograms displayed crisp peaks, having low coefficient of variation (<5%).

2.4. C-Value Character Evolution

Fabeae sequences for internal transcribed spacers (ITS1-5.8S-ITS2) were identified using the nucleotide database of NCBI (https://www.ncbi.nlm.nih.gov/nucleotide/ (accessed on 3 March 2023)). Twenty-seven discrete sequences were selected and downloaded in Fasta format. Following acquisition, a multiple alignment was conducted (using the MUSCLE algorithm/Gblocks alignment curation). For the construction of the phylogenetic tree, a maximum likelihood approach was selected and implemented using a PhyML approach. The single dendrogram produced was visualized with TreeDyn and exported as a nexus file. The mesquite V3.70 suite (www.mesquiteproject.org (accessed on 3 March 2023)) was employed to embed C-values as a continuous character, and to perform parsimony analysis for linking DNA content to the Fabeae evolutionary history (using the nexus dendrogram file as an input).

2.5. Statistical Analyses
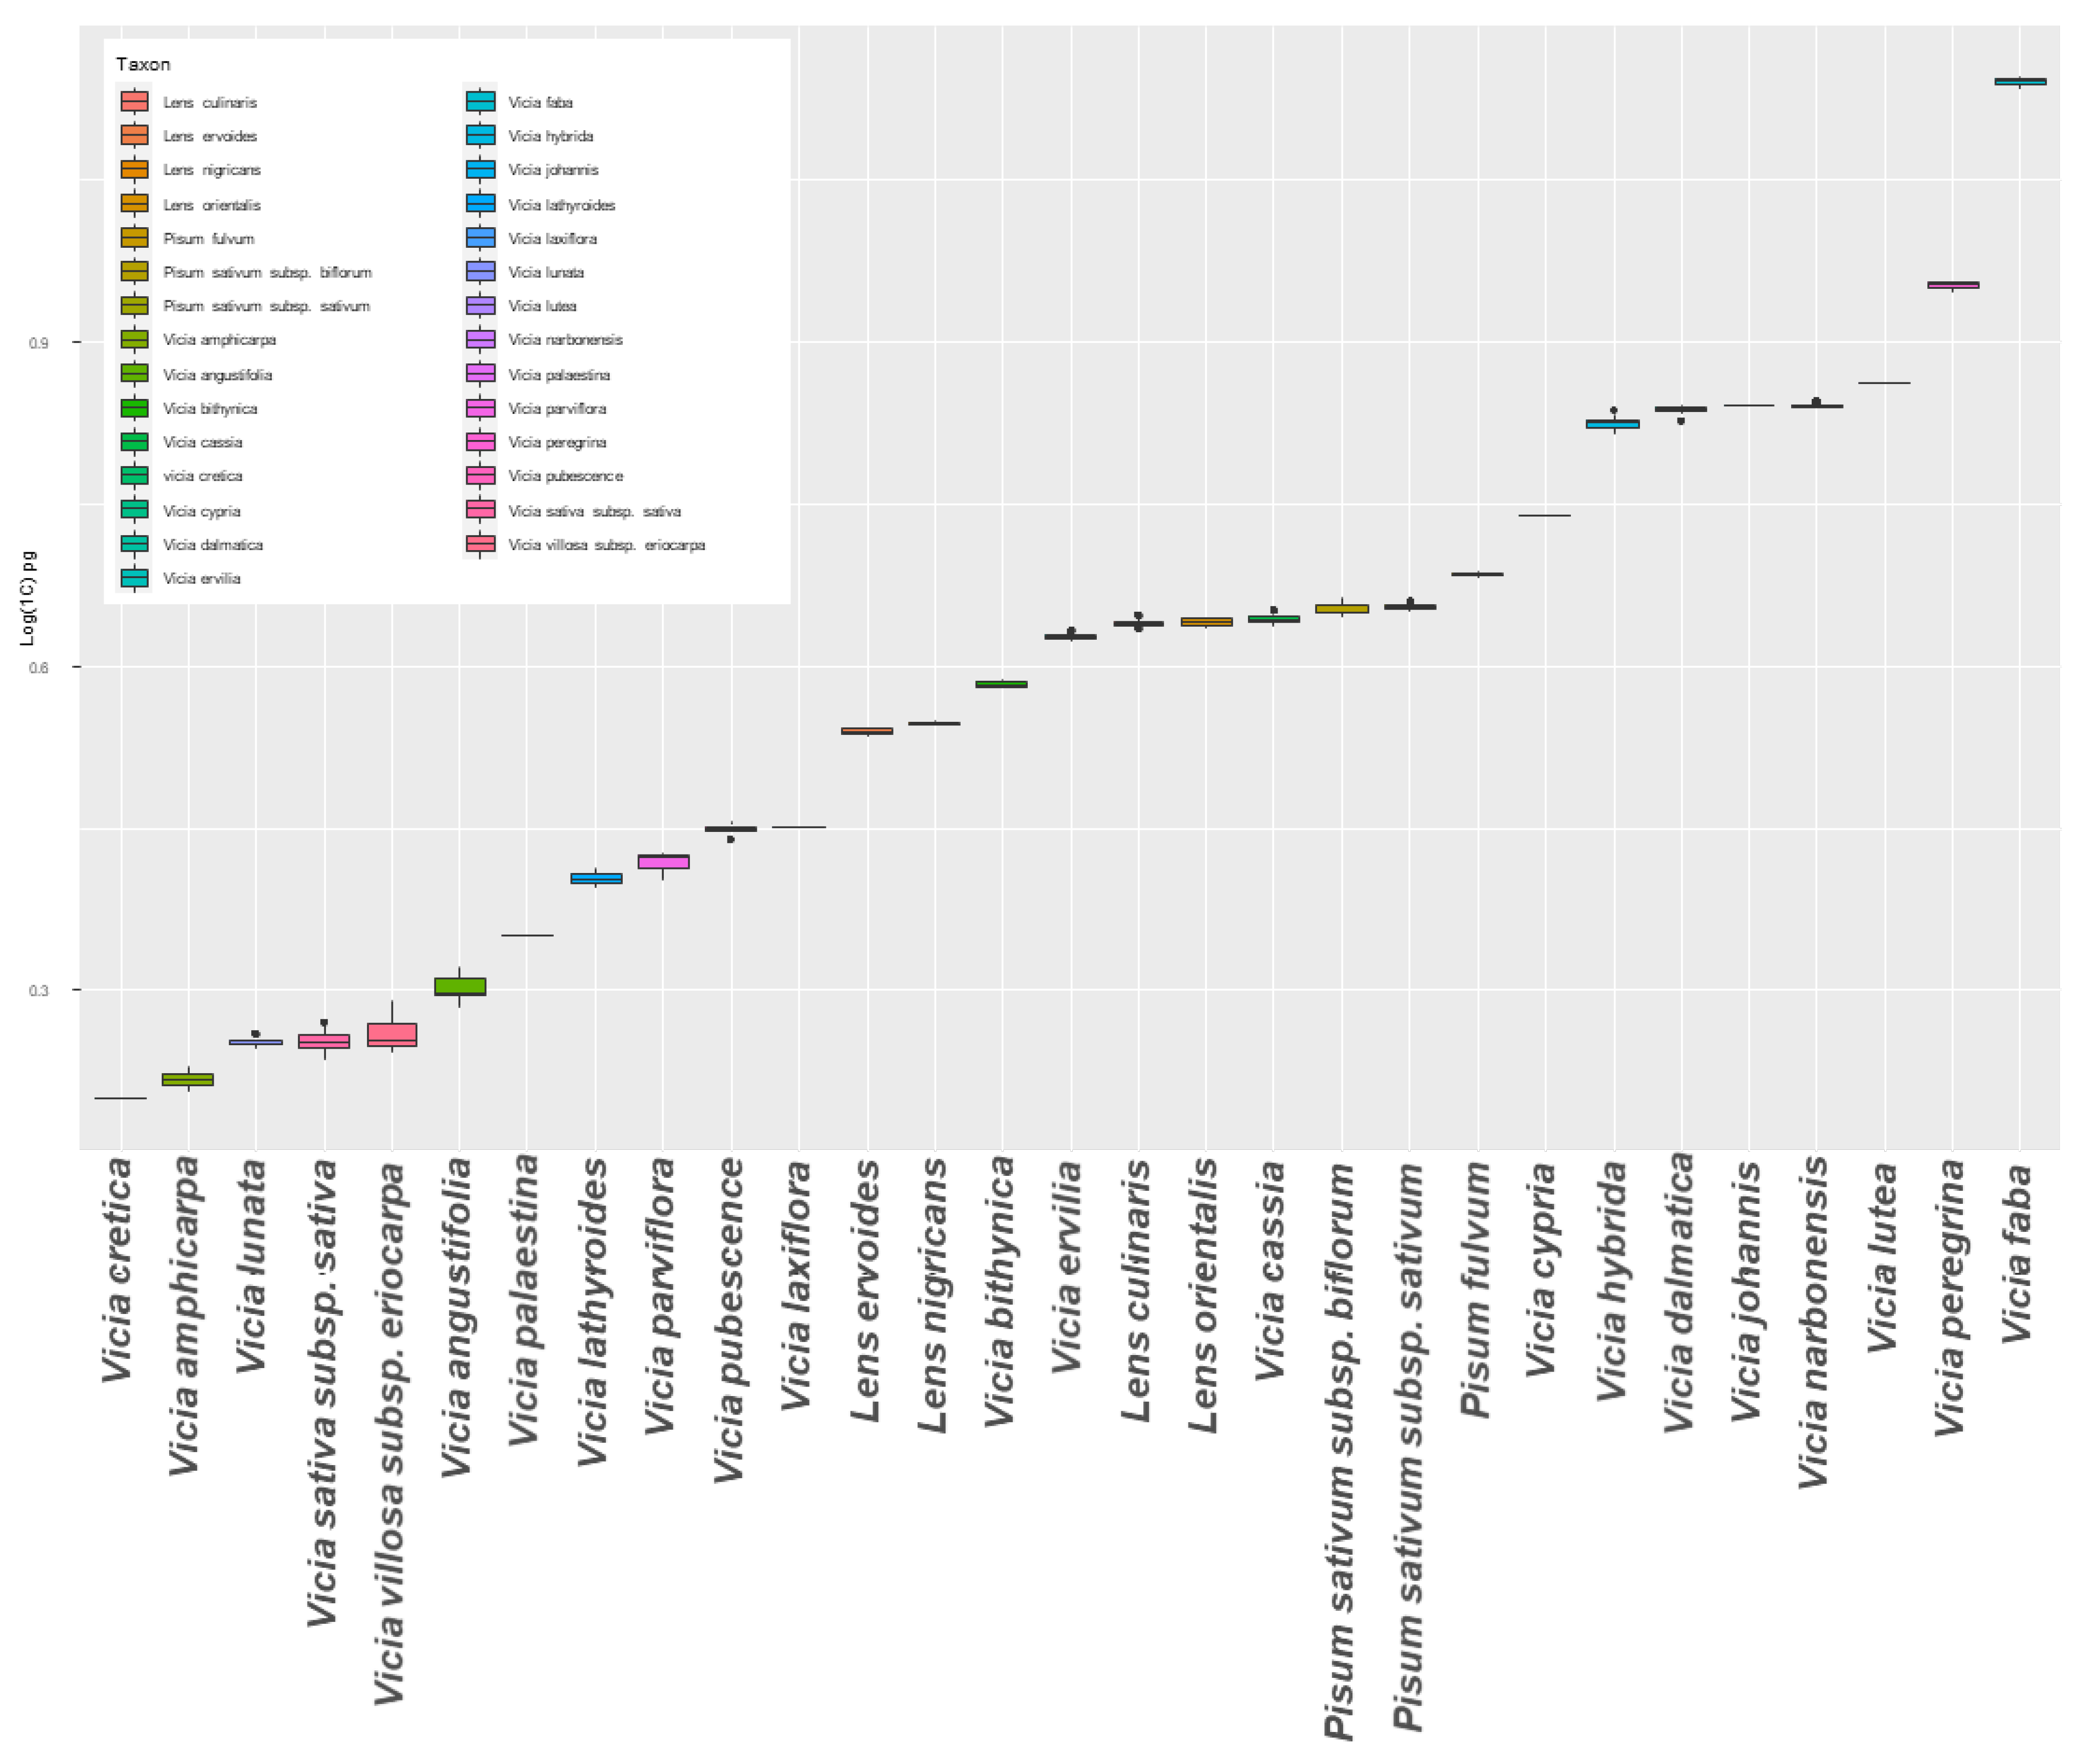
C-value means and standard deviations were calculated for each species (across accessions) and reported in Table 1. To perform a linear regression, residuals were used to examine the uniformity of variance and relevant fit to a normal distribution (Supplementary Figure S1). Differences across species, considering accessions as replicates, were analyzed using a one-way ANOVA test and two post-hoc analyses: Tukey’s honest significant difference (HSD) test, and least significant difference (LSD) test. Rstudio (Version 1.1.463) and the agricolae package were employed for the analyses. Three biological replications (nine discrete plants within the accession) were employed for the analysis for species for which only one population was found in Cyprus.

3. Results

For the present study, several hundred Fabeae plants were collected across Cyprus (Figure 1). For species identification and characterization, keys reported in Meikle [50] and ‘the flora of Cyprus’ site (https://www.flora-of-cyprus.eu/ (accessed on 3 March 2023)) were followed. The Cypriot Fabeae germplasm was found rich in diversity (Figure 2) and morphological characters allowed the unambiguous identification of 29 species. Three plants from each population/accession (totaling 455 plants) were co-analyzed by means of flow cytometry and PI staining. Estimated C-values across taxa were calibrated to the genome size of proper reference internal standards (Table 1). Across all cases, the 2C peak (FL2-A axis) of each standard was detected within the 2C and 4C peak range of the Fabeae sample, or vice versa, contributing to precise DNA content estimations (Figure 3).
The FL2-A histograms of nuclear DNA content generally displayed a single distinct peak, matching to the G1 phase nuclei (2C-value), and a lower peak corresponding to G2 phase nuclei (4C-value). The analysis of distributions revealed that the vast majority of nuclei were at the G0/G1 cell cycle (Figure 3A). In some instances, higher than 4C ploidy levels were recorded and assigned to endopolyploidy cells (Figure 3B). High-resolution histograms were generated across replicates having a 2C peak coefficient of variation (CV) repeatably lower than 5%. Average CVs between biological replications on three consecutive days (using the same buffer lot) was also low (approximately 1.5%), suggestive of accurate measurements.
The 1C genome size across 155 Fabeae accessions was estimated (on average) for three consecutive days (Supplementary Table S1). It was determined that mean 1C genomic size for individual taxa varied almost ten-fold, ranging from 1.584 ± 0.007 pg for V. cretica (ARI02420) to 13.983 ± 0.046 pg for V. faba (ARI00187). The lowest CV across accessions was detected for V. dalmatica ARI01835 (0.08), and the higher for V. sativa subsp. sativa ARI00307 (3.82).
DNA 1C-values from discrete accessions (spanning from 1 to 17) were subsequently used in order to calculate mean genomic size and standard deviation at the species level (Table 1). Among species, the most homogenous genome size was recorded for V. laxiflora having a CV of 0.106, while the greatest heterogenicity was found in V. villosa subsp. eriocarpa that had a CV of 4.114.
The residuals of a model fitting were reviewed to test for equal variances across accessions (Supplementary Figure S1). It was established that systematic bias regarding variances was not evident; consequently, equal variances were assumed for post hoc analyses (HSD and LSD tests). The box plot of increasing genome sizes (Figure 4) depicted that within species DNA content variation was frequently insignificant; hence, taxa were correctly assigned to species. Pisum fulvum was clearly distinguished from P. sativum subsp. biflorum and P. sativum subsp. sativum. Still, across several species, post hoc analyses revealed that there is genomic size overlapping; thus, C-values cannot always be used as stand-alone traits for species assignment. Particularly, V. dalmatica, V. johannis, and V. narbonensis were assigned at the same genomic content group (Table 1; Figure 4). Lens ervoides and L. nigricans were also of equal genomic size, but these were clearly demarcated from L. culinaris that had a larger value. Also, V. laxiflora and V. pubescence were found comparable, having an average C-value of approximately 2.8 pg/1C. Vicia lunata, V. sativa subsp. Sativa, and V. villosa subsp. eriocarpa had similar genomic sizes (Table 1).
The current study reports novel genomic estimations of Fabeae taxa using flow cytometry. Still, a correlation to previously reported C-values was attempted (Figure 5). It was established that 1C-values presented here agree with previously published values (obtained with flow cytometry as well as Feulgen cytophotometry). Nevertheless, we found that the Feulgen technique tends to be equivalent when compared to PI flow cytometry (Table 1). Despite small discrepancies, a highly significant correlation was established across the 20 common species analyzed. Remarkably, the only substantial variance was observed for V. dalmatica where we recorded an almost 50% greater value than previous reports. Interestingly, V. dalmatica is a perennial plant in Cyprus and can only be found at high altitude habitats (above 800 m).
A discrete parsimony optimization analysis was subsequently performed using the mesquite software suite. The ancestral character evolution projection indicated that C-values of Fabeae genome size followed an increasing rather than decreasing pattern. Moreover, substantial genomic augmentation mainly occurred in V. faba and V. peregrina as well as in taxa grouped to the C-clade (Figure 6). Nonetheless, it seems that the Fabeae tribe also had several independent ‘upsizing’ events across other lineages (A and B). Nonetheless, genome size was not found to be associated with any phylogenetic lineage or evolutionary driver.

4. Discussion

Legumes include crops that are cultivated on a significant area of global arable land (12–15%) and account for approximately 27% of the world’s primary crop production [56]. Within the leguminosae family, the Fabeae tribe is constituted by five genera, comprising 380 species which hold agricultural significance. These mainly refer to lentil (Lens culinaris), broad bean (Vicia faba), domesticated vetches (mainly Vicia sativa and Vicia ervilia), and pea (Pisum sativum) [57]. Besides the current significant agronomic status, these species were also of immense importance since antiquity and have been utilized alongside major domesticated crops (barley, wheat and flax) in the fertile crescent [58]. Faba beans specifically have been used, not only as food, but were intertwined with the archaic Mediterranean history and tradition [59]. In the birthplace of democracy (Ancient Greece), broad beans were used for casting votes (white beans signified a positive vote, and black/brown beans stood for a negative vote). Even today, the expression ‘koukiá’ (meaning ‘broad beans’ in Greek) is informally used, denoting votes. Faba beans were also used as ‘food for the dead’ in the Lemuria festival throughout the classical Roman era.
Nowadays, Fabeae taxa span virtually to a worldwide grid, but the main source of genetic diversity is still found within Eastern Mediterranean that is considered the center of origin/domestication for these lineages [24]. Cyprus is within the domestication region and a geographical boundary/cut-off point for three continents (Europe, Africa and Asia). Its position and diverse microclimatic types has established the island as a hot spot for plant biodiversity, despite its small size [49,51].
Until the present, more than 2000 discrete plant species have been recorded in Cyprus while the endemism rate of indigenous species reaches approximately 9% [60]. A large proportion of Cypriot plants belongs to the Leguminosae family, but remains uncharted. In an attempt to study the vast genetic resources of agronomically important taxa belonging to the Fabeae tribe, we organized a collection for vetch, lentil, and pea crops wild relatives/landraces. In total, we analyzed 465 plants (155 populations/29 species) by using PI flow cytometry. An estimation of the Cypriot Fabeae genome size variety and the suitability of the technique for Fabeae species characterization was established.
In general, two fluorochromes have been widely employed for determining C-values in plants: DAPI and PI. DAPI is a base-specific dye (AT specific), while PI is an intercalating fluorochrome and has been used to quantify DNA content without the bias of AT/GC base content [61]. Hence, PI has been suggested as the optimal fluorochrome for genome size surveys [62]. In the current study, the adaptation of the LB1 buffer/PI staining protocol proved adequate for the analysis of the Cypriot Fabeae species, providing precise and accurate histograms (CVs lower than 5%) similar to previous studies [25,63,64].
Across the 29 species studied, a remarkable fluctuation of genome size was noted for Vicia spp. while Lens spp. and Pisum spp. were found rather homogeneous (Figure 4). Vicia cretica had the smallest genome (1.584 ± 0.007 pg/1C), while V. faba DNA content was found to be approximately ten-fold larger, reaching to a mean of 13.829 ± 0.11 pg/1C (Table 1). This great variation in the Fabeae tribe is not unprecedented. Castiglione and colleagues [32] reported that in terms of both chromosome complement and DNA size, C-values in the Vicia spp. complex were clearly heterogeneous. Specifically, for species of the Atossa and Wiggersia sections, DNA content had a 2-fold difference despite identical chromosome numbers. In the current study, the majority of taxa could be identified via flow cytometry by using two post-hoc statistic tests (Table 1). Nonetheless, there were cases where DNA size overlapping occurred across lineages.
Still, the relationship among Vicia species and its classification has been controversial, since more than 20 taxonomic revisions have been reported since Linneus [65]. For instance, V. sativa has been regarded as an aggregate of diverse taxa [26] that was given species rank, while six other taxa were denoted at the subspecies level within V. sativa (1. subsp. amphicarpa (L.) Batt., 2. subsp. cordata (Wulfen ex Hoppe), Asch. & Graebner, 3. subsp. macrocarpa (Moris) Arcang., 4. subsp. angustifolia L., 5. subsp. sativa., 6. subsp. segetalis (Thuill.) Gaudin). Indeed, in the current study, V. sativa was found to be quite heterogeneous since 1C-values varied from 1.726 to 1.999 pg/1C. Nonetheless, V. amphicarpa and V. angustifolia were clustered within different groups from V. sativa subsp. sativa (Table 1), supporting a discrete species assignment. Another taxonomic revision [27] considers V. narbonensis as a complex containing V. johannis, V. narbonensis, and V. bithynica. In the current work it was established that, in terms of DNA content, V. johannis (6.935 ± 0.014 pg/1C) and V. narbonensis (6.949 ± 0.034 pg/1C) were grouped together while V. bithynica (3.834 ± 0.035 pg/1C) was clearly demarcated from the former.
Screening of the Kew Plant C-values database revealed that several data presented here are novel (data for L. ervoides, L. nigricans, L. orientalis, V. cassia, V. cretica, V. cypria, V. laxiflora, and V. parviflora), while other are reported for the first time using flow cytometry (data for V. amphicarpa, V. angustifolia, V. bithynica, V. ervilia, V. hybrida, V. johannis, V. lathyroides, V. lunata, V. lutea, V. narbonensis, V. palaestina, V. peregrina, and V. pubescens). A comparison between C-values for species available in the Kew database, as well as the present study was attempted (Figure 5). A high correlation (R² = 0.947) was confirmed across species, except V. dalmatica.
Several reasons can cause C-values discrepancies in genome size assessments. Notable variances in flow cytometry protocols, the use of frozen or lyophilized tissues, different fluorochromes, as well as different internal standards [25]. Nonetheless, we found that all six Cypriot V. dalmatica accessions had approximately 50% more DNA content (6.872 ± 0.081 pg/1C) compared to previous studies reporting an 1C-value ranging from 3.24 to 4.10 pg [66,67,68]. As a result, such discrepancies cannot be attributed to methods variations but must be based on a diverse/discrete genetic background. Vicia dalmatica, is a perennial Vicia species in Cyprus and can only be found in the Troodos Mountain region (from 800 m up to 1400 m). As a result, it must sustain extreme conditions, which include cold winter and hot and dry summer with annual temperatures commonly varying from 0 °C to 30 °C. Abiotic stressors have been recently implicated in genome size fluctuation and evolutionary trade-offs [69,70,71,72]. Recently it was also reported that genome size in plants can influence the stress tolerance of invasive and native plants via genomic plasticity [69]. Carta and Angelino also found that plant traits are interconnected with climate seasons and habitat in lilies and that genome size increase is controlled by climate seasonality [73]. Moreover, it was recently established that the Ogre retrotransposon Ty3/gypsy family has a significant part in the genomic size evolution within the Fabeae tribe, causing genomic upsizing [3].
Following C-value estimations, we also attempted to model the DNA size evolutionary trait in correlation to phylogenetic routes, based on internal transcribed spacers. Simulated ancestral states grounded on parsimony were depicted showing a complex evolutionary history (Figure 6). Based on C-value character development it seems that genomic size fluctuated independently to the evolution and diversification of the Fabeae species. The main genomic augmentation was found in the clade of V. faba and V. peregrina that were also genetically affiliated. In contrast, there were also instances when a genomic downsizing from ancestral nodal routes was evident. Independence of C-values and genetic relationships has also been reported for Vicia spp. at the karyotypic level.
The basic numbers of Vicia chromosomes are X = 5, 6, or 7. Thus, there is an exclusive variety and karyotypic diversity across diploid taxa (2n = 2x = 10, 2n = 2x = 12, and 2n = 2x = 14, respectively), making the genus a unique model of karyotypic evolution [74]. However, plants with different basic chromosome numbers exist even at the species level (all basic numbers of chromosomes have been reported for V. sativa, V. amphicarpa, and V. lathyroides) [75].
Concluding, the DNA content reported for several taxa of the Fabeae tribe of Cyprus can be used as a reliable standard and contribution to a further depiction of the evolutionary associations amongst these agronomically important species. Moreover, these C-values can be a guide map of breeding efforts regarding such distinctive germplasm. Despite the fact that Leguminosae taxa belong to one of the most widespread families, there are still several gaps regarding our knowledge on legumes and crop wild relatives (CWRs). Specifically, focus on local CWRs and their extraordinary genetic diversity/genome size variation could facilitate precise and imminent decisions on plant genetic resources utilization and preservation.

Supplementary Materials

The following supporting information can be downloaded at: https://www.mdpi.com/article/10.3390/plants12071469/s1, Table S1: Accessions, C-values and Coordinates of the Fabeae taxa; Supplementary Figure S1: Residuals analysis for the Fabeae species.

Author Contributions

Conceptualization, N.N.; methodology, N.N. and A.C.K.; software, N.N. and M.H.; validation, N.N., M.H. and A.C.K.; formal analysis, N.N. and M.H.; investigation, I.C., N.I., A.C.K. and D.K.; resources, N.N.; data curation, N.N. and M.H.; writing—original draft preparation, N.N.; writing—review and editing, N.N., M.H. and A.C.K.; visualization, N.N. and M.H.; supervision, N.N.; project administration, N.N.; funding acquisition, N.N. and A.C.K. All authors have read and agreed to the published version of the manuscript.

Funding

This research received no external funding.

Data Availability Statement

All relevant data are within the paper and its Supplementary Materials.

Conflicts of Interest

The authors declare no conflict of interest.

References

  1. Thomas, C.A., Jr. The genetic organization of chromosomes. Annu. Rev. Genet. 1971, 5, 237–256. [Google Scholar] [CrossRef]
  2. Klein, S.P.; Anderson, S.N. The evolution and function of transposons in epigenetic regulation in response to the environment. Curr. Opin. Plant Biol. 2022, 69, 102277. [Google Scholar] [CrossRef] [PubMed]
  3. Macas, J.; Novak, P.; Pellicer, J.; Cizkova, J.; Koblizkova, A.; Neumann, P.; Fukova, I.; Dolezel, J.; Kelly, L.J.; Leitch, I.J. In depth characterization of repetitive DNA in 23 plant genomes reveals sources of genome size variation in the legume tribe fabeae. PLoS ONE 2015, 10, e0143424. [Google Scholar] [CrossRef]
  4. Fleischmann, A.; Michael, T.P.; Rivadavia, F.; Sousa, A.; Wang, W.; Temsch, E.M.; Greilhuber, J.; Müller, K.F.; Heubl, G. Evolution of genome size and chromosome number in the carnivorous plant genus Genlisea (Lentibulariaceae), with a new estimate of the minimum genome size in angiosperms. Ann. Bot. 2014, 114, 1651–1663. [Google Scholar] [CrossRef] [Green Version]
  5. Pellicer, J.; Fay, M.F.; Leitch, I.J. The largest eukaryotic genome of them all? Bot. J. Linn. Soc. 2010, 164, 10–15. [Google Scholar]
  6. Talukdar, D. Leguminosae. Brenner’s Encycl. Genet. Second Ed. 2013, 2, 212–216. [Google Scholar]
  7. Vižintin, L.; Javornik, B.; Bohanec, B. Genetic characterization of selected Trifolium species as revealed by nuclear DNA content and ITS rDNA region analysis. Plant Sci. 2006, 170, 859–866. [Google Scholar] [CrossRef]
  8. Bennett, M.D.; Smith, J.B.; Heslop-Harrison, J.S.; Riley, R. Nuclear DNA amounts in angiosperms. Proc. R. Soc. London. Ser. B Biol. Sci. 1997, 216, 179–199. [Google Scholar]
  9. Tacke, R.; Ecke, W.; Höfer, M.; Sass, O.; Link, W. Fine-mapping of the major locus for vicine and convicine in faba bean (Vicia faba) and marker-assisted breeding of a novel, low vicine and convicine winter faba bean population. Plant Breed. 2022, 141, 644–657. [Google Scholar]
  10. Aguilar-Benitez, D.; Casimiro-Soriguer, I.; Maalouf, F.; Torres, A.M. Linkage mapping and QTL analysis of flowering time in faba bean. Sci. Rep. 2021, 11, 13716. [Google Scholar]
  11. Carrillo-Perdomo, E.; Vidal, A.; Kreplak, J.; Duborjal, H.; Leveugle, M.; Duarte, J.; Desmetz, C.; Deulvot, C.; Raffiot, B.; Marget, P.; et al. Development of new genetic resources for faba bean (Vicia faba L.) breeding through the discovery of gene-based SNP markers and the construction of a high-density consensus map. Sci. Rep. 2020, 10, 6790. [Google Scholar] [CrossRef] [Green Version]
  12. Yang, T.; Jiang, J.; Zhang, H.; Liu, R.; Strelkov, S.; Hwang, S.-F.; Chang, K.-F.; Yang, F.; Miao, Y.; He, Y.; et al. Density enhancement of a faba bean genetic linkage map (Vicia faba) based on simple sequence repeats markers. Plant Breed. 2019, 138, 207–215. [Google Scholar] [CrossRef]
  13. Ma, L.; Wang, X.; Yan, M.; Liu, F.; Zhang, S.; Wang, X. Genome survey sequencing of common vetch (Vicia sativa L.) and genetic diversity analysis of Chinese germplasm with genomic SSR markers. Mol. Biol. Rep. 2022, 49, 313–320. [Google Scholar] [CrossRef]
  14. Yuan, X.; Wang, Q.; Yan, B.; Zhang, J.; Xue, C.; Chen, J.; Lin, Y.; Zhang, X.; Shen, W.; Chen, X. Single-Molecule Real-Time and Illumina-Based RNA Sequencing Data Identified Vernalization-Responsive Candidate Genes in Faba Bean (Vicia faba L.). Front. Genet. 2021, 12, 656137. [Google Scholar] [CrossRef] [PubMed]
  15. Martos-Fuentes, M.; Egea-Gilabert, C.; Mezaka, I.; Fernández, J.A.; Egea-Cortines, M.; Weiss, J. Distance analysis among northern and southern European legume accessions using next-generation sequencing reveal discrepancies between geographic and genetic origins. Sci. Hortic. 2019, 243, 498–505. [Google Scholar]
  16. Varshney, R.K.; Glaszmann, J.-C.; Leung, H.; Ribaut, J.-M. More genomic resources for less-studied crops. Trends Biotechnol. 2010, 28, 452–460. [Google Scholar] [CrossRef] [Green Version]
  17. Gregory, R.T. Preface: The Evolution of the Evolution of the Genome. In The Evolution of the Genome; Academic Press: Cambridge, MA, USA, 2005; pp. vii–xi. [Google Scholar]
  18. Pellicer, J.; Leitch, I.J. The Plant DNA C-values database (release 7.1): An updated online repository of plant genome size data for comparative studies. New Phytol. 2020, 226, 301–305. [Google Scholar] [CrossRef] [PubMed] [Green Version]
  19. Rees, H.; Cameron, F.M.; Hazarika, M.H.; Jones, G.H. Nuclear Variation between Diploid Angiosperms. Nature 1966, 211, 828–830. [Google Scholar] [CrossRef] [PubMed]
  20. Soldano, A. Riproposizione di taxa sottospecifici prioritari dovuti a botanici italiani. Natura Bresciana 1992, 27, 51–56. [Google Scholar]
  21. Maxted, N.; Ambrose, M. Peas (Pisum L.). In Plant Genetic Resources of Legumes in the Mediterranean. Current Plant Science and Biotechnology in Agriculture; Springer: Dordrecht, The Netherlands, 2001; Volume 39, pp. 181–190. [Google Scholar]
  22. Wong, M.M.L.; Gujaria-Verma, N.; Ramsay, L.; Yuan, H.Y.; Caron, C.; Diapari, M.; Vandenberg, A.; Bett, K.E. Classification and Characterization of Species within the Genus Lens Using Genotyping-by-Sequencing (GBS). PLoS ONE 2015, 10, e0122025. [Google Scholar] [CrossRef] [Green Version]
  23. Wu, F.-F.; Gao, Q.; Liu, F.; Wang, Z.; Wang, J.-L.; Wang, X.-G. DNA barcoding evaluation of Vicia (Fabaceae): Comparative efficacy of six universal barcode loci on abundant species. J. Syst. Evol. 2020, 58, 77–88. [Google Scholar] [CrossRef]
  24. Schaefer, H.; Hechenleitner, P.; Santos-guerra, A.; De Sequeira, M.M.; Pennington, R.T.; Kenicer, G.; Carine, M.A. Systematics, biogeography, and character evolution of the legume tribe Fabeae with special focus on the middle-Atlantic island lineages. BMC Evol. Biol. 2012, 12, 250. [Google Scholar] [CrossRef] [Green Version]
  25. Carvalho, G.M.A.; Carvalho, C.R.; Soares, F.A.F. Flow cytometry and cytogenetic tools in eucalypts: Genome size variation × karyotype stability. Tree Genet. Genomes 2017, 13, 106. [Google Scholar] [CrossRef]
  26. Van De Wouw, M.; Maxted, N.; Ford-Lloyd, B.V. A multivariate and cladistic study of Vicia L. ser. Vicia (Fabaceae) based on analysis of morphological characters. Plant Syst. Evol. 2003, 237, 19–39. [Google Scholar] [CrossRef]
  27. Bennett, S.J.; Maxted, N. An ecogeographic analysis of the Vicia narbonensis complex. Genet. Resour. Crop Evol. 1997, 44, 411–428. [Google Scholar] [CrossRef]
  28. Tabur, S.; Cesur, A.; Özkul, H. Karyology of seven fabaceae taxa from Turkey. J. Appl. Biol. Sci. 2009, 3, 45–49. [Google Scholar]
  29. Naranjo, C.A.; Ferrari, M.R.; Palermo, A.M.; Poggio, L. Karyotype, DNA content and meiotic behaviour in five South American species of Vicia (Fabaceae). Ann. Bot. 1998, 82, 757–764. [Google Scholar] [CrossRef] [Green Version]
  30. El-Bok, S.; Zoghlami-Khelil, A.; Ben-Brahim, T.; Ouji, A.; Hassen, H.; Lamine, O.; Jabri, C.; Douggari, R.; El-Gazzah, M. Chromosome number and karyotype analysis of some taxa of Vicia genus (fabaceae): Revision and description. Int. J. Agric. Biol. 2014, 16, 1067–1074. [Google Scholar]
  31. Castiglione, M.R.; Frediani, M.; Gelati, M.T.; Venora, G.; Giorgetti, L.; Caputo, P.; Cremonini, R. Cytological and molecular characterization of Vicia barbazitae Ten. & Guss. Protoplasma 2012, 249, 779–788. [Google Scholar]
  32. Castiglione, M.R.; Frediani, M.; Gelati, M.T.; Ravalli, C.; Venora, G.; Caputo, P.; Cremonini, R. Cytology of Vicia species. X. Karyotype evolution and phylogenetic implication in Vicia species of the sections Atossa, Microcarinae, Wiggersia and Vicia. Protoplasma 2011, 248, 707–716. [Google Scholar] [CrossRef]
  33. Inceer, H.; Hayirlioglu-Ayaz, S.; Beyazoglu, O. Cytotaxonomic investigations on some taxa of the genus Vicia L. from north-eastern Anatolia. Acta Bot. Gall. 2002, 149, 125–138. [Google Scholar] [CrossRef] [Green Version]
  34. Maxted, N.; Callimassia, M.A.; Bennett, M.D. Cytotaxonomic studies of Eastern Mediterranean Vicia species (Leguminosae). Plant Syst. Evol. 1991, 177, 221–234. [Google Scholar] [CrossRef]
  35. Tabur, S.; Civelek, S.; Bagci, E. Cytotaxonomic studies on some Vicia L. species growing in eastern Mediterranean and southern Aegean regions, I. Acta Bot. Gall. 2001, 148, 159–174. [Google Scholar] [CrossRef]
  36. Caputo, P.; Frediani, M.; Gelati, M.T.; Venora, G.; Cremonini, R.; Ruffini Castiglione, M. Karyological and molecular characterisation of subgenus Vicia (Fabaceae). Plant Biosyst. 2013, 147, 1242–1252. [Google Scholar] [CrossRef]
  37. Arslan, E.; Ertuǧrul, K.; Öztürk, A.B. Karyological studies of some species of the genus Vicia L. (Leguminosae) in Turkey. Caryologia 2012, 65, 106–113. [Google Scholar] [CrossRef]
  38. McLeish, J.; Sunderland, N. Measurements of deoxyribosenucleic acid (DNA) in higher plants by Feulgen photometry and chemical methods. Exp. Cell Res. 1961, 24, 527–540. [Google Scholar] [CrossRef]
  39. Doležel, J.; Greilhuber, J.; Suda, J. Estimation of nuclear DNA content in plants using flow cytometry. Nat. Protoc. 2007, 2, 2233–2244. [Google Scholar] [CrossRef] [PubMed]
  40. Vrána, J.; Cápal, P.; Bednářová, M.; Doležel, J. Flow cytometry in plant research: A success story. Plant Cell Monogr. 2014, 22, 395–430. [Google Scholar]
  41. Galbraith, D.W.; Lambert, G.M. High-throughput monitoring of plant nuclear DNA contents via flow cytometry. Methods Mol. Biol. 2012, 918, 311–325. [Google Scholar] [PubMed]
  42. Doležel, J.; Greilhuber, J.; Suda, J. Flow Cytometry with Plants: An Overview. In Flow Cytometry with Plant Cells: Analysis of Genes, Chromosomes and Genomes; John Wiley & Sons: Hoboken, NJ, USA, 2007; pp. 41–65. [Google Scholar]
  43. Zohary, D.; Hopf, M.; Weiss, E. Domestication of Plants in the Old World: The origin and Spread of Domesticated Plants in Southwest Asia, Europe, and the Mediterranean Basin; Oxford University Press: Oxford, UK, 2012; ISBN 0199549060. [Google Scholar]
  44. Athinodorou, F.; Foukas, P.; Tsaniklidis, G.; Kotsiras, A.; Chrysargyris, A.; Delis, C.; Kyratzis, A.C.; Tzortzakis, N.; Nikoloudakis, N. Morphological diversity, genetic characterization, and phytochemical assessment of the cypriot tomato germplasm. Plants 2021, 10, 1698. [Google Scholar] [CrossRef]
  45. Kyriacou, M.C.; Ioannidou, S.; Nikoloudakis, N.; Seraphides, N.; Papayiannis, L.C.; Kyratzis, A.C. Physicochemical characterization and trait stability in a genetically diverse ex situ collection of pomegranate (Punica granatum L.) germplasm from Cyprus. Sci. Hortic. 2020, 263, 109116. [Google Scholar] [CrossRef]
  46. Kyratzis, A.C.; Nikoloudakis, N.; Katsiotis, A. Genetic variability in landraces populations and the risk to lose genetic variation. The example of landrace “Kyperounda” and its implications for ex situ conservation. PLoS ONE 2019, 14, e0224255. [Google Scholar] [CrossRef] [Green Version]
  47. Kyratzis, A.C.; Antoniou, C.; Papayiannis, L.C.; Graziani, G.; Rouphael, Y.; Kyriacou, M.C. Pod Morphology, Primary and Secondary Metabolite Profiles in Non-grafted and Grafted Carob Germplasm Are Configured by Agro-Environmental Zone, Genotype, and Growing Season. Front. Plant Sci. 2021, 11, 2199. [Google Scholar] [CrossRef] [PubMed]
  48. Anestiadou, K.; Nikoloudakis, N.; Hagidimitriou, M.; Katsiotis, A. Monumental olive trees of Cyprus contributed to the establishment of the contemporary olive germplasm. PLoS ONE 2017, 12, e0187697. [Google Scholar] [CrossRef] [Green Version]
  49. Grigoriou, A.; Tsaniklidis, G.; Hagidimitriou, M.; Nikoloudakis, N. The cypriot indigenous grapevine germplasm is a multi-clonal varietal mixture. Plants 2020, 9, 1034. [Google Scholar] [CrossRef] [PubMed]
  50. Meikle, R.D. Flora Cyprus; The Bentham-Moxon Trust: Kew, UK, 1977; Volume 1. [Google Scholar]
  51. Hand, R.; Hadjikyriakou, G.N.; Christodoulou, C.S. Continuously Updated: Flora of Cyprus—A Dynamic Checklist. 2011. Available online: http//www.flora-of-cyprus.eu (accessed on 3 March 2023).
  52. Temsch, E.M.; Koutecký, P.; Urfus, T.; Šmarda, P.; Doležel, J. Reference standards for flow cytometric estimation of absolute nuclear DNA content in plants. Cytom. Part A 2022, 101, 710–724. [Google Scholar] [CrossRef]
  53. Doležel, J.; Binarová, P.; Lcretti, S. Analysis of Nuclear DNA content in plant cells by Flow cytometry. Biol. Plant. 1989, 31, 113–120. [Google Scholar] [CrossRef]
  54. Doležel, J.; Bartoš, J.; Voglmayr, H.; Greilhuber, J.; Thomas, R.A. Nuclear DNA content and genome size of trout and human (multiple letters). Cytom. Part A 2003, 51, 127–129. [Google Scholar] [CrossRef]
  55. Nikoloudakis, N.; Aissat, A.; Katsiotis, A. Screening A. ventricosa populations for 2n gametes. Euphytica 2018, 214, 34. [Google Scholar] [CrossRef]
  56. Graham, P.H.; Vance, C.P. Legumes: Importance and constraints to greater use. Plant Physiol. 2003, 131, 872–877. [Google Scholar] [CrossRef] [Green Version]
  57. Lock, J.M.; Maxted, N. Tribe Fabeae. In Legumes of the World; Royal Botanic Gardens: Kew, UK, 2005; pp. 505–509. [Google Scholar]
  58. Zohary, D.; Hopf, M. Domestication of Plants in the Old World; Clarendon Press: Oxford, UK, 1993. [Google Scholar]
  59. Flint-Hamilton, K.B. Legumes in Ancient Greece and Rome: Food, Medicine, or Poison? Hesperia J. Am. Sch. Class. Stud. Athens 1999, 68, 371–385. [Google Scholar] [CrossRef]
  60. Hand, R.; Hadjikyriakou, G.N.; Christodoulou, C.S. Updated numbers of the vascular flora of Cyprus including the endemism rate. Cypricola 2019, 13, 1–6. [Google Scholar]
  61. Greilhuber, J.; Temsch, E.M.; Loureiro, J.C.M. Nuclear DNA Content Measurement. In Flow Cytometry with Plant Cells: Analysis of Genes, Chromosomes and Genomes; John Wiley & Sons: Hoboken, NJ, USA, 2007; pp. 67–101. [Google Scholar]
  62. Leitch, I.J.; Bennett, M.D. Genome Size and its Uses: The Impact of Flow Cytometry. In Flow Cytometry with Plant Cells: Analysis of Genes, Chromosomes and Genomes; John Wiley & Sons: Hoboken, NJ, USA, 2007; pp. 153–176. [Google Scholar]
  63. Kolano, B.; Siwinska, D.; Pando, L.G.; Szymanowska-Pulka, J.; Maluszynska, J. Genome size variation in Chenopodium quinoa (Chenopodiaceae). Plant Syst. Evol. 2012, 298, 251–255. [Google Scholar] [CrossRef] [Green Version]
  64. Yan, H.; Martin, S.L.; Bekele, W.A.; Latta, R.G.; Diederichsen, A.; Peng, Y.; Tinker, N.A. Genome size variation in the genus Avena. Genome 2016, 59, 209–220. [Google Scholar] [CrossRef] [Green Version]
  65. Venora, G.; Blangiforti, S.; Frediani, M.; Maggini, F.; Gelati, M.T.; Ruffini Castiglione, M.; Cremonini, R. Nuclear DNA contents, rDNAs, chromatin organization, and karyotype evolution in Vicia sect. faba. Protoplasma 2000, 213, 118–125. [Google Scholar] [CrossRef]
  66. Raina, S.N.; Bisht, M.S. DNA amounts and chromatin compactness in Vicia. Genetica 1988, 77, 65–77. [Google Scholar] [CrossRef]
  67. Raina, S.N.; Rees, H. DNA variation between and within chromosome complements of Vicia species. Heredity 1983, 51, 335–346. [Google Scholar] [CrossRef] [Green Version]
  68. Siljak-Yakovlev, S.; Pustahija, F.; Šolić, E.M.; Bogunić, F.; Muratović, E.; Bašić, N.; Catrice, O.; Brown, S.C. Towards a genome size and chromosome number database of balkan flora: C-values in 343 taxa with novel values for 242. Adv. Sci. Lett. 2010, 3, 190–213. [Google Scholar] [CrossRef]
  69. Meyerson, L.A.; Pyšek, P.; Lučanová, M.; Wigginton, S.; Tran, C.-T.; Cronin, J.T. Plant genome size influences stress tolerance of invasive and native plants via plasticity. Ecosphere 2020, 11, e03145. [Google Scholar] [CrossRef]
  70. Dai, S.-F.; Zhu, X.-G.; Hutang, G.-R.; Li, J.-Y.; Tian, J.-Q.; Jiang, X.-H.; Zhang, D.; Gao, L.-Z. Genome Size Variation and Evolution Driven by Transposable Elements in the Genus Oryza. Front. Plant Sci. 2022, 13, 921937. [Google Scholar] [CrossRef]
  71. Heslop-Harrison, J.S.P.; Schwarzacher, T.; Liu, Q. Polyploidy: Its consequences and enabling role in plant diversification and evolution. Ann. Bot. 2023, 131, 1–10. [Google Scholar] [CrossRef] [PubMed]
  72. Papolu, P.K.; Ramakrishnan, M.; Mullasseri, S.; Kalendar, R.; Wei, Q.; Zou, L.; Ahmad, Z.; Vinod, K.K.; Yang, P.; Zhou, M. Retrotransposons: How the continuous evolutionary front shapes plant genomes for response to heat stress. Front. Plant Sci. 2022, 13, 1064847. [Google Scholar] [CrossRef] [PubMed]
  73. Carta, A.; Peruzzi, L. Testing the large genome constraint hypothesis: Plant traits, habitat and climate seasonality in Liliaceae. New Phytol. 2016, 210, 709–716. [Google Scholar] [CrossRef] [PubMed] [Green Version]
  74. Maxted, N. An Ecogeographical Study of Vicia Subgenus Vicia; IPGRI (International Plant Research Institute): Rome, Italy, 1995; ISBN 978-92-9043-240-1. [Google Scholar]
  75. Hollings, E.; Stace, C.A. Karyotype Variation and Evolution in the Vicia Sativ A Aggregate. New Phytol. 1974, 73, 195–208. [Google Scholar] [CrossRef]
Figure 1. Distribution of sampling sites across Cypriot regions. In total, 155 Fabeae populations (belonging to 29 species) were collected.
Plants 12 01469 g001
Figure 2. Illustration of floral diversity in the Fabeae tribe. (A) V. lunata; (B) V. cypria; (C) V. laxiflora; (D) V. Villosa; (E) V. angustifolia; (F) V. bithynica; (G) V. narbonensis; (H) V. faba; (I) V. hybrida; (J) V. lathyroides; (K) V. sativa subsp. sativa; (L) V. sativa subsp. sativa; (M) V. peregrina; (N) V. amphicarpa; (O) V. lutea; (P) V. palaestina; (Q) P. fulvum; (R) P. sativum subsp. biflorum; (S) P. sativum subsp. sativum; (T) P. sativum subsp. sativum. scale bar: 1 cm (all pictures © Angelos kyratzis).
Plants 12 01469 g002
Figure 3. (A) FL2-A fluorescence histograms of Zea mays cv. CE-777 (red peaks) and Pisum sativum subsp. sativum ARI00308 (yellow peaks) with diploid (2C) and tetraploid (4C) nuclei. (B) FL2-A fluorescence histograms of Zea mays cv. CE-777 (yellow peaks) and Vicia lunata ARI01343 (red peaks) PI-stained nuclei. Besides diploid (2C) and tetraploid (4C) cells, nuclei with a higher ploidy level (8C) were also detected.
Plants 12 01469 g003
Figure 4. Box plots of mean 1C-values (logarithmic scale) within species. Horizontal lines depict the median value. Boxes below and above the mean line designate quartiles. Lines at the whiskers’ margins (vertically) identify extreme data points, and circles indicate the outliers.
Plants 12 01469 g004
Figure 5. C-values correlation across the 20 common taxa analyzed in the current study that are also presented in the Kew Plant C-values database (https://cvalues.science.kew.org/ (accessed on 3 March 2023)). Data were highly correlated (R2 ≈ 0.95) across species. A notable departure was found merely for Vicia dalmatica (depicted as a red circle).
Plants 12 01469 g005
Figure 6. Discrete parsimony optimization of C-values (Mbp) in the Cypriot Fabeae tribe analyzed with the mesquite software. Reconstruction of ancestral states for C-values on an ITS1-5.8S-ITS2-based phylogenetic tree. Blue and cyan branches symbolize moderately small genome DNA content while green, orange, and red designate, respectively, medium-sized and larger genomes. NCBI nucleotide accessions correspond to the following taxa: JX506157.1; L. culinaris, MT002742.1; L. ervoides, JX506158.1; L. nigricans, JN966984.1; L. orientalis, KU678816.1; P. fulvum, KU678853.1; P. sativum subsp. biflorum, AY143482.1; P. sativum subsp. sativum, HM470604.1; V. amphicarpa, KJ787206.1; V. angustifolia, HM470596.1; V. bithynica, JX506196.1; V. cassia, JX506205.1; V. cretica, JX506208.1; V. cypria, HM470636.1; V. dalmatica, HM470634.1; V. ervilia, MW843838.1; V. faba, HM470625.1; V. hybrida, HM470597.1; V. johannis, HM470610.1; V. lathyroides, JX506301.1; V. parviflora, JX506244.1; V. lutea, HM470591.1; V. narbonensis, MN736419.1; V. palaestina, HM470631.1; V. peregrina, JX506278.1; V. pubescens, HM470602.1; V. sativa subsp. sativa, HM470615.1; V. villosa subsp. eriocarpa.
Plants 12 01469 g006
Table 1. List of Fabeae taxa (in alphabetic order), number of analyzed accessions, DNA content reported in Kew database, internal standards used, predicted Mbps, mean 1C-values with standard deviations, coefficient of variance, ranges of DNA content, HSD and LSD tests. Nomenclature is according to Hand et al., 2011 [51].
SpeciesNo. of AccessionsDNA Content/Data from Kew (pg/1C)Internal Standard 3Mbp 4Mean DNA Content ± SD (pg/1C)%CVRange of DNA Content (pg)HSD Test 5LSD Test 5
L. culinaris184.21Z. m4260.9834.357 ± 0.051.1484.209–4.448ijk
L. ervoides15-Z. m3391.3133.468 ± 0.0260.7503.437–3.494ln
L. nigricans13-Z. m3452.9923.531 ± 0.0150.4253.521–3.548ln
L. orientalis12-Z. m4280.7064.377 ± 0.0621.4164.333–4.421hijjk
P. fulvum24.7Z. m4735.4764.842 ± 0.0350.7234.817–4.867gg
P. sativum subsp. biflorum34.75Z. m4409.8024.509 ± 0.0912.0184.437–4.611hihi
P. sativum subsp. sativum84.9Z. m4422.2724.522 ± 0.0260.5754.493–4.572hh
V. amphicarpa L. 221.65S. l1617.6121.654 ± 0.0593.5671.612–1.696qrt
V. angustifolia L. 272.01G. m1964.6622.009 ± 0.0613.0361.929–2.094pr
V. bithynica L. 233.83Z. m3749.9783.834 ± 0.0350.9133.808–3.874km
V. cassia Boiss16-Z. m4343.2984.441 ± 0.1282.8824.356–4.694hiij
V. cretica Boiss. & Heldr.11-S. l1549.0961.584 ± 0.0070.4421.577–1.591rt
V. cypria Kotschy11-P. s5368.9955.49 ± 0.0220.4015.467–5.51ff
V. dalmatica A. Kern.66.87P. s6720.8166.872 ± 0.0811.1796.716–6.94dd
V. ervilia L. 284.2Z. m4154.7894.248 ± 0.0250.5894.22–4.301jl
V. faba L.1413.62S. c13,525.04213.829 ± 0.110.79513.66–13.98aa
V. hybrida L. 2116.78P. s6546.1106.693 ± 0.1181.7636.542–6.971ee
V. johannis Tamamsh216.94P. s6782.4796.935 ± 0.0140.2026.919–6.943dd
V. lathyroides L. 232.53G. m2477.6002.533 ± 0.051.9742.484–2.583np
V. laxiflora Brot.12-G. m2762.8502.825 ± 0.0030.1062.823–2.827mo
V. lunata (Boiss. & Balansa) Boiss.251.83S. l1750.0331.789 ± 0.0221.2301.768–1.824qs
V. lutea L. 217.4P. s7143.2147.304 ± 0.0110.1517.291–7.312cc
V. narbonensis L. 246.95P. s6795.8786.949 ± 0.0340.4896.912–6.994dd
V. palaestina Boiss.212.24G. m2191.7572.241 ± 0.0190.8482.223–2.26oq
V. parviflora Cav.13-G. m2560.0782.618 ± 0.083.0562.526–2.673mnp
V. peregrina L. 268.97P. s8773.1498.971 ± 0.0690.7698.862–9.038bb
V. pubescens (DC.) Link262.79G. m2730.7392.792 ± 0.0622.2212.667–2.831mo
V. sativa L. subsp. sativa172.25S. l1756.8911.796 ± 0.0633.5081.726–1.999qs
V. villosa subsp. eriocarpa (Hausskn.) P. W. Ball62.28S. l1782.5681.823 ± 0.0754.1141.748–1.947qs
1 First report in the Fabeae literature (according to Kew Plant C-values database https://cvalues.science.kew.org/ (accessed on 3 March 2023)); 2 First report using flow cytometry; 3 Z. m: Zea mays cv. CE-777 (2.715 pg/1C); S. l: Solanum lycopersicon cv. Stupické polní tyčkové rané (0.98 pg/1C); G. m: Glycine max cv. Polanka (1.25 pg/1C); S. C: Secale cereale cv. Dankovské (8.095 pg/1C); P. s: Pisum sativum cv. Ctirad (4.545 pg/1C); 4 (1 pg = 978 Mbp) as reported in Dolezel [54]; 5 Species having identical lowercase letters were not found significantly different at p = 0.05.
Disclaimer/Publisher’s Note: The statements, opinions and data contained in all publications are solely those of the individual author(s) and contributor(s) and not of MDPI and/or the editor(s). MDPI and/or the editor(s) disclaim responsibility for any injury to people or property resulting from any ideas, methods, instructions or products referred to in the content.

