
Photosystem II Performance of Coffea canephora Seedlings after Sunscreen Application
 , , , ,
Abstract
:1. Introduction
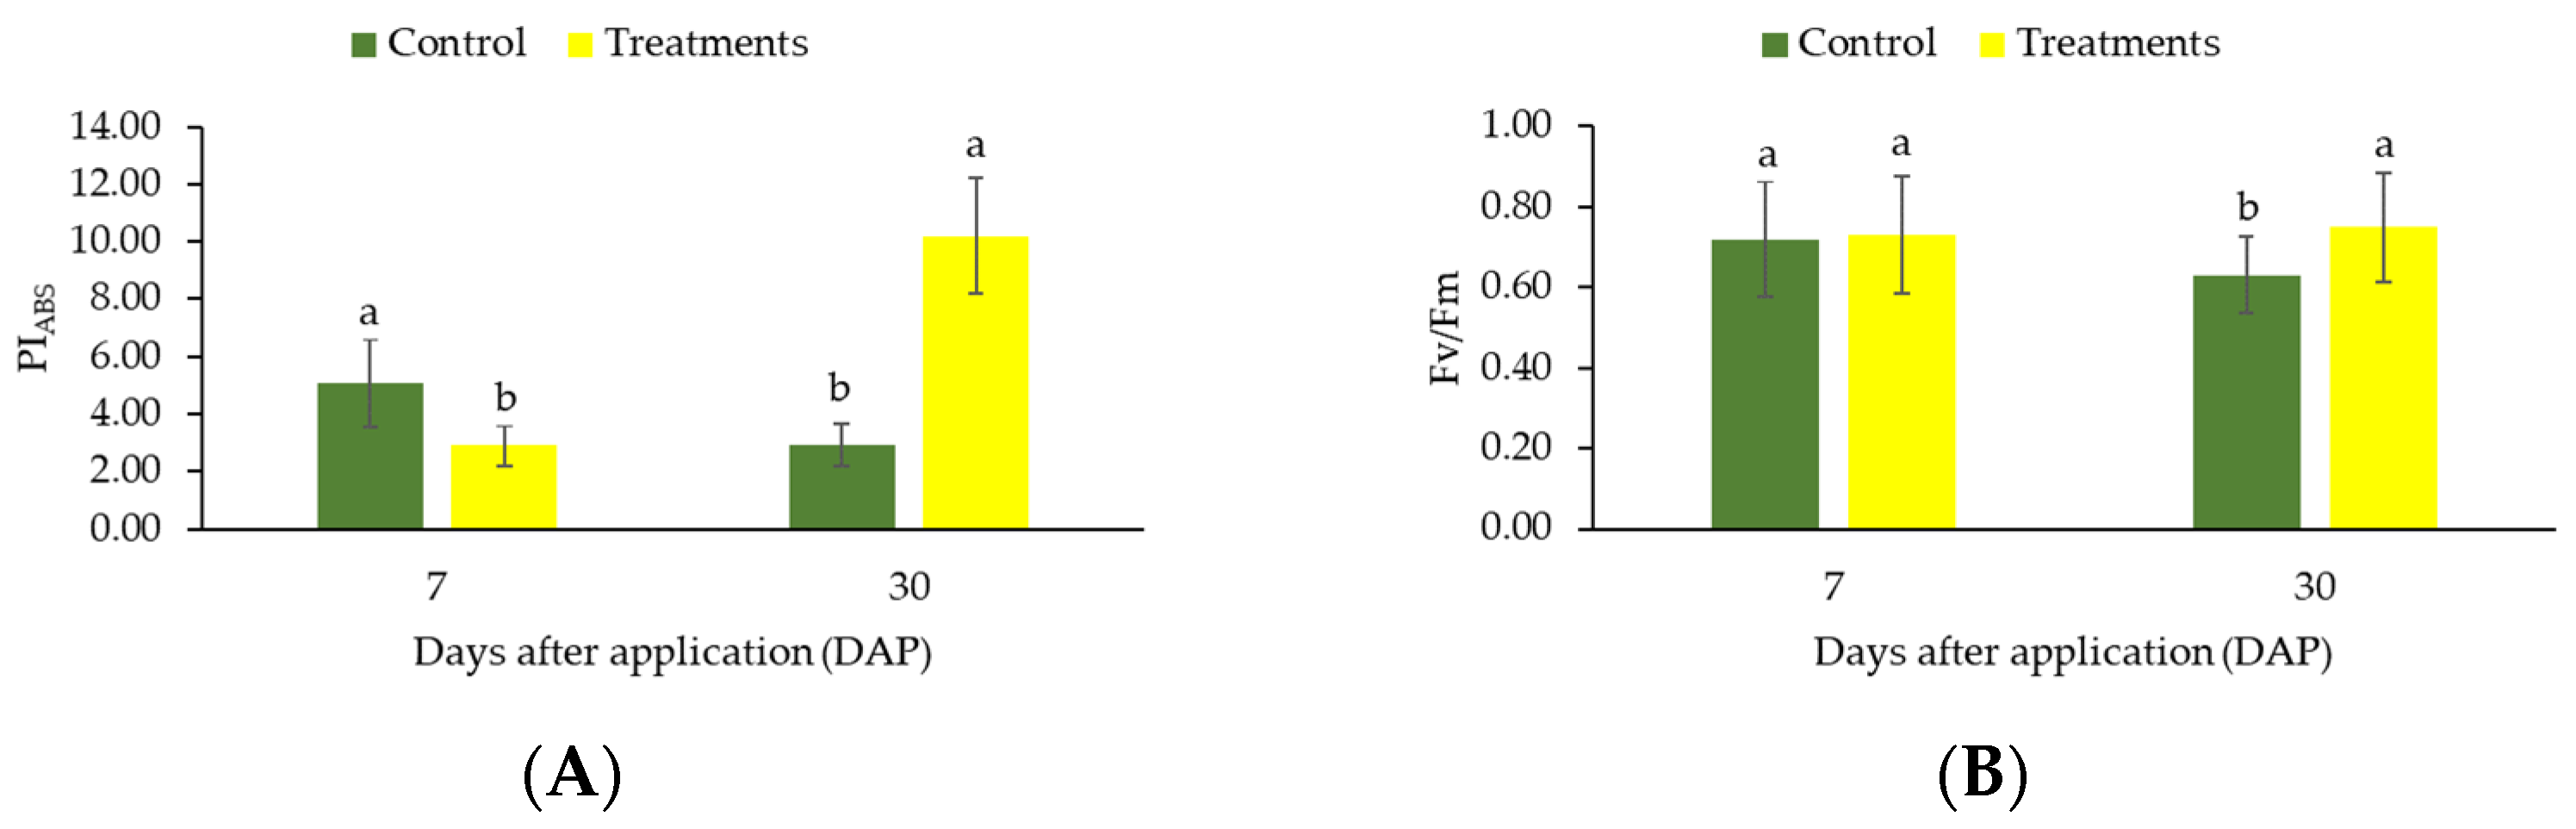
2. Results
3. Discussion
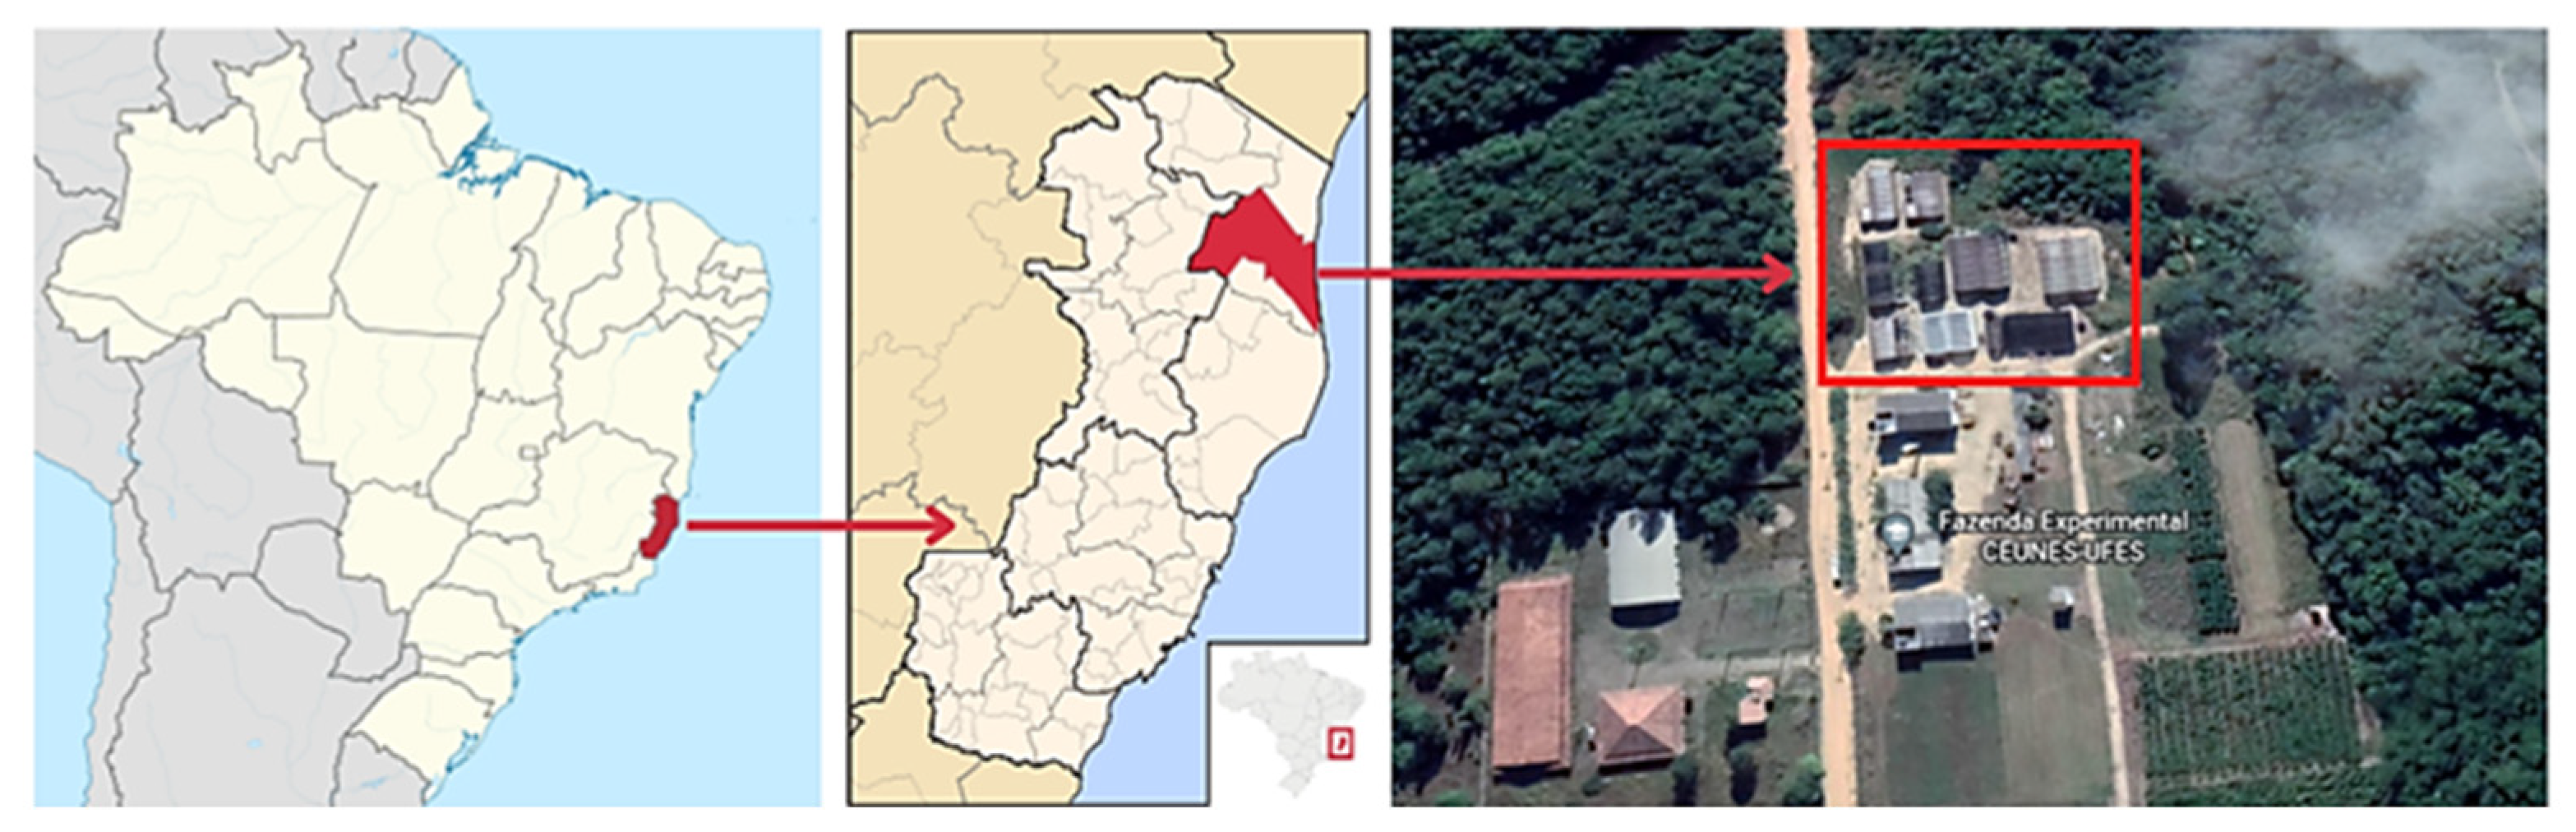
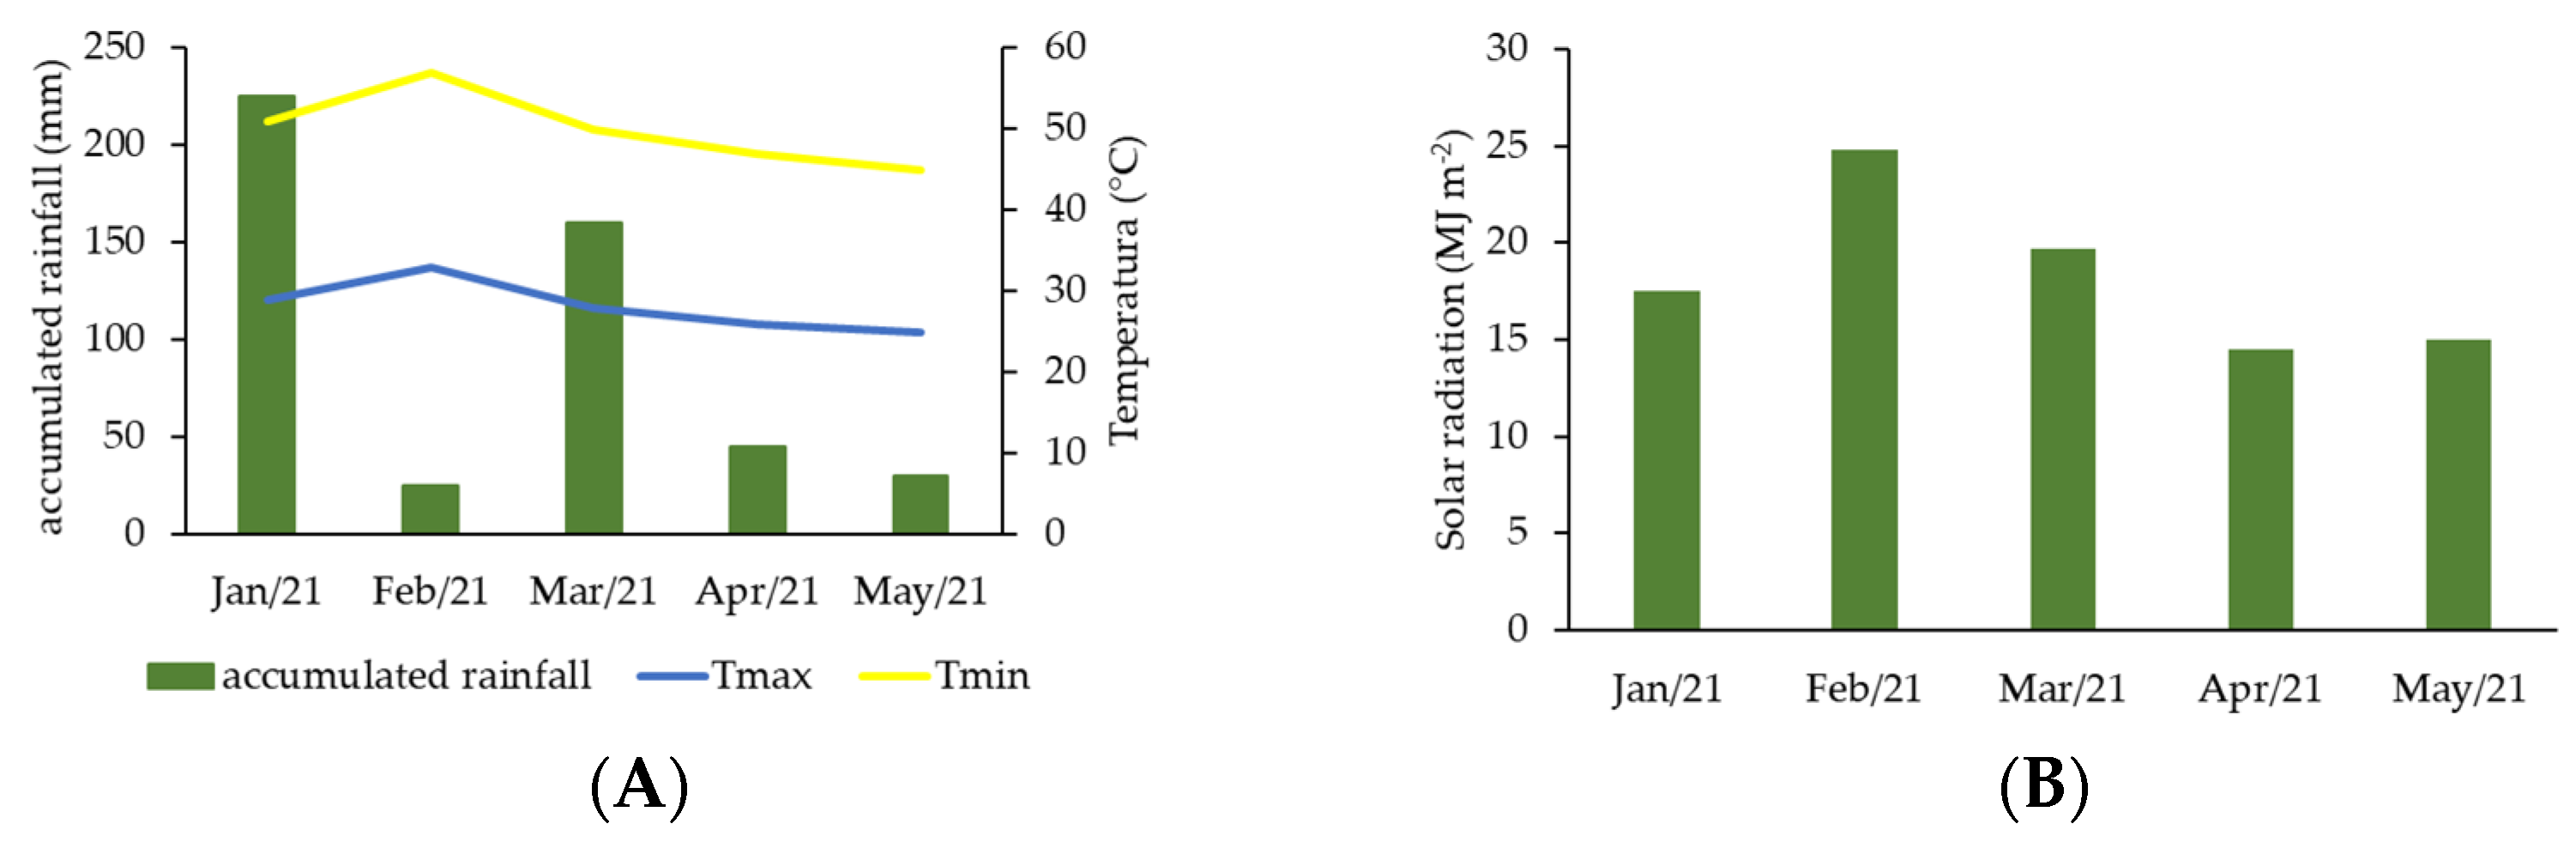
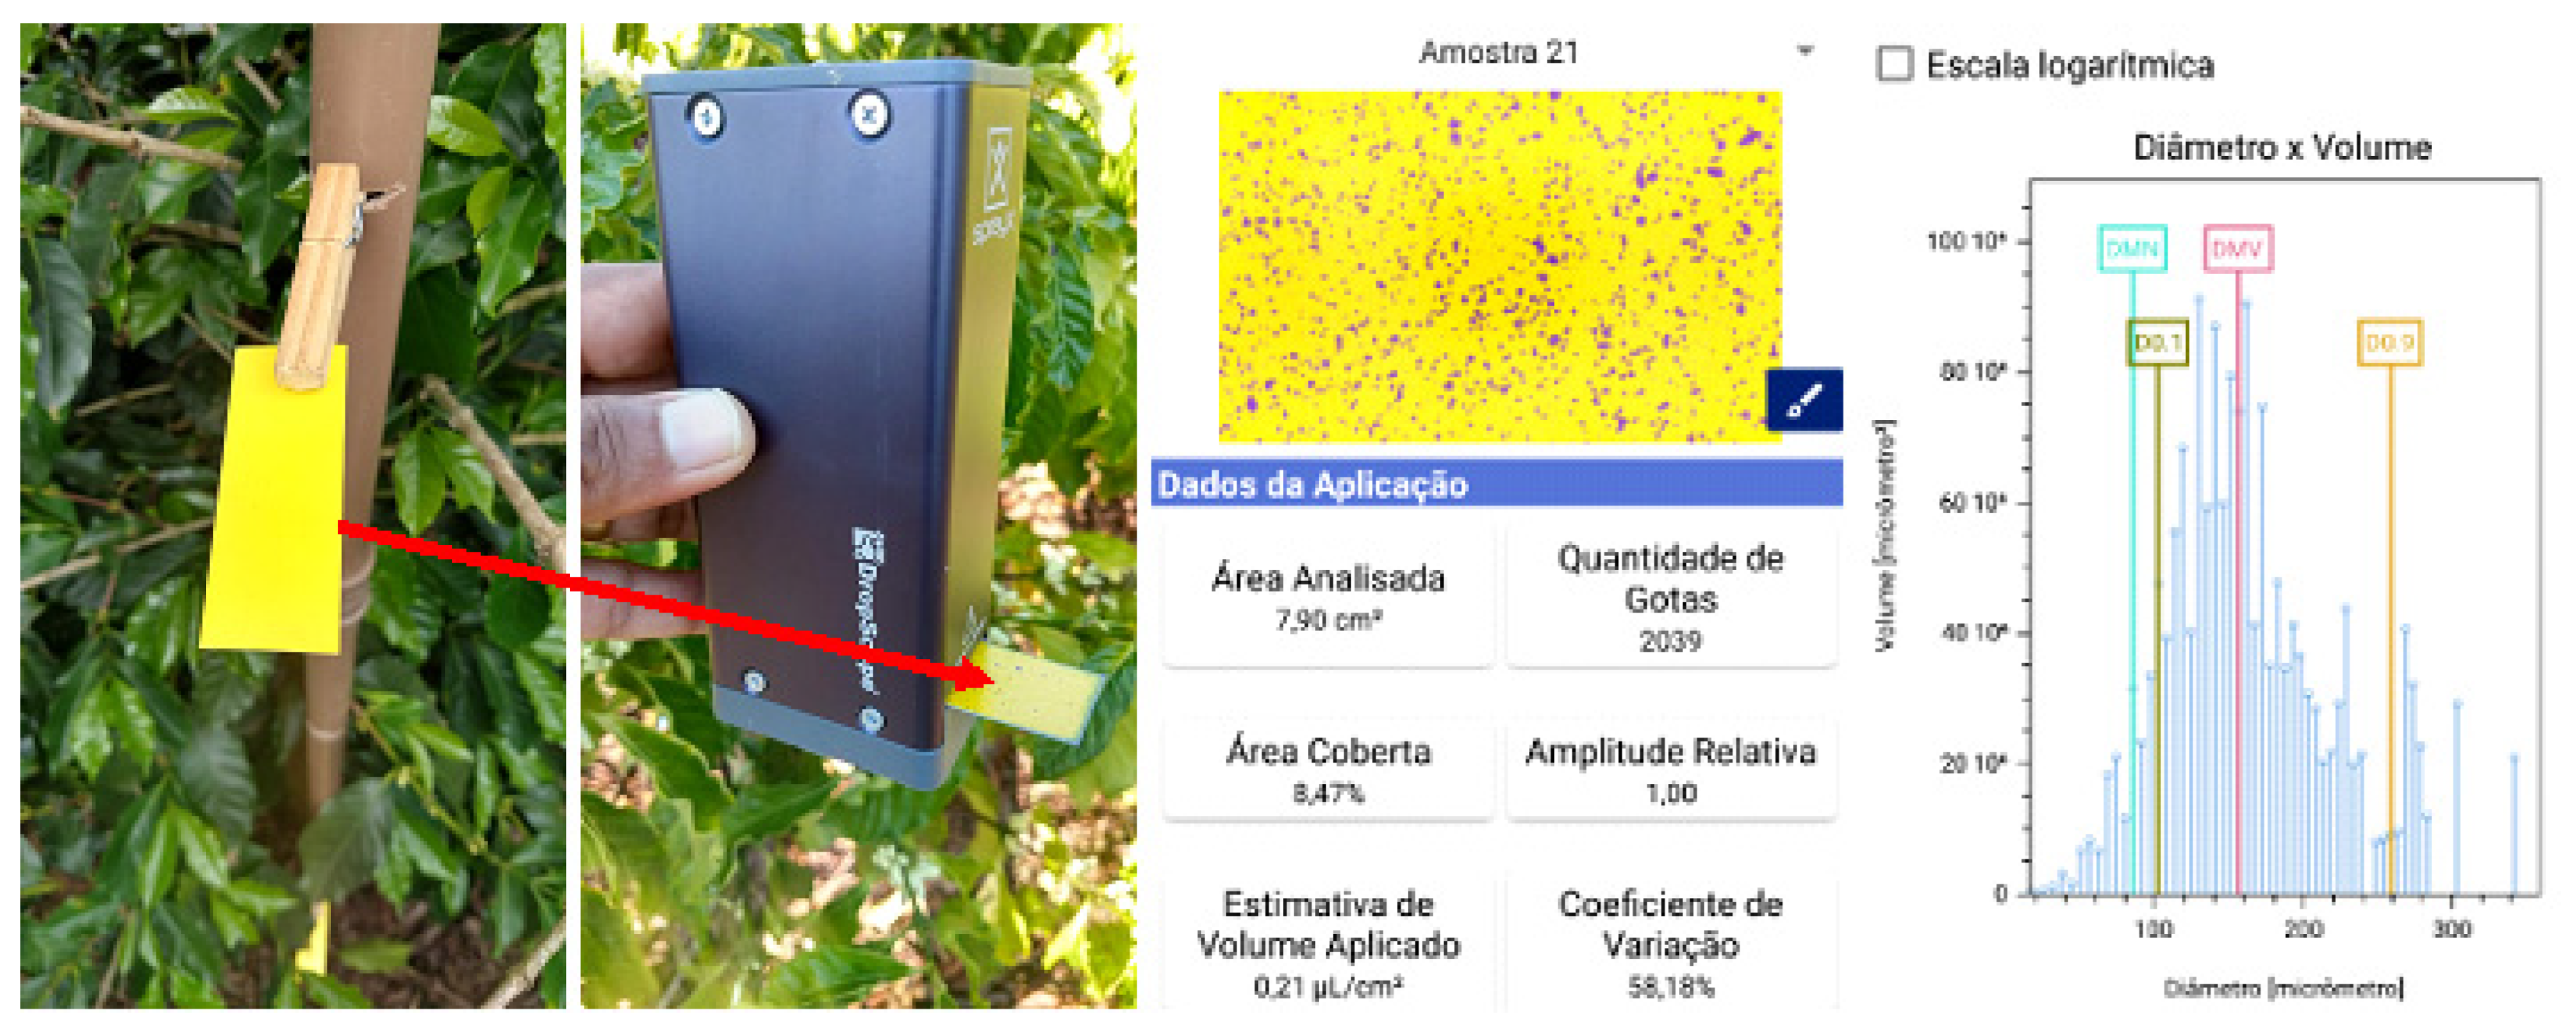
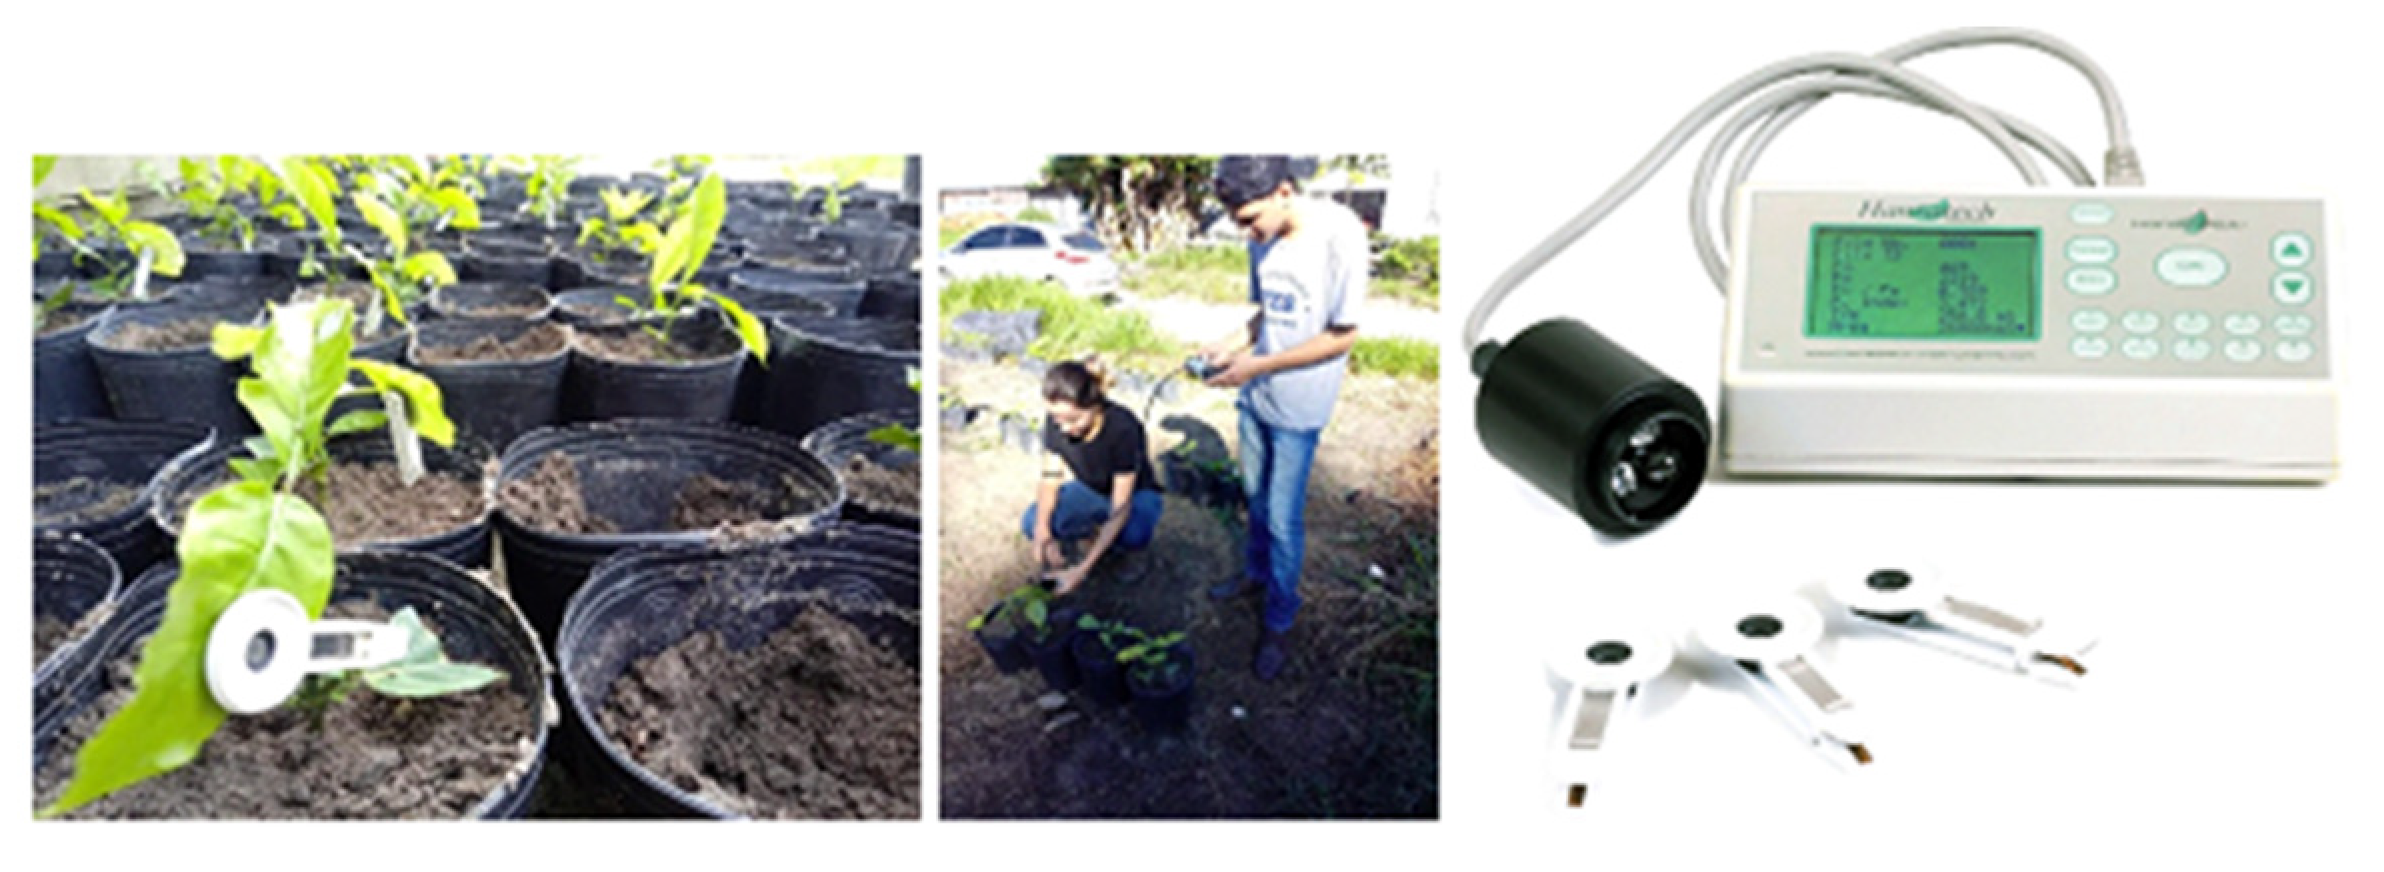
4. Materials and Methods
5. Conclusions
Author Contributions
Funding
Institutional Review Board Statement
Informed Consent Statement
Data Availability Statement
Acknowledgments
Conflicts of Interest
References
- International Coffee Organization—Dados Estatísticos da Organização Internacional do Café. Available online: https://www.ico.org/pt/about_statistics_p.asp?section=Estat%EDstica (accessed on 19 February 2023).
- Coffee. USDA Foreign Agricultural Service. Available online: https://www.fas.usda.gov/commodities/coffee (accessed on 19 February 2023).
- CONAB (Companhia Nacional de Abastecimento). Acompanhamento Da Safra Brasileira. Café, Quarto Levantamento, Safra. 2022. Available online: https://www.conab.gov.br/ (accessed on 19 February 2023).
- Filho, A.C.V.; Rodrigues, W.N.; Colodetti, T.V.; Volpi, P.S. Desenvolvimento foliar de mudas de café conilon produzidas em diferentes nozzleos de tubetes. In Proceedings of the X Simpósio de Pesquisas Cafeeiras do Brasil, Vitória, Brazil, 8 October 2019. [Google Scholar]
- Verdin Filho, A.C.; Borghi, E.J.A.; Fornaciari, G.; Colodetti, T.V.; Rodrigues, W.N.; Comerio, M.; Posse, S.C.P. Limitações causadas pelas dimensões de tubetes sobre o crescimento e qualidade de mudas clonais de cafeeiro conilon. Pensar Acadêmico 2021, 19, 281. [Google Scholar] [CrossRef]
- Pollo, G.Z.; Meirelles, F.C.; Cavalcante, A.G.; Lemos, L.B. Desenvolvimento Inicial de Cultivares de Café Arábica Sob Formas de Aplicação de Biorregulador Vegetal. Rev. Inova Ciên. Tec. 2020, 6, 29–34. Available online: https://periodicos.iftm.edu.br/index.php/inova/article/view/1044 (accessed on 27 February 2023).
- Cavalcanti Filho, P.F.M.; Freitas, S.J.; Silva, W.S.; Baitelle, D.C.; Soares, L.P.S.; Leite, I.O.; Santos, P.C.; Rodrigues, W.P.; Berrilli, S.S. Silicato de potássio na rustificação de mudas de café arábica sombreadas e a pleno sol. In Proceedings of the Congresso Brasileiro de Pesquisas Cafeeiras, Viçosa, Brazil, 7 November 2017. [Google Scholar]
- Alvarez-Fernandez, R.; Penfold, C.A.; Galvez-Valdivieso, G.; Exposito-Rodriguez, M.; Stallard, E.J.; Bowden, L.; Moore, J.D.; Mead, A.; Davey, P.A.; Matthews, J.S.A.; et al. Time-Series Transcriptomics Reveals a BBX32-Directed Control of Acclimation to High Light in Mature Arabidopsis Leaves. Plant J. 2021, 107, 1363–1386. [Google Scholar] [CrossRef] [PubMed]
- Vialet-Chabrand, S.; Matthews, J.S.; Lawson. Light, power, action! Iteration of respiratory energy-and blue light-induced stomatal movements. New Phytol. 2021, 231, 2231–2246. [Google Scholar] [CrossRef]
- Tatagiba, S.D.; Pezzopane, J.E.M.; Reis, E.F.d. Crescimento vegetativo de mudas de café arábica (Coffea arabica L.) submetidas a diferentes níveis de sombreamento. Coffee Sci. 2010, 5, 251–261. Available online: http://www.coffeescience.ufla.br/index.php/coffeescience/article/view/131 (accessed on 27 February 2023 ).
- Silva, A.C.; Resende, M.L.V.; de Souza, P.E.; Silva, N.C.N.; Silva Jr, M.B.; Vitorino, L.R.R. Coffee-Leaf Extract and Phosphites on the Curative Control of Powdery Mildew in Eucalyptus Mini-Stumps. For. Pathol. 2013, 43, 297–305. [Google Scholar] [CrossRef]
- Zavafer, A.; Cheah, M.H.; Hillier, W.; Chow, W.S.; Takahashi, S. Photodamage to the Oxygen Evolving Complex of Photosystem II by Visible Light. Sci. Rep. 2015, 5, 16363. [Google Scholar] [CrossRef] [Green Version]
- Silva, P.S.O.; Oliveira, L.F.G.; Silva Gonzaga, M.I.; de Oliveira Alves Sena, E.; dos Santos Maciel, L.B.; Pinheiro Fiaes, M.; de Mattos, E.C.; Gutierrez Carnelossi, M.A. Effects of Calcium Particle Films and Natural Shading on Ecophysiological Parameters of Conilon Coffee. Sci. Hortic. 2019, 245, 171–177. [Google Scholar] [CrossRef]
- Bernardo, S.; Dinis, L.-T.; Luzio, A.; Pinto, G.; Meijón, M.; Valledor, L.; Conde, A.; Gerós, H.; Correia, C.M.; Moutinho-Pereira, J. Kaolin Particle Film Application Lowers Oxidative Damage and DNA Methylation on Grapevine (Vitis Vinifera L.). Environ. Exp. Bot. 2017, 139, 39–47. [Google Scholar] [CrossRef] [Green Version]
- Glenn, D.M. Effect of Highly Processed Calcined Kaolin Residues on Apple Productivity and Quality. Sci. Hortic. 2016, 201, 101–108. [Google Scholar] [CrossRef] [Green Version]
- Ribeiro, L.F.; Ribeiro, M.E.; Santos, T.; Aiala, M.; Vitória, E. Simulated Herbicide Application between Rows of Black Pepper Crops. Braz. J. Prod. Eng. 2023, 9, 81–88. [Google Scholar] [CrossRef]
- Vitória, E.L.; Krohling, C.A.; Borges, F.R.P.; Ribeiro, L.F.O.; Ribeiro, M.E.A.; Chen, P.; Lan, Y.; Wang, S.; Moraes, H.M.F.E.; Furtado Júnior, M.R. Efficiency of Fungicide Application an Using an Unmanned Aerial Vehicle and Pneumatic Sprayer for Control of Hemileia Vastatrix and Cercospora Coffeicola in Mountain Coffee Crops. Agronomy 2023, 13, 340. [Google Scholar] [CrossRef]
- Chen, P.; Lan, Y.; Huang, X.; Qi, H.; Wang, G.; Wang, J.; Wang, L.; Xiao, H. Droplet Deposition and Control of Planthoppers of Different Nozzles in Two-Stage Rice with a Quadrotor Unmanned Aerial Vehicle. Agronomy 2020, 10, 303. [Google Scholar] [CrossRef] [Green Version]
- Corapi, A.; Gallo, L.; Lucadamo, L. Simulation of Drift Depositional Rate of the Fungicide Fosetyl and Its Effects on Non-Vascular Plants: Study Case of the Epiphytic Lichen Pseudevernia Furfuracea. Arch. Environ. Contam. Toxicol. 2023, 84, 73–84. [Google Scholar] [CrossRef] [PubMed]
- Dengeru, Y.; Ramasamy, K.; Allimuthu, S.; Balakrishnan, S.; Kumar, A.P.M.; Kannan, B.; Karuppasami, K.M. Study on Spray Deposition and Drift Characteristics of UAV Agricultural Sprayer for Application of Insecticide in Redgram Crop (Cajanus Cajan L. Millsp). Agronomy 2022, 12, 3196. [Google Scholar] [CrossRef]
- Ge, Q.; Mei, J.; Chen, S.; Zhang, Q.; Xue, Y.; Yu, Y.; Fang, H. Deposition, Dissipation, and Minimum Effective Dosage of the Fungicide Carbendazim in the Pepper-Field Ecosystem. Pest Manag. Sci. 2020, 76, 907–916. [Google Scholar] [CrossRef] [PubMed]
- Meng, Y.; Zhong, W.; Liu, Y.; Wang, M.; Lan, Y. Droplet Distribution of an Autonomous UAV-Based Sprayer in Citrus Tree Canopy. J. Phys. Conf. Ser. 2022, 2203, 012022. [Google Scholar] [CrossRef]
- Mehta, P.; Jajoo, A.; Mathur, S.; Bharti, S. Chlorophyll a Fluorescence Study Revealing Effects of High Salt Stress on Photosystem II in Wheat Leaves. Plant Physiol. Biochem. PPB 2010, 48, 16–20. [Google Scholar] [CrossRef] [PubMed]
- Tsimilli-Michael, M.; Strasser, R.J. The Energy Flux Theory 35 Years Later: Formulations and Applications. Photosynth. Res. 2013, 117, 289–320. [Google Scholar] [CrossRef] [PubMed]
- Mosa, M.A.; Bang, J.; Jo, J.Y.; Lee, J.-S.; Kwon, K.-S. Continuous Ink Supply and Circulation System for a Multi-Nozzle Electrospray. Jpn. J. Appl. Phys. 2023, 62, SE1001. [Google Scholar] [CrossRef]
- Lou, Z.; Xin, F.; Han, X.; Lan, Y.; Duan, T.; Fu, W. Effect of unmanned aerial vehicle flight height on droplet distribution, drift and control of cotton aphids and spider mites. Agronomy 2018, 8, 187. [Google Scholar] [CrossRef] [Green Version]
- Chen, S.; Yang, J.; Zhang, M.; Strasser, R.J.; Qiang, S. Classification and Characteristics of Heat Tolerance in Ageratina Adenophora Populations Using Fast Chlorophyll a Fluorescence Rise O-J-I-P. Environ. Exp. Bot. 2016, 122, 126–140. [Google Scholar] [CrossRef]
- Rousseau, C.; Belin, E.; Bove, E.; Rousseau, D.; Fabre, F.; Berruyer, R.; Guillaumès, J.; Manceau, C.; Jacques, M.-A.; Boureau, T. High Throughput Quantitative Phenotyping of Plant Resistance Using Chlorophyll Fluorescence Image Analysis. Plant Methods 2013, 9, 17. [Google Scholar] [CrossRef] [PubMed] [Green Version]
- Souza, G.A.R.; Pires, I.D.; Cerri Neto, B.; Costa, R.J.; Correia, L.Z.; Ferreira, T.R.; Lima, K.C.C.; Silva, F.R.N.; Machado Filho, J.A.; Arantes, S.D.; et al. Caracterização fotoquímica de clones de Coffea canephora Pierre ex Froehner cultivados em condições de pleno sol. In Proceedings of the X Simpósio de Pesquisas Cafeeiras do Brasil, Vitória, Brazil, 8 October 2019. [Google Scholar]
- Yusuf, M.A.; Kumar, D.; Rajwanshi, R.; Strasser, R.J.; Tsimilli-Michael, M.; Govindjee; Sarin, N.B. Overexpression of γ-Tocopherol Methyl Transferase Gene in Transgenic Brassica Juncea Plants Alleviates Abiotic Stress: Physiological and Chlorophyll a Fluorescence Measurements. Biochim. Biophys. Acta BBA Bioenerg. 2010, 1797, 1428–1438. [Google Scholar] [CrossRef] [PubMed] [Green Version]
- Redillas, M.C.F.R.; Strasser, R.J.; Jeong, J.S.; Kim, Y.S.; Kim, J.-K. The Use of JIP Test to Evaluate Drought-Tolerance of Transgenic Rice Overexpressing OsNAC10. Plant Biotechnol. Rep. 2011, 5, 169–175. [Google Scholar] [CrossRef]
- Kalaji, H.M.; Jajoo, A.; Oukarroum, A.; Brestic, M.; Zivcak, M.; Samborska, I.A.; Cetner, M.D.; Łukasik, I.; Goltsev, V.; Ladle, R.J. Chlorophyll a Fluorescence as a Tool to Monitor Physiological Status of Plants under Abiotic Stress Conditions. Acta Physiol. Plant. 2016, 38, 102. [Google Scholar] [CrossRef] [Green Version]
- Meng, L.L.; Song, J.F.; Wen, J.; Zhang, J.; Wei, J.H. Effects of Drought Stress on Fluorescence Characteristics of Photosystem II in Leaves of Plectranthus Scutellarioides. Photosynthetica 2016, 54, 414–421. [Google Scholar] [CrossRef]
- Souza, J.; Nunes, V.; Calazans, C.; Mann, R.; Santos, R.; Torres, M.; Oliveira Júnior, L. DÉFICIT HÍDRICO NO DESENVOLVIMENTO DE CULTIVARES DE CANA-DE-AÇÚCAR. Glob. Sci. Technol. 2020, 13, 196–210. Available online: https://www.researchgate.net/profile/Juliana-Souza-41/publication/ (accessed on 27 February 2023).
- Campostrini, E. Fluorescência da Clorofila a: Considerações Teóricas e Aplicações Práticas; Universidade Estadual Fluminense, Campos dos Goytacazes: Rio de Janeiro, Brazil, 2001. [Google Scholar]
- Stirbet, A.; Govindjee. On the Relation between the Kautsky Effect (Chlorophyll a Fluorescence Induction) and Photosystem II: Basics and Applications of the OJIP Fluorescence Transient. J. Photochem. Photobiol. B 2011, 104, 236–257. [Google Scholar] [CrossRef]
- Mota, L.H.S. Crescimento e Comportamento Fisiológico de Procedências de Pinhão-Manso (Jatropha curcas L.) em Diferentes níveis de Alumínio. Growth and Behavior Physiological of Provenances of Physic-Nut (Jatropha curcas L.) at Different Levels of Aluminium, Agronomy. Master’s Thesis, Universidade Federal do Grande Dourados, Dourados, Brazil, 2013. [Google Scholar]
- Lin, Z.-H.; Chen, L.-S.; Chen, R.-B.; Zhang, F.-Z.; Jiang, H.-X.; Tang, N. CO2assimilation, Ribulose-1,5-Bisphosphate Carboxylase/Oxygenase, Carbohydrates and Photosynthetic Electron Transport Probed by the JIP-Test, of Tea Leaves in Response to Phosphorus Supply. BMC Plant Biol. 2009, 9, 43. [Google Scholar] [CrossRef] [Green Version]
- Luna, M.M.A.; Bernini, E.; Lage-Pinto, F. Photochemical responses by seedlings of two mangrove species grown under different light levels. Pan-Am. J. Aquat. Sci. 2019, 14, 86–99. [Google Scholar]
- Strasser, R.J.; Tsimilli-Michael, M.; Srivastava, A. Analysis of the Chlorophyll a Fluorescence Transient. In Chlorophyll a Fluorescence: A Signature of Photosynthesis; Papageorgiou, G.C., Ed.; Advances in Photosynthesis and Respiration; Springer: Dordrecht, The Netherlands, 2004; pp. 321–362. [Google Scholar] [CrossRef]
- Stirbet, A.; Lazár, D.; Kromdijk, J.; Govindjee. Chlorophyll a Fluorescence Induction: Can Just a One-Second Measurement Be Used to Quantify Abiotic Stress Responses? Photosynthetica 2018, 56, 86–104. [Google Scholar] [CrossRef]
- Martinazzo, E.G.; Perboni, A.T.; Oliveira, P.V.D.; Bianchi, V.J.; Bacarin, M.A. Atividade fotossintética em plantas de ameixeira submetidas ao déficit hídrico e ao alagamento. Ciênc. Rural 2013, 43, 35–41. [Google Scholar] [CrossRef] [Green Version]
- ShuAng, H.; Ning, T.; HuanXin, J.; LinTong, Y.; Yan, L.; LiSong, C. CO2 Assimilation, Photosystem II Photochemistry, Carbohydrate Metabolism and Antioxidant System of Citrus Leaves in Response to Boron Stress. Plant Sci. 2009, 176, 143–153. [Google Scholar]
- Ohad, I.; Berg, A.; Berkowicz, S.M.; Kaplan, A.; Keren, N. Photoinactivation of Photosystem II: Is There More than One Way to Skin a Cat? Physiol. Plant. 2011, 142, 79–86. [Google Scholar] [CrossRef] [PubMed]
- Essemine, J.; Govindachary, S.; Joly, D.; Ammar, S.; Bouzid, S.; Carpentier, R. Effect of Moderate and High Light on Photosystem II Function in Arabidopsis Thaliana Depleted in Digalactosyl-Diacylglycerol. Biochim. Biophys. Acta BBA Bioenerg. 2012, 1817, 1367–1373. [Google Scholar] [CrossRef] [PubMed] [Green Version]
- Schansker, G.; Tóth, S.Z.; Holzwarth, A.R.; Garab, G. Chlorophyll a Fluorescence: Beyond the Limits of the Q(A) Model. Photosynth. Res. 2014, 120, 43–58. [Google Scholar] [CrossRef]
- Suassuna, J.F.; Melo, A.S.D.; Costa, F.S.; Fernandes, P.D.; Ferreira, R.S.; Sousa, M.S.S. Eficiência fotoquímica e produtividade de frutos de meloeiro cultivado sob diferentes lâminas de irrigação. Semina Ciênc. Agrár. 2011, 32, 1251–1262. [Google Scholar] [CrossRef]
- Oukarroum, A.; Schansker, G.; Strasser, R.J. Drought Stress Effects on Photosystem I Content and Photosystem II Thermotolerance Analyzed Using Chl a Fluorescence Kinetics in Barley Varieties Differing in Their Drought Tolerance. Physiol. Plant. 2009, 137, 188–199. [Google Scholar] [CrossRef]
- Gonçalves, J.F.D.C.; Silva, C.E.; Guimarães, D.G.; Bernardes, R.S. Análise dos transientes da fluorescência da clorofila a de plantas jovens de Carapa guianensis e de Dipteryx odorata submetidas a dois ambientes de luz. Acta Amaz. 2010, 40, 89–98. [Google Scholar] [CrossRef] [Green Version]
- ISO 22866; Equipment for Crop Protection—Methods for Field Measurement of Spray Drift. International Organization for Standardization: Geneva, Switzerland, 2005.


| Spraying | Nozzle | Application Rate (L ha−1) | |
| 100 | 150 | ||
| 1 ª | MGA 60 01 | 32.29 bB | 38.42 bA |
| BD 015 | 66.93 aB | 80.99 AA | |
| CV = 31.39%. | W = 0.761 ns | FL = 1.249 ns | |
| Frate = 1.333 ns | Fnozzle = 5.177 * | Fiteration = 2.488 * | |
| Nozzle | Application Rate (L ha−1) | ||
| 100 | 150 | ||
| 2 ª | MGA 60 01 | 25.75 bB | 30.87 bA |
| BD 015 | 61.24 aB | 78.85 aA | |
| CV = 35.02%. | W = 0.881 ns | FL = 1.425 ns | |
| Frate = 1.394 ns | Fnozzle = 6.257 * | Fiteration = 2.661 * | |
| Spraying | Nozzle | Application Rate (L ha−1) | |
| 100 | 150 | ||
| 1 ª | MGA 60 01 | 42.41 Bb | 49.85 bA |
| BD 015 | 66.52 aB | 71.12 aA | |
| CV = 38.88%. | W = 0.881 ns | FL = 1.559 ns | |
| Frate = 1.513 ns | Fnozzle = 6.007 * | Fiteration = 2.772 * | |
| Nozzle | Application Rate (L ha−1) | ||
| 100 | 150 | ||
| 2 ª | MGA 60 01 | 39.94 Bb | 45.79 bA |
| BD 015 | 60.84 aB | 69.90 aA | |
| CV = 37.42%. | W = 0.902 ns | FL = 1.601ns | |
| Frate = 1.224 ns | Fnozzle = 5.987 * | Fiteration = 2.281 * | |
| Spraying | Nozzle | Application Rate (L ha−1) | |
| 100 | 150 | ||
| 1st application | MGA 60 01 | 278.11 bA | 280.96 bA |
| BD 015 | 329.98 AA | 327.19 aA | |
| CV = 29.87%. | W = 0.711 ns | FL = 1.5759 ns | |
| Frate = 1.513 ns | Fnozzle = 6.007 * | Fiteration = 2.772 ns | |
| Nozzle | Application Rate (L ha−1) | ||
| 100 | 150 | ||
| 2nd application | MGA 60 01 | 284.2 bA | 285.4 bA |
| BD 015 | 322.1 ea | 320.2 aA | |
| CV = 30.09%. | W = 0.862 ns | FL = 1.771 ns | |
| Frate = 1.555 ns | Fnozzle = 7.953 * | Fiteration = 1.442 ns | |
| Spraying | Nozzle | Application Rate (L ha−1) | |
| 100 | 150 | ||
| 1st application | MGA 60 01 | 3.45 bA | 3.57 bA |
| BD 015 | 4.79 aA | 5.01 aA | |
| CV = 19.98%. | W = 0.805 ns | FL = 2.229 ns | |
| Frate = 1.717 ns | Fnozzle = 8.215 * | Fiteration = 2.772 * | |
| Nozzle | Application Rate (L ha−1) | ||
| 100 | 150 | ||
| 2nd application | MGA 60 01 | 3.88 bA | 3.95 bA |
| BD 015 | 4.92 aA | 5.11 aA | |
| CV = 30.09%. | W = 0.862 ns | FL = 1.771 ns | |
| Frate = 1.555 ns | Fnozzle = 7.953 * | Fiteration = 1.442 ns | |
| Nozzle | Description | Pressure min/max (kPa) | Flow min/max. (L min−1) | Droplet Size |
|---|---|---|---|---|
| MGA 60 | hollow cone | 270/1040 | 0.39/0.68 | Very fine |
| BD 015 | flat fan nozzles | 100/450 | 0.36/0.70 | Fine |
| Spraying | Temp min/max (°C) | RH min/max (%) | WS min/max (m s−1) |
|---|---|---|---|
| 7 DAP | 23.8/24.1 | 65/66 | 1.1/1.6 |
| 30 DAP | 25.2/25.3 | 58/60 | 1.3/1.8 |
| ChlaF Parameters and Formulas | Description |
|---|---|
| Fo ≅ F20µs | Minimal fluorescence, when all PSII RCs are open |
| F300µs | Fluorescence intensity at 300 µs ms of OJIP |
| FJ ≅ F2ms | Fluorescence intensity at the J-step (2 ms) of OJIP |
| FI ≅ F30ms | Fluorescence intensity at the I-step (30 ms) of OJIP |
| FP ≅ F300ms = FM | Maximal fluorescence at the peak P, when all PSII RCs are closed |
| VJ = (F2ms − F0)/(FM − F0) | Relative variable fluorescence at the J-step |
| VI = (F30ms − F0)/(FM − F0) | Relative variable fluorescence at the I-step |
| ABS/RC = Mo·(1/Vj)·(1/φPo) | Absorption flux per active reaction center (RC) |
| TR0/RC = Mo·(1/Vj) | Trapped energy flux per RC (at t = 0) |
| ET0/RC = Mo·(1/Vj)·ψEo | electron transport flux per RC (at t ¼ 0) |
| DIo/RC = [(ABS/RC) − (TRo/RC)] | Dissipated energy flux per RC at t = 0 |
| RC/CSo = φPo·(Vj/Mo)·(ABS/CS) | QA-reducing RCs per CS |
| PIABS = [(RC/ABS) × (φP0)/(1 − φP0) × (ψE0)/(1 − ψE0)] | Performance index of PSII based on absorption |
| FV/FM = TR0/ABS = φPo | maximum quantum yield for PSII primary photochemistry |
Disclaimer/Publisher’s Note: The statements, opinions and data contained in all publications are solely those of the individual author(s) and contributor(s) and not of MDPI and/or the editor(s). MDPI and/or the editor(s) disclaim responsibility for any injury to people or property resulting from any ideas, methods, instructions or products referred to in the content. |
© 2023 by the authors. Licensee MDPI, Basel, Switzerland. This article is an open access article distributed under the terms and conditions of the Creative Commons Attribution (CC BY) license (https://creativecommons.org/licenses/by/4.0/).
Share and Cite
Soela, D.M.; da Vitória, E.L.; Falqueto, A.R.; Ribeiro, L.F.O.; Simon, C.A.; Sigismondi, L.R.; Jegeski, R.F.; Pereira, L.D.B. Photosystem II Performance of Coffea canephora Seedlings after Sunscreen Application. Plants 2023, 12, 1467. https://doi.org/10.3390/plants12071467
Soela DM, da Vitória EL, Falqueto AR, Ribeiro LFO, Simon CA, Sigismondi LR, Jegeski RF, Pereira LDB. Photosystem II Performance of Coffea canephora Seedlings after Sunscreen Application. Plants. 2023; 12(7):1467. https://doi.org/10.3390/plants12071467
Chicago/Turabian StyleSoela, Débora Moro, Edney Leandro da Vitória, Antelmo Ralph Falqueto, Luis Felipe Oliveira Ribeiro, Cátia Aparecida Simon, Luciano Rastoldo Sigismondi, Rodrigo Fraga Jegeski, and Leandro Demetriu Becatiini Pereira. 2023. "Photosystem II Performance of Coffea canephora Seedlings after Sunscreen Application" Plants 12, no. 7: 1467. https://doi.org/10.3390/plants12071467