
Nitrogen Supplementation Modulates Morphological, Biochemical, Yield and Quality Attributes of Peppermint

 , , and
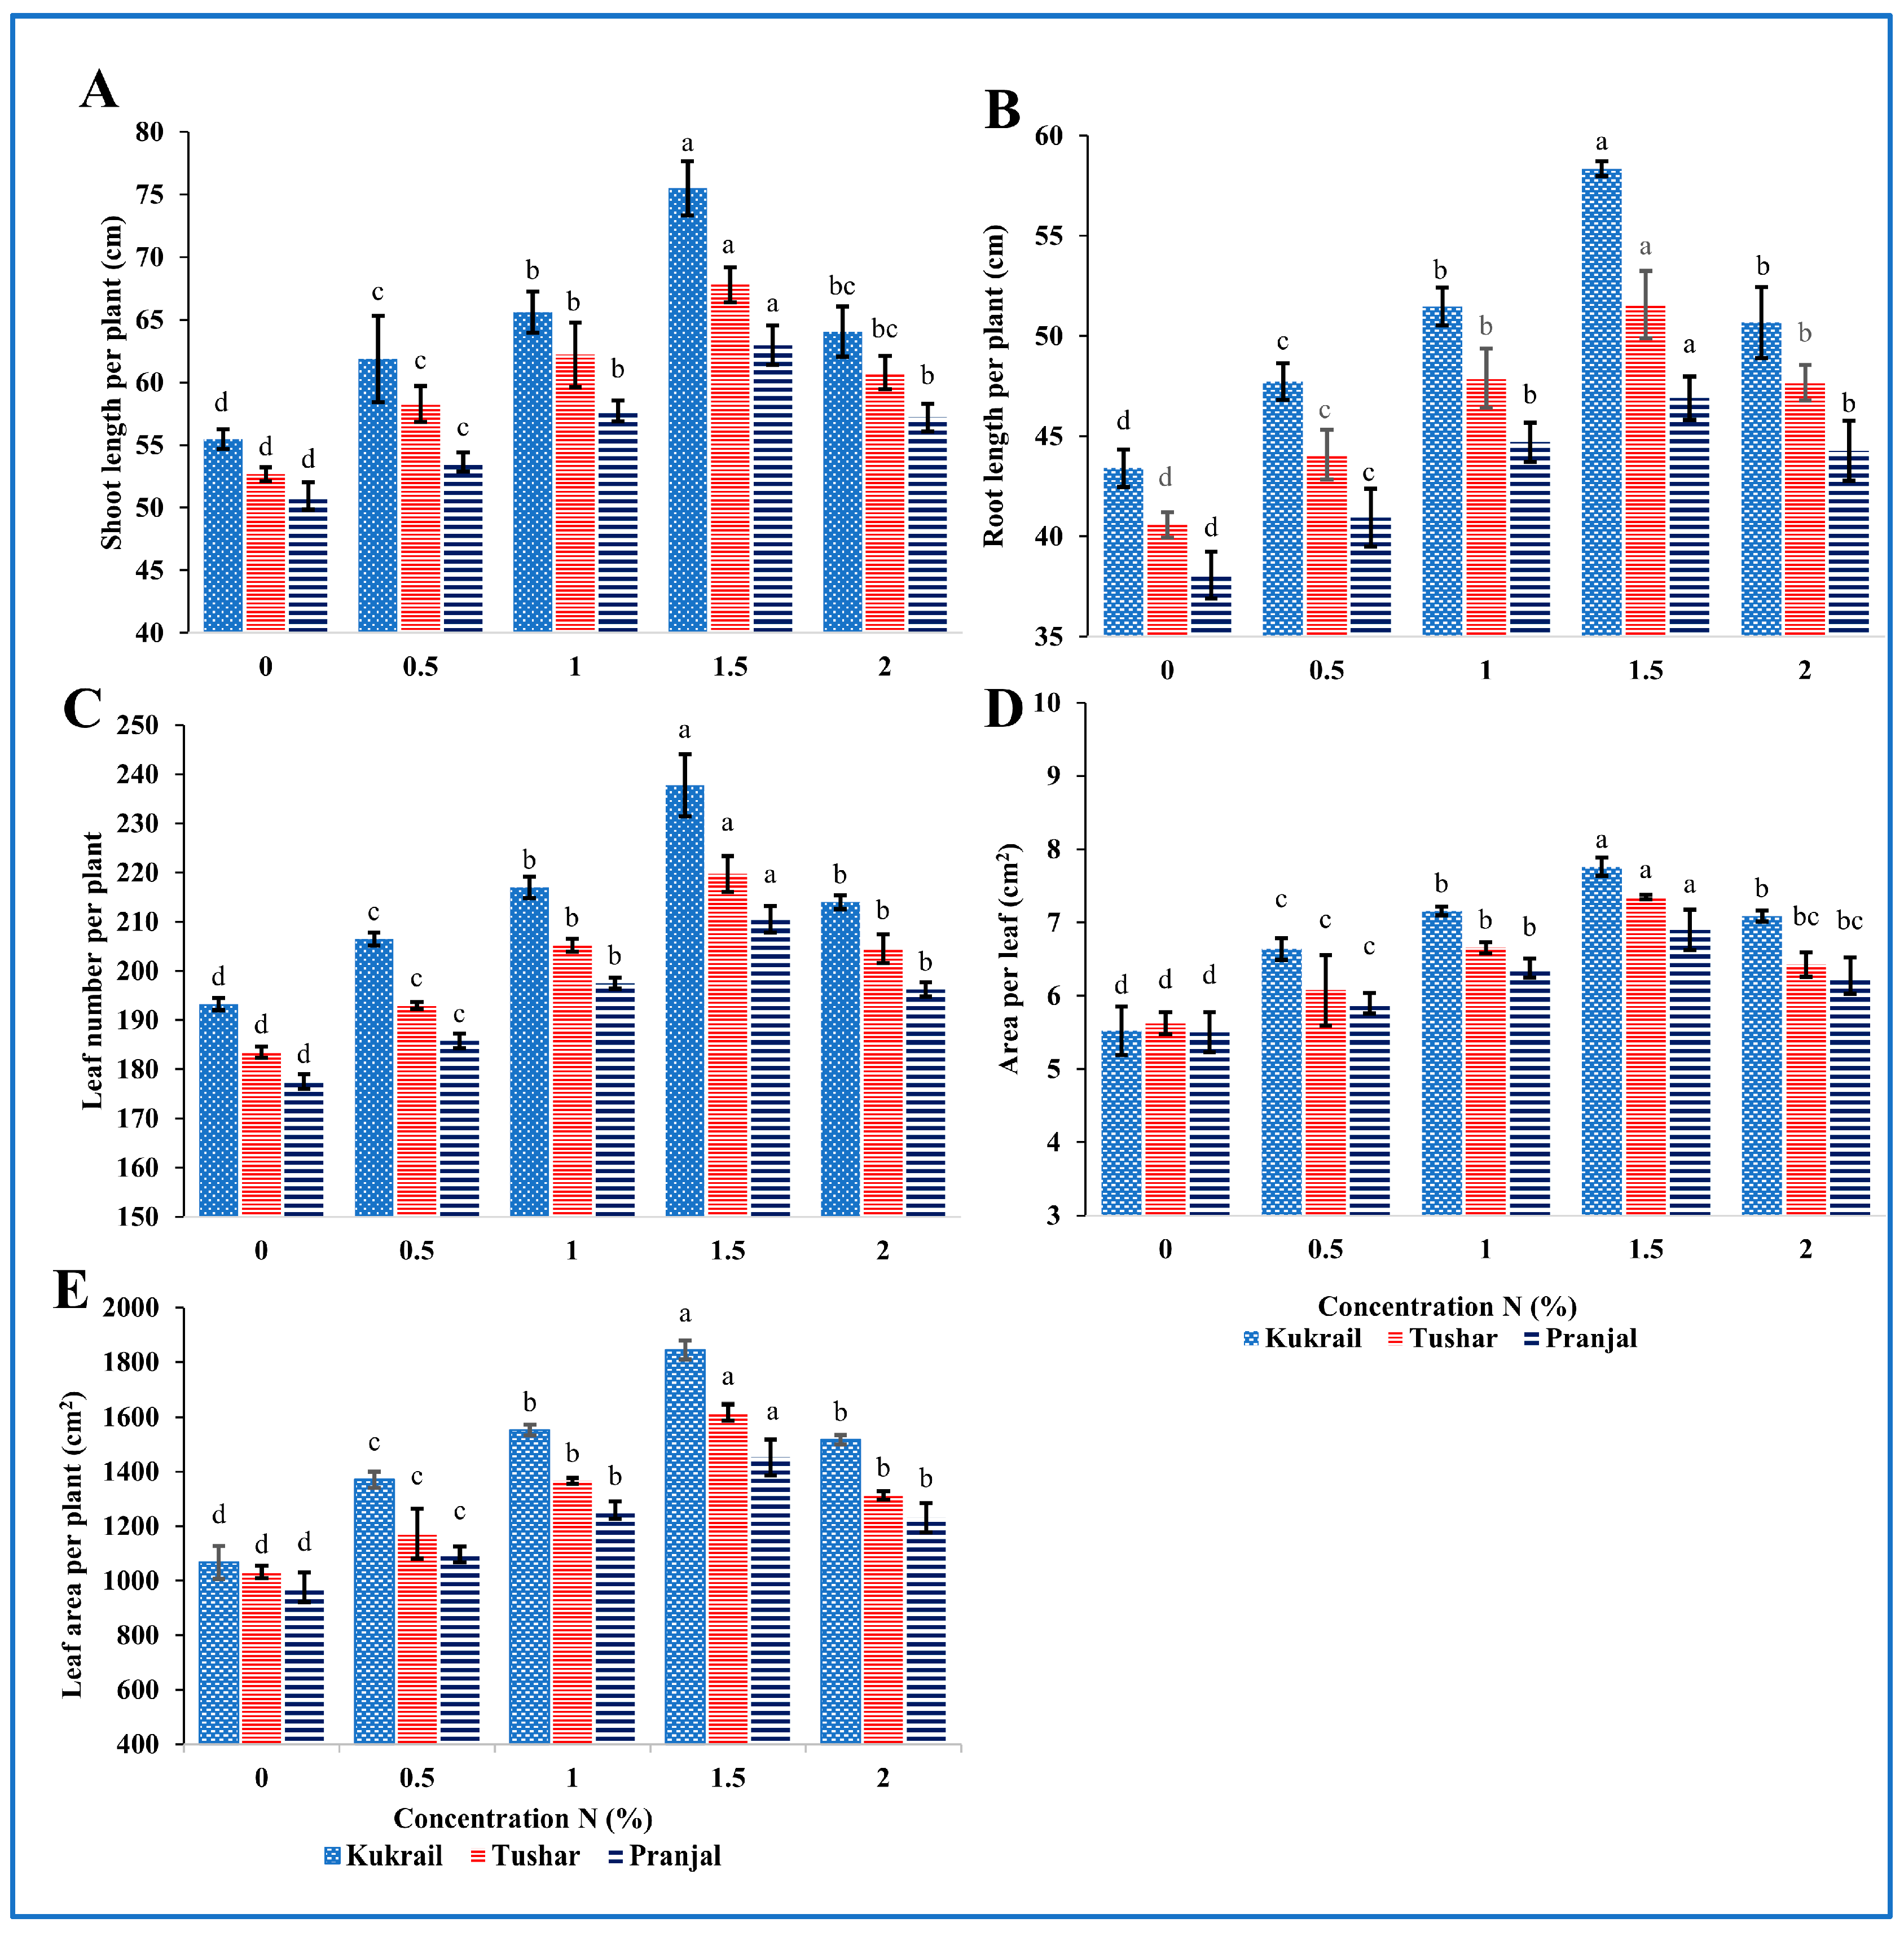
Abstract
:1. Introduction
2. Results
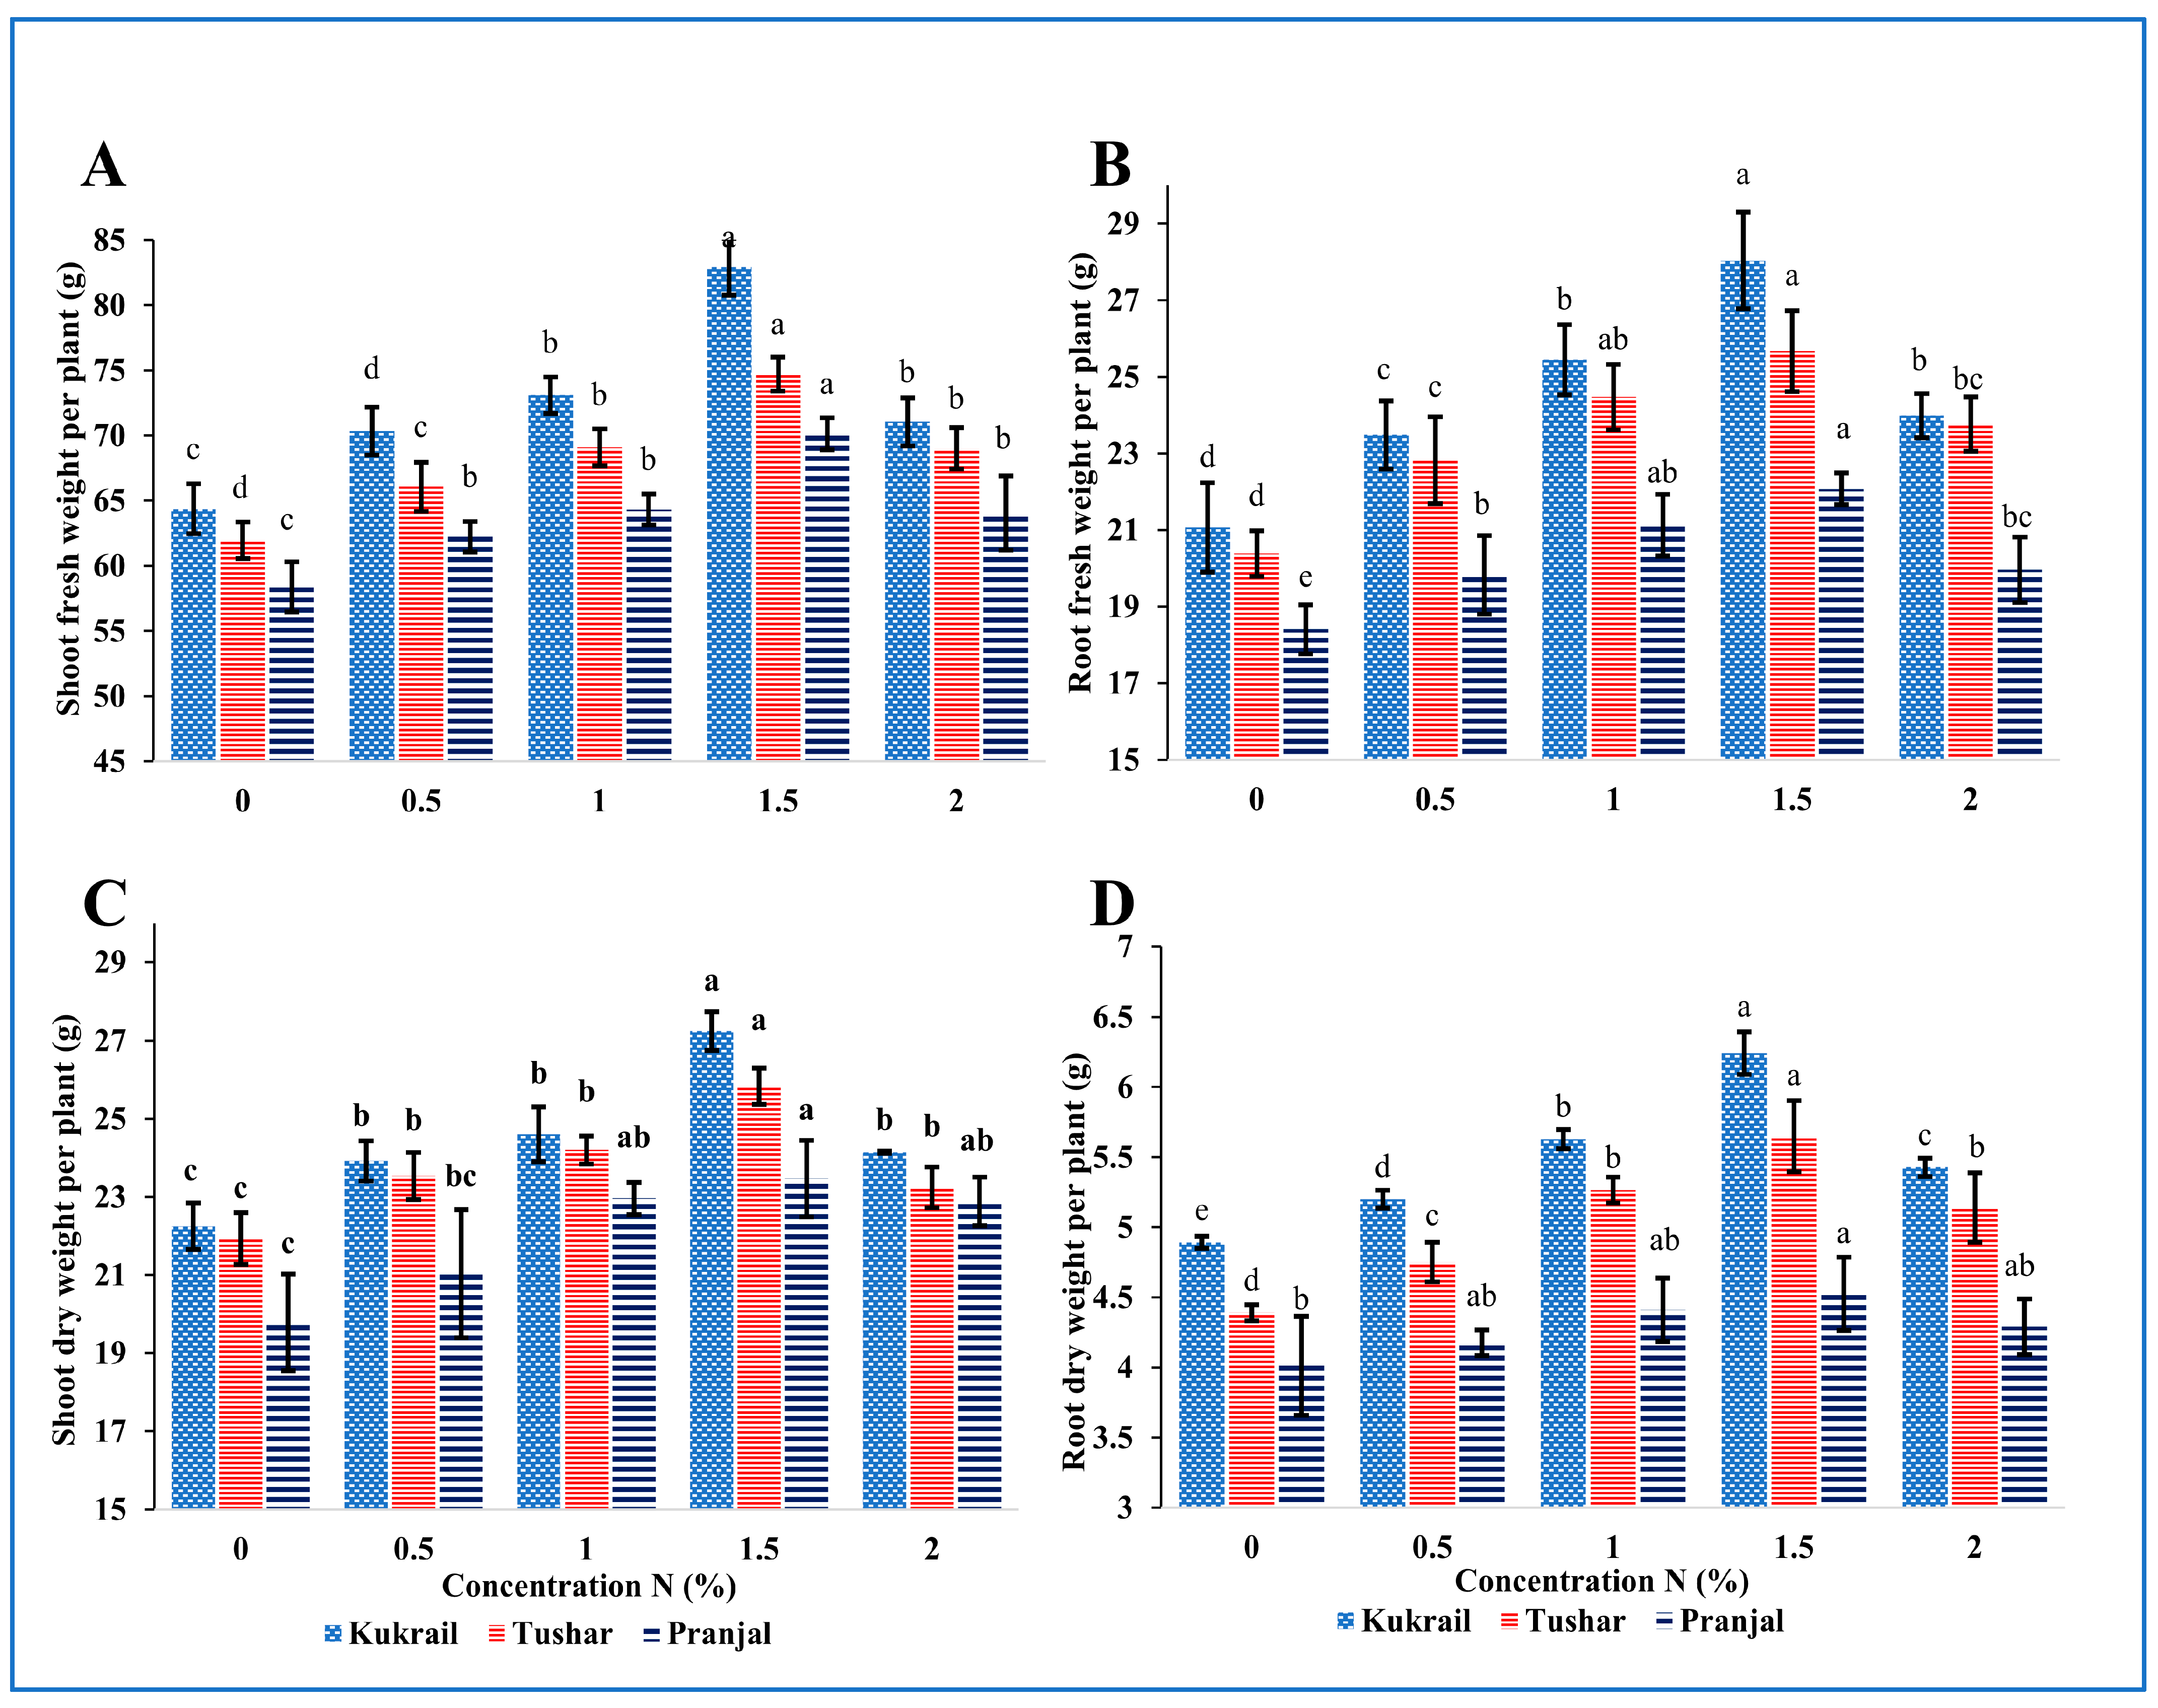
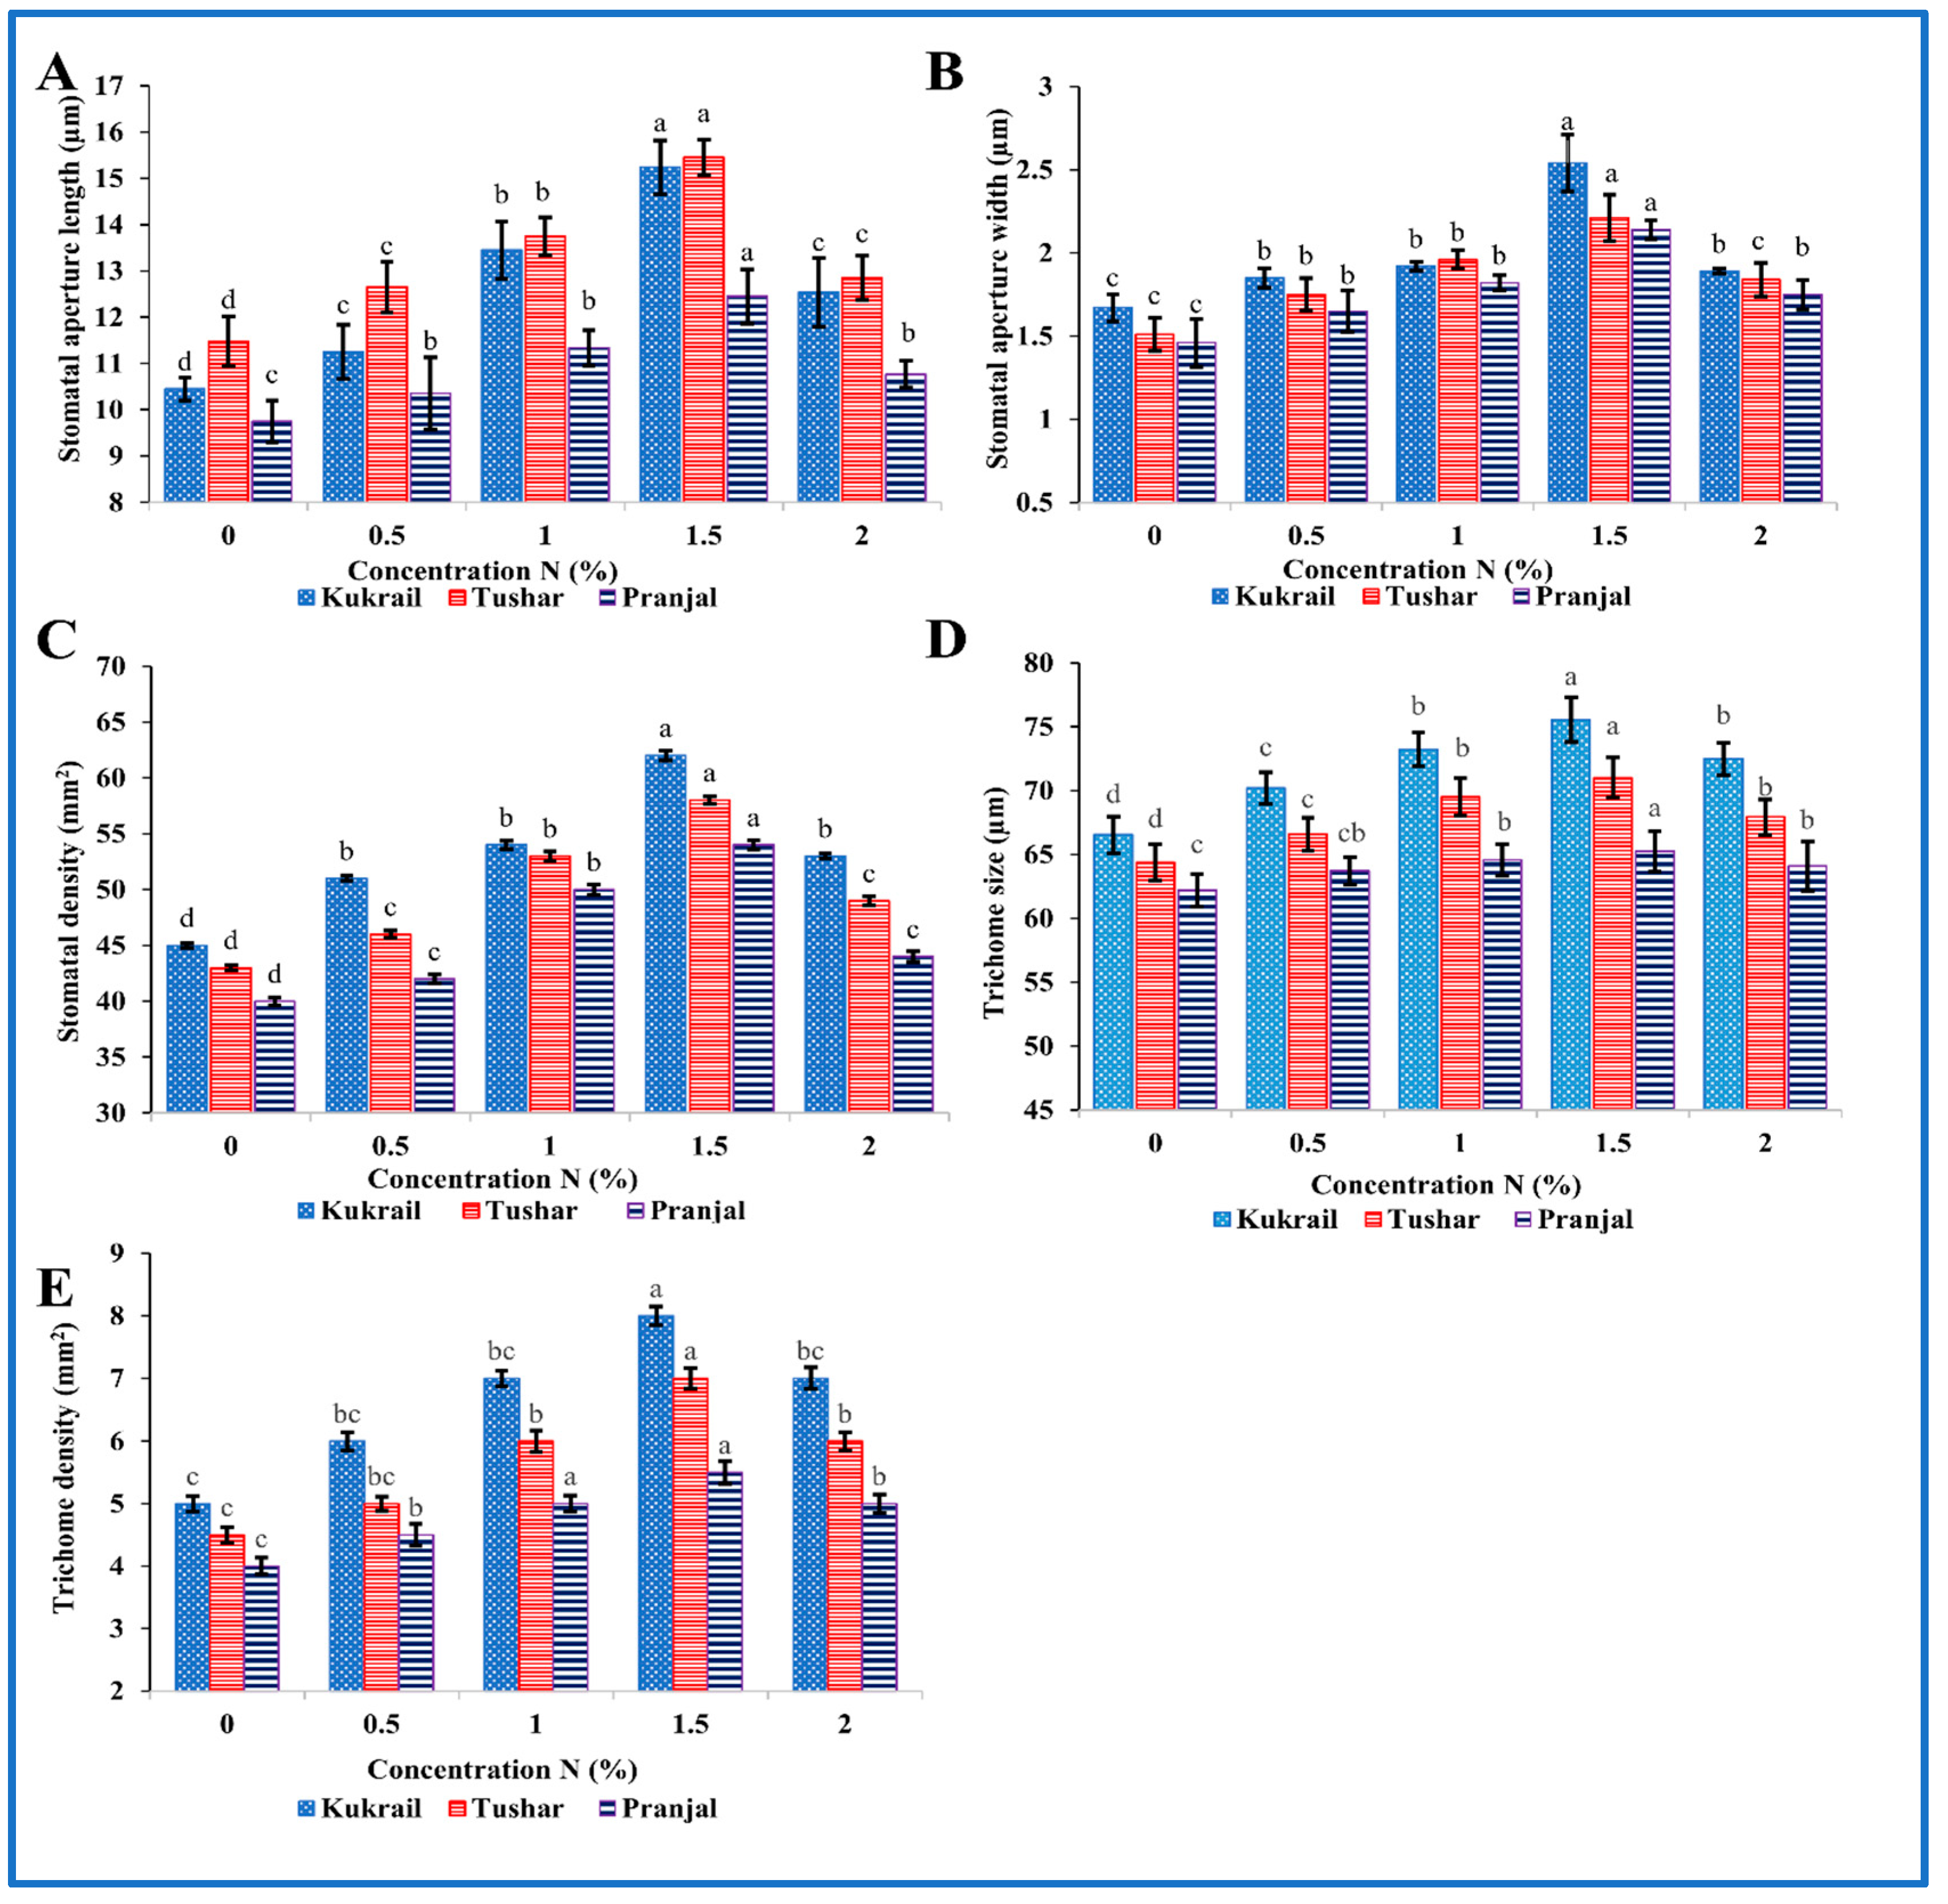
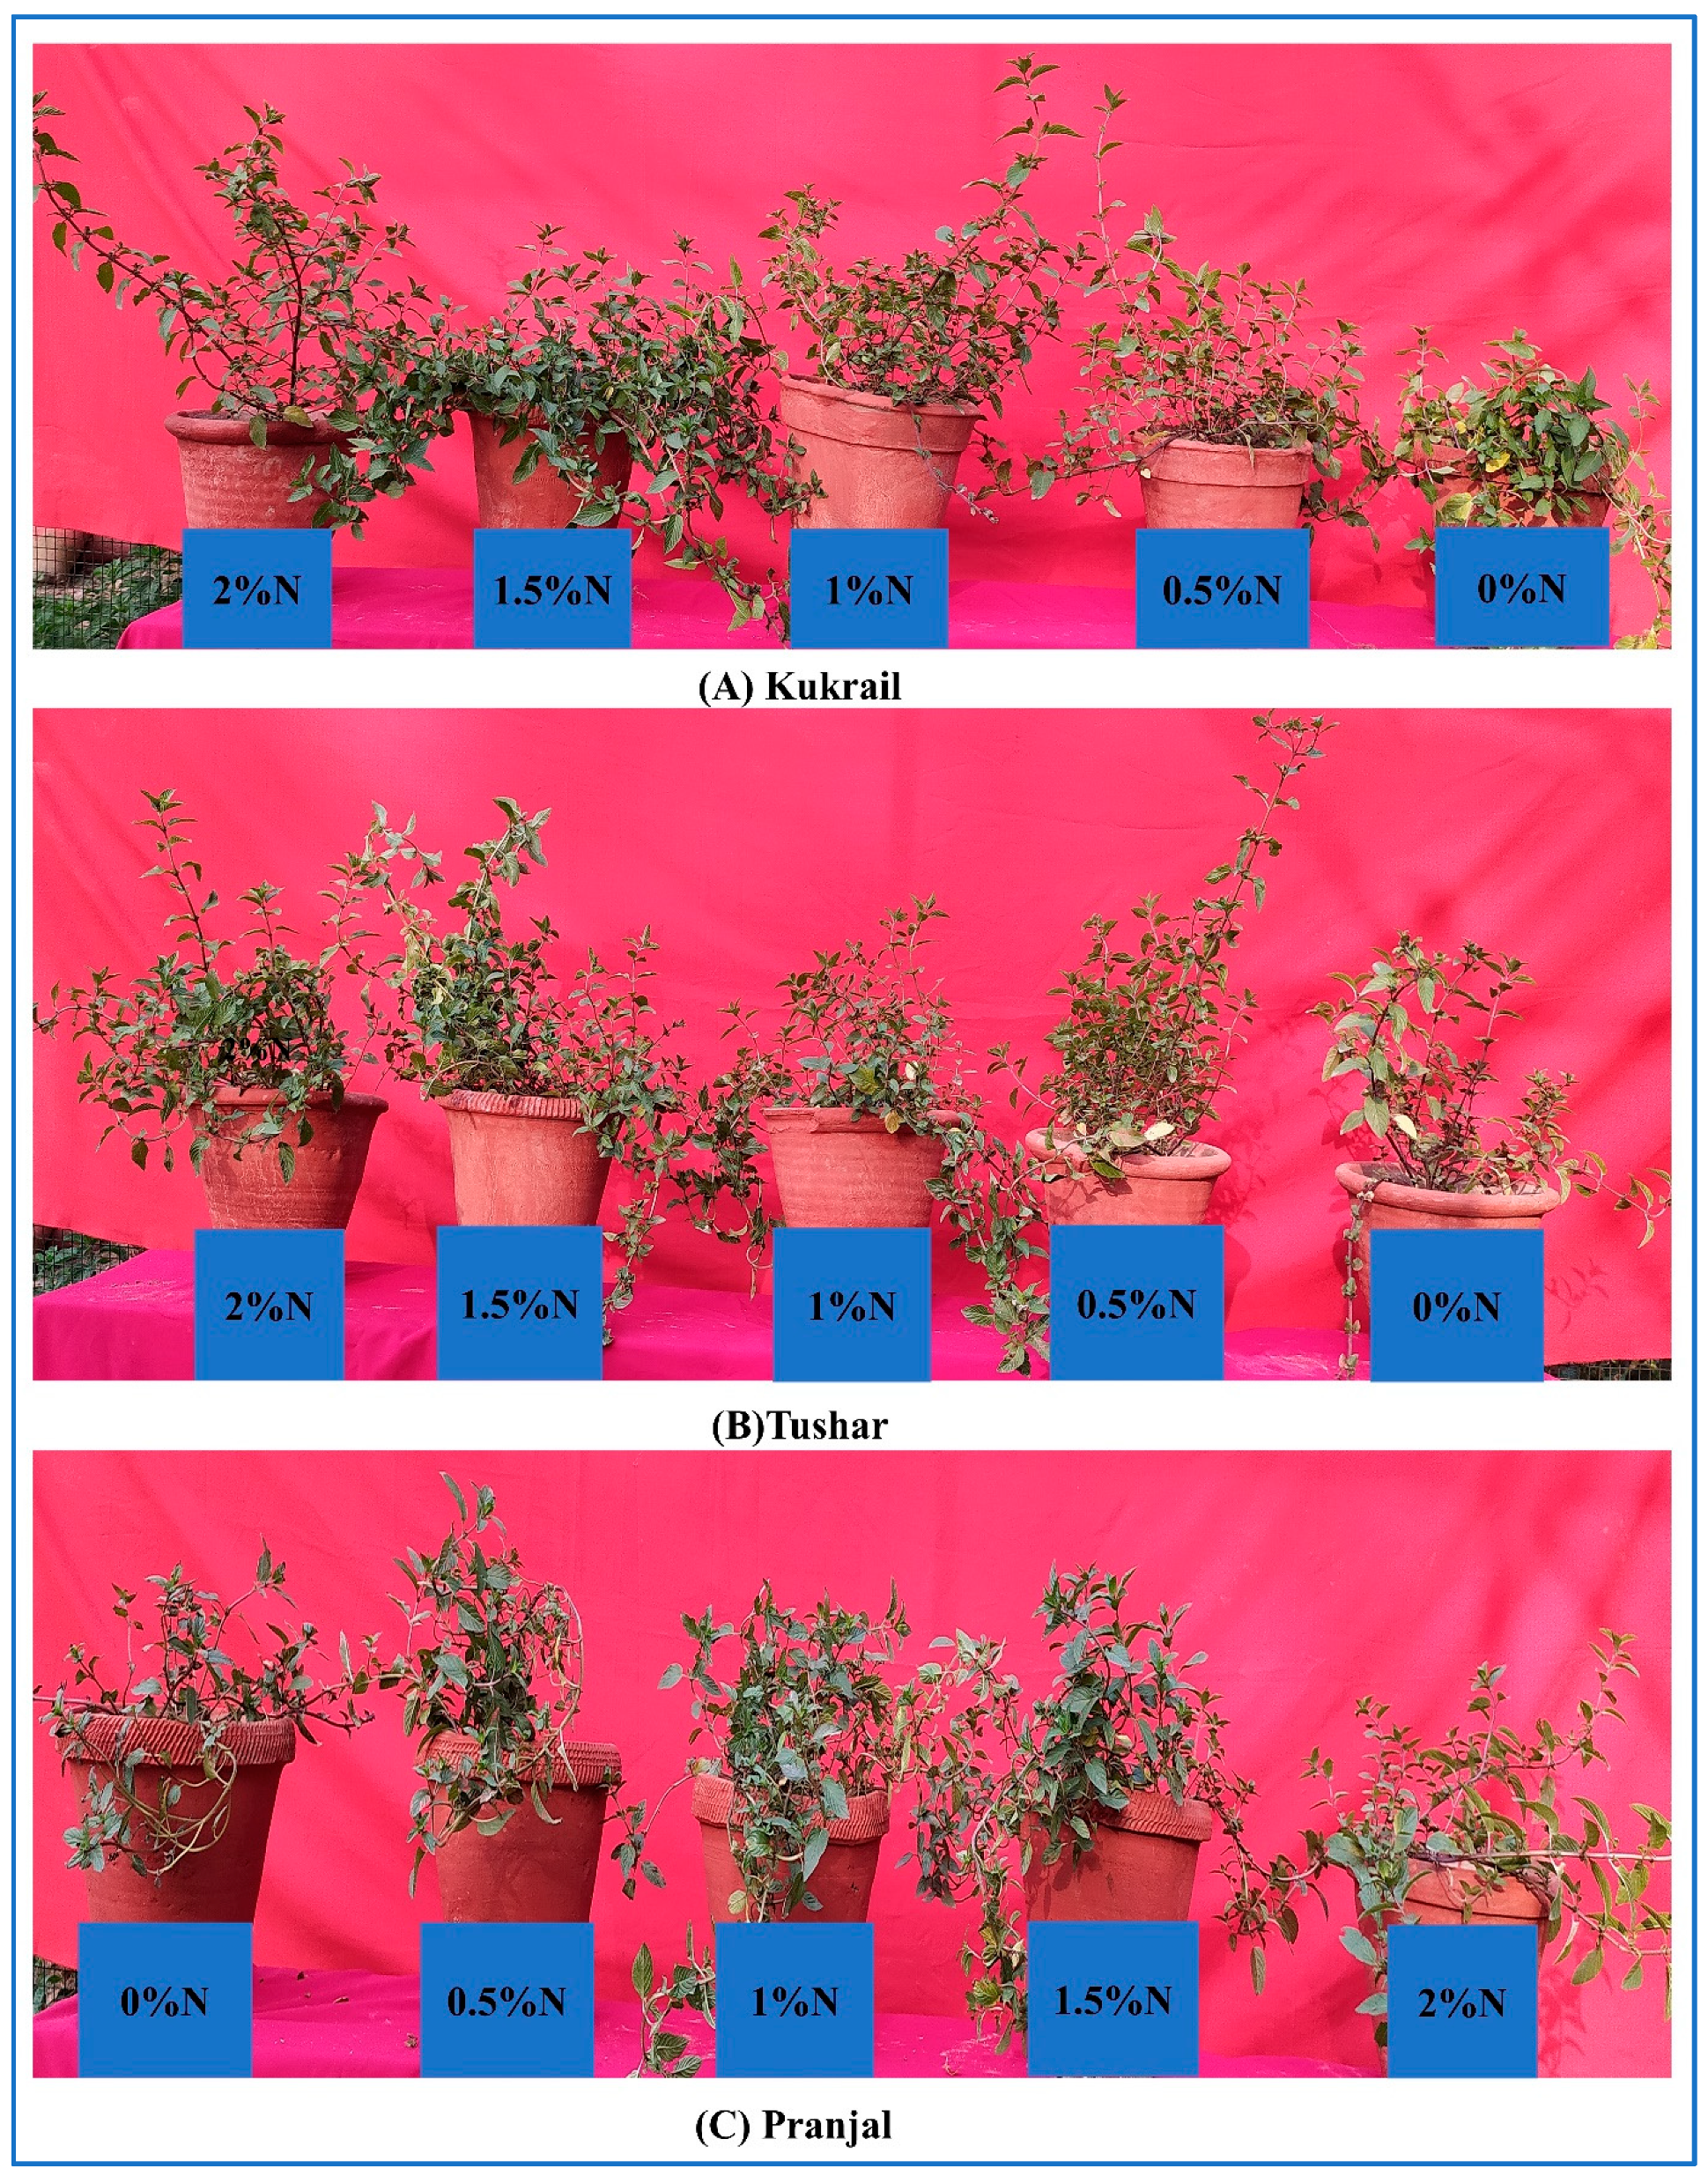
2.1. Nitrogen Supplementation Modulates the Morphology of Peppermint
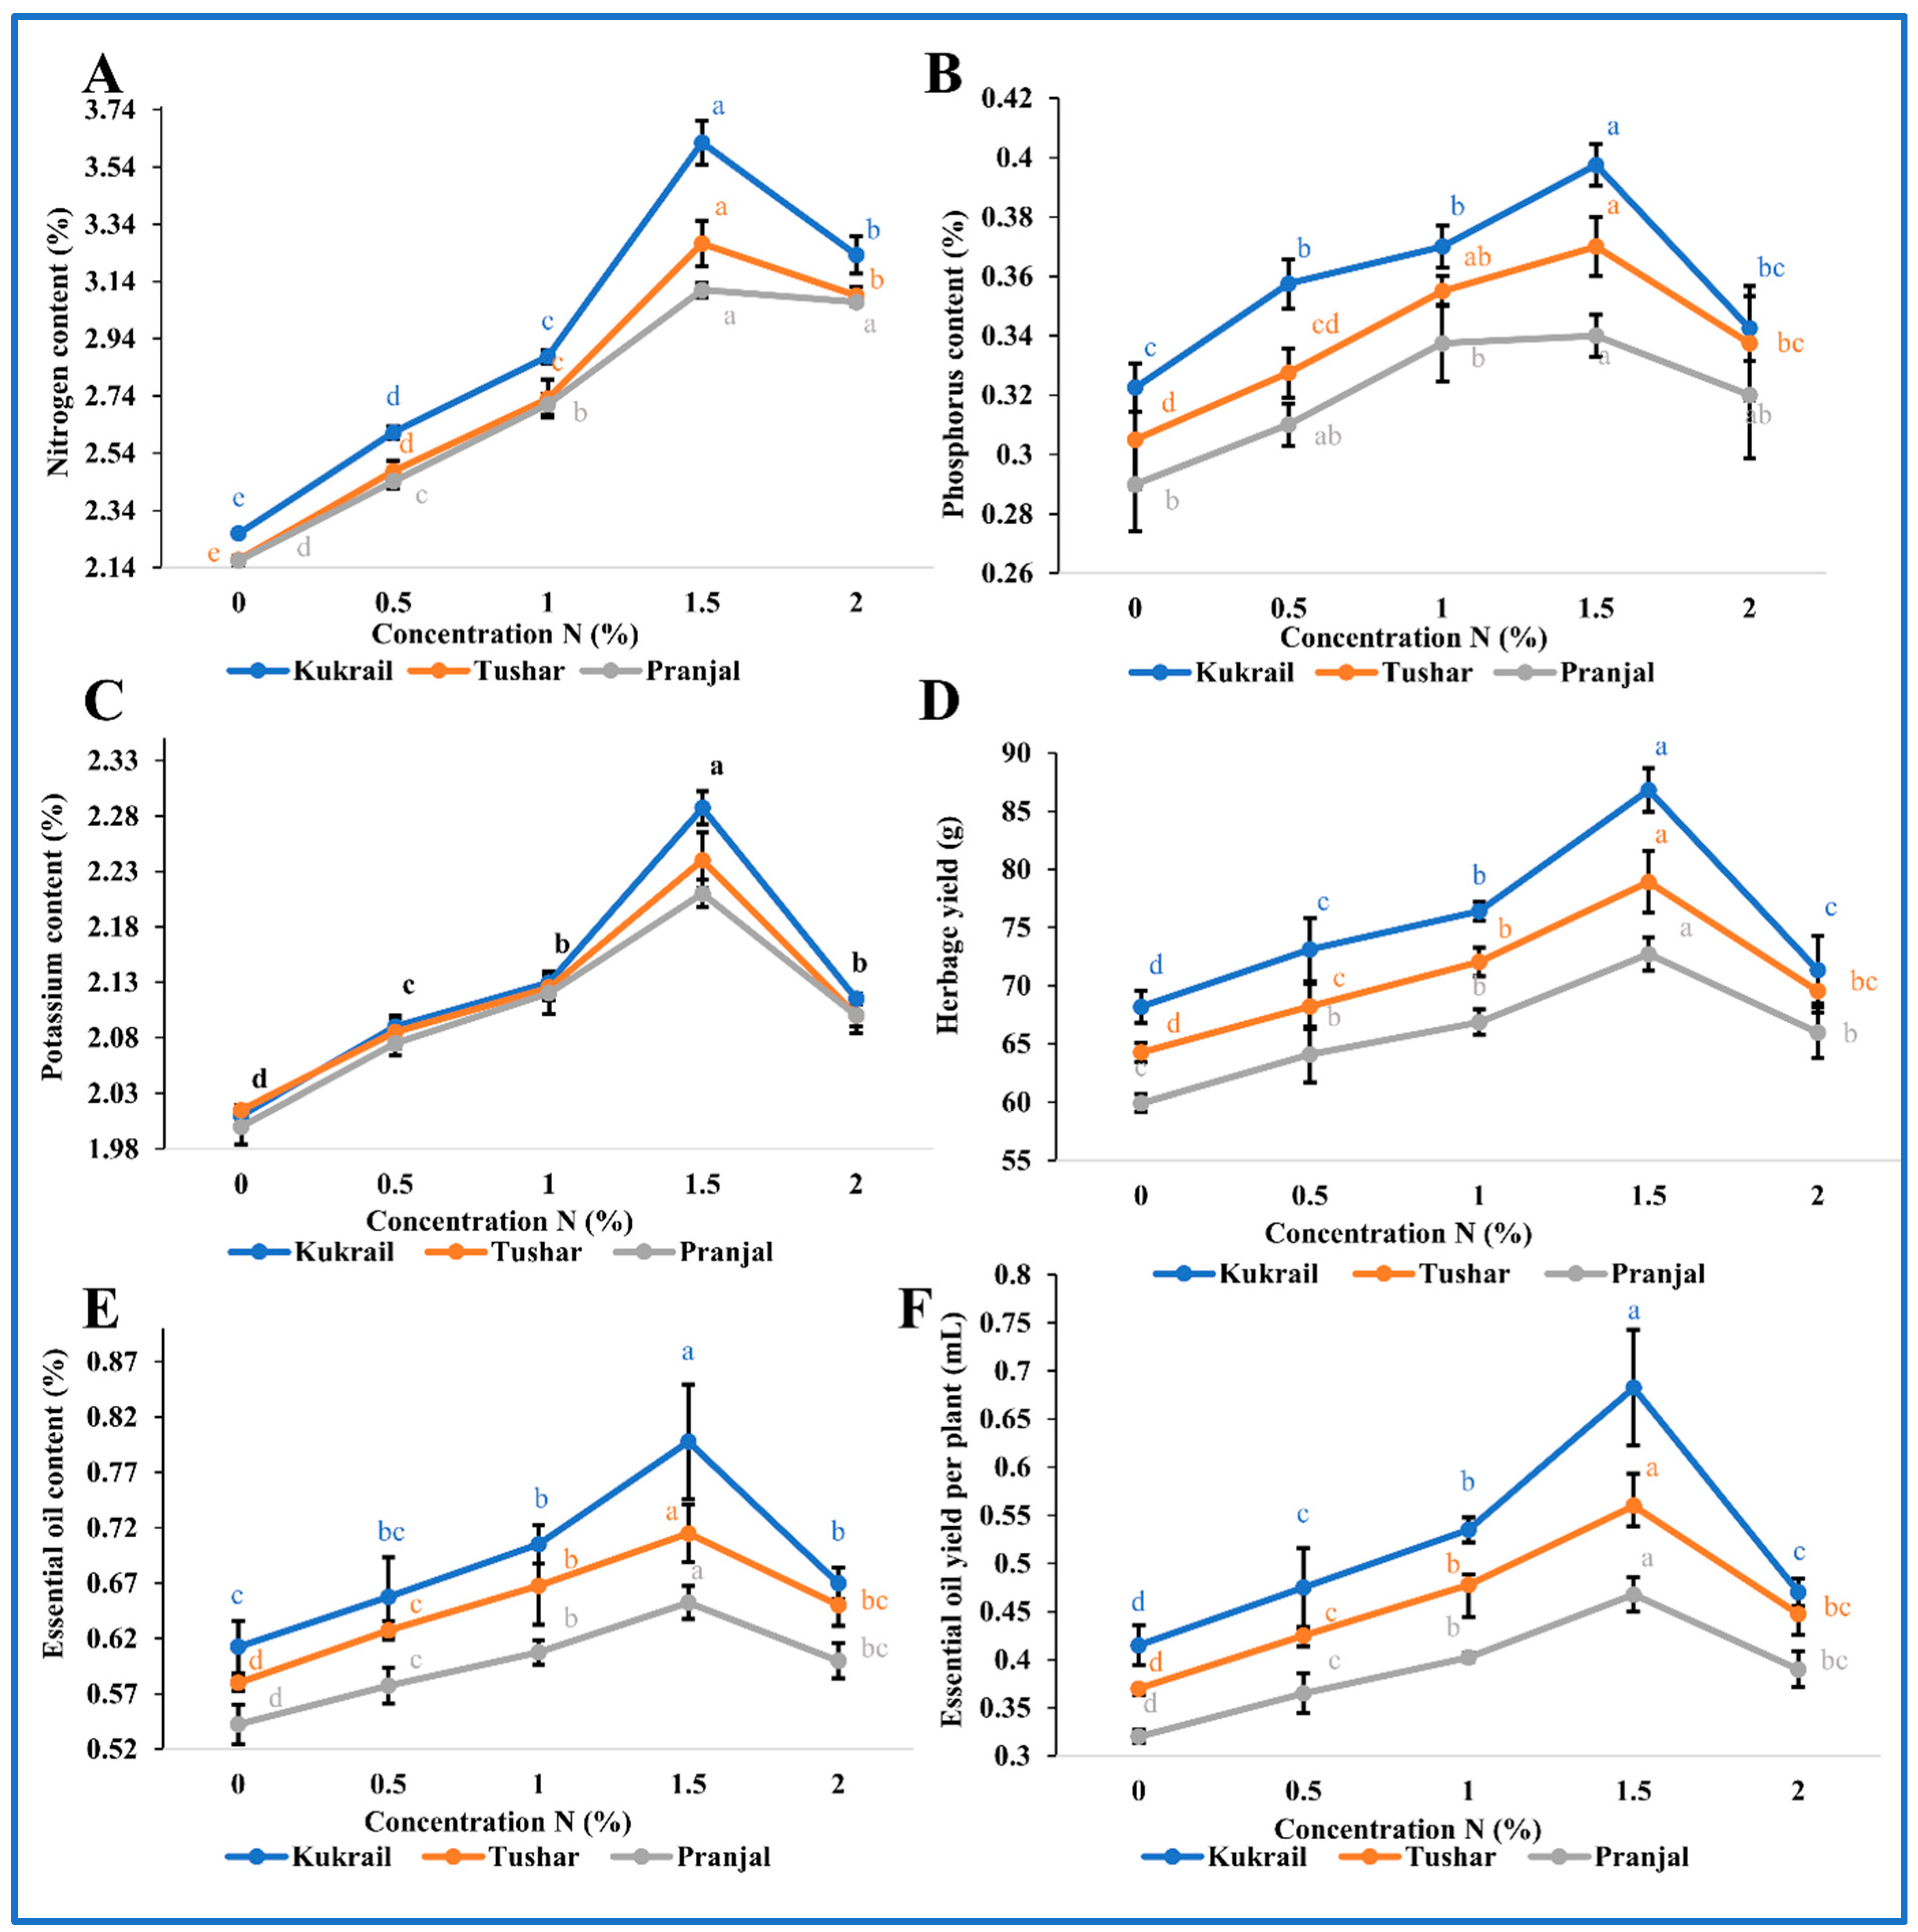
2.2. Nitrogen Supplementation Regulates Physio-Biochemical Attributes and Mineral Nutrients of Peppermint
2.3. Effect of N Application on the Yield and Quality Attributes of Peppermint
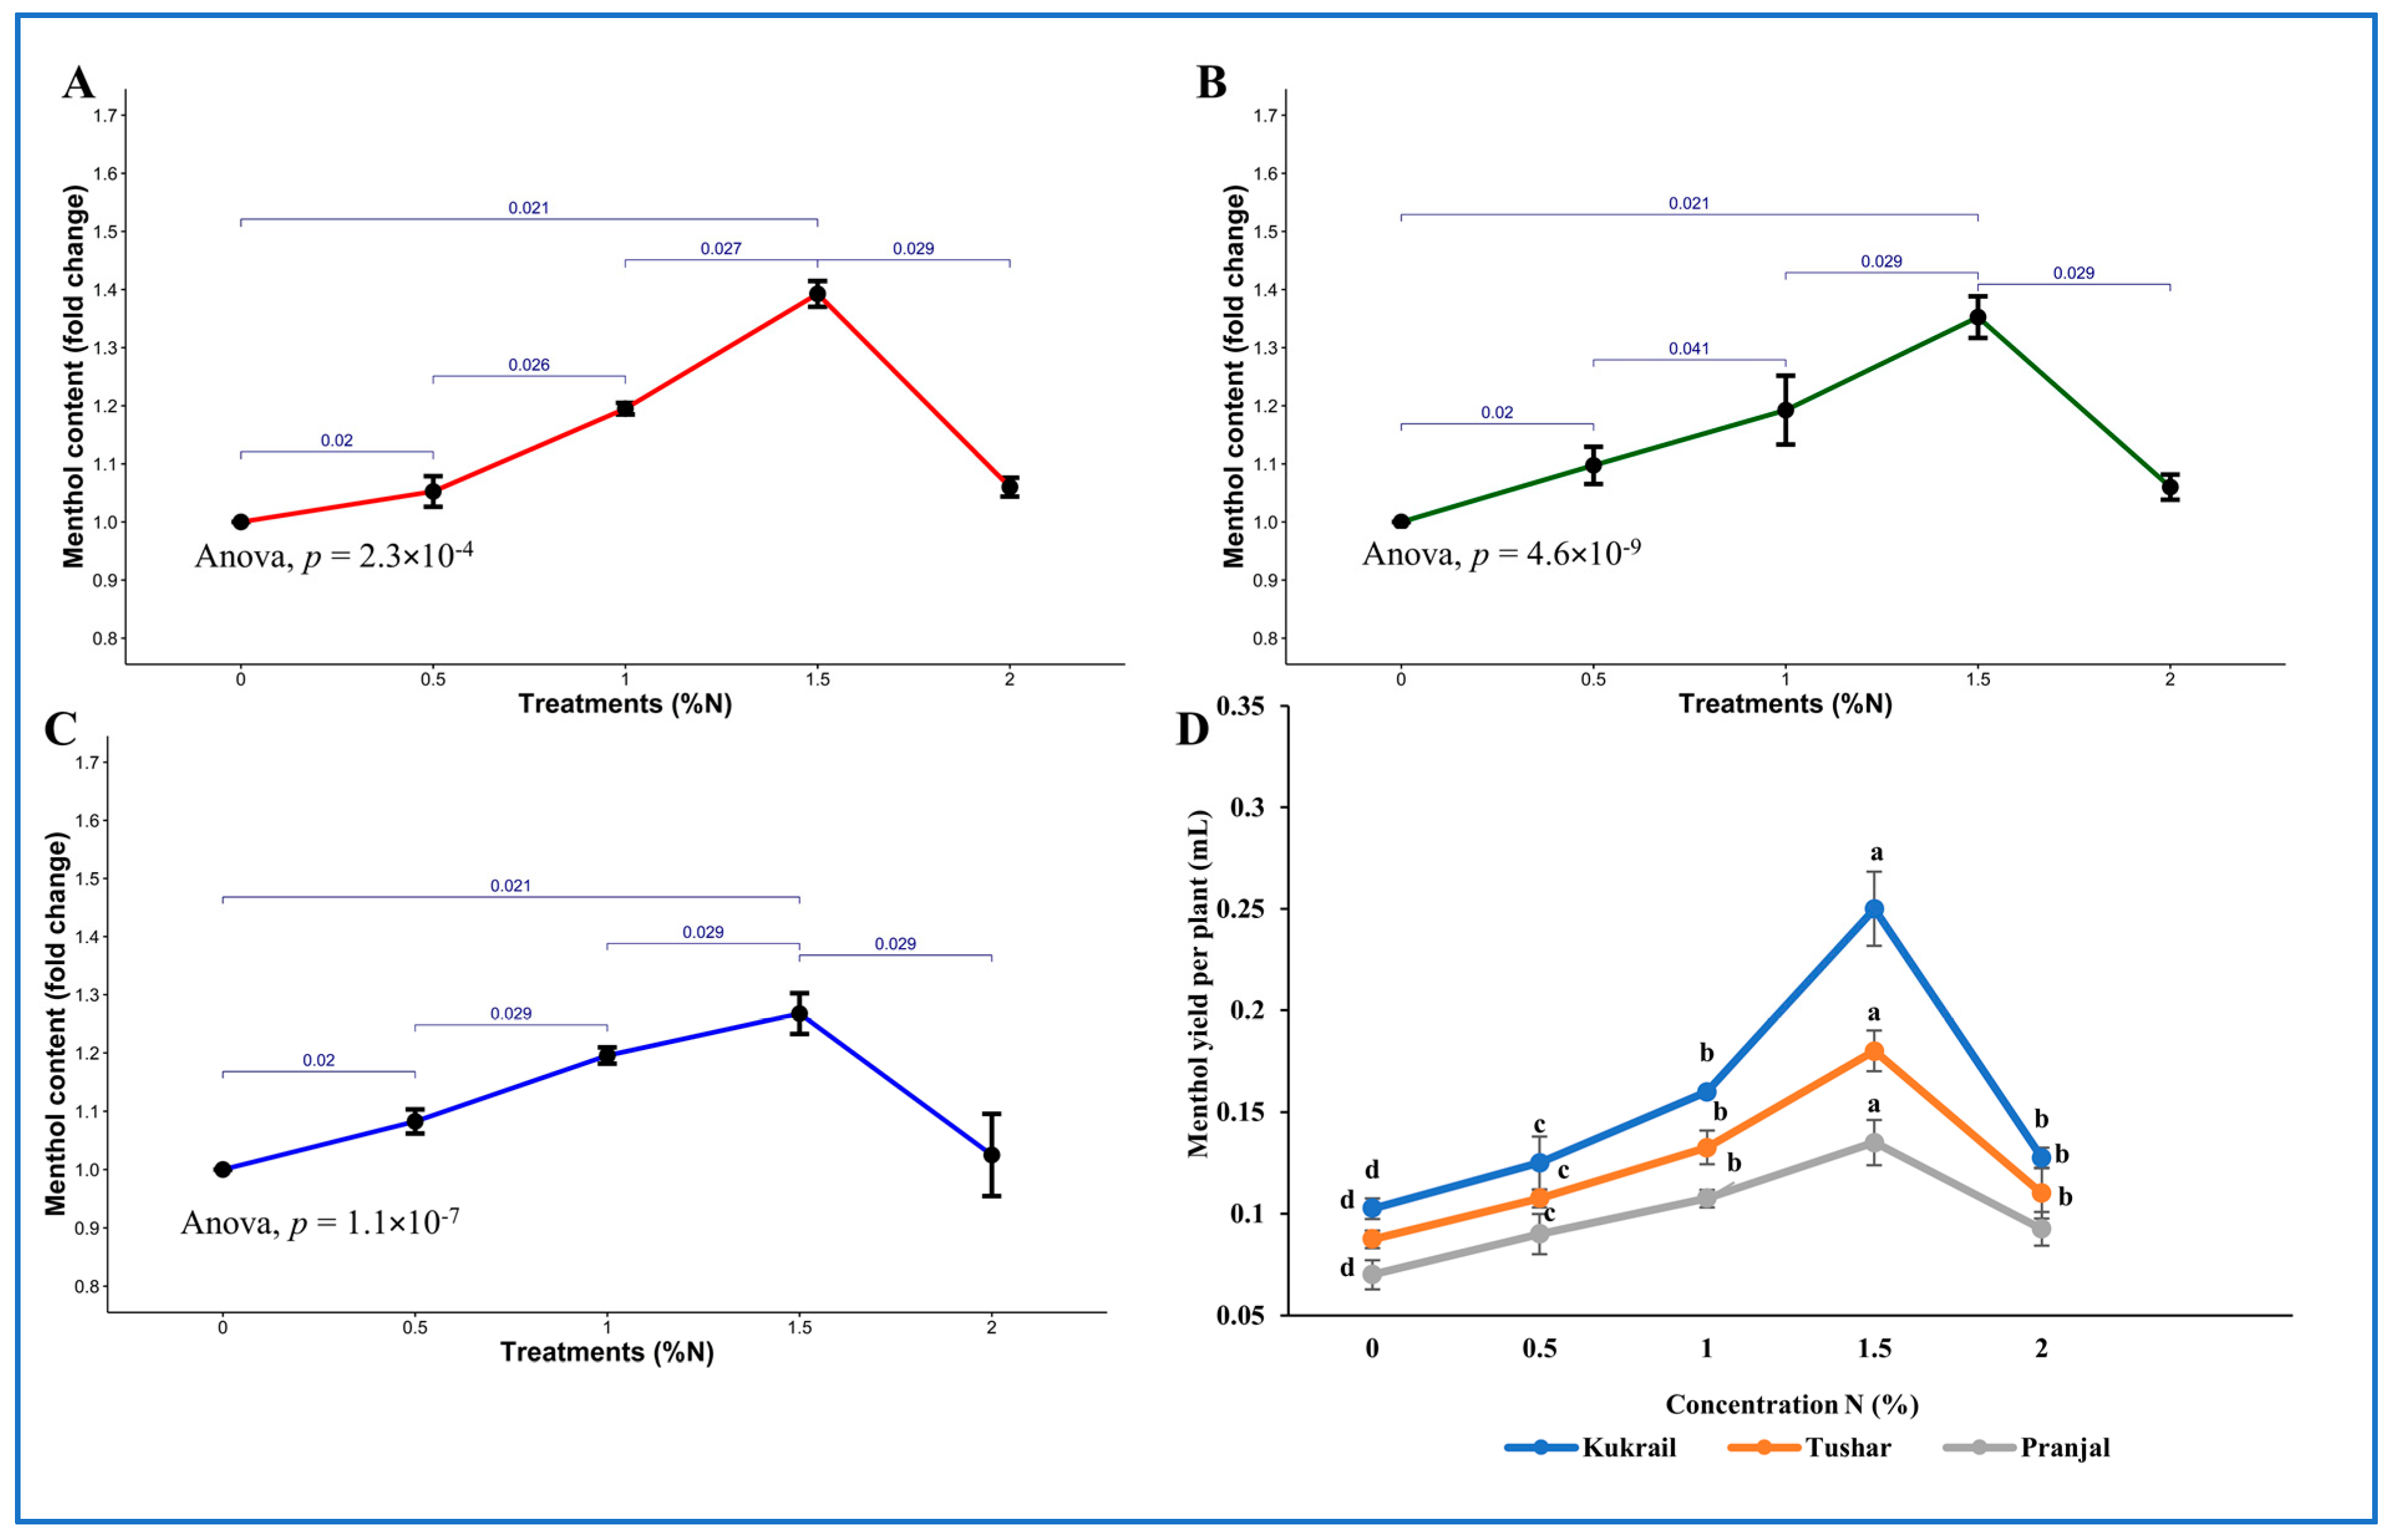
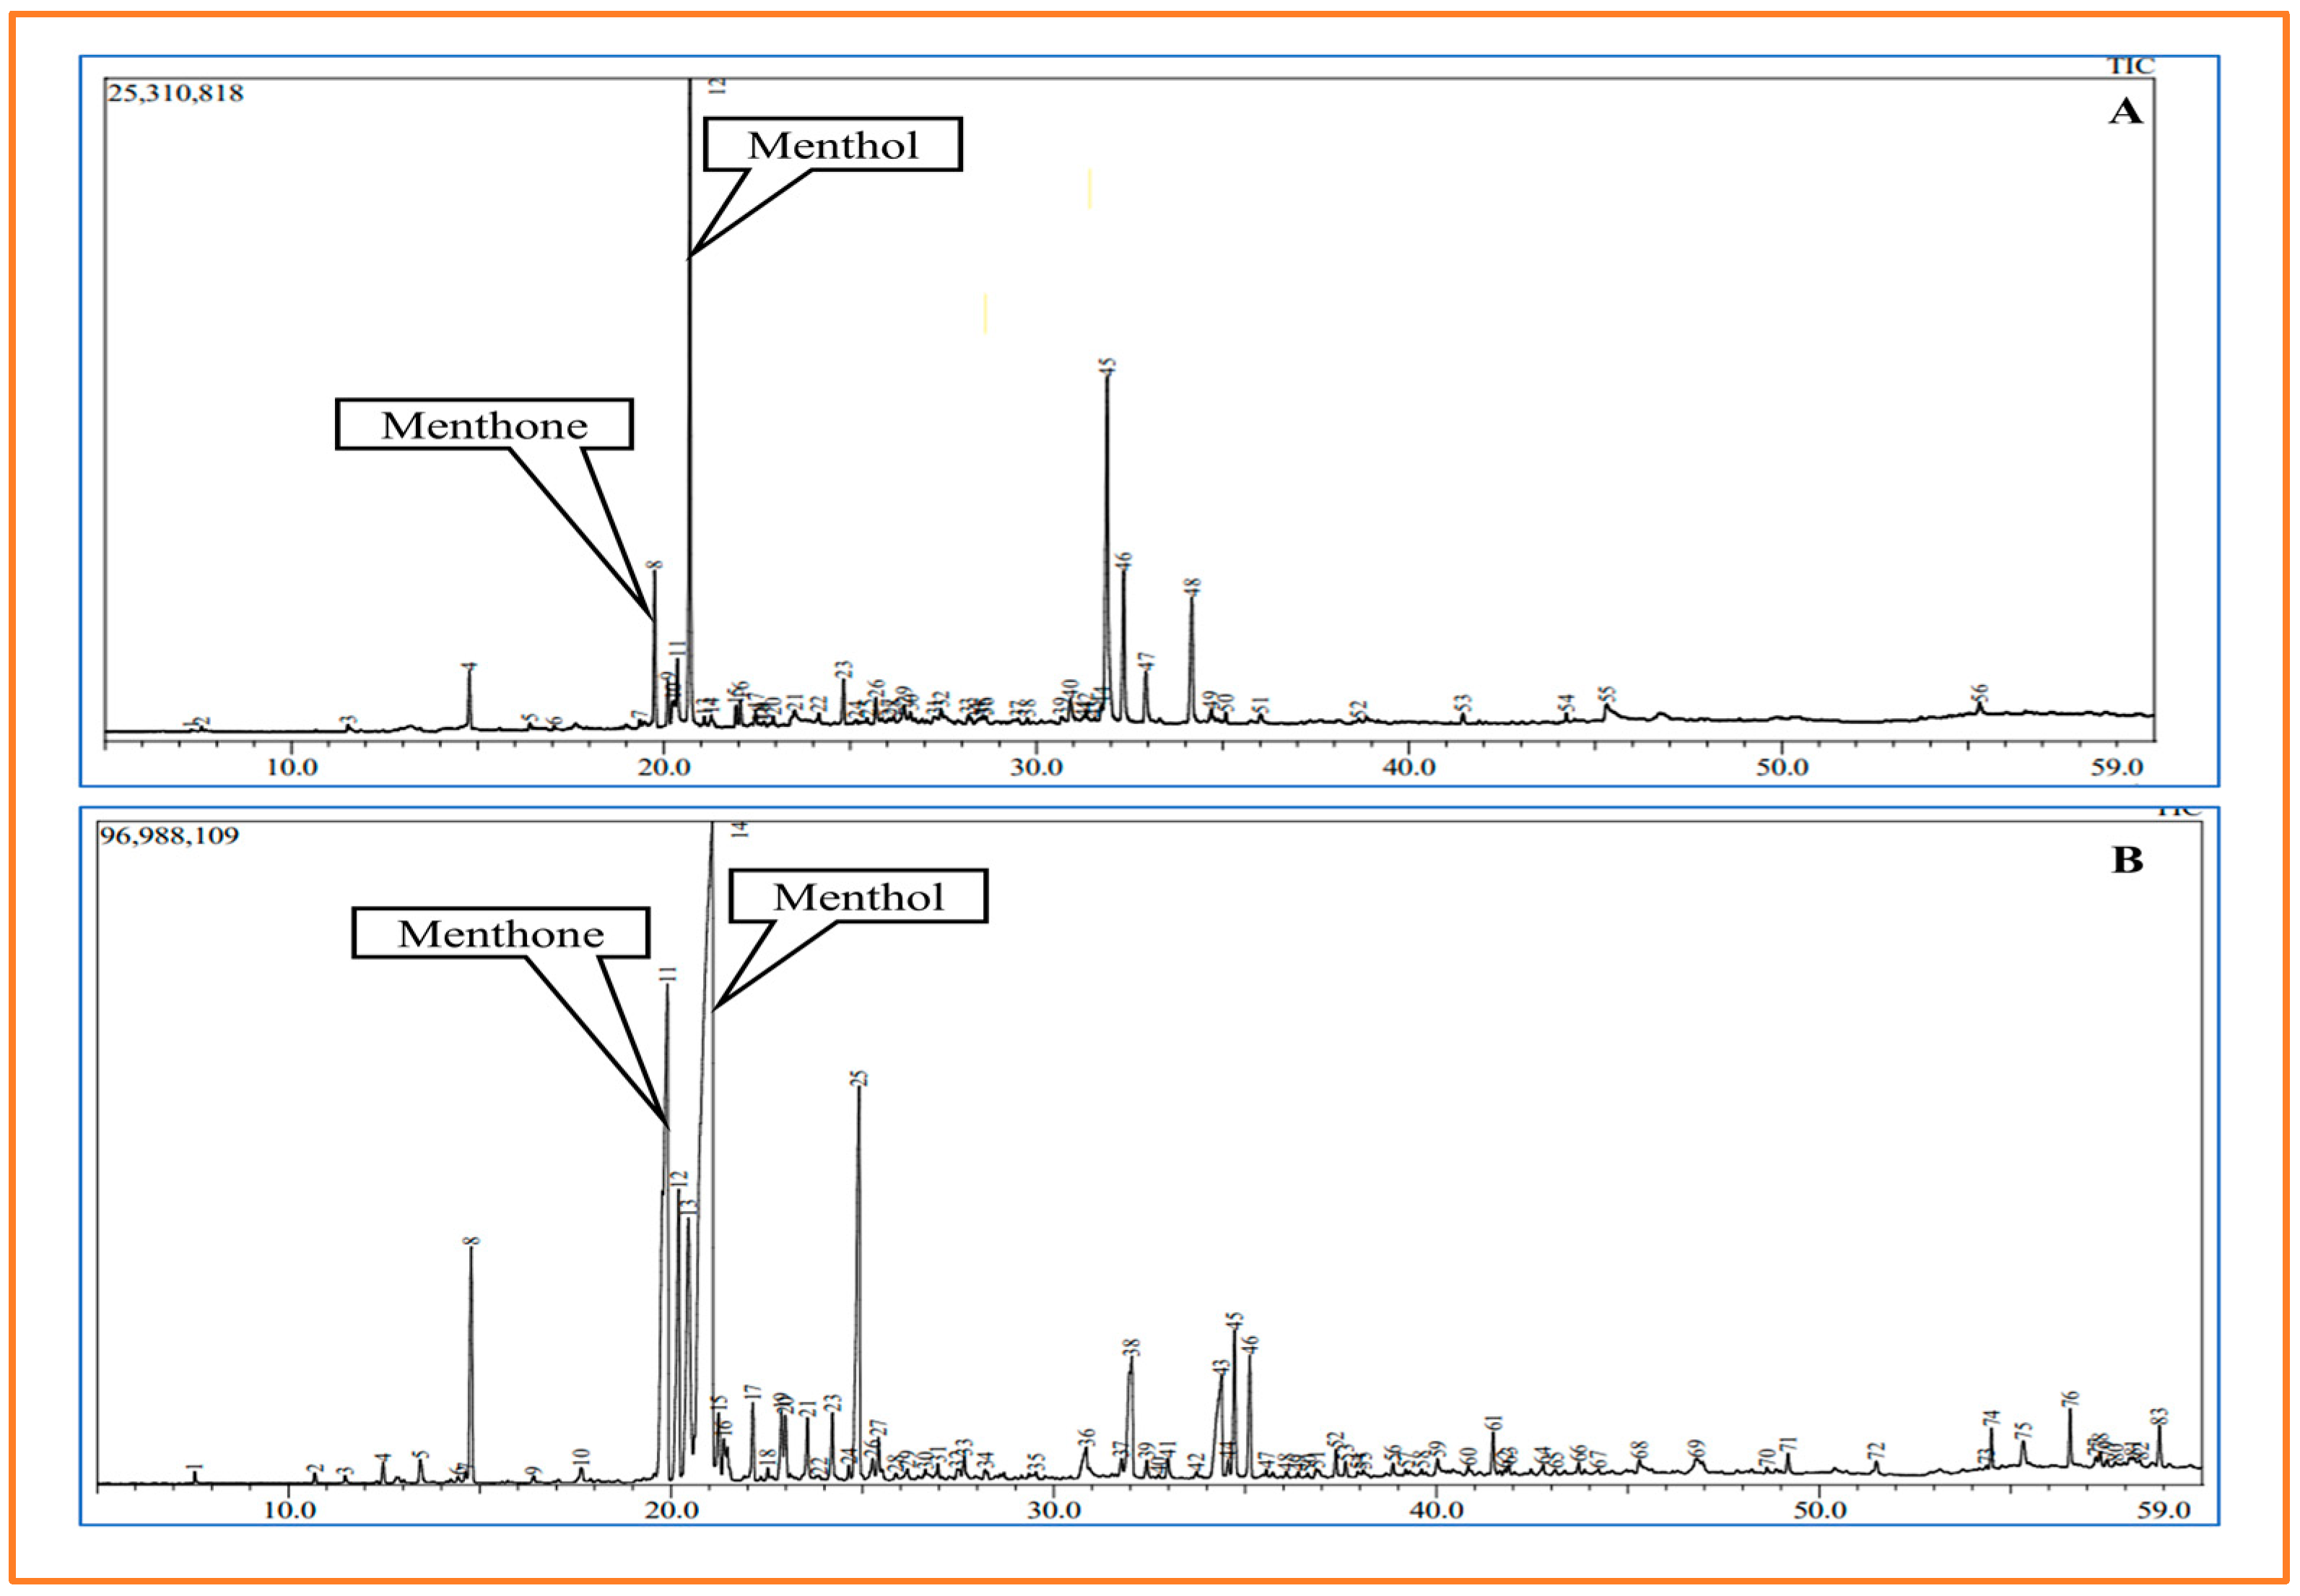
Effect of N on the Menthol Content of Peppermint Cultivars
2.4. Microscopical Analysis
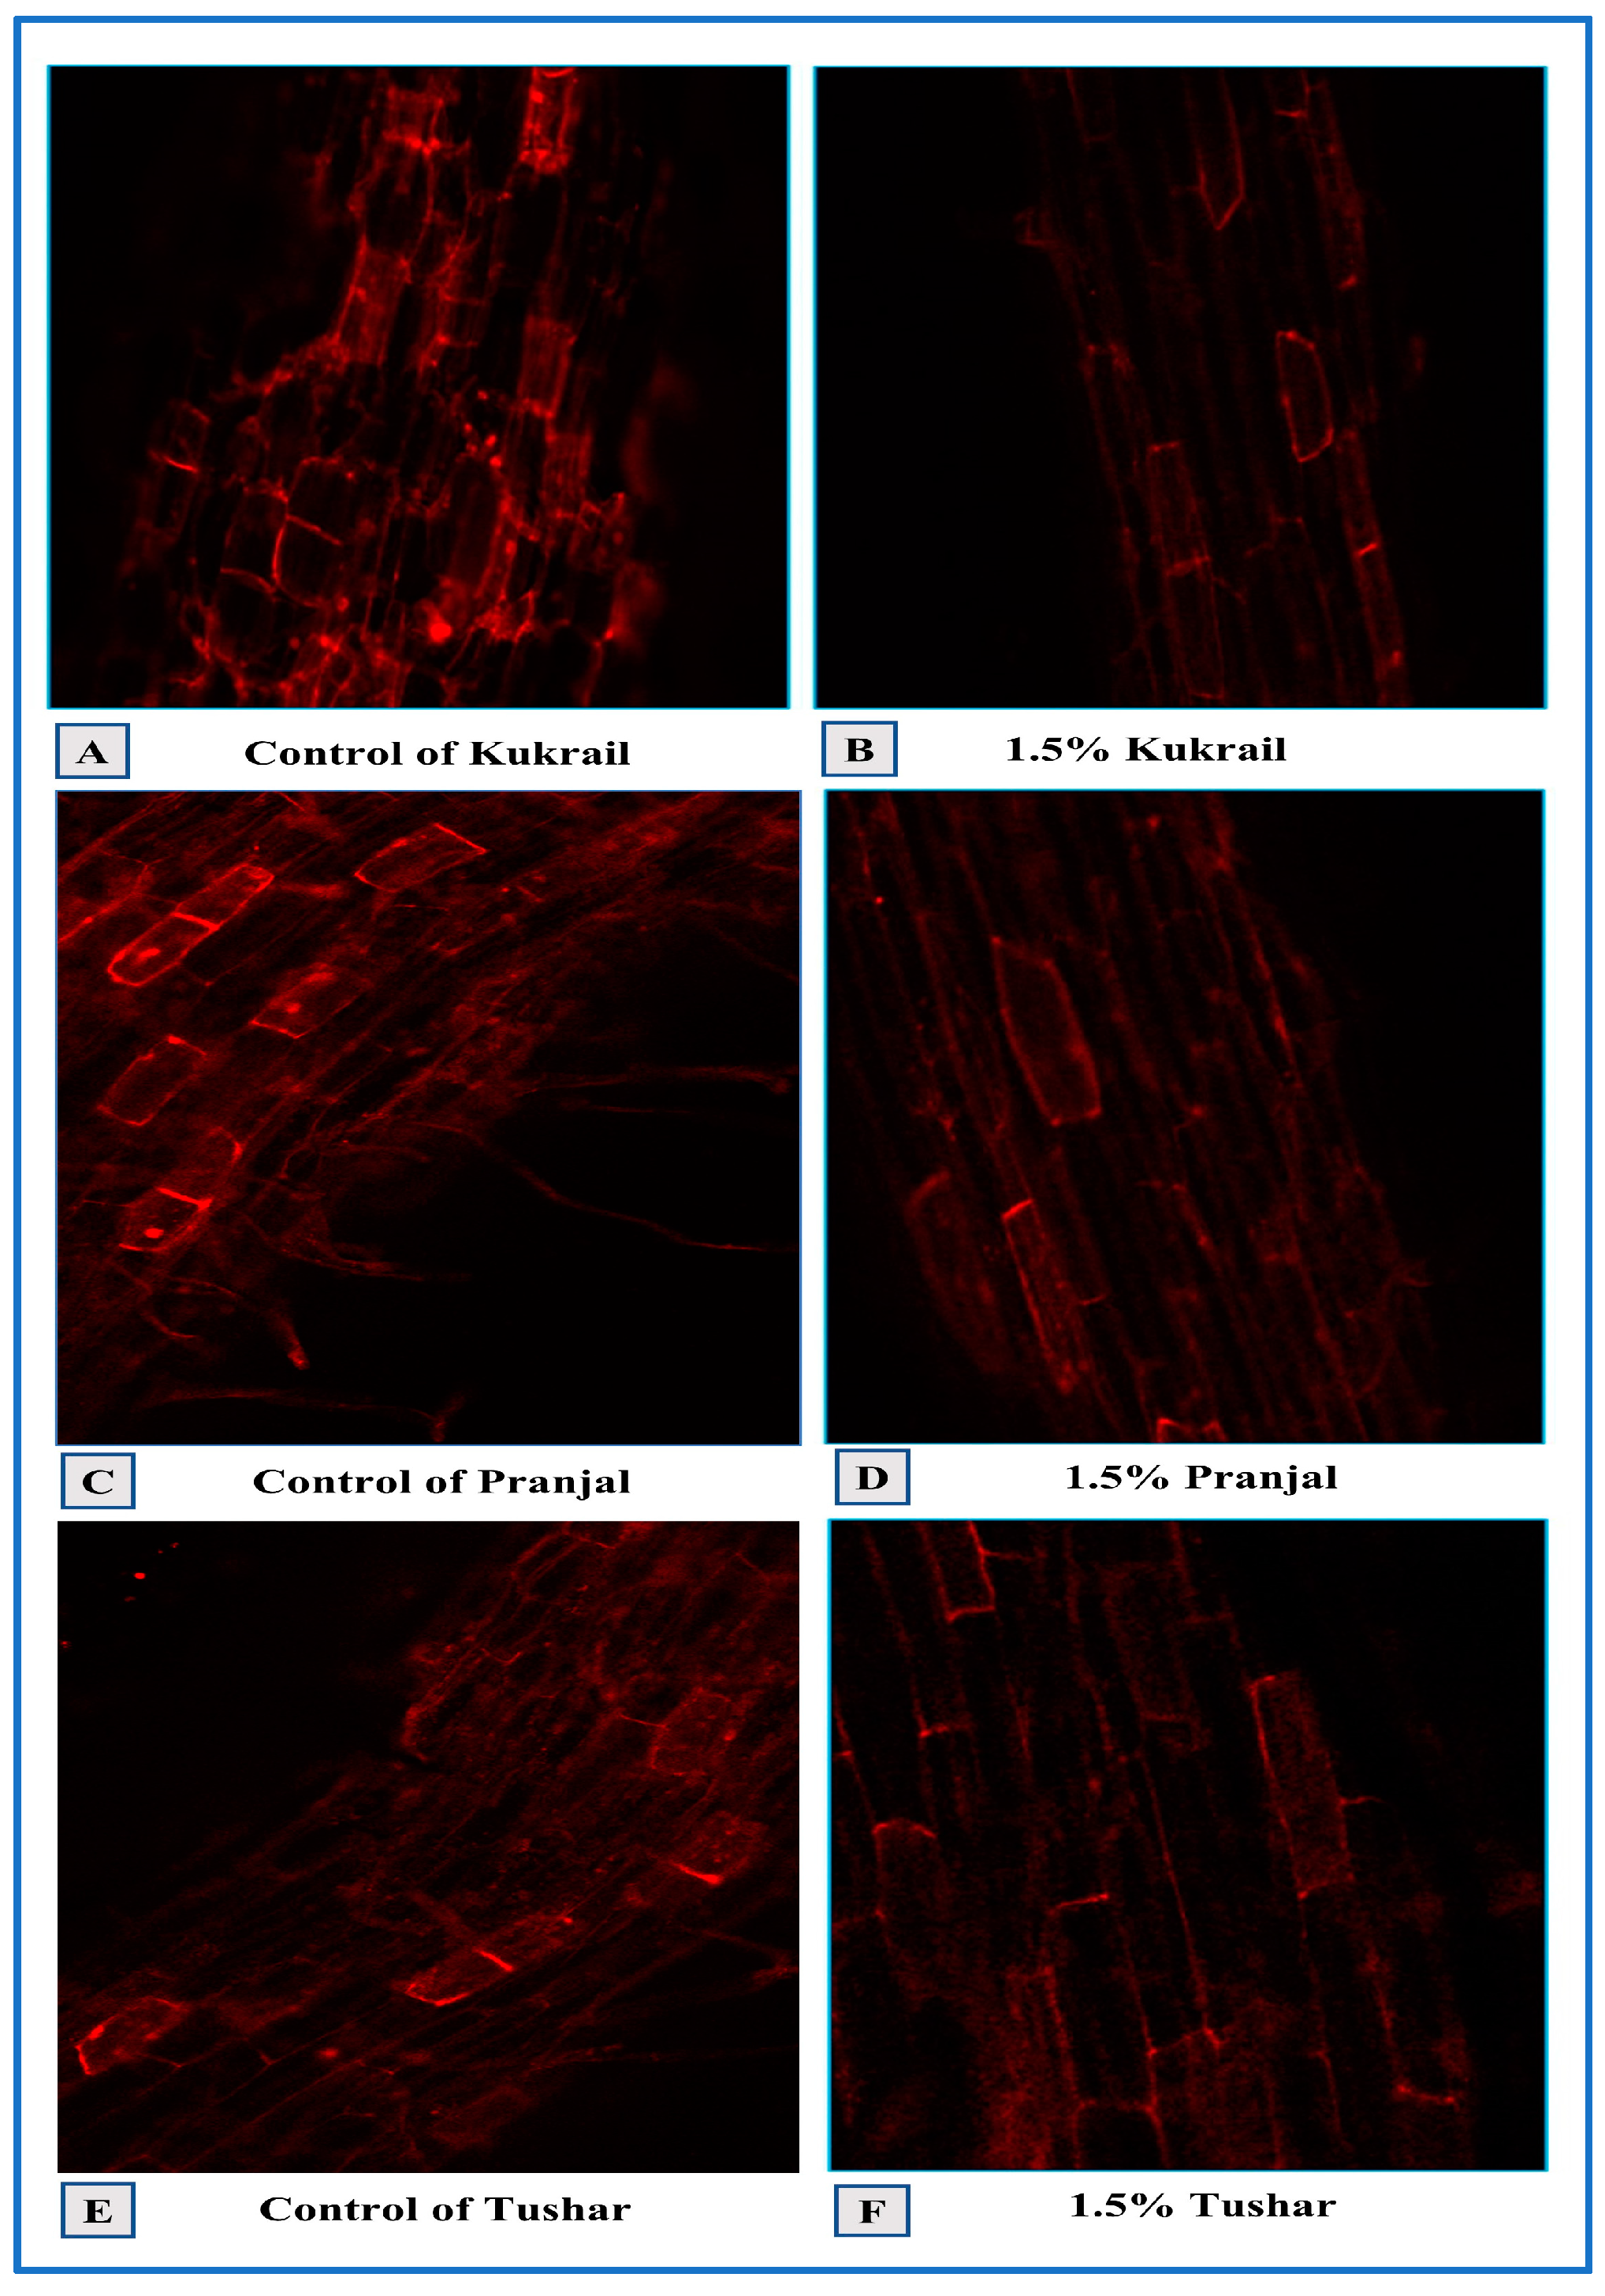
2.4.1. Confocal Laser Scanning Microscopy
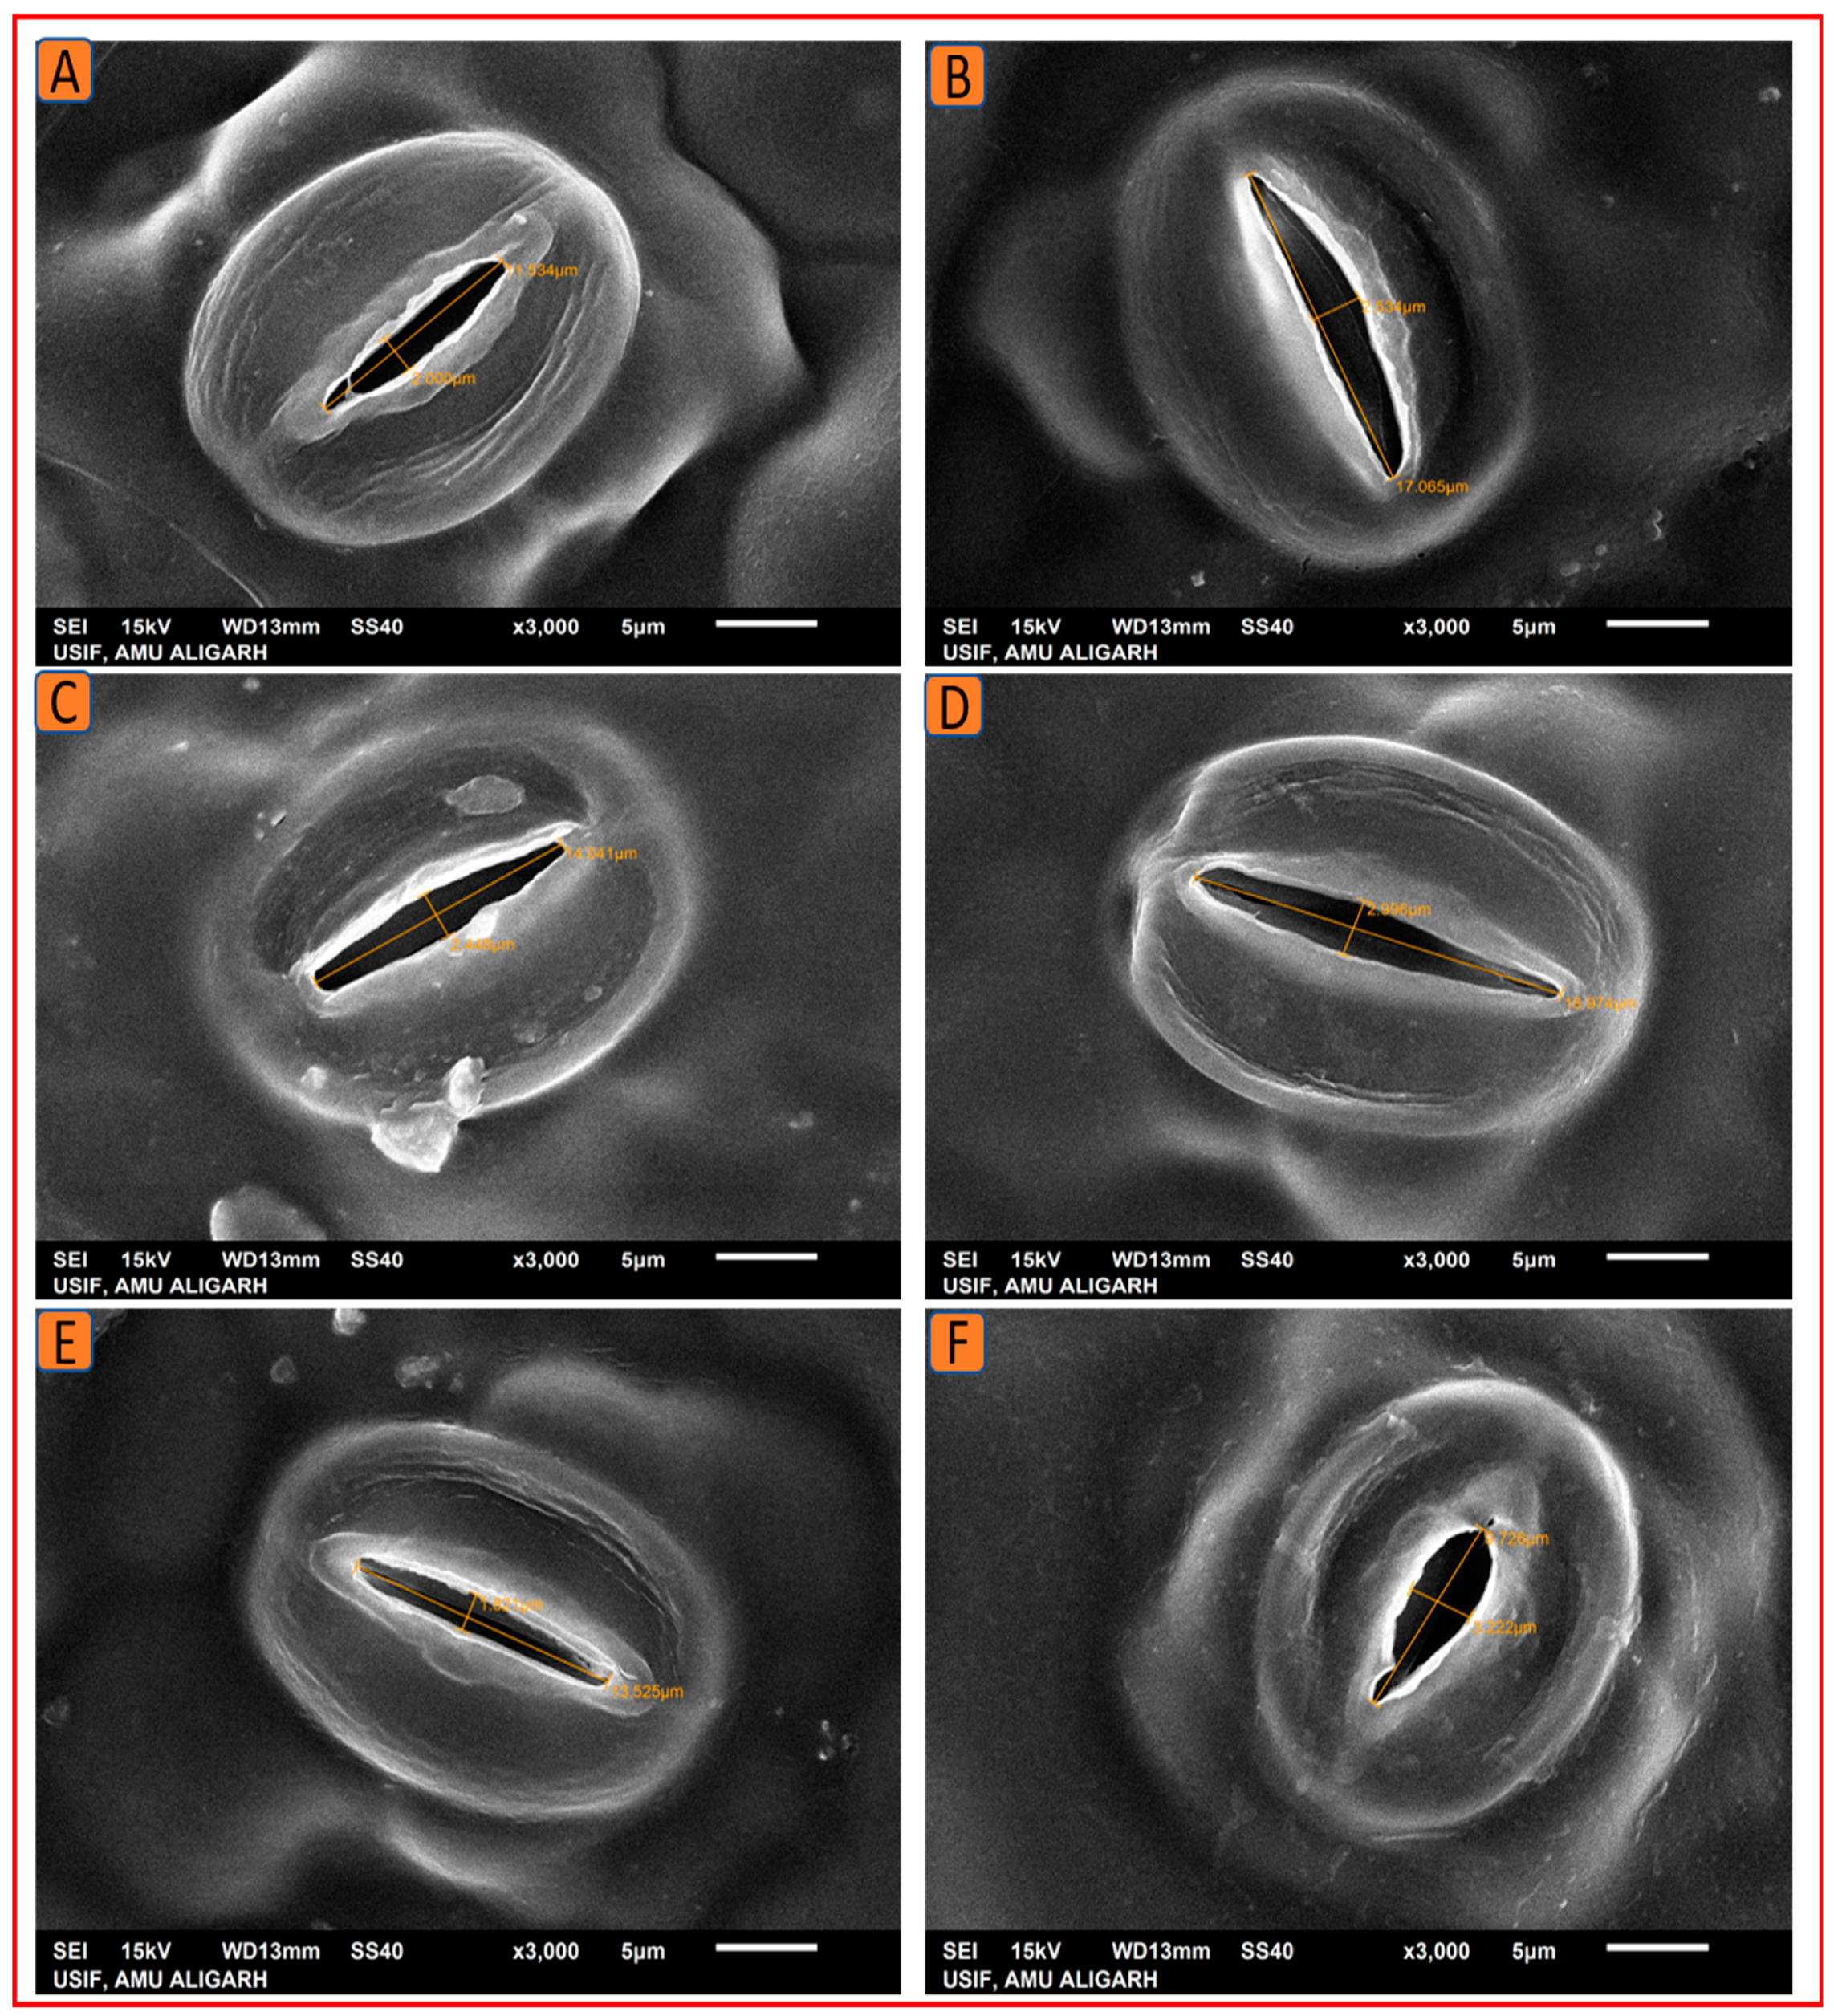
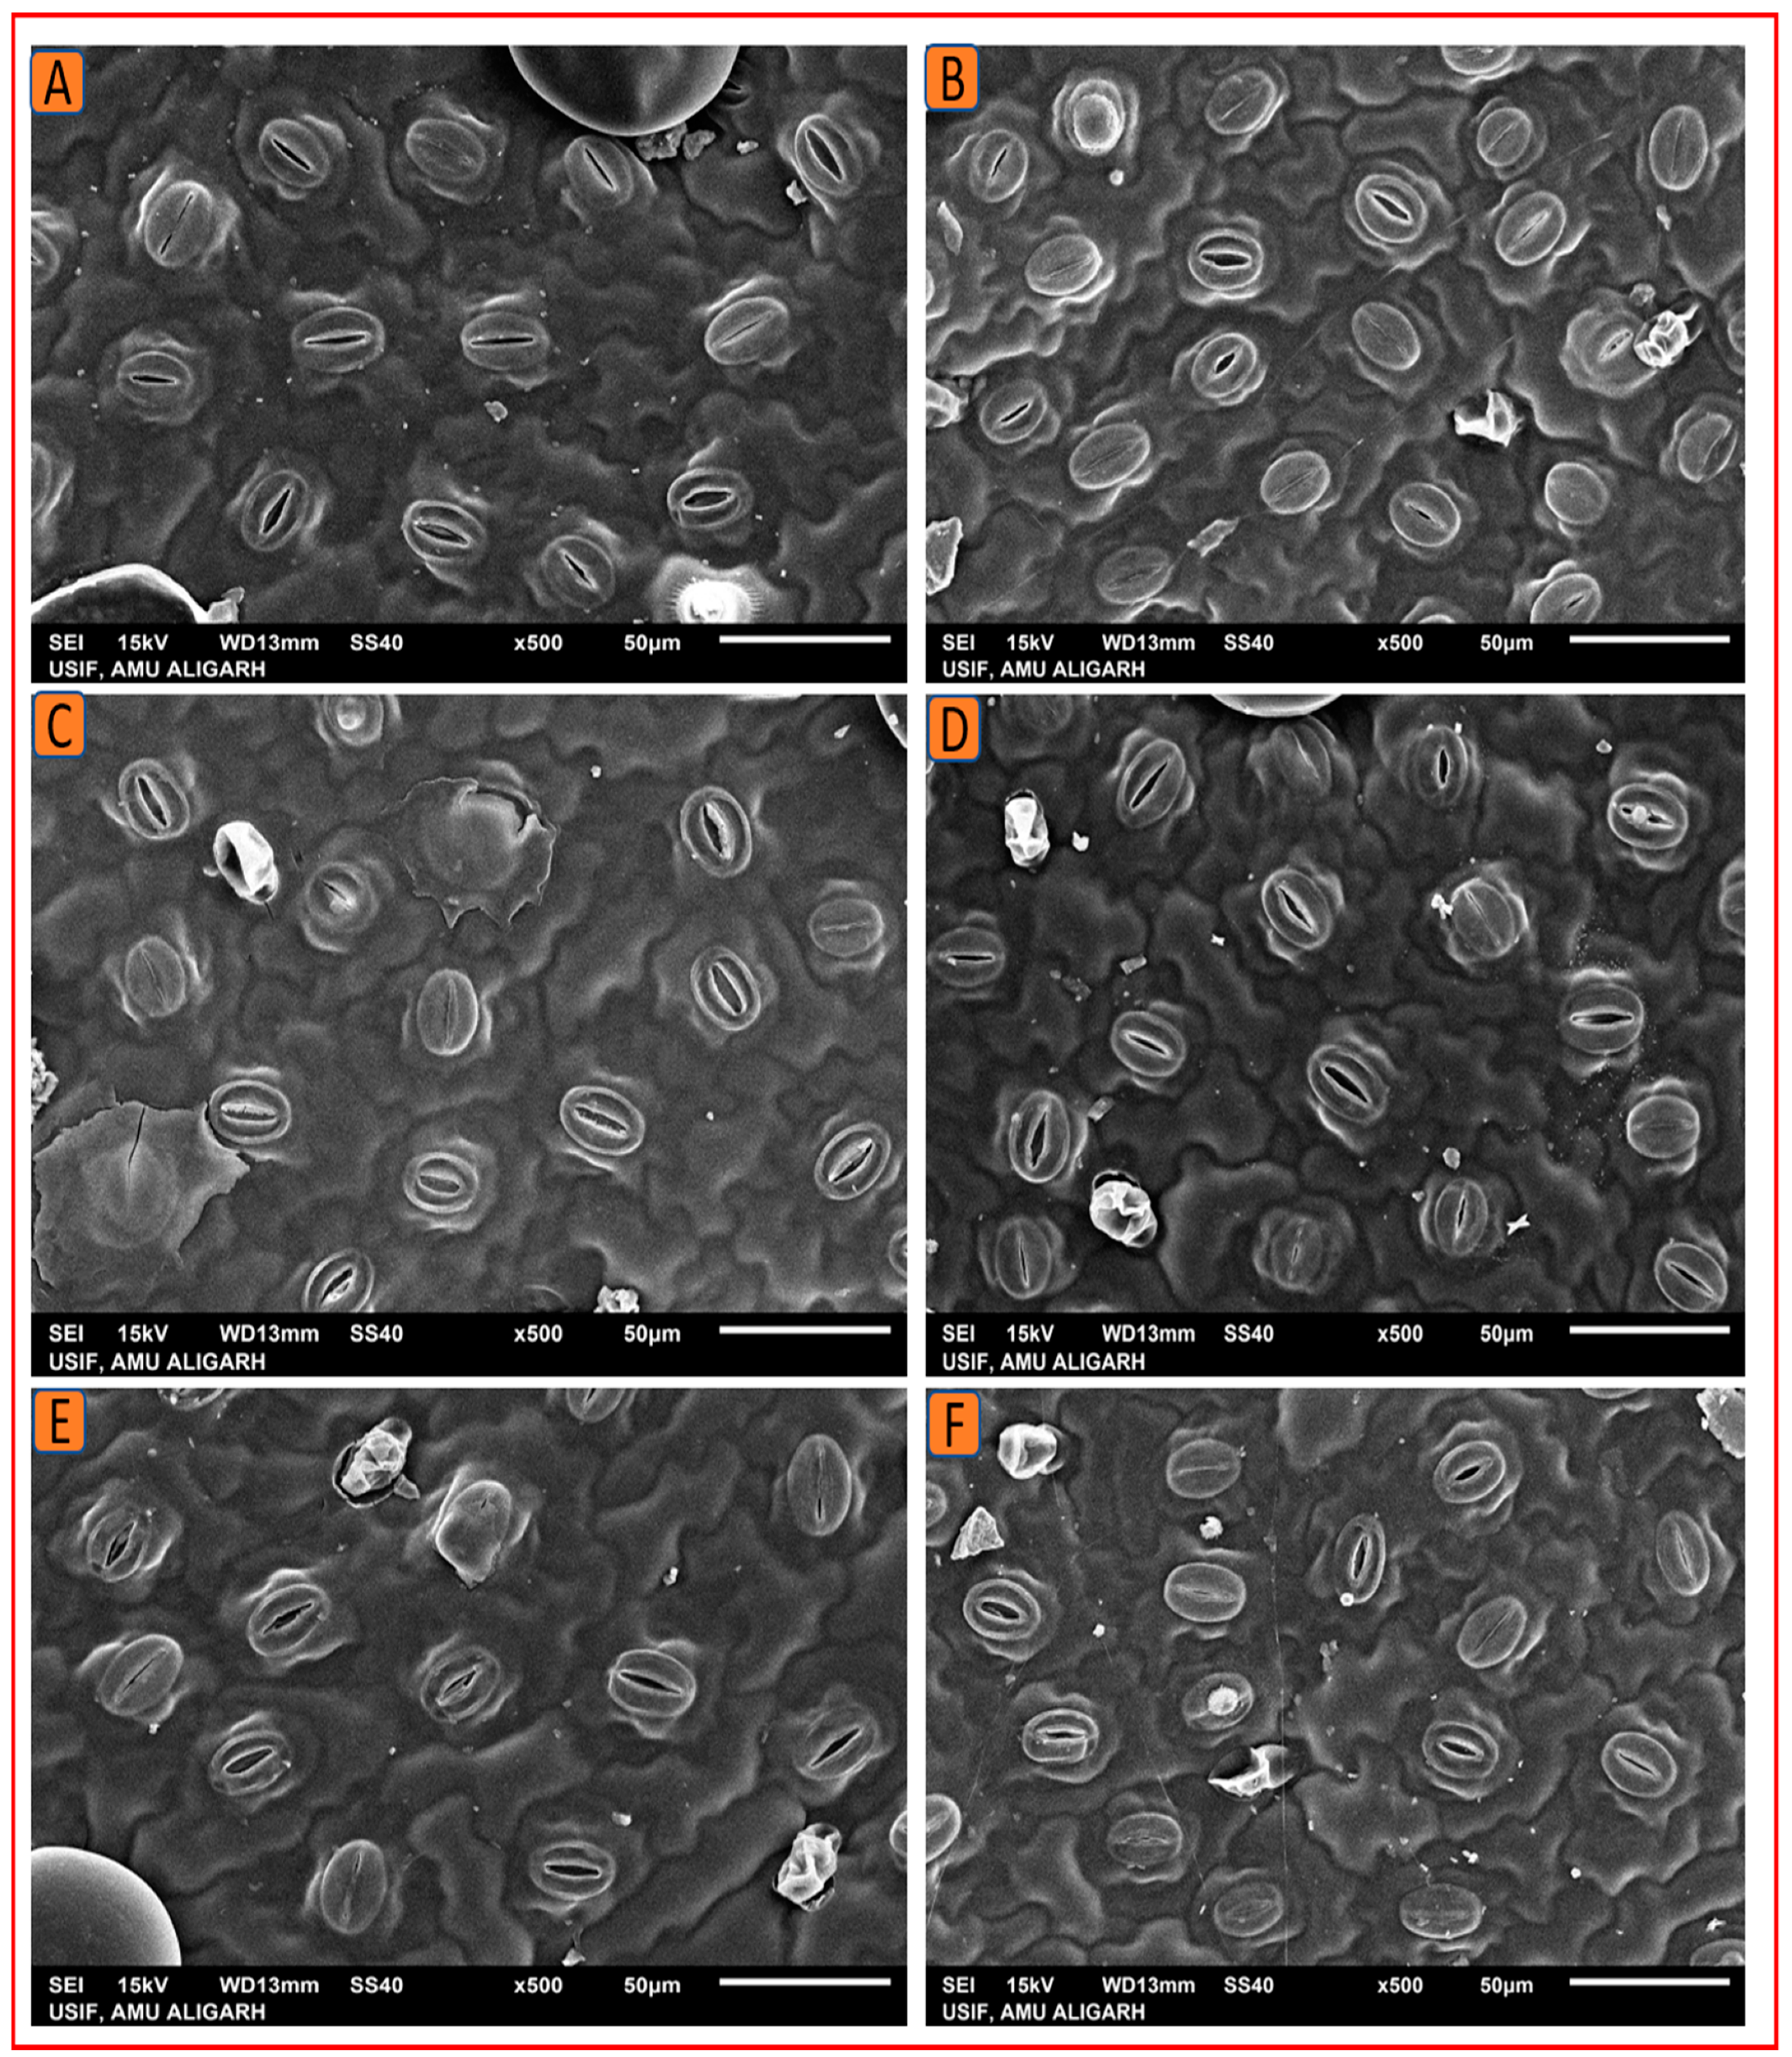
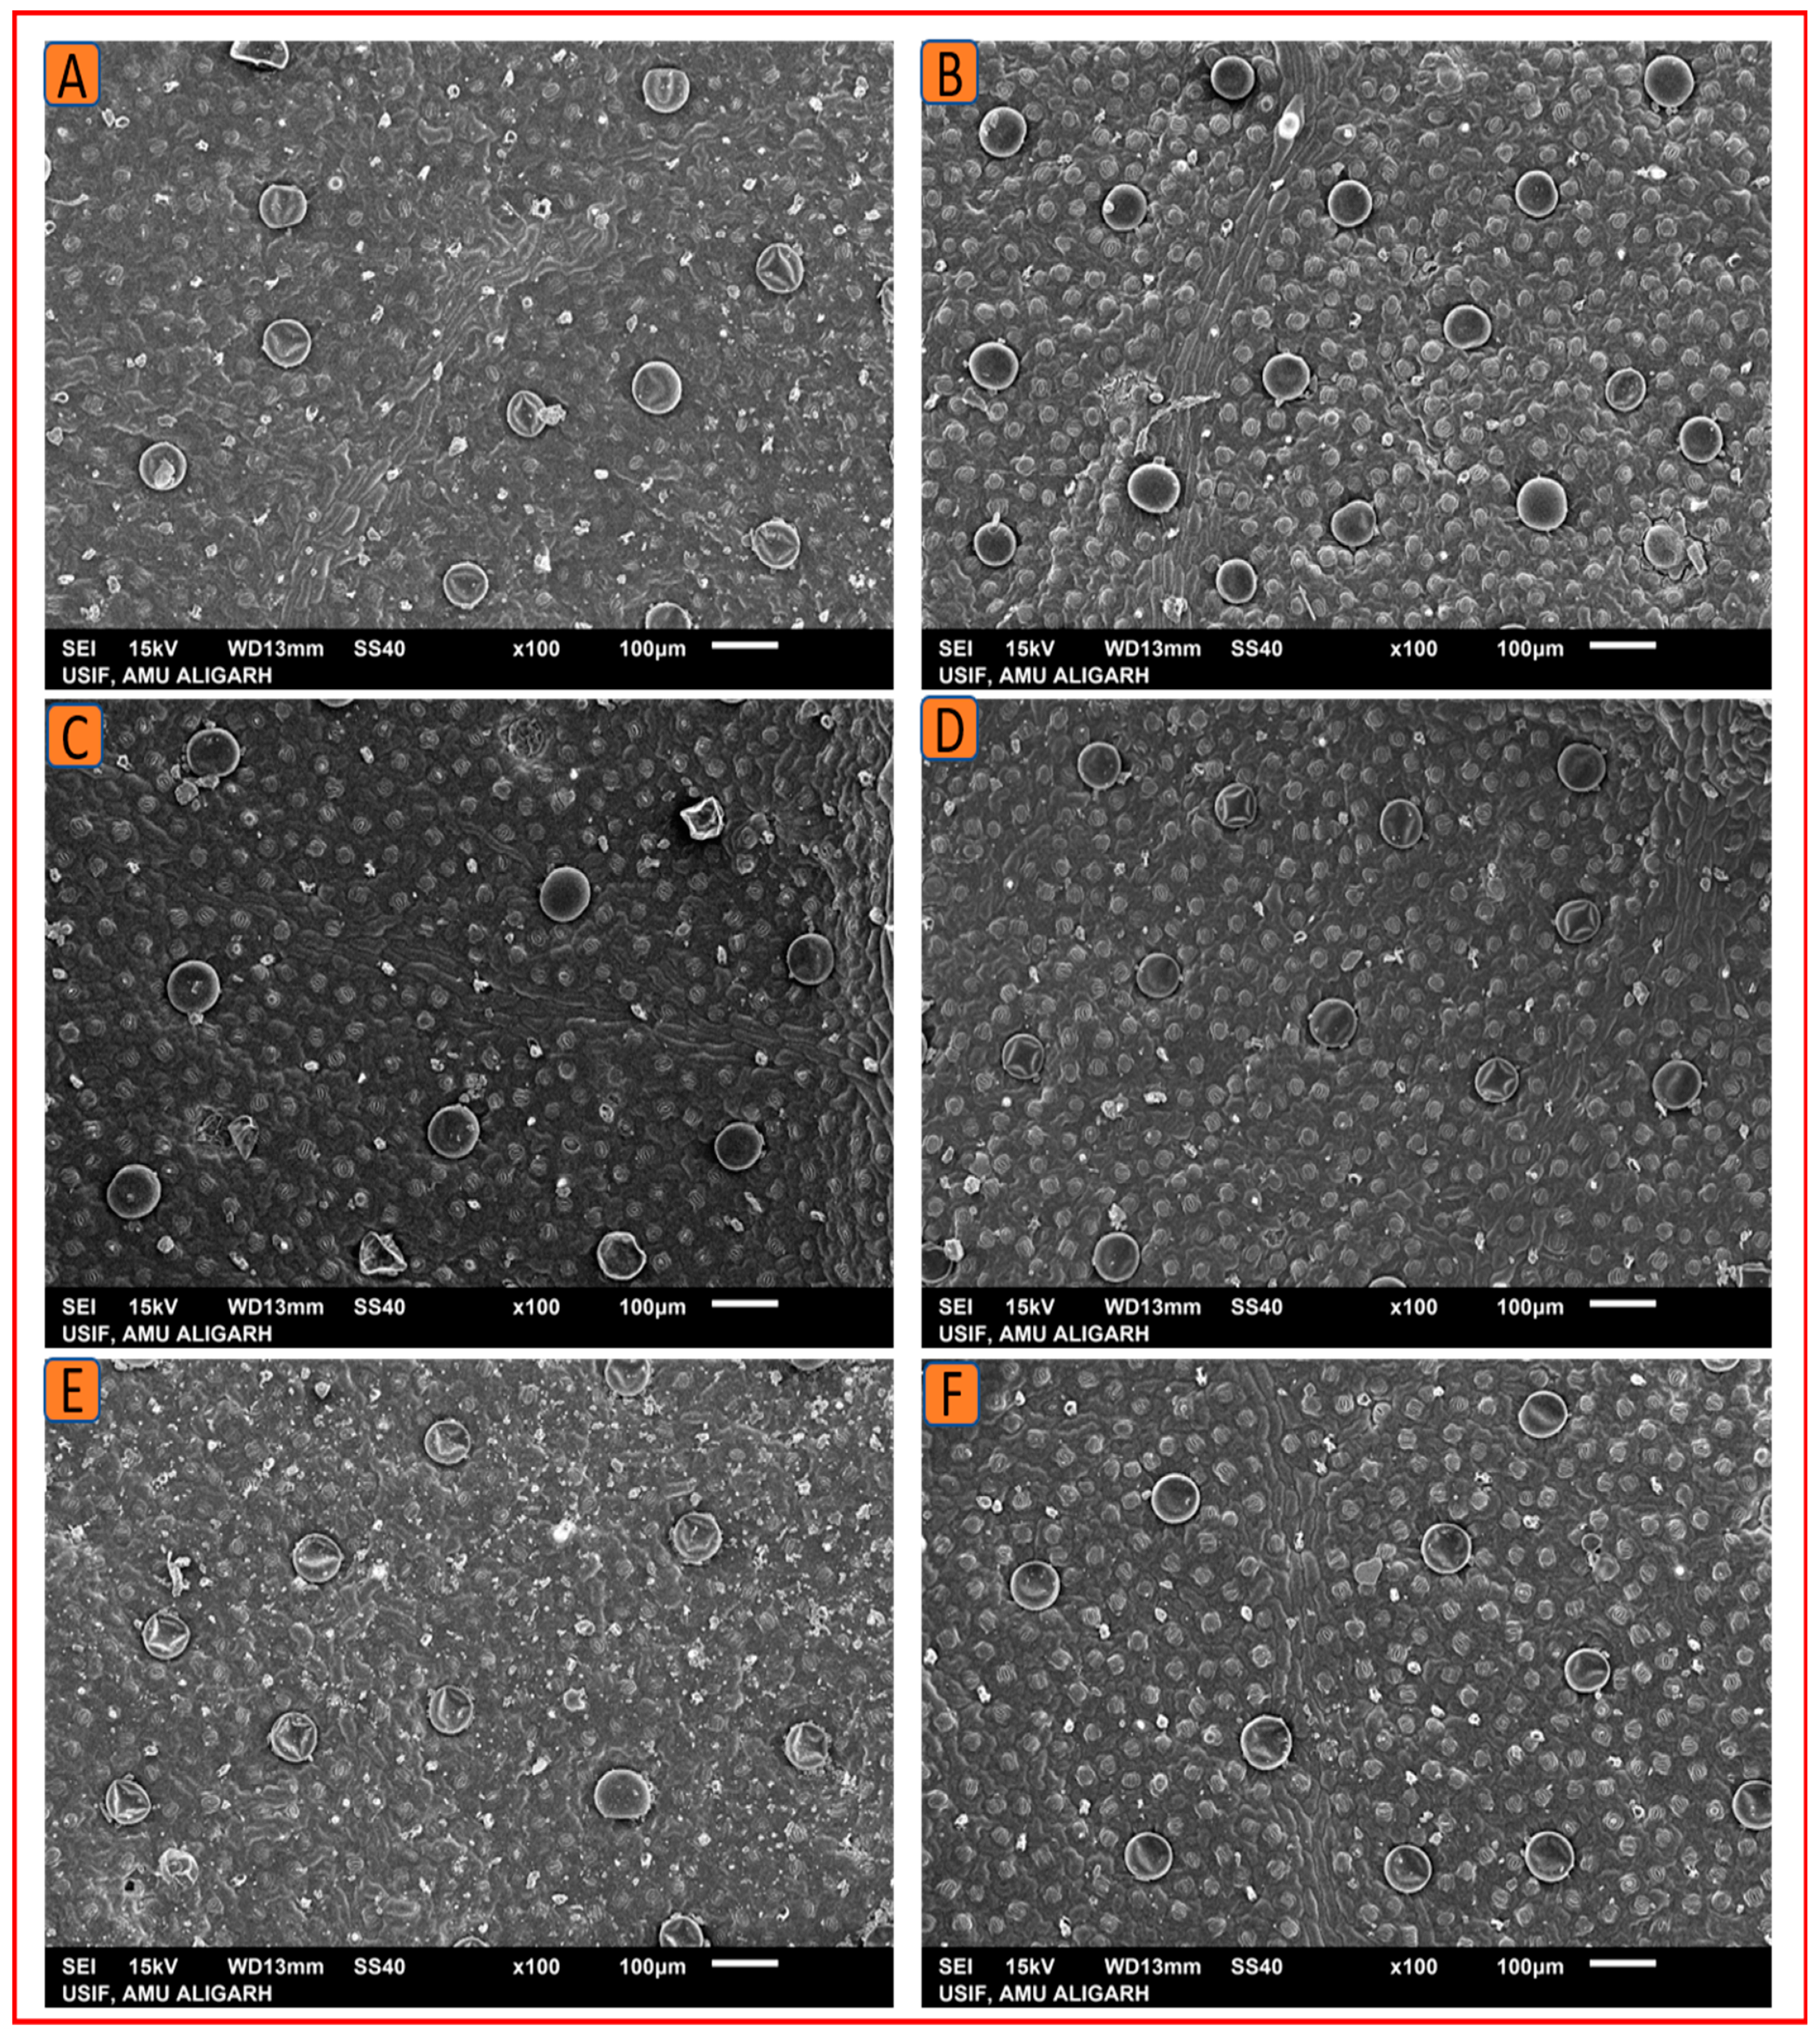
2.4.2. Scanning Electron Microscopy
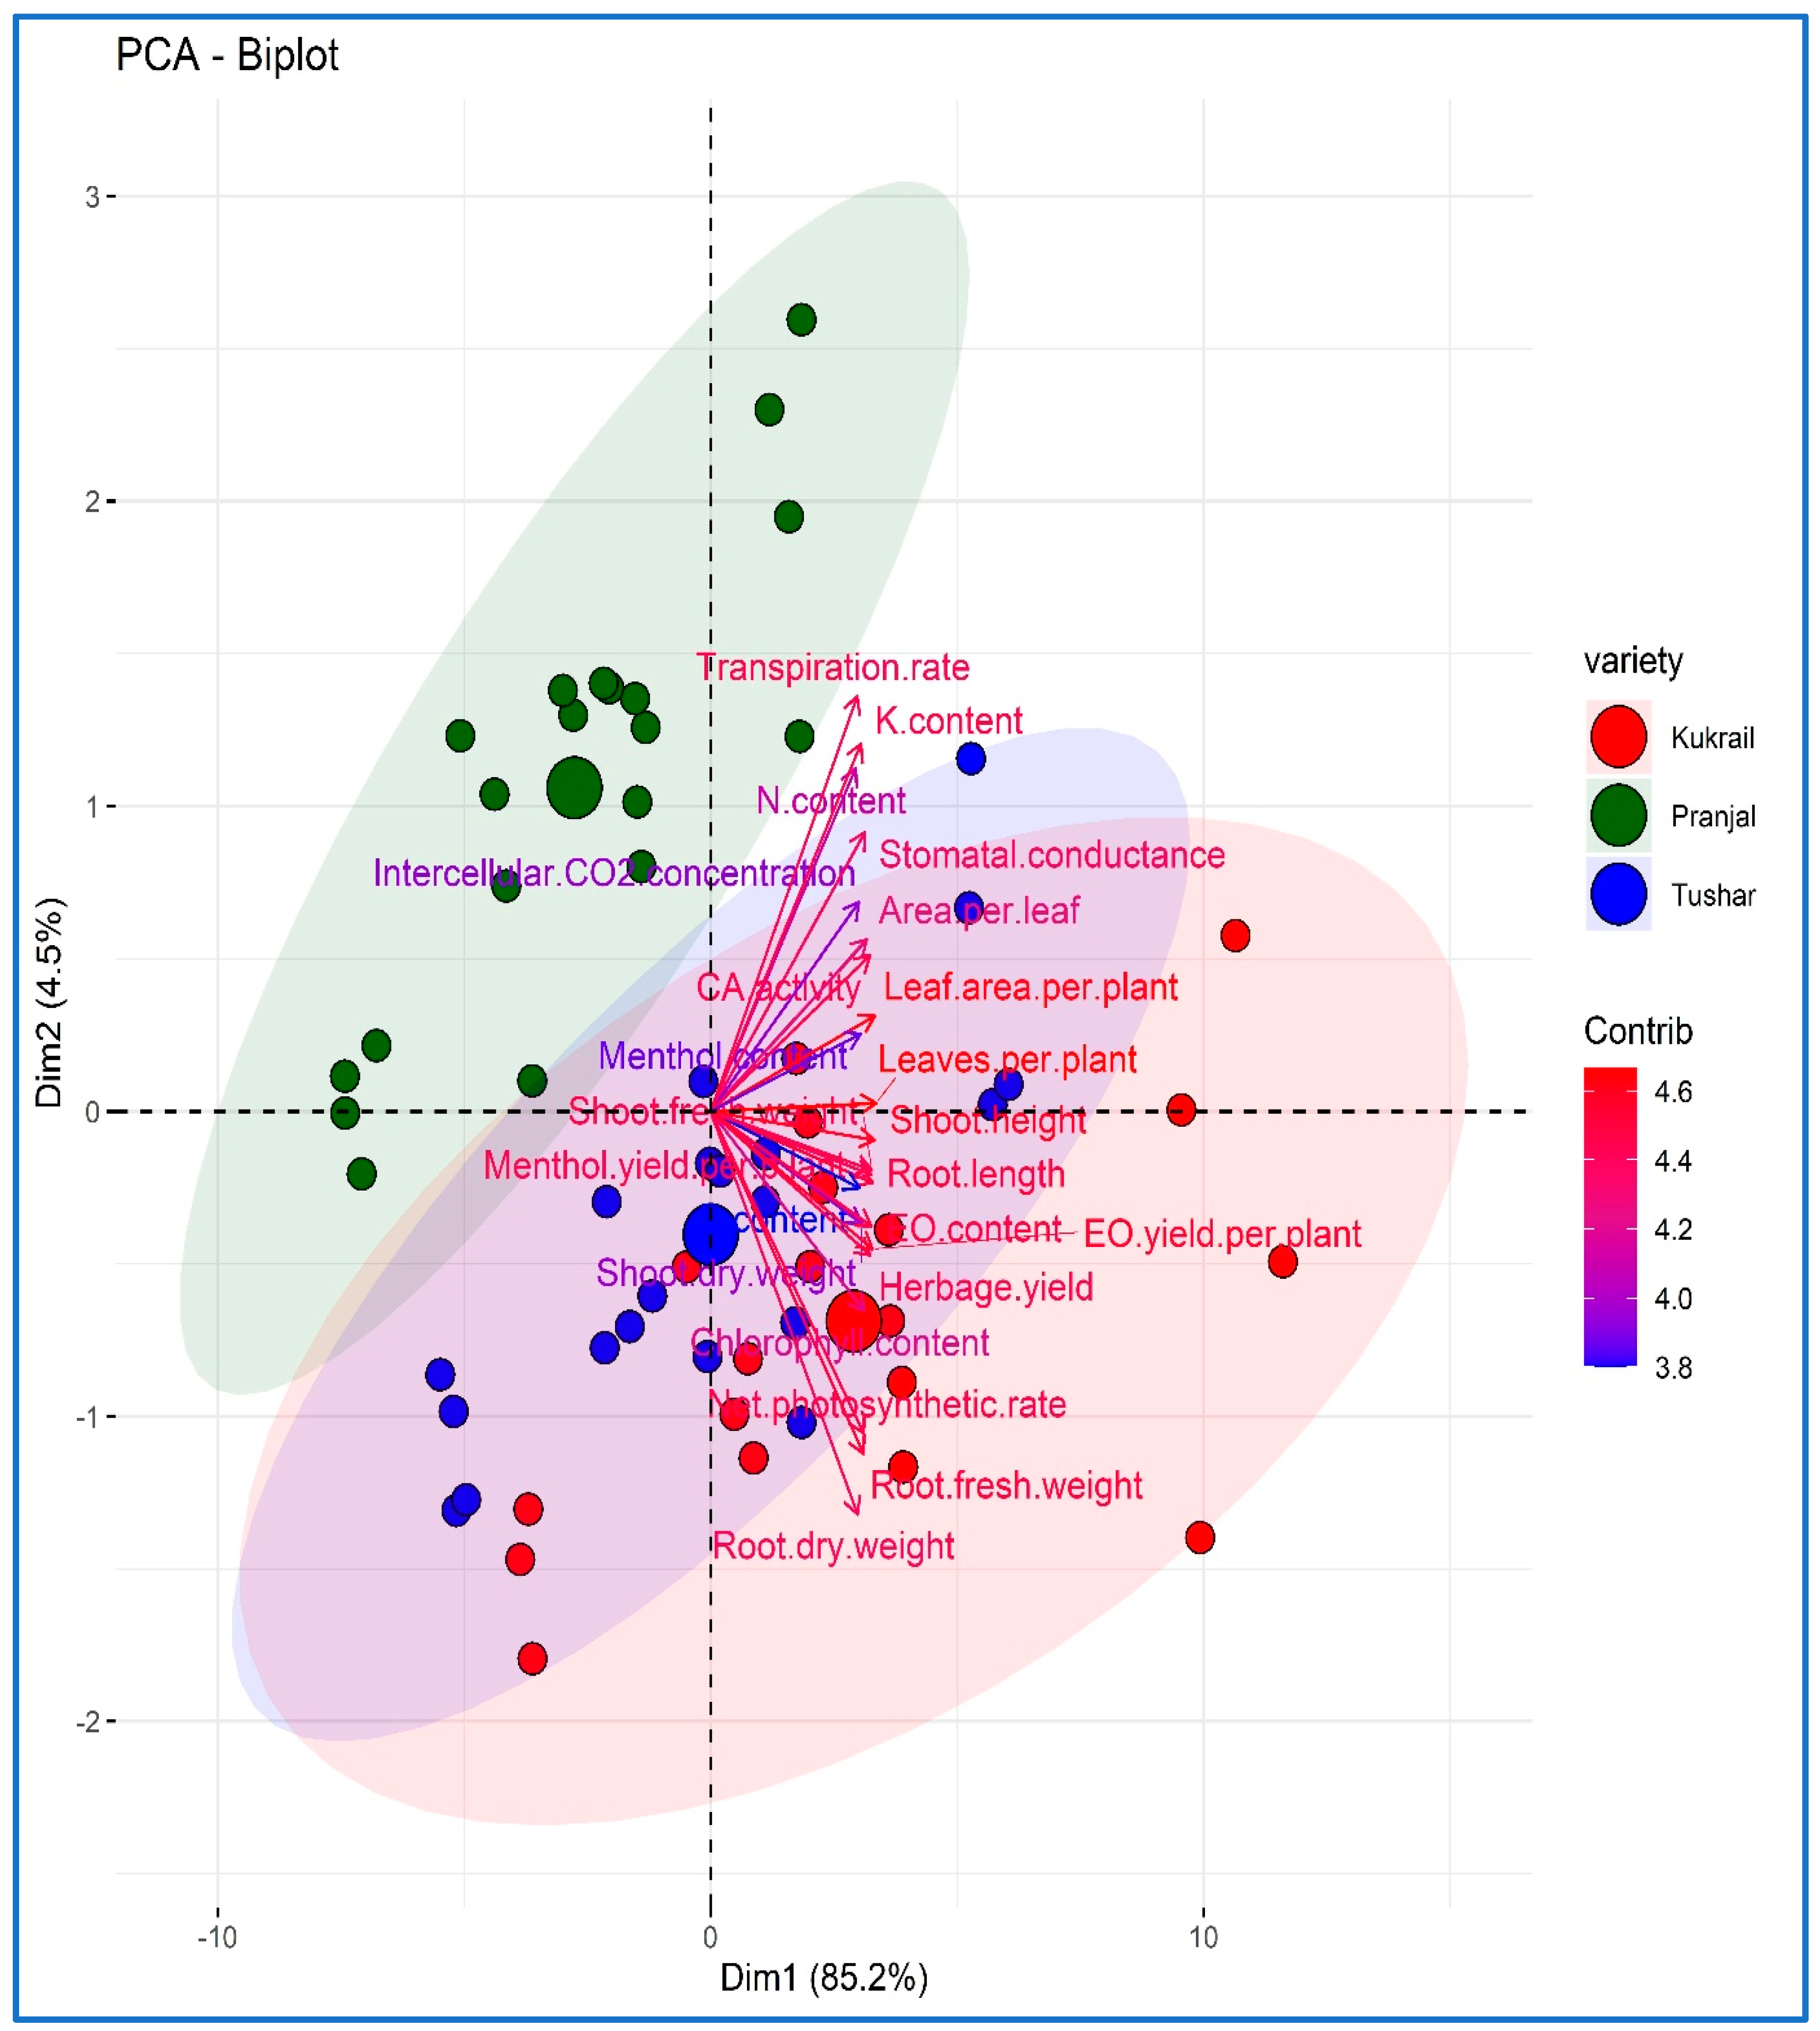
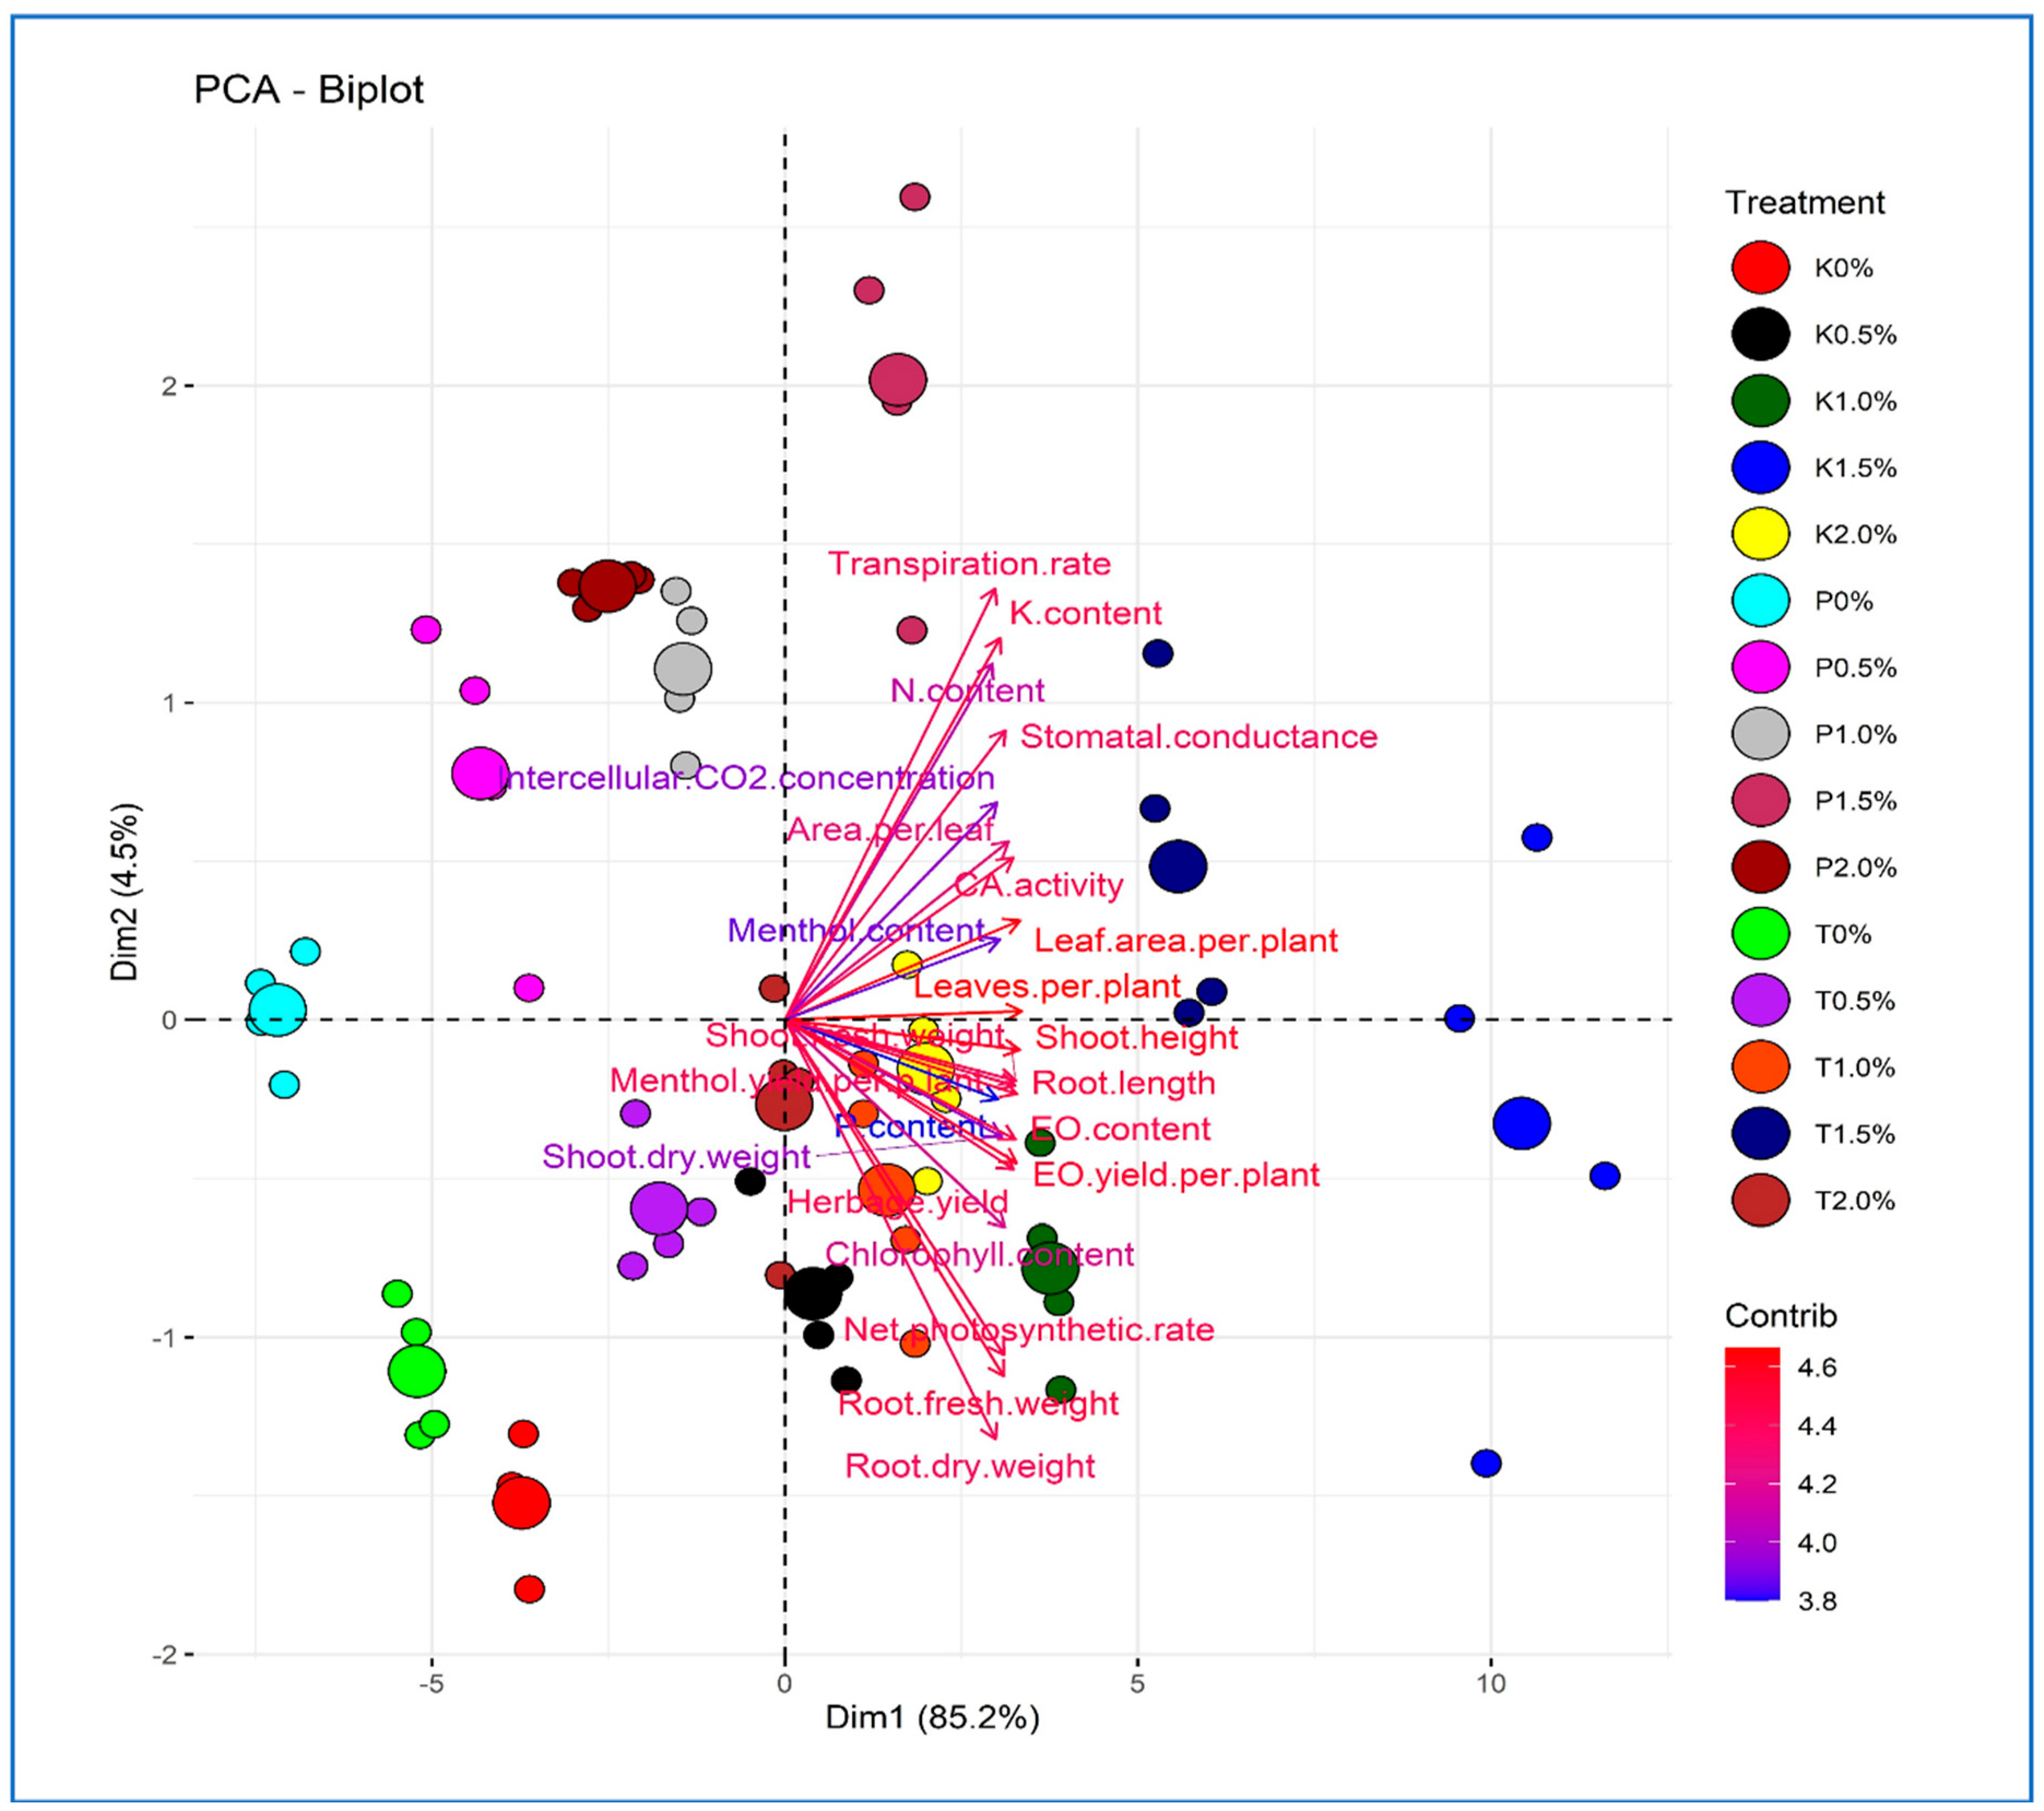
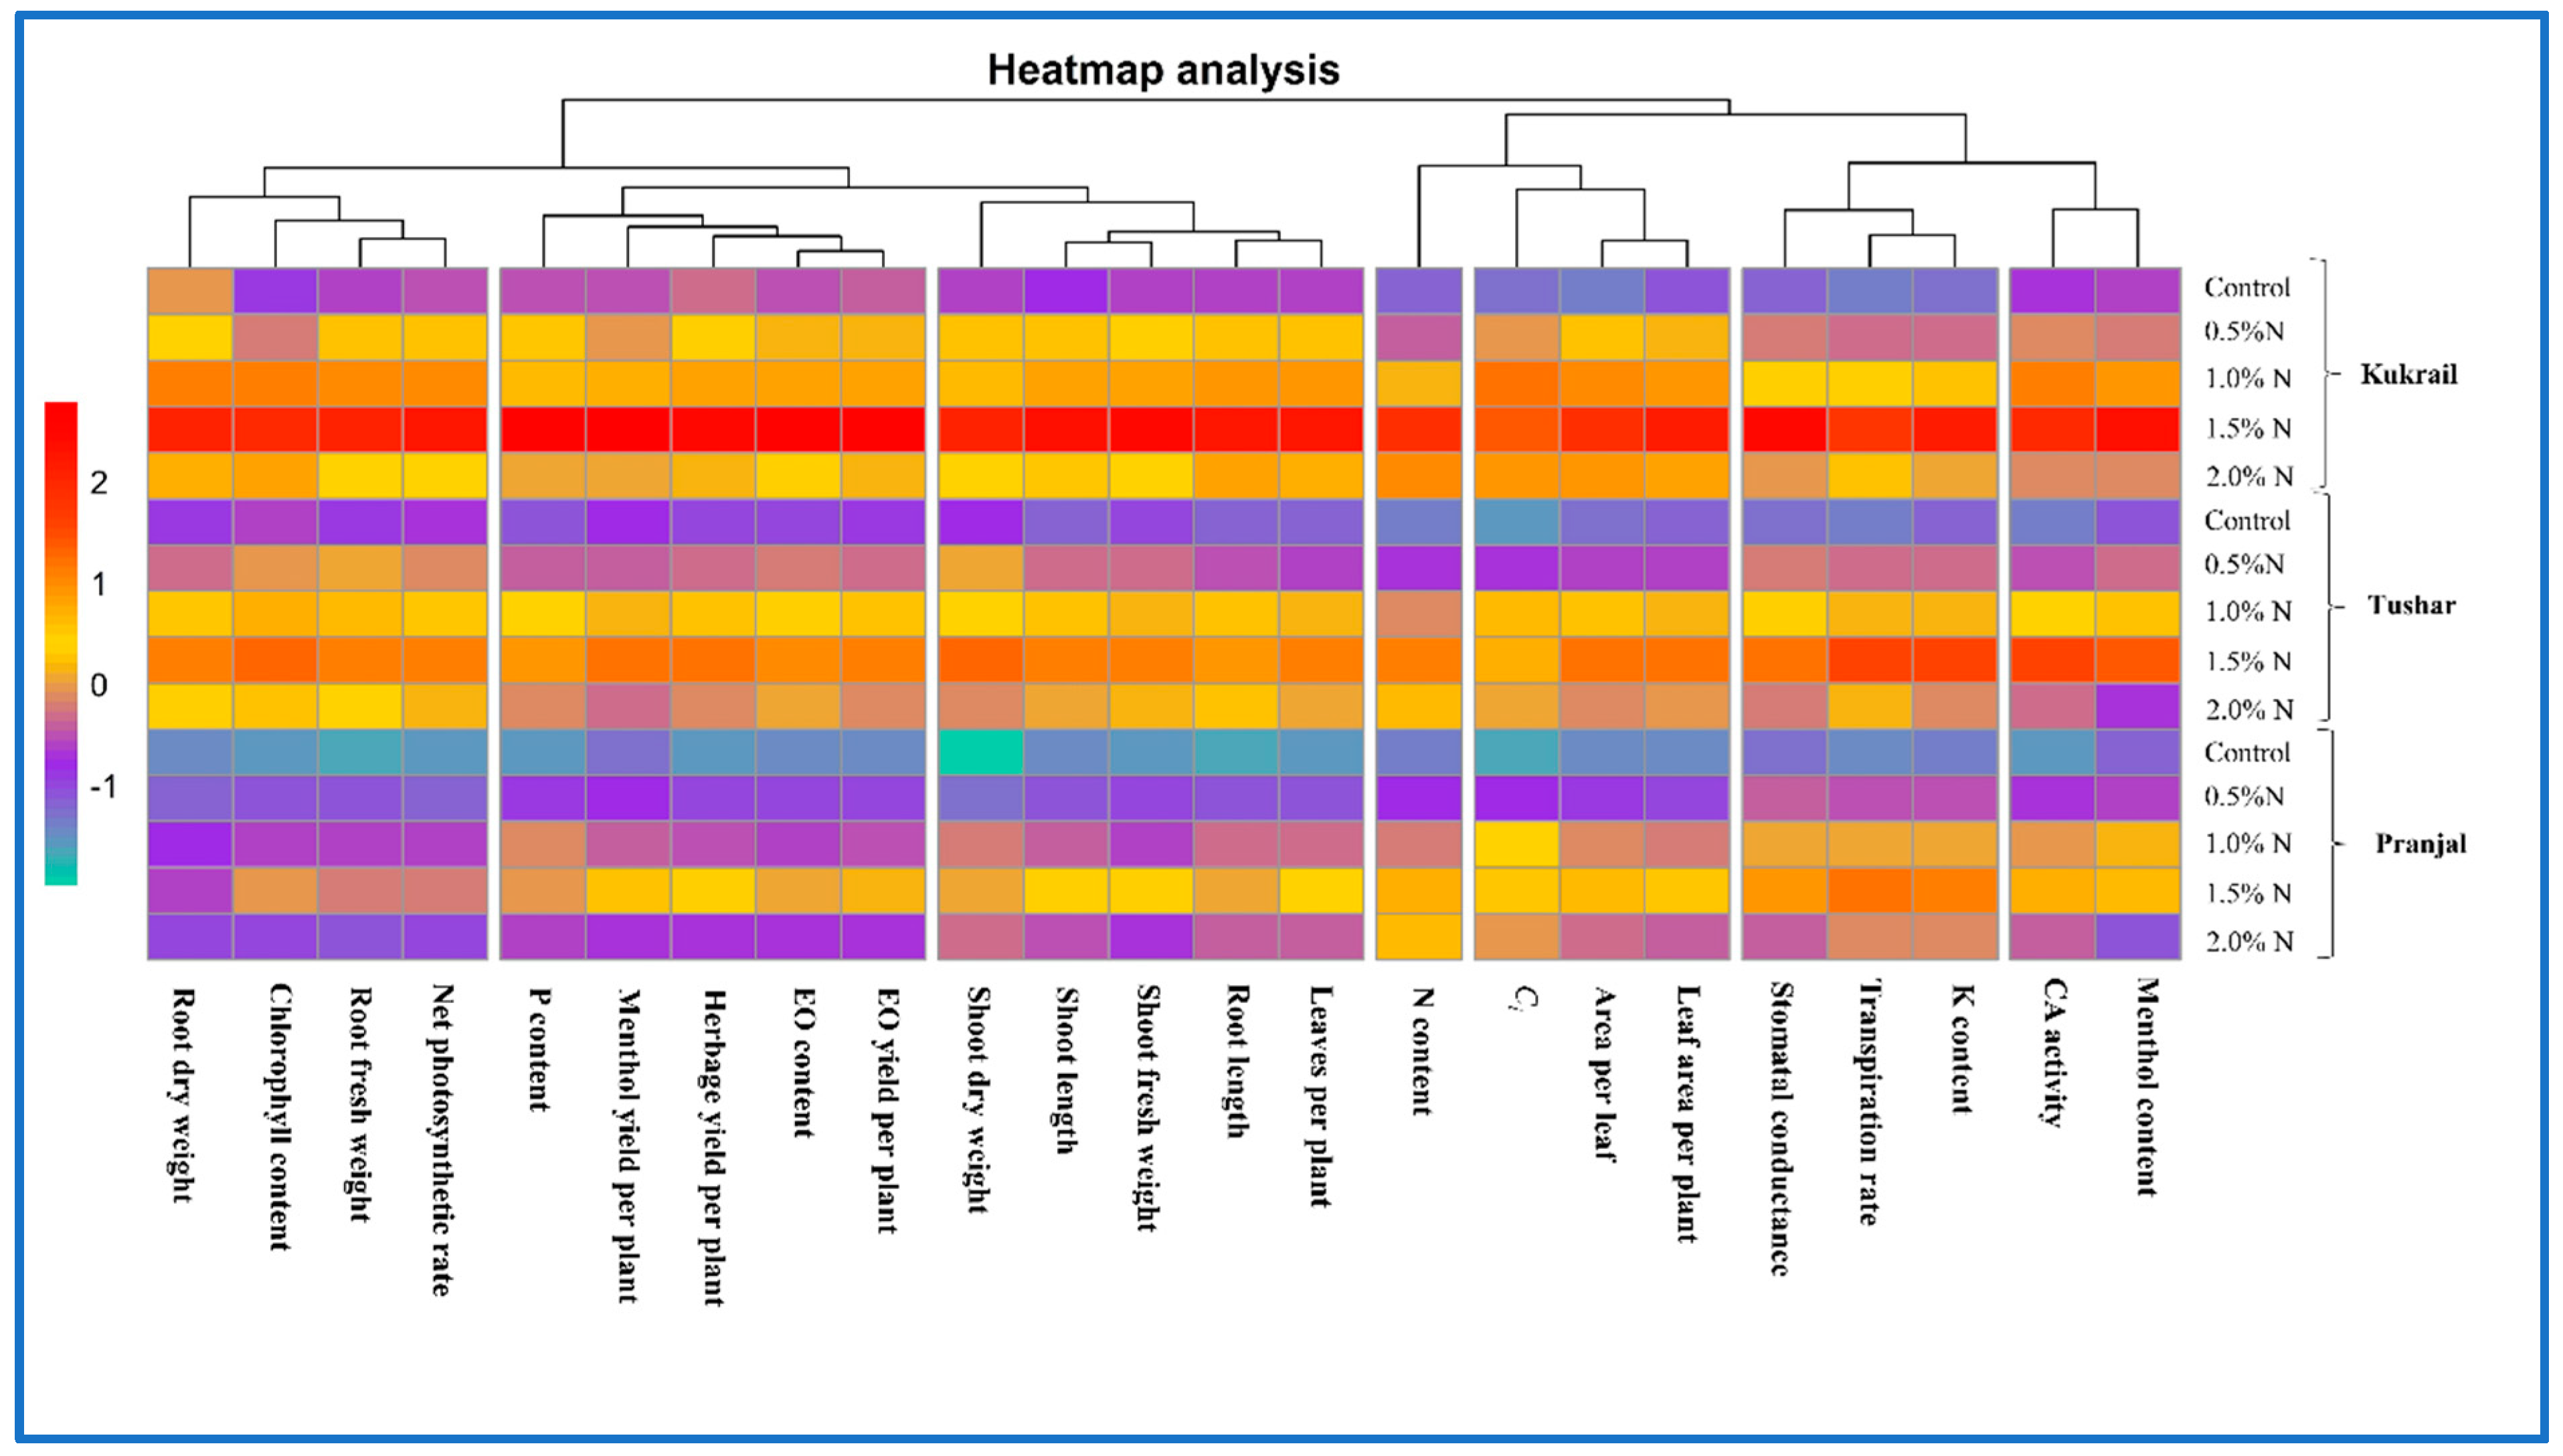
2.5. Principal Component and Heat Map Analysis
2.6. Correlation Analysis
3. Discussion
4. Materials and Methods
4.1. Collection and Establishment of Plants
4.2. Experimental Setup and Treatment Design
4.3. Determination of Plant Growth Characteristics
4.4. Physio Biochemical Parameters
4.4.1. Chlorophyll Content
4.4.2. Gas Exchange Parameters
4.4.3. Carbonic Anhydrase Activity
4.4.4. Leaf Nutrient Content (N, P and K)
4.5. Microscopic Examination
4.5.1. Confocal Microscopy
4.5.2. Scanning Electron Microscopical Analysis
4.6. Yield and Quality Attributes
4.6.1. Essential Oil Extraction of Peppermint Cultivars
4.6.2. GC-MS Analysis of EO
4.7. Statistical Analysis
5. Conclusions
Supplementary Materials
Author Contributions
Funding
Data Availability Statement
Acknowledgments
Conflicts of Interest
References
- Shrivastava, A. A review on peppermint oil. Asian J. Pharm. Clin. Res. 2009, 2, 27–33. [Google Scholar]
- Alammar, N.; Wang, L.; Saberi, B. The impact of peppermint oil on irritable bowel syndrome: A meta-analysis of the pooled clinical data. BMC Complement. Med. Ther. 2019, 19, 21. [Google Scholar] [CrossRef] [PubMed]
- Mamadalieva, N.Z.; Hussain, H.; Xiao, J. Recent advances in genus Mentha: Phytochemistry, antimicrobial effects, and food applications. Food Front. 2020, 1, 435–458. [Google Scholar] [CrossRef]
- Shah, S.H.; Islam, S.; Parrey, Z.A.; Mohammad, F. Role of exogenously applied plant growth regulators in growth and development of edible oilseed crops under variable environmental conditions: A review. J. Soil Sci. Plant Nutr. 2021, 21, 3284–3308. [Google Scholar] [CrossRef]
- Shah, S.H.; Parrey, Z.A.; Islam, S.; Tyagi, A.; Ahmad, A.; Mohammad, F. Exogenously Applied Sulphur Improves Growth, Photosynthetic Efficiency, Enzymatic Activities, Mineral Nutrient Contents, Yield and Quality of Brassica juncea L. Sustainability 2022, 14, 14441. [Google Scholar] [CrossRef]
- Hassanain, M.; Abdella, E. Response of sweet basil plant (Ocimum Basilicum L.) to different nitrogen sources. J. Agric. Environ. Sci. 2003, 2, 4–13. [Google Scholar]
- Sedano-Castro, G.; González-Hernández, V.A.; Saucedo-Veloz, C.; Soto-Hernández, M.; Sandoval-Villa, M.; Carrillo-Salazar, J.A. Yield and Quality of Zucchini Fruits on High Doses of N and K. Terra Latinoam. 2011, 29, 133–142. [Google Scholar]
- Evans, J.R. Photosynthesis and nitrogen relationships in leaves of C3 plants. Oecologia 1989, 78, 9–19. [Google Scholar] [CrossRef]
- Jin, X.; Yang, G.; Tan, C.; Zhao, C. Effects of nitrogen stress on the photosynthetic CO2 assimilation, chlorophyll fluorescence and sugar-nitrogen ratio in corn. Sci. Rep. 2015, 5, 9311. [Google Scholar] [CrossRef]
- Mu, X.; Chen, Y. The physiological response of photosynthesis to nitrogen deficiency. Plant Physiol. Biochem. 2021, 158, 76–82. [Google Scholar] [CrossRef]
- Sirko, A.; Brodzik, R. Plant ureases: Roles and regulation. Acta Biochim. Pol. 2000, 47, 1189–1195. [Google Scholar] [CrossRef]
- Beier, M.P.; Kojima, S. The function of high-affinity urea transporters in nitrogen-deficient conditions. Physiol. Plant. 2021, 171, 802–808. [Google Scholar] [CrossRef] [PubMed]
- Anas, M.; Liao, F.; Verma, K.K.; Sarwar, M.A.; Mahmood, A.; Chen, Z.L.; Li, Y.R. Fate of nitrogen in agriculture and environment: Agronomic, eco-physiological and molecular approaches to improve nitrogen use efficiency. Biol. Res. 2020, 53, 47. [Google Scholar] [CrossRef] [PubMed]
- Mehmood, S.; Abbasi, K.Y.; Saleem, M.A.; Ahmad, T.; Tariq, S. Effectiveness of nitrogen spray on growth attributes and oil contents of tulsi plant. Fuuast J. Biol. 2021, 11, 85–91. [Google Scholar]
- Islam, S.; Parrey, Z.A.; Shah, S.H.; Mohammad, F. Glycine betaine mediated changes in growth, photosynthetic efficiency, antioxidant system, yield and quality of mustard. Sci. Hortic. 2021, 285, 110170. [Google Scholar] [CrossRef]
- Fageria, N.K. Nitrogen Management in Crop Production; CRC Press: Boca Raton, FL, USA, 2014. [Google Scholar]
- Nurzyńska-Wierdak, R.; Borowski, B. Dynamics of sweet basil (Ocimum basilicum L.) growth affected by cultivar and foliar feeding with nitrogen. Acta Sci. Pol. Hort. Cult. 2011, 10, 307–317. [Google Scholar]
- Can, M.; Katar, D. Effect of Different Nitrogen Doses on Agricultural and Quality Characteristics of Mentha piperita L. and Mentha spicata L. Species. J. Agric. Sci. Technol. 2021, 23, 1327–1338. [Google Scholar]
- Norouzi, Y.; Mokhtar, G.; Mohsen, S.; Hulya, D. Effect of nitrogen and cytokinin on quantitative and qualitative yield of thyme (Thymus vulgaris L.). Agrotech. Ind. Crops. 2021, 1, 52–60. [Google Scholar]
- Yadav, A.K.; Singh, S.P.; Yadav, D.K.; Yadav, G.K.; Singh, K.; Yadav, M.K. Influence of Phosphorous and Foliar Nitrogen on the Growth, Quality and Yield of Kasuri Methi (Trigonella corniculata L.). Legume Res. Int. J. 2021, 1, 7. [Google Scholar] [CrossRef]
- Huang, J.W.; Grunes, D.L. Effects of root temperature and nitrogen form on magnesium uptake and translocation by wheat seedlings. J. Plant Nutr. 1992, 15, 991–1005. [Google Scholar] [CrossRef]
- Esmaili, E.; Kapourchal, S.A.; Malakouti, M.J.; Homaee, M. Interactive effect of salinity and two nitrogen fertilizers on growth and composition of sorghum. Plant Soil Environ. 2008, 54, 537–546. [Google Scholar] [CrossRef]
- Umar, S. Alleviating adverse effects of water stress on yield of sorghum, mustard and groundnut by potassium application. Pak. J. Bot. 2006, 38, 1373–1380. [Google Scholar]
- Siddiqui, M.H.; Khan, M.N.; Mohammad, F.; Khan, M.M.A. Role of nitrogen and gibberellin (GA3) in the regulation of enzyme activities and in osmoprotectant accumulation in Brassica juncea L. under salt stress. J. Agron. Crop Sci. 2008, 194, 214–224. [Google Scholar] [CrossRef]
- Adel Mahmoodabad, H.; Hokmalipoor, S.; Shaban, M.; Ashrafi Parchin, R. Effect of foliar spray of urea and soil application of vermicompost on essential oil and chlorophyll content of green Mint (Mentha spicata L.). Int. J. Adv. Biol. Biomed. Res. 2014, 2, 2104–2108. [Google Scholar]
- Chrysargyris, A.; Nikolaidou, E.; Stamatakis, A.; Tzortzakis, N. Vegetative, physiological, nutritional and antioxidant behavior of spearmint (Mentha spicata L.) in response to different nitrogen supply in hydroponics. J. Appl. Res. Med. Aromat. Plants. 2017, 6, 52–61. [Google Scholar] [CrossRef]
- Seif Sahandi, M.; Naghdi Badi, H.; Mehrafarin, A.; Khalighi-Sigaroodi, F.; Sharifi, M. Changes in essential oil content and composition of peppermint (Mentha piperita L.) in responses to nitrogen application. J. Med. Plant. 2019, 18, 81–97. [Google Scholar] [CrossRef]
- Nam, Y.J.; Tran, L.S.P.; Kojima, M.; Sakakibara, H.; Nishiyama, R.; Shin, R. Regulatory roles of cytokinins and cytokinin signaling in response to potassium deficiency in Arabidopsis. PloS ONE 2012, 7, e47797. [Google Scholar] [CrossRef]
- Hughes, A.M.; Zwack, P.J.; Cobine, P.A.; Rashotte, A.M. Cytokinin-regulated targets of Cytokinin Response Factor 6 are involved in potassium transport. Plant Direct 2020, 4, 291. [Google Scholar] [CrossRef]
- Nurzyńska-Wierdak, R.; Borowski, B.; Dzida, K. Yield and chemical composition of basil herb depending on cultivar and foliar feeding with nitrogen. Acta Sci. Pol. Hort. Cult. 2011, 10, 207–219. [Google Scholar]
- Souri, M.K.; Naiji, M.; Kianmehr, M.H. Nitrogen release dynamics of a slow release urea pellet and its effect on growth, yield, and nutrient uptake of sweet basil (Ocimum basilicum L.). J. Plant Nutr. 2019, 42, 604–614. [Google Scholar] [CrossRef]
- Khalid, K.A. Effect of NP and foliar spray on growth and chemical compositions of some medicinal Apiaceae plants grow in arid regions in Egypt. J. Soil Sci. Plant Nutr. 2012, 12, 581–596. [Google Scholar] [CrossRef]
- Kieber, J.J.; Schaller, G.E. Cytokinins. Arabidopsis Book 2014, 12, e0063. [Google Scholar] [CrossRef] [PubMed]
- Taiz, L.; Zeiger, E.; Møller, I.M.; Murphy, A. Plant Physiology and Development; Sinauer Associates Incorporated: Sunderland, MA, USA, 2015. [Google Scholar]
- Gu, J.; Li, Z.; Mao, Y.; Struik, P.C.; Zhang, H.; Liu, L.; Yang, J. Roles of nitrogen and cytokinin signals in root and shoot communications in maximizing of plant productivity and their agronomic applications. Plant Sci. 2018, 274, 320–331. [Google Scholar] [CrossRef] [PubMed]
- Walia, S.; Kumar, R. Nitrogen and sulfur fertilization modulates the yield, essential oil and quality traits of wild marigold (Tagetes minuta L.) in the Western Himalaya. Front. Plant Sci. 2021, 11, 631154. [Google Scholar] [CrossRef] [PubMed]
- Zhao, J.; Huang, R.; Yang, K.; Ma, C.; Zhang, Q. Effects of Nitrogen and Phosphorus Fertilization on Photosynthetic Properties of Leaves and Agronomic Characters of Alfalfa over Three Consecutive Years. Agriculture 2022, 12, 1187. [Google Scholar] [CrossRef]
- Sangwan, N.S.; Farooqi, A.H.A.; Shabih, F.; Sangwan, R.S. Regulation of essential oil production in plants. Plant Growth Regul. 2001, 34, 3–21. [Google Scholar] [CrossRef]
- Zheljazkov, V.D.; Vasile, C.; Charles, L.C.; Wayne, M.E.; Thomas, H. Effect of nitrogen, location, and harvesting stage on peppermint productivity, oil content, and oil composition. HortScience 2009, 44, 1267–1270. [Google Scholar] [CrossRef]
- Sun, J.; Li, W.; Li, C.; Chang, W.; Zhang, S.; Zeng, Y.; Peng, M. Effect of different rates of nitrogen fertilization on crop yield, soil properties and leaf physiological attributes in banana under subtropical regions of China. Front. Plant Sci. 2020, 11, 613760. [Google Scholar] [CrossRef]
- Khan, P.; Memon, M.Y.; Imtiaz, M.; Aslam, M. Response of wheat to foliar and soil application of urea at different growth stages. Pak. J. Bot. 2009, 41, 1197–1204. [Google Scholar]
- Otalora, G.; Pinero, M.C.; López-Marín, J.; Varó, P.; del Amor, F.M. Effects of foliar nitrogen fertilization on the phenolic, mineral, and amino acid composition of escarole (Cichorium endivia L. var. latifolium). Sci. Hortic. 2018, 239, 87–92. [Google Scholar] [CrossRef]
- Millikan, C.R. Plant varieties and species in relation to the occurrence of deficiencies and excesses of certain nutrient elements. J. Aust. Inst. Agric. Sci. 1961, 27, 220–233. [Google Scholar]
- Gupta, A.K.; Mishra, R.; Singh, A.K.; Srivastava, A.; Lal, R.K. Genetic variability and correlations of essential oil yield with agro-economic traits in Mentha species and identification of promising cultivars. Ind. Crops Prod. 2017, 95, 726–732. [Google Scholar] [CrossRef]
- Zaid, A.; Mohammad, F.; Fariduddin, Q. Plant growth regulators improve growth, photosynthesis, mineral nutrient and antioxidant system under cadmium stress in menthol mint (Mentha arvensis L.). Physiol. Mol. Biol. Plants 2020, 26, 25–39. [Google Scholar] [CrossRef] [PubMed]
- Reddi, M.V.; Reddy, P.S. Commercial crops (oil seed crops). In Handbook of Agriculture. Directorate of Information and Publication of Agriculture; ICAR, Krishi Anusadhan Bhavan, Pusa: New Delhi, India, 2003; pp. 921–1048. [Google Scholar]
- Dwivedi, R.S.; Randhawa, N.S. Evaluation of a rapid test for the hidden hunger of zinc in plants. Plant Soil 1974, 40, 445–451. [Google Scholar] [CrossRef]
- Lindner, R.C. Rapid analytical methods for some of the more common inorganic constituents of plant tissues. Plant Physiol. 1944, 19, 76. [Google Scholar] [CrossRef] [PubMed]
- Fiske, C.H.; Subbarow, Y. The colorimetric determination of phosphorus. J. Biol. Chem. 1925, 66, 375–400. [Google Scholar] [CrossRef]
- Hald, P.M. Notes on the determination and distribution of sodium and potassium in cells and serum of normal human blood. J. Biol. Chem. 1946, 163, 429–434. [Google Scholar] [CrossRef]


Disclaimer/Publisher’s Note: The statements, opinions and data contained in all publications are solely those of the individual author(s) and contributor(s) and not of MDPI and/or the editor(s). MDPI and/or the editor(s) disclaim responsibility for any injury to people or property resulting from any ideas, methods, instructions or products referred to in the content. |
© 2023 by the authors. Licensee MDPI, Basel, Switzerland. This article is an open access article distributed under the terms and conditions of the Creative Commons Attribution (CC BY) license (https://creativecommons.org/licenses/by/4.0/).
Share and Cite
Parrey, Z.A.; Shah, S.H.; Fayaz, M.; Casini, R.; Elansary, H.O.; Mohammad, F. Nitrogen Supplementation Modulates Morphological, Biochemical, Yield and Quality Attributes of Peppermint. Plants 2023, 12, 809. https://doi.org/10.3390/plants12040809
Parrey ZA, Shah SH, Fayaz M, Casini R, Elansary HO, Mohammad F. Nitrogen Supplementation Modulates Morphological, Biochemical, Yield and Quality Attributes of Peppermint. Plants. 2023; 12(4):809. https://doi.org/10.3390/plants12040809
Chicago/Turabian StyleParrey, Zubair Ahmad, Sajad Hussain Shah, Mudasir Fayaz, Ryan Casini, Hosam O. Elansary, and Firoz Mohammad. 2023. "Nitrogen Supplementation Modulates Morphological, Biochemical, Yield and Quality Attributes of Peppermint" Plants 12, no. 4: 809. https://doi.org/10.3390/plants12040809