Article

Selection and Validation of Optimal RT-qPCR Reference Genes for the Normalization of Gene Expression under Different Experimental Conditions in Lindera megaphylla

1
International Union Laboratory of Landscape Architecture of Henan, College of Landscape Architecture and Arts, Henan Agricultural University, Zhengzhou 450003, China
2
Zhengzhou Botanical Garden, Zhengzhou 450042, China
*
Authors to whom correspondence should be addressed.
These authors contributed equally to this work.
Plants 2023, 12(11), 2185; https://doi.org/10.3390/plants12112185
Submission received: 12 April 2023 / Revised: 18 May 2023 / Accepted: 29 May 2023 / Published: 31 May 2023
(This article belongs to the Special Issue Molecular Biology of Ornamental Plants)

Abstract

:
Lindera megaphylla, a broad-leaved evergreen that is used as a landscape ornamental plant and medicinal plant, is an ecologically important and dominant tree species. However, little is known about the molecular mechanisms of its growth, development, and metabolism. The selection of suitable reference genes is critical for molecular biological analyses. To date, no research on reference genes as a foundation for gene expression analysis has been undertaken in L. megaphylla. In this study, 14 candidate genes were selected from the transcriptome database of L. megaphylla for RT-qPCR assay under different conditions. Results showed that helicase-15 and UBC28 were most stable in different tissues of seedlings and adult trees. For different leaf developmental stages, the best combination of reference genes was ACT7 and UBC36. UBC36 and TCTP were the best under cold treatment, while PAB2 and CYP20-2 were the best under heat treatment. Finally, a RT-qPCR assay of LmNAC83 and LmERF60 genes were used to further verify the reliability of selected reference genes above. This work is the first to select and evaluate the stability of reference genes for the normalization of gene expression analysis in L. megaphylla and will provide an important foundation for future genetic studies of this species.

1. Introduction

Lindera megaphylla is a predominant, broad-leaved, and aromatic evergreen tree species belonging to the Lauraceae family and is widely distributed in the subtropical and warm-temperate zones of China. L. megaphylla has not only ecological and ornamental value, but also medicinal and therapeutic value as a source of an essential oils, spices, and drugs [1,2,3]. For example, d-dicentrine, an aporphine alkaloid, is isolated from the root of L. megaphylla and has potential antitumor activity [4,5]. These trees are rich in terpenoids, alkaloids, and flavonoids, many of which could be used to make pesticides or industrial feedstocks, while its volatile compounds, mainly terpenoids, have strong bactericidal ability. These trees can also help to improve air quality [6], a property that could be improved through molecular breeding. To synthesize antibacterial compounds, it is necessary to first explore the related regulatory genes and to analyze their functions. To date, studies of L. megaphylla have largely focused on the cultivation of seedlings, various kinds of biotic and abiotic stress responses and the analysis of volatile substances and their potential applications [7,8,9,10,11,12], while few studies have focused on the molecular biology of L. megaphylla due to a lack of genomic information. Gene expression analysis circumvents that lack of a sequenced genome to explore the molecular mechanisms underlying transcriptional regulation of phenotype. Transcriptome datasets derived from different tissues and differently aged leaves of L. megaphylla have been obtained (unpublished data), which will greatly promote functional genetic studies in this species.
Real-time reverse transcriptase quantitative polymerase chain reaction (RT-qPCR) is an important tool for analyzing gene expression because of its high throughput, sensitivity and precision [13,14]. However, RT-qPCR data are affected by many factors, such as extraction protocols, the purity and integrity of the extracted RNA, the efficiency of reverse transcription and PCR amplification, and primer specificity [15,16]. Therefore, a stably expressed reference gene is essential to avoid unnecessary errors generated through confounding factors and to increase the accuracy of the RT-qPCR data analysis. In the pre-genomic era, traditional reference genes were chosen based on their known or suspected housekeeping roles in basic cellular processes, cell structure, or primary metabolism, including genes encoding actin (ACT), 18S rRNA (18S) and glyceraldehyde-3 phosphate dehydrogenase (GAPDH) [17,18,19,20]. Unfortunately, these housekeeping genes are not stably expressed in all tissues, under different experimental conditions, or between different species [21,22]. In addition, a growing number of studies have revealed that some novel genes can also be used as internal references and are better than some traditional housekeeping genes [23,24,25,26]. Thus, it is necessary to systematically select the most appropriate reference genes to ensure the accuracy of RT-qPCR analysis for specific conditions and in specific materials. For this reason, optimal reference genes for transcript normalization must be determined through statistical algorithms such as delta cycle threshold (ΔCt) [27], geNorm [28], NormFinder [29], BestKeeper [30], and RefFinder [31] for each type of sample. These algorithms are widely used to assess the transcript stability of candidate reference genes in various species [32,33,34,35]. The use of reference genes in expression analysis has greatly facilitated our understanding of the important information related to gene functions and complex biological processes in plants, such as the signaling and metabolic pathways that underlie developmental and cellular processes [36,37,38,39].
Gene expression databases of model plant species such as Arabidopsis thaliana and tomato (Lycopersicon esculentum) are important resources for identifying and searching for genes of interest and their expression patterns (http://www.ebi.ac.uk/arrayexpress/; accessed on 5 June 2022; http://www.ncbi.nlm.nih.gov/geo/, accessed on 5 June 2022) [17]. Czechowski et al. selected, verified, and recommended 18 new reference genes that were superior to traditional reference genes in terms of expression stability across an extensive sample series or under a range of environmental conditions through the publicly available AtGenExpress database (http://web.uni-frankfurt.de/fb15/botanik/mcb/AFGN/atgenex.htm, accessed on 5 June 2022) and the author’s own ATH1 database [17]. Orthologues of known genes in Arabidopsis can serve the same purposes as in other species. In addition, Lin et al. validated suitable reference genes for reliable normalization of data from Litsea cubeba [40]. Moreover, both L. megaphylla and L. cubeba belong to the Lauraceae family, and their evolutionary relationship is relatively close.
Based on these previous results, we first selected 40 genes that have been used as internal reference from published model plants such as Arabidopsis thaliana and other species in the Lauraceae family as candidate reference genes for L. megaphylla. Second, we screened homologous sequences in the transcriptome database of L. megaphylla and obtained 20 candidate genes based on expression multiples less than 1.5 and FPKM value > 50 in different tissues.
In this study, 14 candidate genes were identified with E-values between 91.035% and 107.169% and R2 values from 0.991 to 0.999, indicating that the primer pairs may be more accurate for standardized evaluation by RT-qPCR. The candidate genes included translationally controlled tumor protein (TCTP), ACT7, GAPDH, ubiquitin-conjugating enzyme E2 36/7 (UB C36, UBC7), elongation factor 2-like (EF2), peptidyl-prolyl cis-trans isomerase CYP20-2, chloroplastic (CYP20-2), polyubiquitin (UBQ), alpha-tubulin (TUA), ubiquitin-conjugating enzyme E2 28-like (UBC28), NADH dehydrogenase (ubiquinone), pentatricopeptide repeat-containing protein (PPR), eukaryotic initiation factor 4A-3-like (EIF4A-3), DEAD-box ATP-dependent RNA helicase 15 (helicase-15), and polyadenylate-binding protein 2-like (PAB2). These 14 candidate genes were then assessed for stability of expression under specific conditions, including different tissues of one-year-old seedlings (roots, stems, and leaves), tissues of 10-year-old trees (leaf buds, young stems, young seeds, young leaves, and mature leaves), 16 different leaf developmental stages and under different temperature stresses (cold and heat). Finally, the NAC and ERF genes, which are from an important family of transcription factors in plants, were used to verify the reliability of the selected reference genes in different samples. Our research identified the best reference genes for RT-qPCR analysis of L. megaphylla tissues under different conditions, laying a basis for further studies of the molecular mechanisms regulating gene expression in this important tree species.

2. Materials and Methods

2.1. Plant Materials and Treatments

L. megaphylla trees were grown in a field at the Zhengzhou Botanical Garden located in Zhengzhou city, Henan Province, China. Young seedlings were cultivated in plant growth chambers with LED lighting for temperature treatments. In total, 6 experimental sets were cultivated for RNA extraction. The first experimental set consisted of roots, stems, and leaves from 1-year-old seedlings that displayed robust and consistent growth. The second experimental set consisted of leaf buds, young stems, young seeds, young leaves, and mature leaves from adult trees of L. megaphylla that had been growing in the natural environment for approximately 10 years. The third experimental set included leaves at different developmental stages. Growing leaves were collected roughly every 3–7 or 3–15 days from the beginning of leaf bud growth in late March until the leaves were fully mature by the end of July. The specific sampling dates were 24 March, 29 March, 1 April, 4 April, 7 April, 15 April, 22 April, 29 April, 14 May, 23 May, 4 June, 16 June, 1 July, 15 July, and 31 July. The fourth set was exposed to cold stress [41]. Furthermore, 1-year-old seedlings were grown at 65% relative humidity and under 16 h/8 h light/dark conditions in an LED plant growth incubator (Shengyuan Instrument Co., Ltd., Zhengzhou, China). The seedlings were first treated at 25 °C for 7 days as control, and leaves were collected. Then, the seedlings were transferred to 4 °C for 7 days for long-term chilling acclimation (CA). Next, the seedlings were shifted to 0 °C for an additional 7 days for long-term freezing acclimation (FA). Then, the seedlings were again moved to control conditions (25 °C) for 7 days for long-term de-acclimation (DA). The fifth and sixth experimental groups consisted of leaves collected from 1-year-old seedlings that were treated with cold and heat, respectively. For cold treatments, the seedlings were cultivated in an LED plant growth incubator at 25 °C, 4 °C, 0 °C, −4 °C, or −6 °C for 24 h. For heat treatments, the seedlings were cultivated in an incubator at 25 °C, 30 °C, 35 °C, 40 °C, or 45 °C for 24 h. Data regarding all six sample sets described above are summarized in Table 1. All collected samples were immediately frozen in liquid nitrogen and stored at −80 °C. Three independent biological replicates were collected for each sample.

2.2. Total RNA Extraction and cDNA Synthesis

Total RNA was extracted from 0.05 g samples using a Quick RNA isolation kit (HUAYUEYANG Biotechnology, Beijing, China) according to the manufacturer’s protocol [42]. The RNA integrity, purity and concentration were assessed using 2% (w/v) agarose gel electrophoresis and a NanoDrop ND-1000 spectrophotometer (Thermo Scientific, Waltham, MA, USA). Total RNA (1 μg) with A260/A280 and A260/A230 ratios greater than 1.8 was used for first-strand cDNA synthesis using the Evo M-MLV RT Kit with gDNA Clean for qPCR according to the manufacturer’s instructions (Accurate Biotechnology, Changsha, China). Specifically, a 10 μL reaction system (1 µg total RNA, 2 µL 5 × gDNA Clean Reaction Mix, to a total volume of 10 µL with RNase-free water) was subjected to 42 °C for 2 min. Then, a 20 μL reaction system (10 μL of first reaction solution, 4 μL 5 × Evo M-MLV RT Reaction Mix and 6 μL RNase-free water) was subjected to 37 °C for 15 min and 85 °C for 5 s. Five-fold diluted cDNA was used for subsequent RT-qPCR experiments. All cDNA samples were stored at −20 °C until use.

2.3. Selection of Candidate Reference Genes and Design of RT-qPCR Primers

In total, 20 candidate genes (TCTP, ACT7, GAPDH, UBC36, UBC7, EF2, CYP20-2, UBQ, TUA, UBC28, ICln, ubiquinone, PPR, SDE2, EIF4A-3, helicase-15, PAB2, CYP9, RHA2A, and EF1α) were selected from the transcriptome database of L. megaphylla based on reference genes reported in the literature. All primers were designed using the qPCR primer quest tool (https://sg.idtdna.com/pages/tools/primerquest?returnurl=%2Fprimerquest%2FHome%2FIndex, accessed on 9 June 2022) based on the coding sequences (CDS) in the transcriptome database of L. megaphylla (Supplementary Table S1). Details of these candidate reference genes and primers are shown in Table 2.

2.4. RT-PCR and RT-qPCR Data Analysis

To verify the accuracy of the designed primers, each pair was used for RT-PCR amplification. Each 20 µL reaction system contained 2 µL of 10 µM forward and reverse primers, 1 µL cDNA, 10 µL 2 × Rapid Taq Master Mix (Vazyme, Nanjing, China) and 7 µL ddH2O. The reaction was carried out at 95 °C for 3 min, followed by 35 cycles of 95 °C for 30 s, 60 °C for 30 s and 72 °C for 15 s, with a final extension at 72 °C for 2 min. The PCR products were visualized by 1% (w/v) agarose gel electrophoresis.
To monitor the E-value, the cDNA templates from all samples were serially diluted five-fold (cDNA:water, v:v). RT-qPCR was performed for each pair of primers to obtain Ct values and to establish a standard curve; the R2, slope and E-values were calculated with Microsoft Office Excel 2019 using the following formula: E = (5−1/slope − 1) × 100% [43].
All RT-qPCRs were performed with an Applied BiosystemsTM (ABI) QuantStudioTM 5 real-time PCR system (ABI, Los Angeles, CA, USA) using the following amplification procedure: 95 °C for 30 s, followed by 40 cycles of 95 °C for 5 s and 60 °C for 30 s. A melting curve was generated at 60–95 °C. Each 20 µL RT-qPCR reaction (10 µL 2 × SYBR® Green Pro Taq HS Premix, 2 µL 5-fold diluted cDNA, 0.4 µL 10 µM forward primer, 0.4 µL 10 µM reverse primer, 0.4 µL 4 µM ROX Reference Dye, and 6.8 µL RNase-free water) was prepared according to the instructions for SYBR® Green Premix Pro Taq HS qPCR Kit (Rox Plus) (Accurate Biology, Shanghai, China). A negative control without the addition of cDNA was used to test for background amplification. Three technical replicates were performed for each sample, and the mean was used for RT-qPCR analysis.

2.5. Candidate Reference Gene Expression Stability Analysis

CT values were used to assess the expression levels of candidate reference genes in all samples by RT-qPCR. Four common algorithms, namely, delta Ct (ΔCt), geNorm (version 3.5), NormFinder (version 0.953) and BestKeeper (version 1.0), were used to evaluate the stability of the expression of the candidate reference genes in the different experimental groups. In geNorm and NormFinder, the M value reflects the stability of each candidate reference gene [28,29], with a smaller M value indicating higher stability. The geNorm package also determines the number of optimal reference genes based on the ratio Vn/n+1 by calculating pairwise variations in the normalized factor after introducing a new internal reference gene [28]. A cut-off value of 0.15 was used for pairwise variation. If the value of Vn/n+1 was less than 0.15, n was selected for the number of optimal internal reference genes; if the value of Vn/n+1 was greater than 0.15, n + 1 was selected. For BestKeeper, the values of CV and SD were used to evaluate the relative expression stability of each candidate gene [29]. The smaller the CV and SD values are, the more stable the gene. Finally, the RefFinder program (http://blooge.cn/RefFinder/, accessed on 25 September, 2022) was used to comprehensively rank the candidate reference genes by ΔCt, geNorm, NormFinder, and BestKeeper as previously described [31].

2.6. Validation of Candidate Reference Genes by RT-qPCR

The NAC and ERF transcription factors function as central switches of growth, development and various abiotic/biotic stress responses in plants [44,45,46,47,48]. Hence, LmNAC83 and LmERF60 genes were selected as targets to determine the reliability of the most stable and unstable reference genes. The primers for these two genes are shown in Supplementary Table S2. The expression levels of these genes were calculated using the 2−∆∆Ct method [35]. The RT-qPCR analysis was carried out using RNA from three biological replicates.

3. Results

3.1. Verification of Amplicon Size, Primers Specificity and PCR Amplification Efficiency

A total of 20 candidate genes from L. megaphylla were selected as potential reference genes for the normalization of target gene transcript levels using RT-qPCR. Standard PCR amplification with primers (Table 2, Supplementary Table S1) targeting the candidate genes was performed with reverse-transcribed cDNA from each sample as templates. Agarose gel electrophoresis indicated that all PCR products were single bands of the expected sizes, indicating that the primers were specific (Supplementary Figure S1). The melting curves, obtained after 40 cycles of amplification by RT-qPCR, showed single peaks, which also verified that the primers for the 20 candidate reference genes had strong specificity (Supplementary Figure S2). Standard curves, generated using a five-fold serial dilution for each candidate gene, had linear correlation coefficients (R2) greater than 0.99 for each specific primer pair, and the amplification efficiencies of the RT-qPCR reactions were 64.42–107.17% (Table 2). Because the amplification efficiencies of ICIn (64.42%), UBQ (85.95%), SDE2 (86.75%), and EF1α (83.49%) were less than 90%, and the R2 values of CYP95 and RHA2A were <0.99, these six candidate genes, based on the designed primers, were not appropriate for validating expression. Therefore, the remaining 14 candidate genes were used for subsequent experiments.

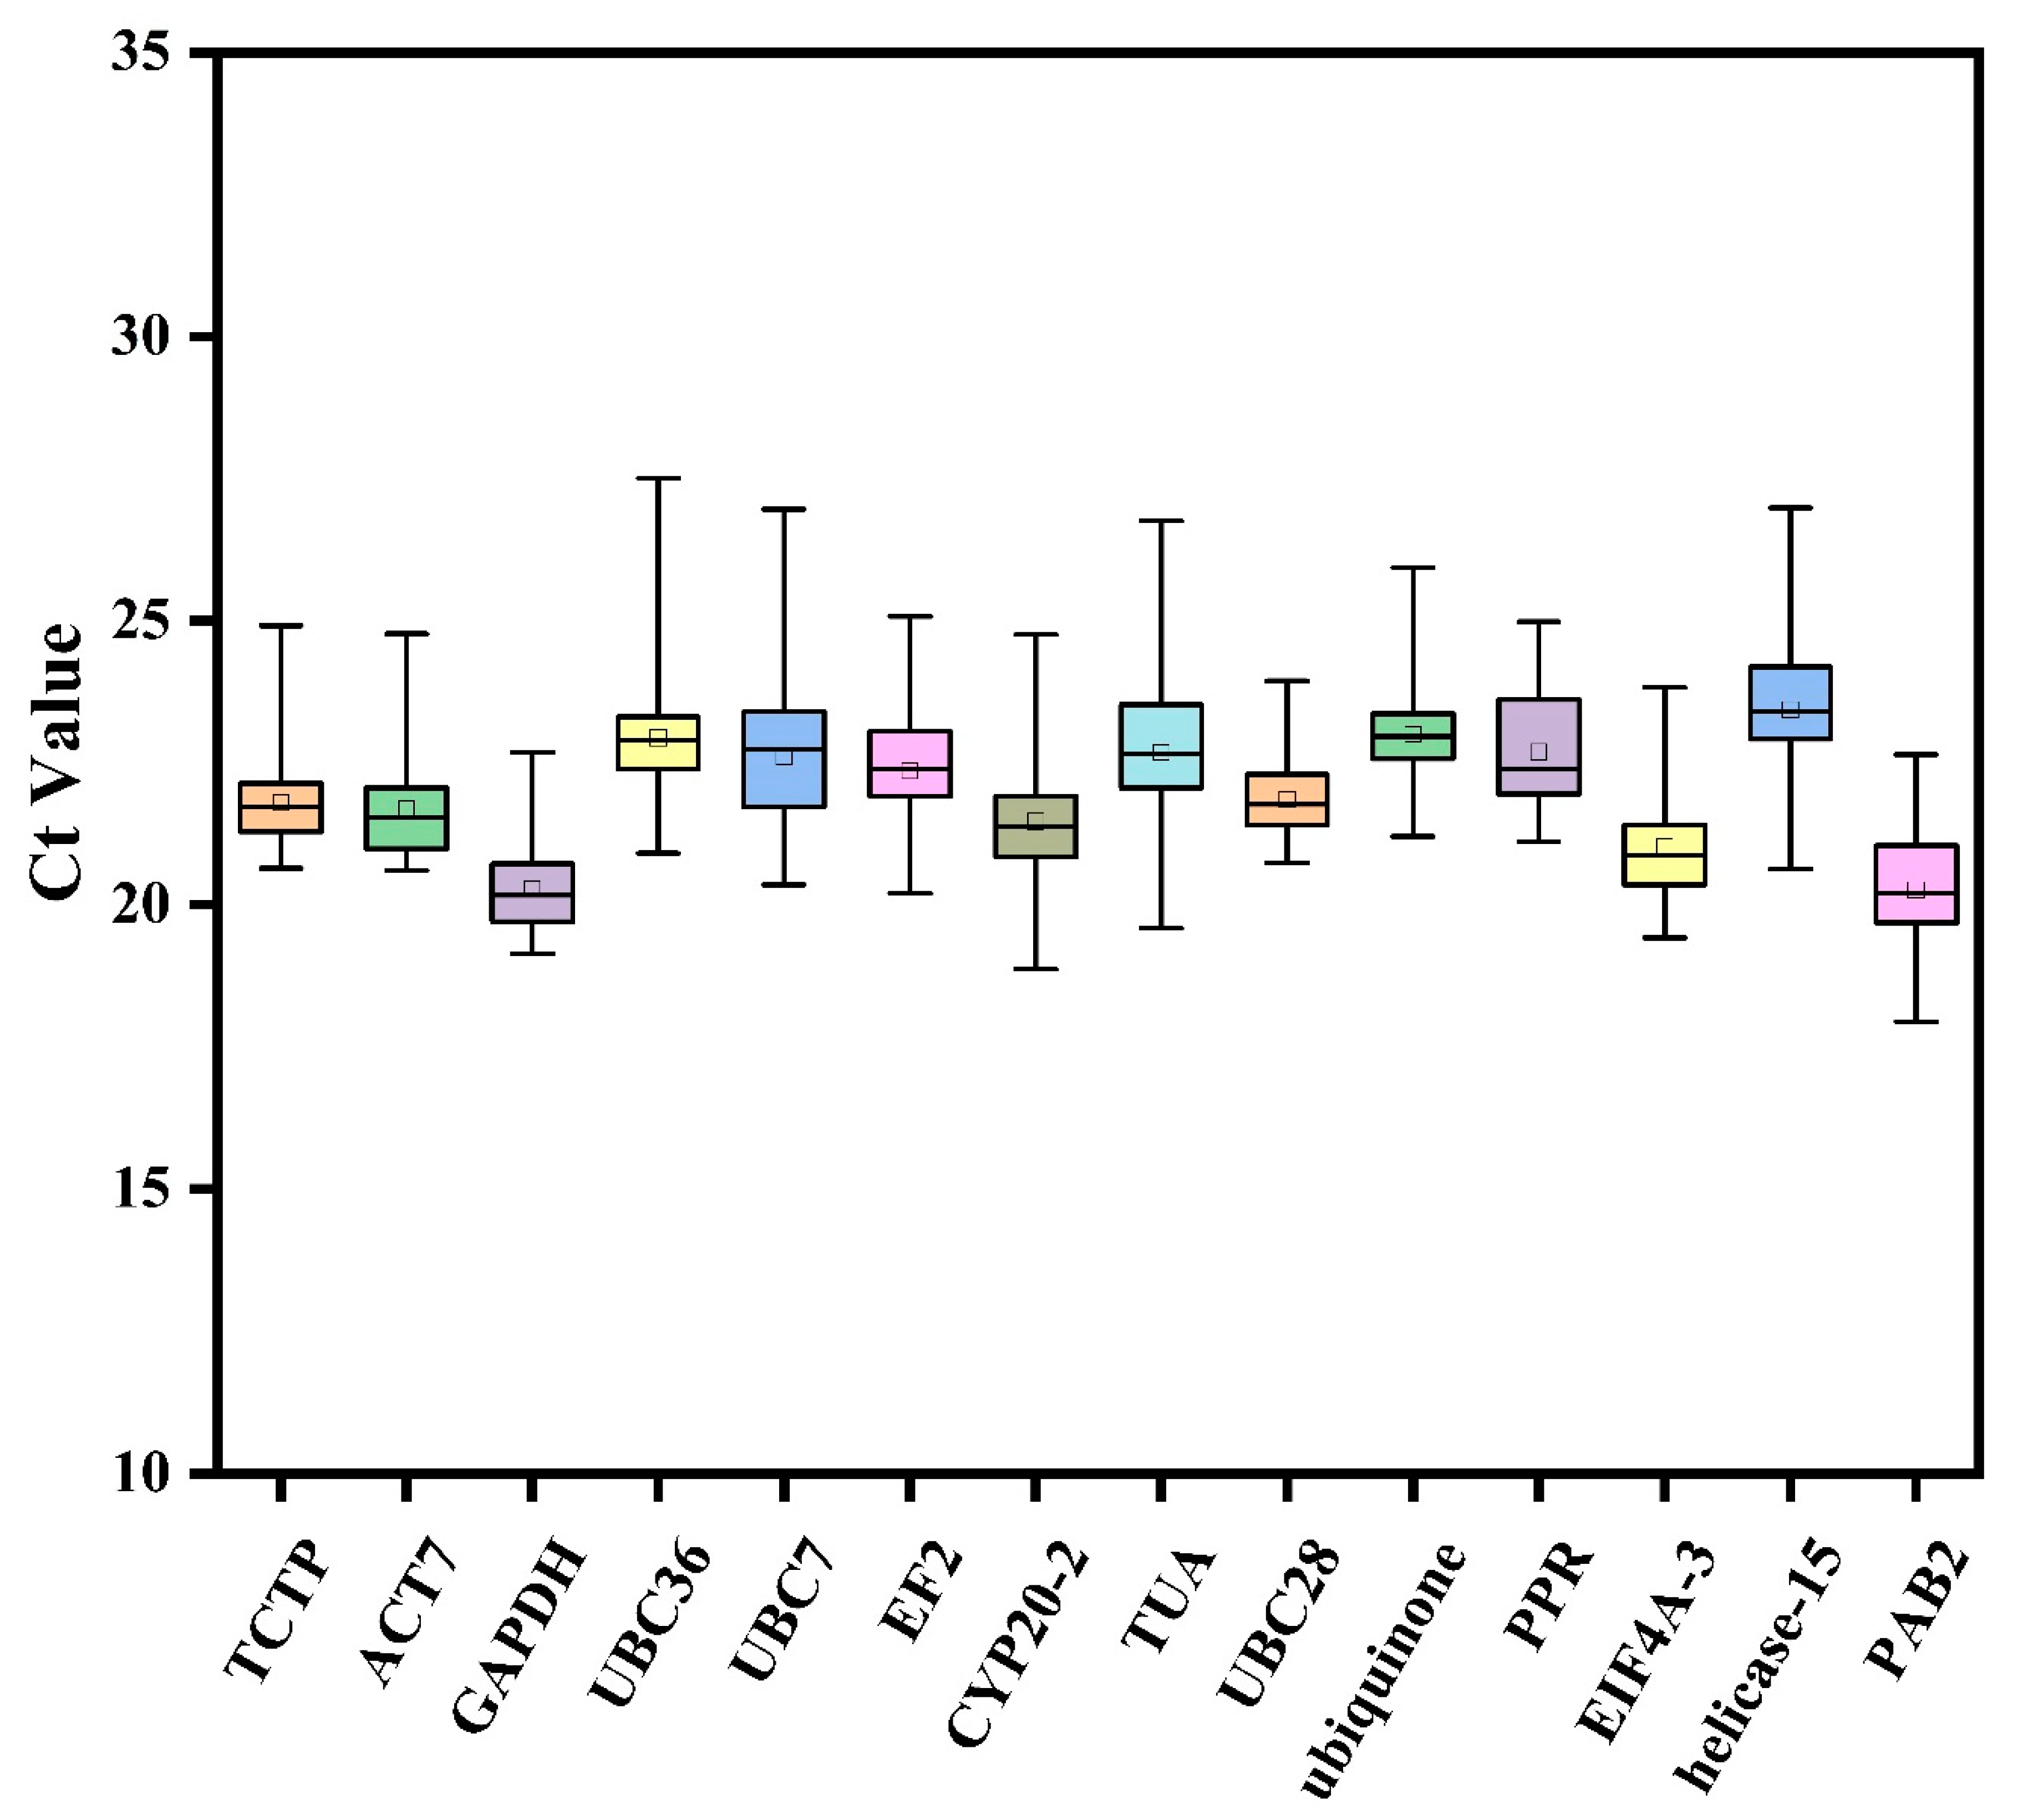
3.2. Transcript Abundance of Candidate Reference Genes

The transcript abundance of 14 candidate reference genes was estimated using the average cycle threshold (Ct) values for RNA extracted from different tissues or plants grown under different experimental conditions. All candidate reference genes were expressed at a wide range of transcript levels under the different experimental conditions. The gene expression level is negatively correlated with the Ct value, which means that a gene with a higher transcript level has a smaller Ct value. As shown in Figure 1, the minimum Ct value was 17.94, and the maximum was 27.51. Among the genes, UBC36 exhibited the highest transcript abundance, with the minimum, median and maximum Ct values of 20.91, 22.90, and 27.51, respectively. PAB2 showed the lowest expression abundance, with minimum, median and maximum Ct values being 17.94, 20.20, and 22.65, respectively. Compared with other genes, GAPDH, UBC28, and TCTP had obviously narrow range of Ct values (19.14–22.69, 20.74–23.95, and 21.10–24.98, respectively), indicating that they have a relatively stable expression level. While all the candidate reference genes exhibited significant expression abundance, none of the candidate genes were expressed stably in all samples. Thus, it is necessary to screen the appropriate internal reference genes for L. megaphylla under different experimental conditions or tissue types.

3.3. Estimation of the Stability of the Reference Genes under Different Experimental Conditions

To identify the optimal reference genes for the normalization of gene expression analysis in L. megaphylla, the stability of the 14 candidate genes was assessed by four different algorithms. The RefFinder software was used for overall ranking.

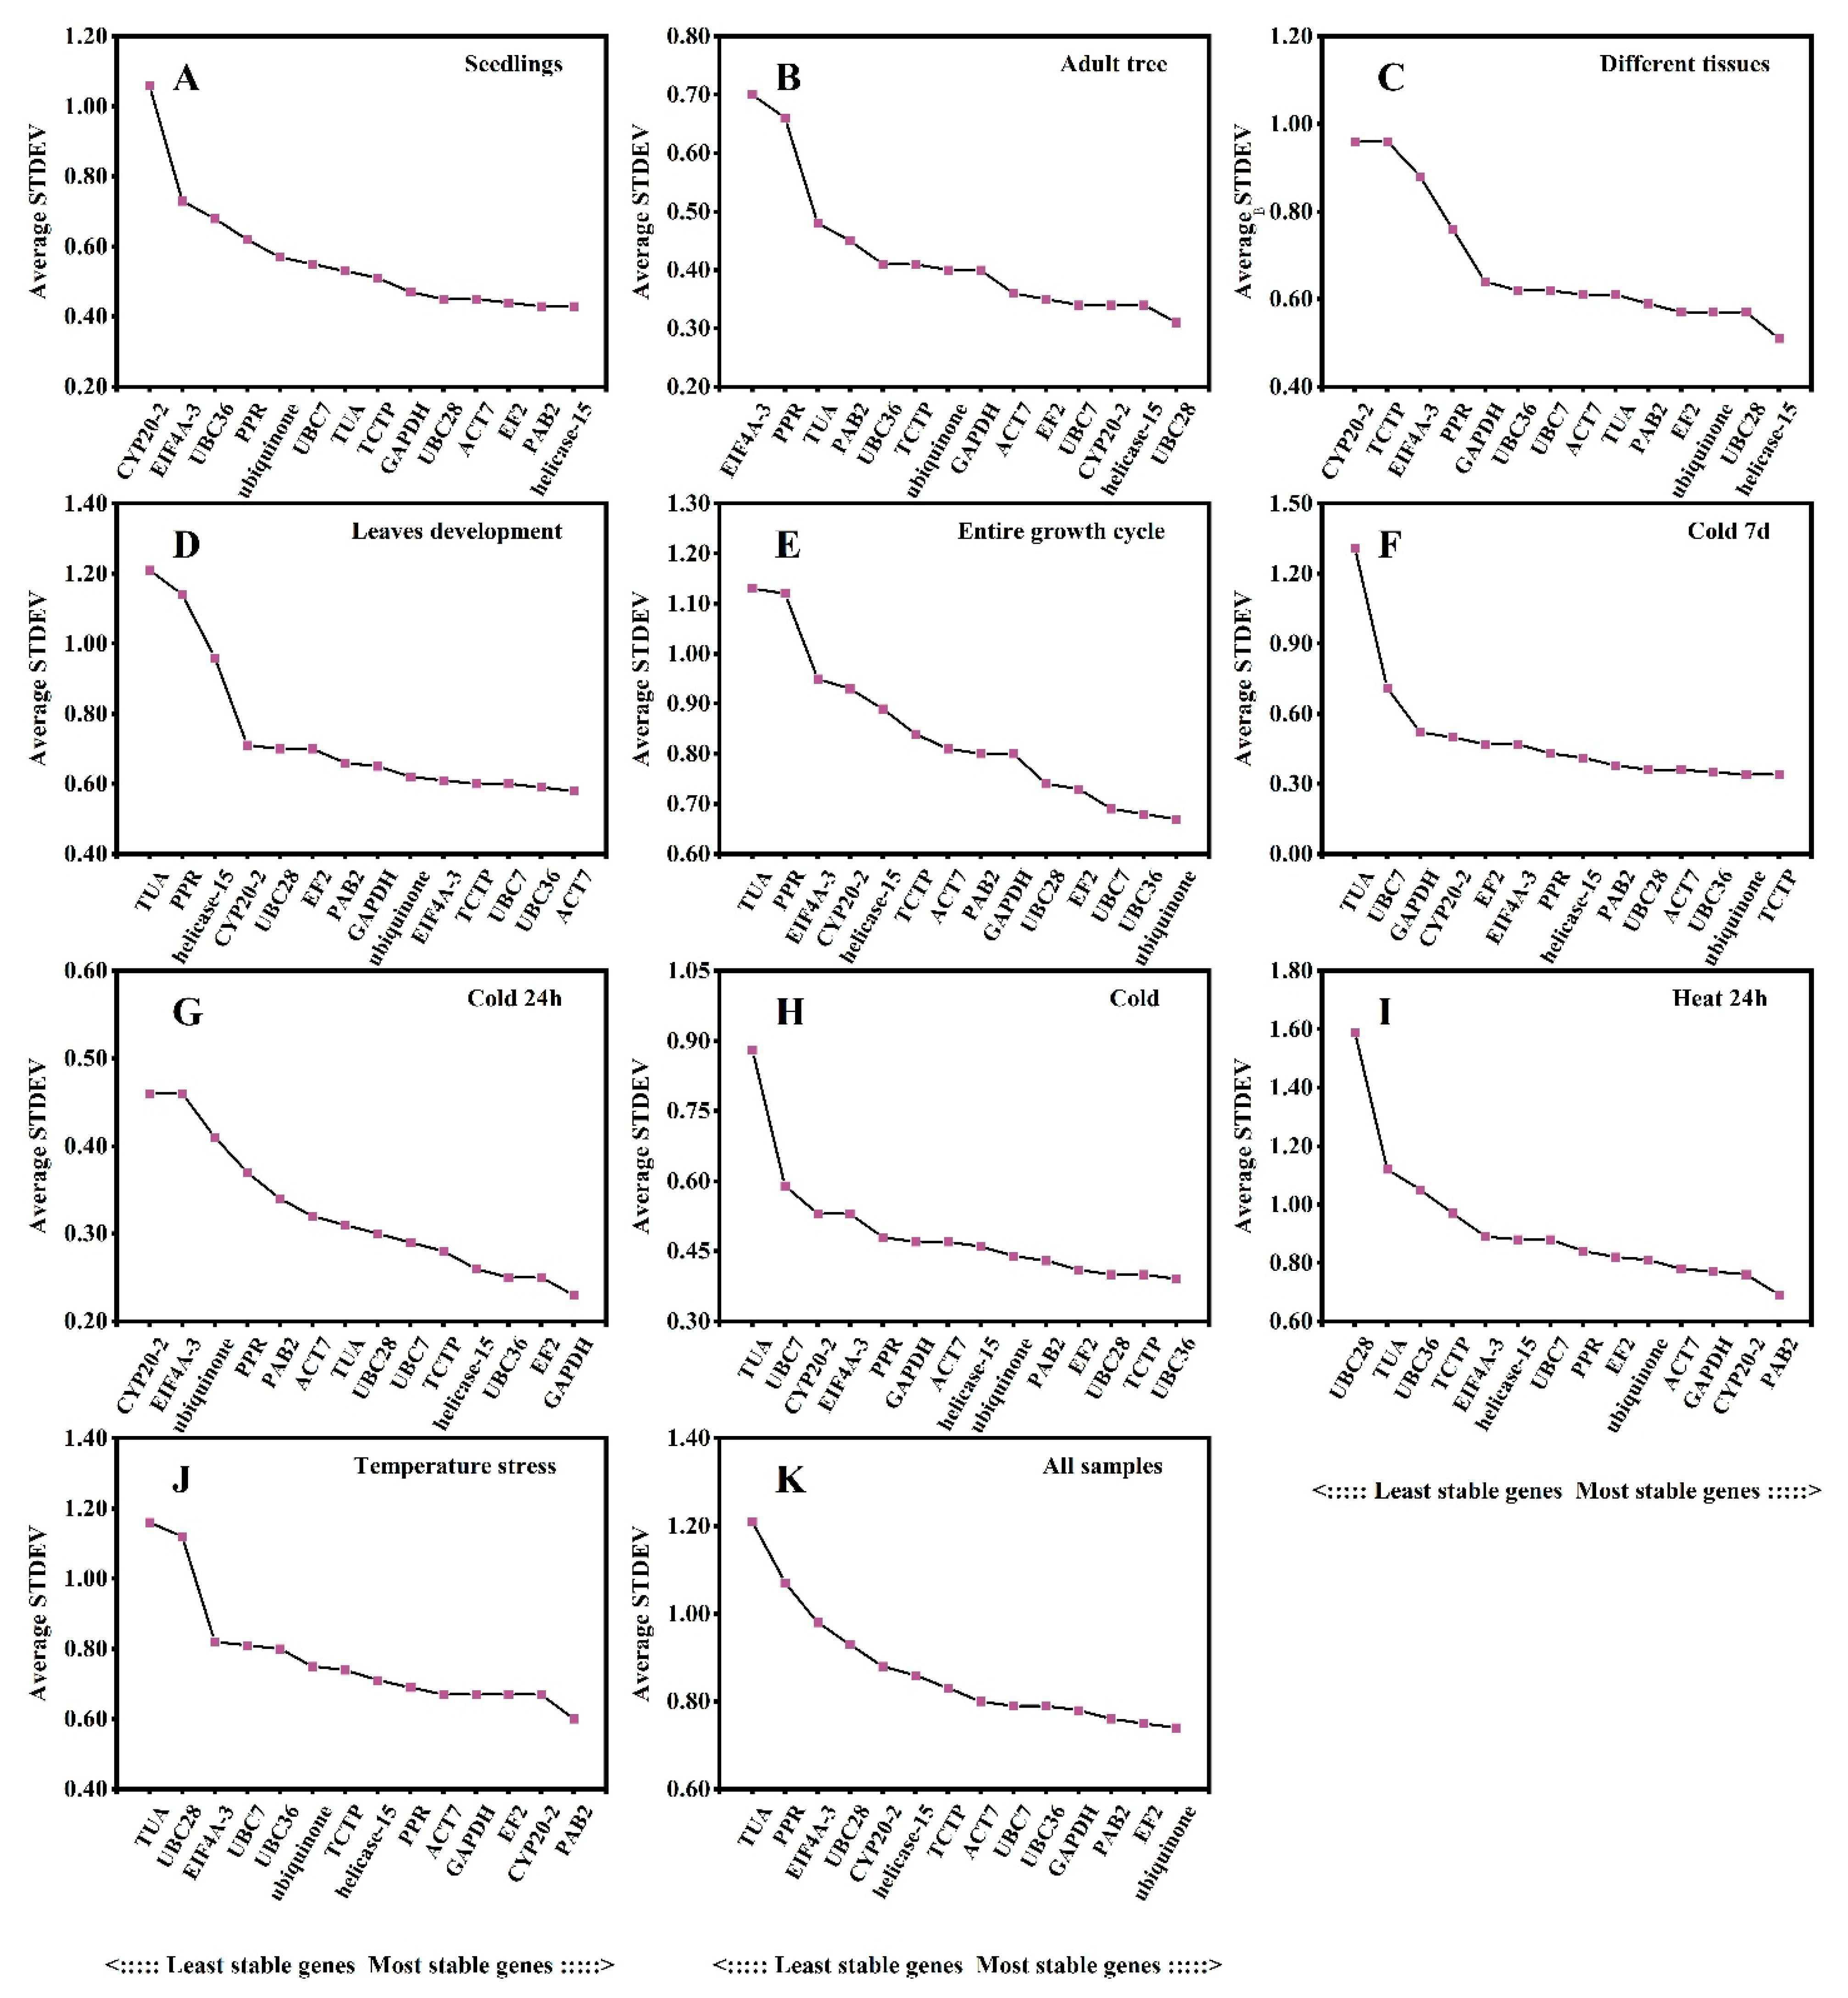
3.4. Delta Ct Method Analysis

The delta Ct (ΔCt) method ranks the stability of candidate reference genes based on the relative expression levels of “gene pairs” in each group of sample comparisons, while the mean standard deviation of gene expression differences (STDEV) is inversely proportional to its stability using the raw Ct value [34]. The stability of the transcript levels of each candidate reference gene was evaluated based on the STDEV value. The gene with the minimum STDEV value was regarded as the most stably expressed gene. The results demonstrated that the optimal reference genes were different in the different experimental sets (Figure 2). In seedling samples, helicase-15 and PAB2 showed the lowest ΔCt values (0.43), indicating the most stability (Figure 2A), while UBC28 (0.31) was the most stably expressed gene in adult trees (Figure 2B). In other tissues, helicase-15 (0.51) and UBC28 (0.57) were the most stable reference genes (Figure 2C), which is consistent with the results for seedlings and adult trees. ACT7 (0.58) and UBC36 (0.59) were more stable across different leaf developmental stages (Figure 2D). Data analyses from the entire growth cycle indicated that ubiquinone (0.67) and UBC36 (0.68) were the most stable (Figure 2E). UBC36 showed good stability in all three cold stress sets (Figure 2F–H). PAB2 (0.69) had the highest stability under heat treatment (Figure 2I). Across all temperature stresses, PAB2 (0.6) was the most stably expressed gene (Figure 2J). For all samples, ubiquinone (0.74), EF2 (0.75) and PAB2 (0.76) showed the most stability (Figure 2K). TUA had relatively higher Ct values, indicating that it was the least stable reference gene in most of the experimental sets (Figure 2A–K).

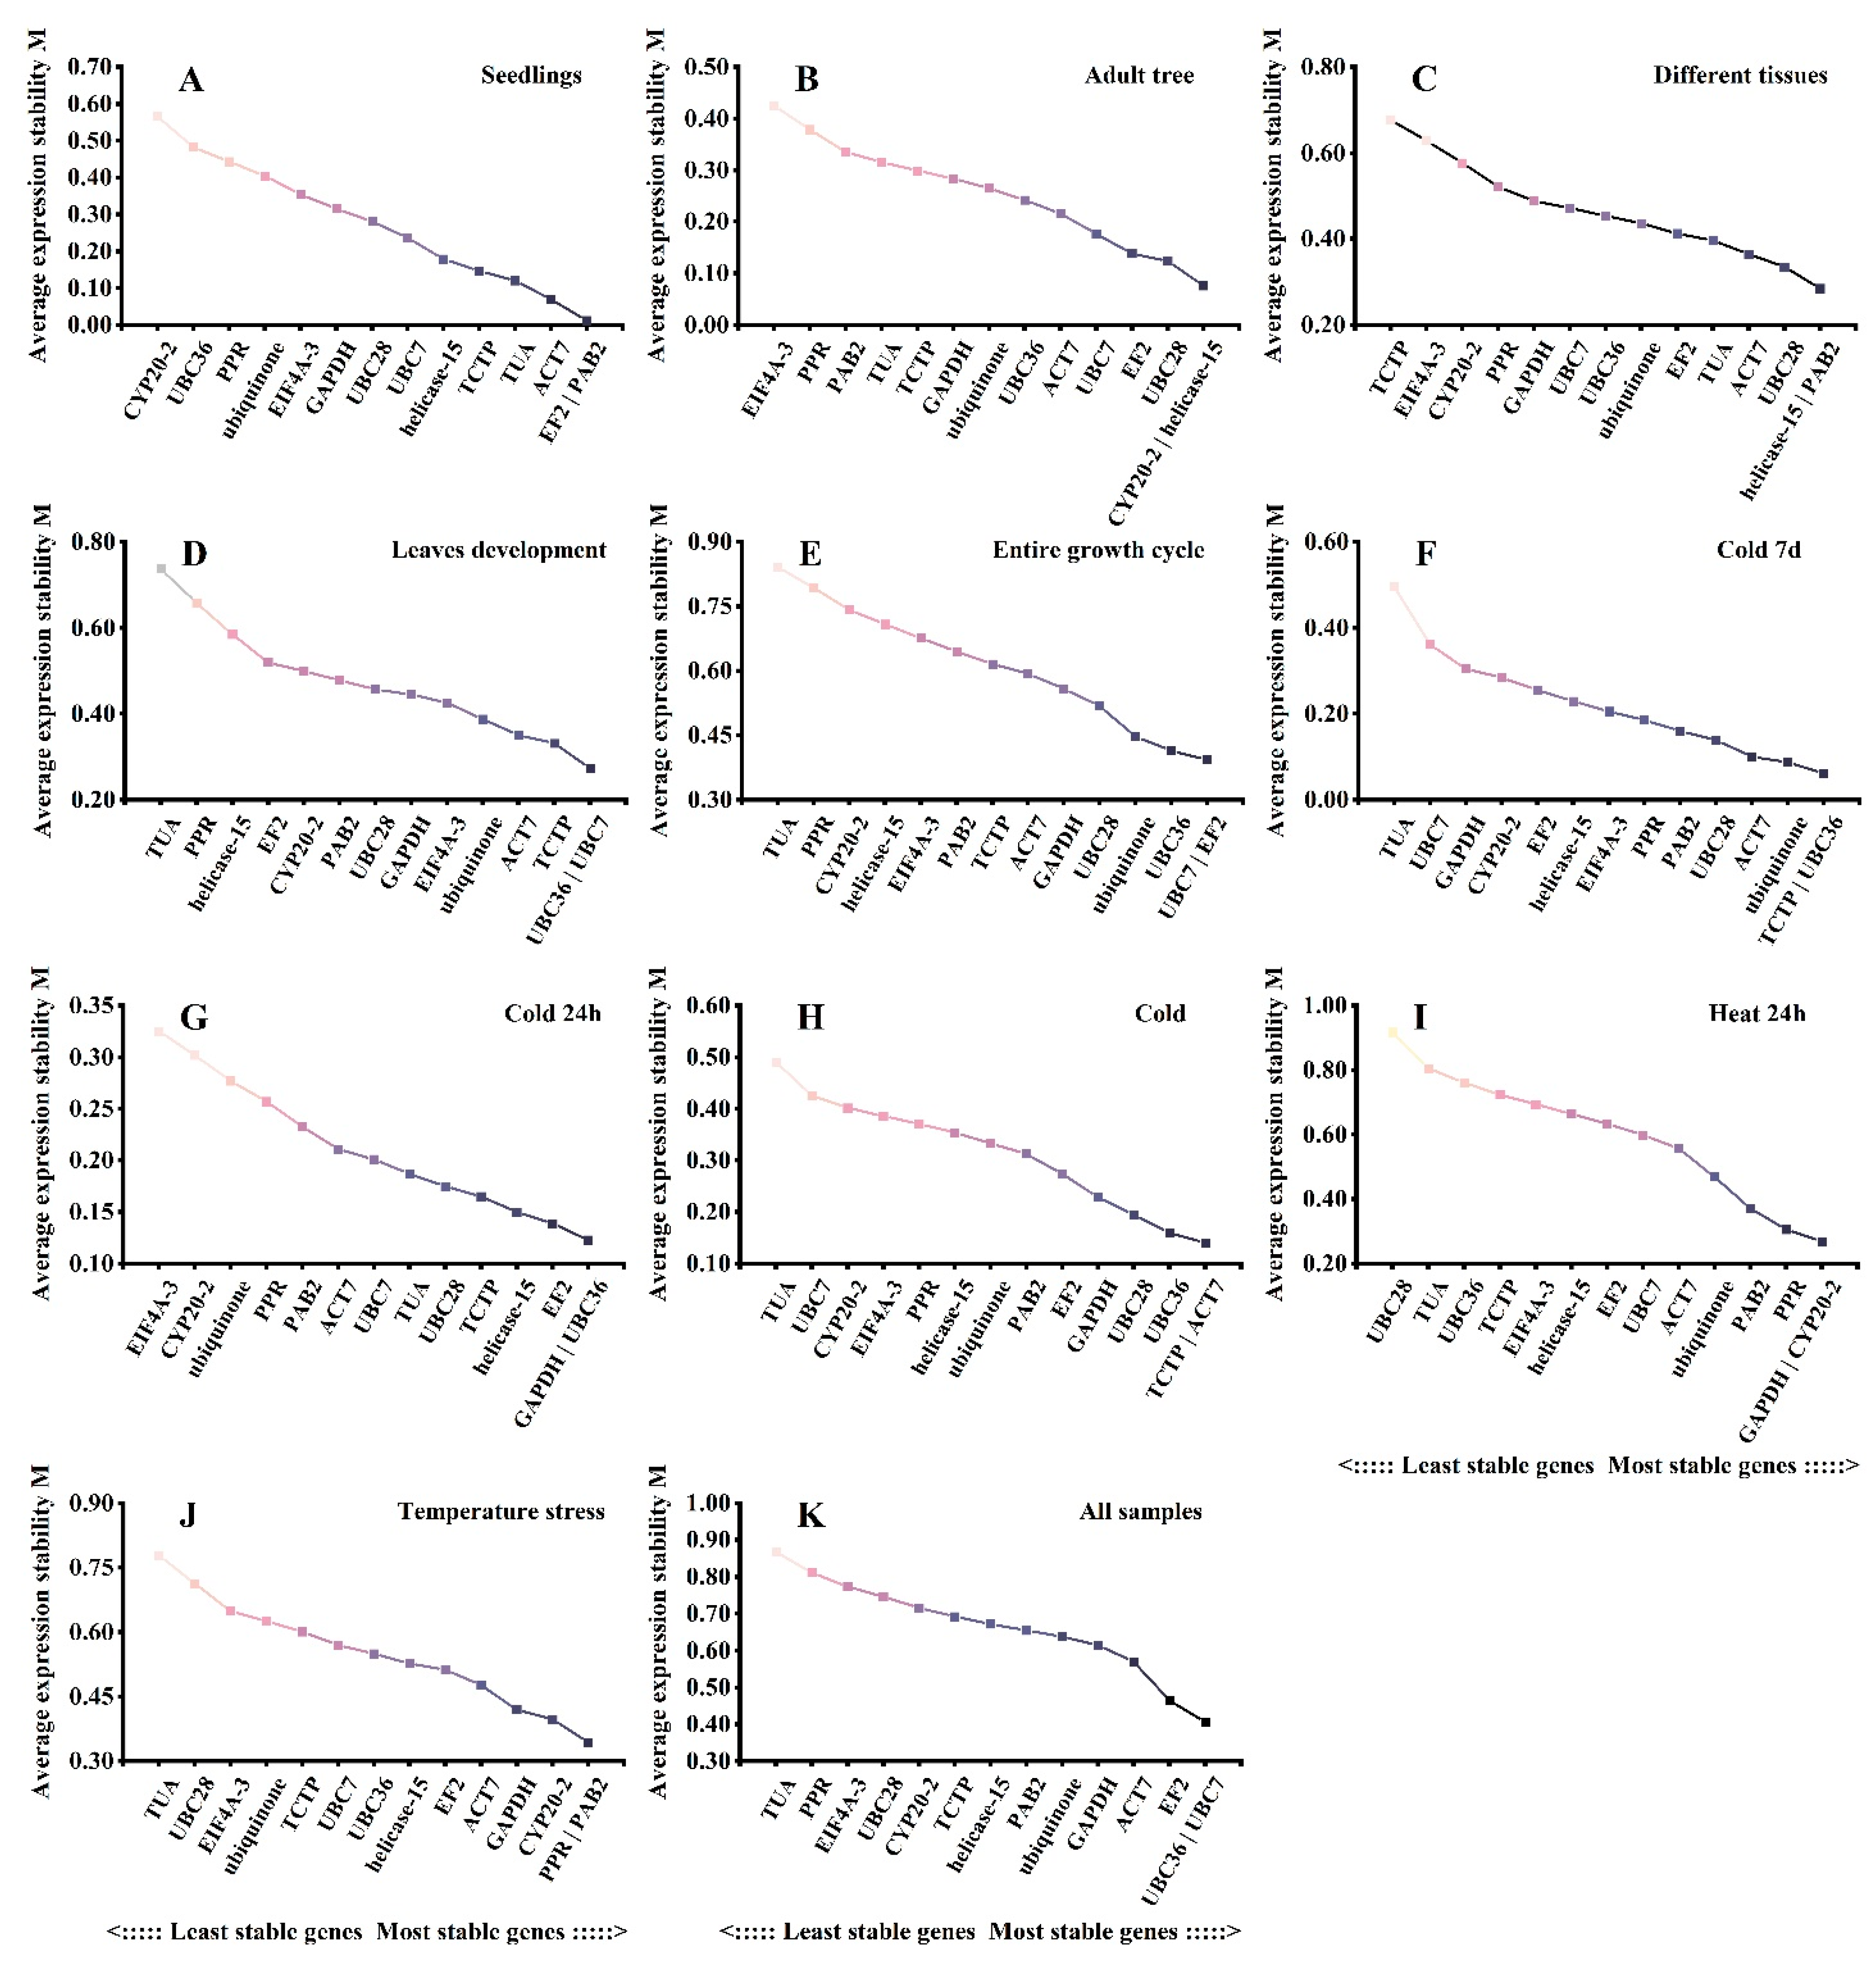
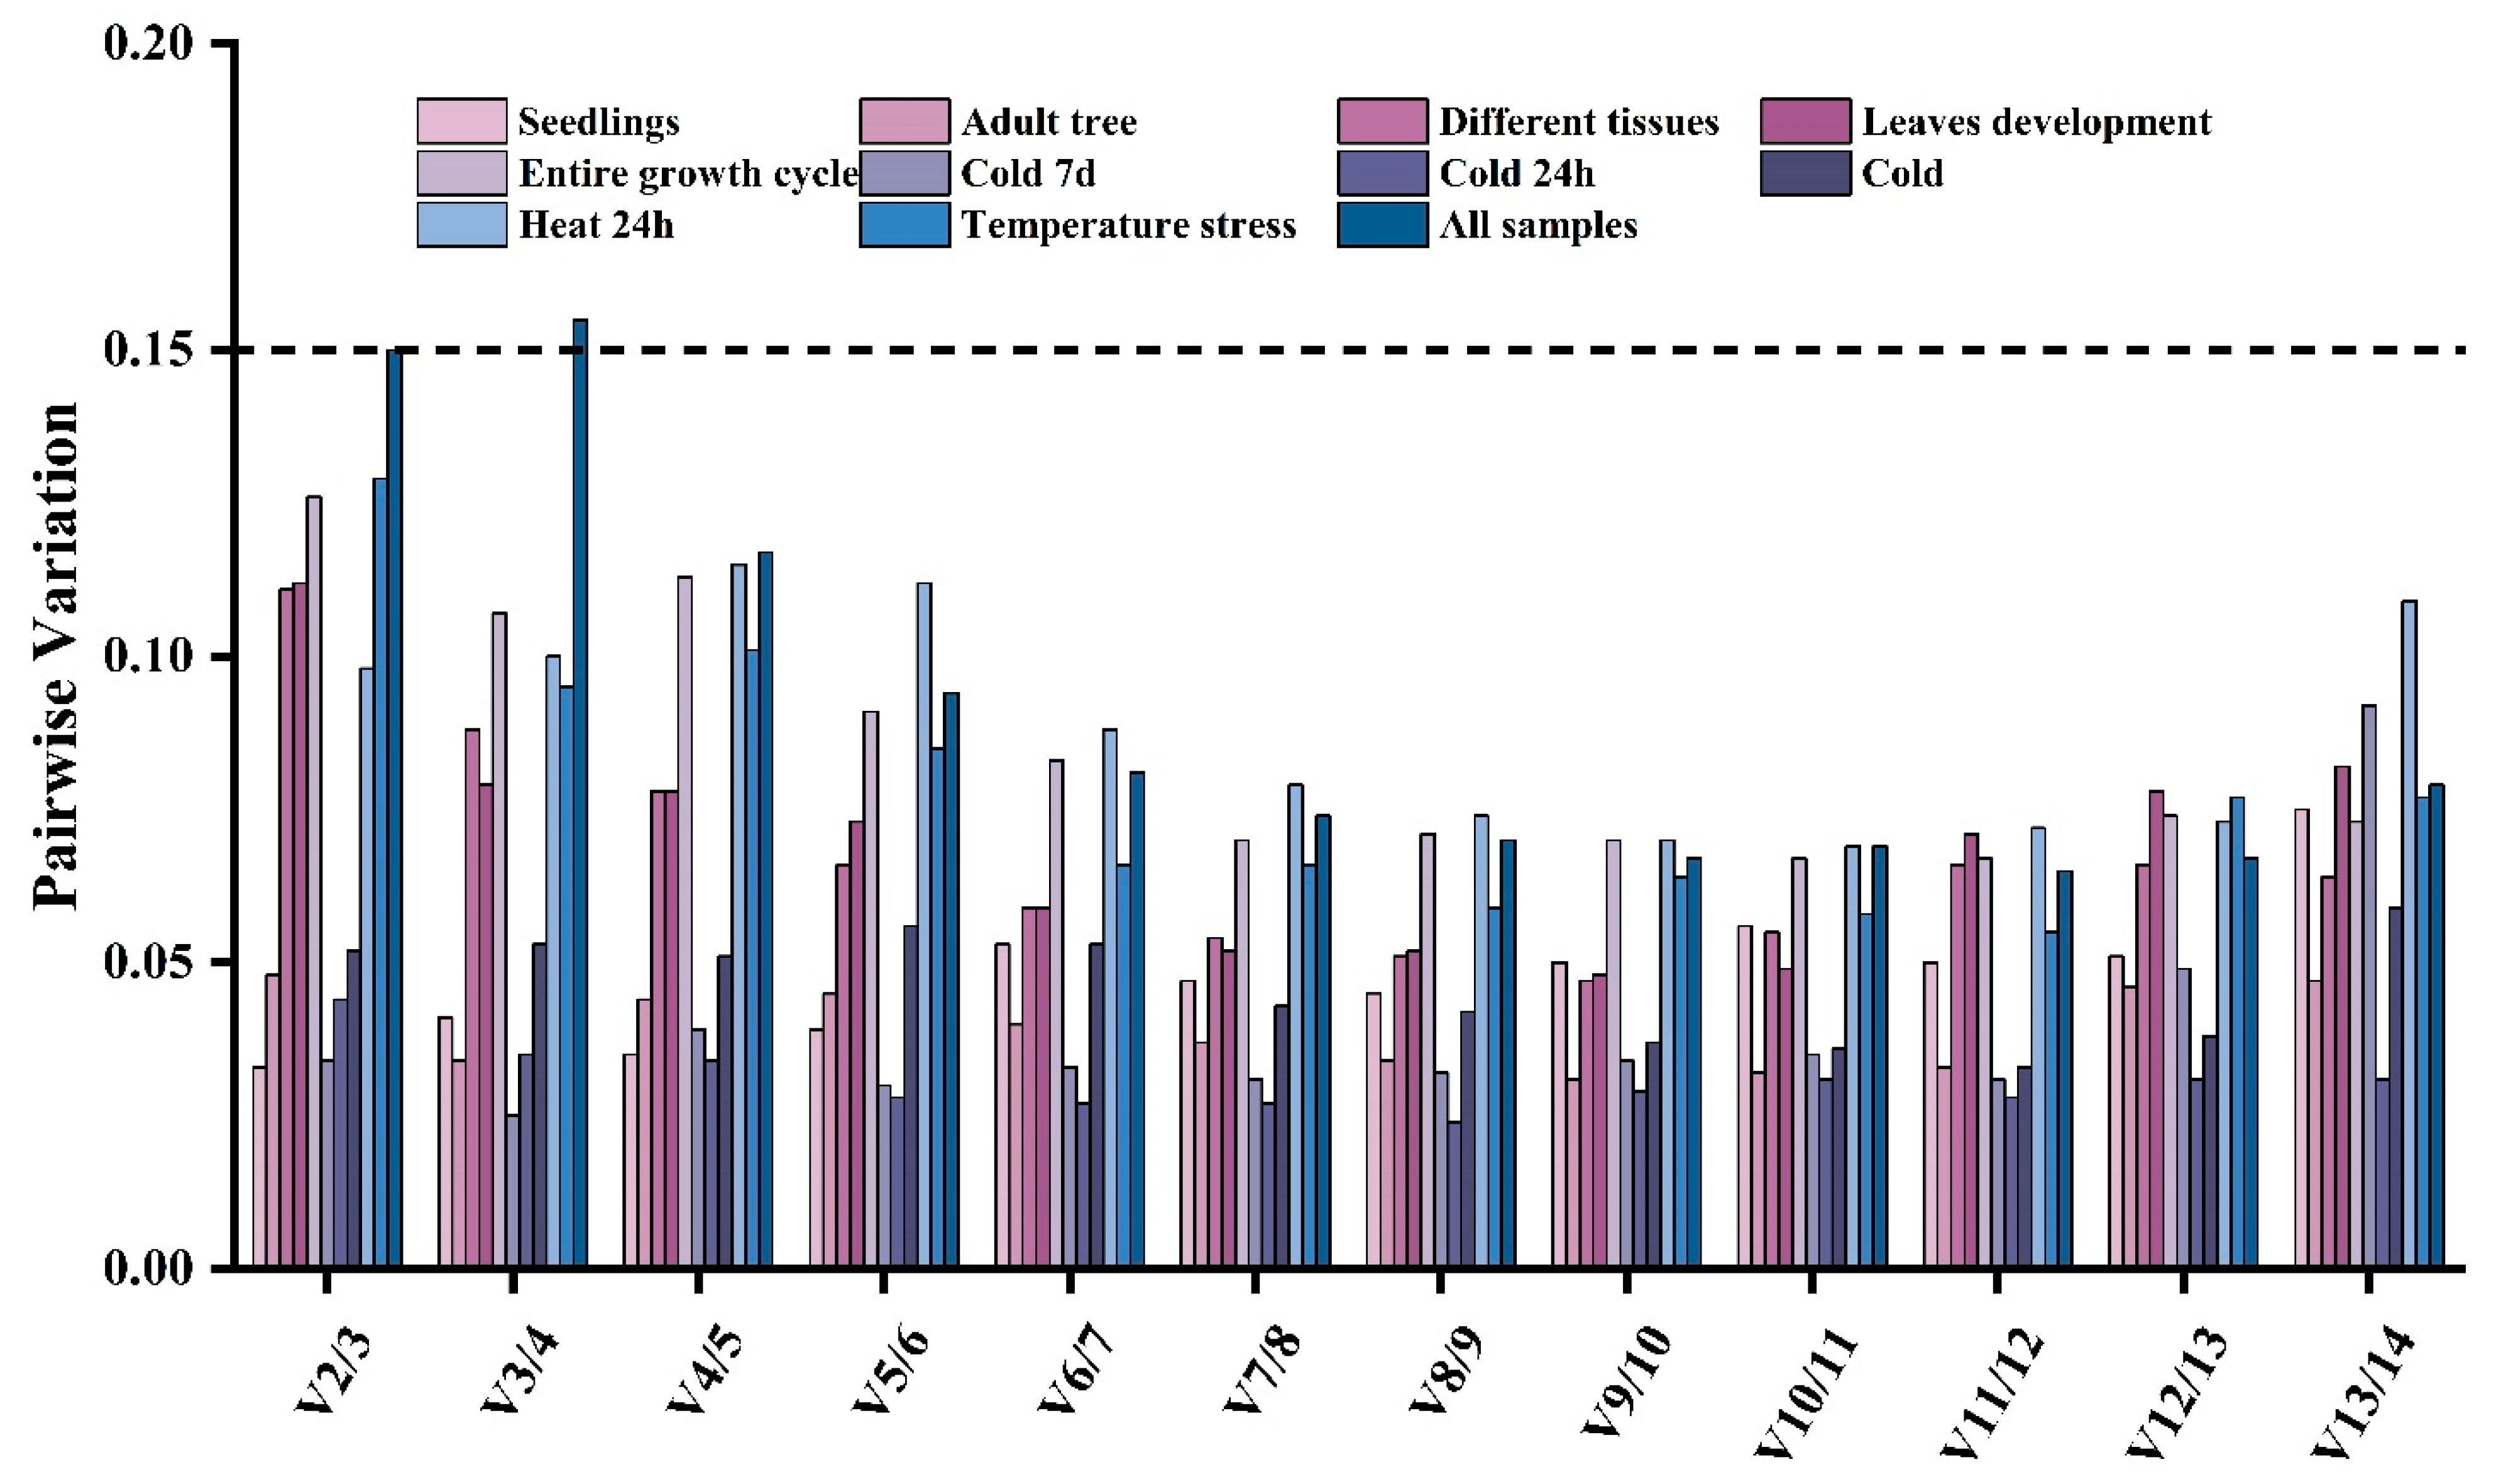
3.5. geNorm Analysis

The stability of the reference genes was ranked by calculating the average expression stability values (M value) using the geNorm program, taking into account only similar intergroup variation [35].
Genes with an M value less than 1.5 were considered stably expressed, with smaller M values indicating a more stable gene [28]. The geNorm analysis results for the 14 candidate genes in the different experimental sets are shown in Figure 3A–K. The M values of the 14 candidate reference genes were less than 1.5 under the different experimental conditions (Figure 3). EF2 and PAB2 had the highest stability in seedlings, with M values of 0.012 (Figure 3A), while CYP26-2 (0.076) and helicase-15 (0.076) were most stably expressed in the adult tree (Figure 3B). Between the different tissue sets, PAB2 and helicase15 were the optimal candidate genes, which is similar to the results in seedlings and adult trees (Figure 3C). The genes PAB2 and helicase-15 had the lowest stability values (0.285), which is consistent with the results of the ΔCt analysis. The two most stably expressed genes among the different leaf developmental stages were similar to those for the entire growth cycle, namely, UBC36 and UBC7 (Figure 3D,E). These results are also similar to those of the ΔCt analysis. UBC36 was more stable than the other candidate reference genes under the cold treatments (Figure 3F–H) and was the same regardless of whether the cold treatment lasted for 7 days or 24 h. GAPDH (0.269), CYP20-2 (0.269), and PPR (0.306) were more stable than the other candidate genes under heat treatment (Figure 3I). However, PPR and PAB2 (0.343) exhibited the strongest stability under temperature stress (Figure 3J). These results are consistent with the results of the ΔCt analysis. UBC36 and UBC7 (0.406) showed the strongest stability in all samples (Figure 3K). In contrast, TUA and PPR were the least stable across most sets.
Best practices include using multiple reference genes as internal controls for standardization to improve the accuracy of RT-qPCR data [28,49]. The number of optimal genes for standardization of the different datasets from L. megaphylla was calculated using the Vn/n+1 function of geNorm, with a threshold of 0.15 (Figure 4). Interestingly, the values of V2/3 were less than 0.15 for most experimental groups (0.033, 0.045, 0.111, 0.112, 0.126, 0.034, 0.044, 0.052, 0.098, and 0.129) except for the ‘all samples’ group, as shown in Figure 4. This suggested that two was the optimal number of reference genes for each type of samples. However, for the ‘all samples’ set, the V2/3 and V3/4 values were greater than 0.15, and it is not until four reference genes are used (V4/5 value of 0.117) that the values is less than 0.15. Thus, at least four genes are required to obtain accurate results across many tissues and treatments.

3.6. NormFinder Analysis

To further determine the reliability of the results obtained by the geNorm algorithm, the NormFinder application was used to evaluate both the intra- and inter-group variation to calculate the stability of the candidate reference genes, with lower values of inter- and intra-group variation corresponding to increased stability of the candidate gene [48]. The results of the NormFinder analysis are shown in Figure 5. UBC28 (0.055) and helicase-15 (0.138) were the most stable genes in seedlings, while UBC28 (0.063) and UBC7 (0.123) were the most stable genes in adult trees (Figure 5A,B). The best combination of reference genes for different tissues was helicase-15 (0.134) and ubiquinone (0.267) (Figure 5C). In the combined leaf developmental stages set, the optimal combination of candidate reference genes was UBC7 (0.190) and ACT7 (0.245), while over the entire growth cycle, the most stable candidate genes were ubiqunone (0.267) and UBC36 (0.295) (Figure 5D,E). TCTP (0.030) and ubiqunone (0.035) were the most stable genes under cold treatment for 7 d, while GAPDH (0.062) and UBC36 (0.088) were the most stable genes under cold treatment for 24 h (Figure 5F,G). Including both cold stress treatments, the candidate reference genes EF2 (0.168) and UBC36 (0.193) were the most stable (Figure 5H). Under heat treatment for 24 h, PAB2 (0.089) and CYP20-2 (0.414) were the most stable reference genes (Figure 5I). Under all temperature stresses, PAB2 (0.185) and EF2 (0.349) showed the highest stability (Figure 5J). The best combination of reference genes to compare all sample sets was ubiquinone (0.375), EF2 (0.408), PAB2 (0.413), and GAPDH (0.483) (Figure 5K). Notably, TUA and PPR were the least stable genes in most sets, similar to the results calculated by geNorm. In general, the results of the NormFinder analysis for the 14 candidate reference genes under different experimental conditions were similar to the results of the ΔCt and geNorm analyses.

3.7. BestKeeper Algorithm

The BestKeeper algorithm evaluates the most stable candidate reference genes based on the standard deviation (SD) and coefficient of variance (CV) of the average cycle threshold (Ct) values [16,19,32]. In general, the smaller the SD value is, the more stable the gene is. As shown in Table 3, the genes UBC7 (0.06 ± 0.24) and helicase-15 (0.14 ± 0.57) had the lowest SD values in seedlings, while GAPDH (0.09 ± 0.48) and TCTP (0.18 ± 0.83) were the most stable genes in adult trees. The genes with the most stable expression across different tissues were ACT7 (0.29 ± 1.36) and UBC28 (0.31 ± 1.40), while the expression of UBC28 (0.60 ± 2.76) and GAPDH (0.66 ± 3.24) was the most stable across different leaf developmental stages. The genes with the most stable expression across the entire growth cycle were UBC28 (0.58 ± 2.64) and TCTP (0.59 ± 2.73). Under cold treatment, PPR (0.18 ± 0.82) and EIF4A-3 (0.19 ± 0.91) were the most stable genes, while under heat treatment, UBC28 (0.22 ± 1.03) and ubiquinone (0.54 ± 2.35) were the most stable genes. Under both types of temperature stress, the expression of UBC28 (0.37 ± 1.70) and PPR (0.42 ± 1.86) were the most stable. For all samples, the top four most stable reference genes were UBC28 (0.51 ± 2.32), TCTP (0.56 ± 2.57), GAPDH (0.60 ± 2.98) and ubiquinone (0.64 ± 2.76), while TUA showed the highest value and thus the lowest expression stability.

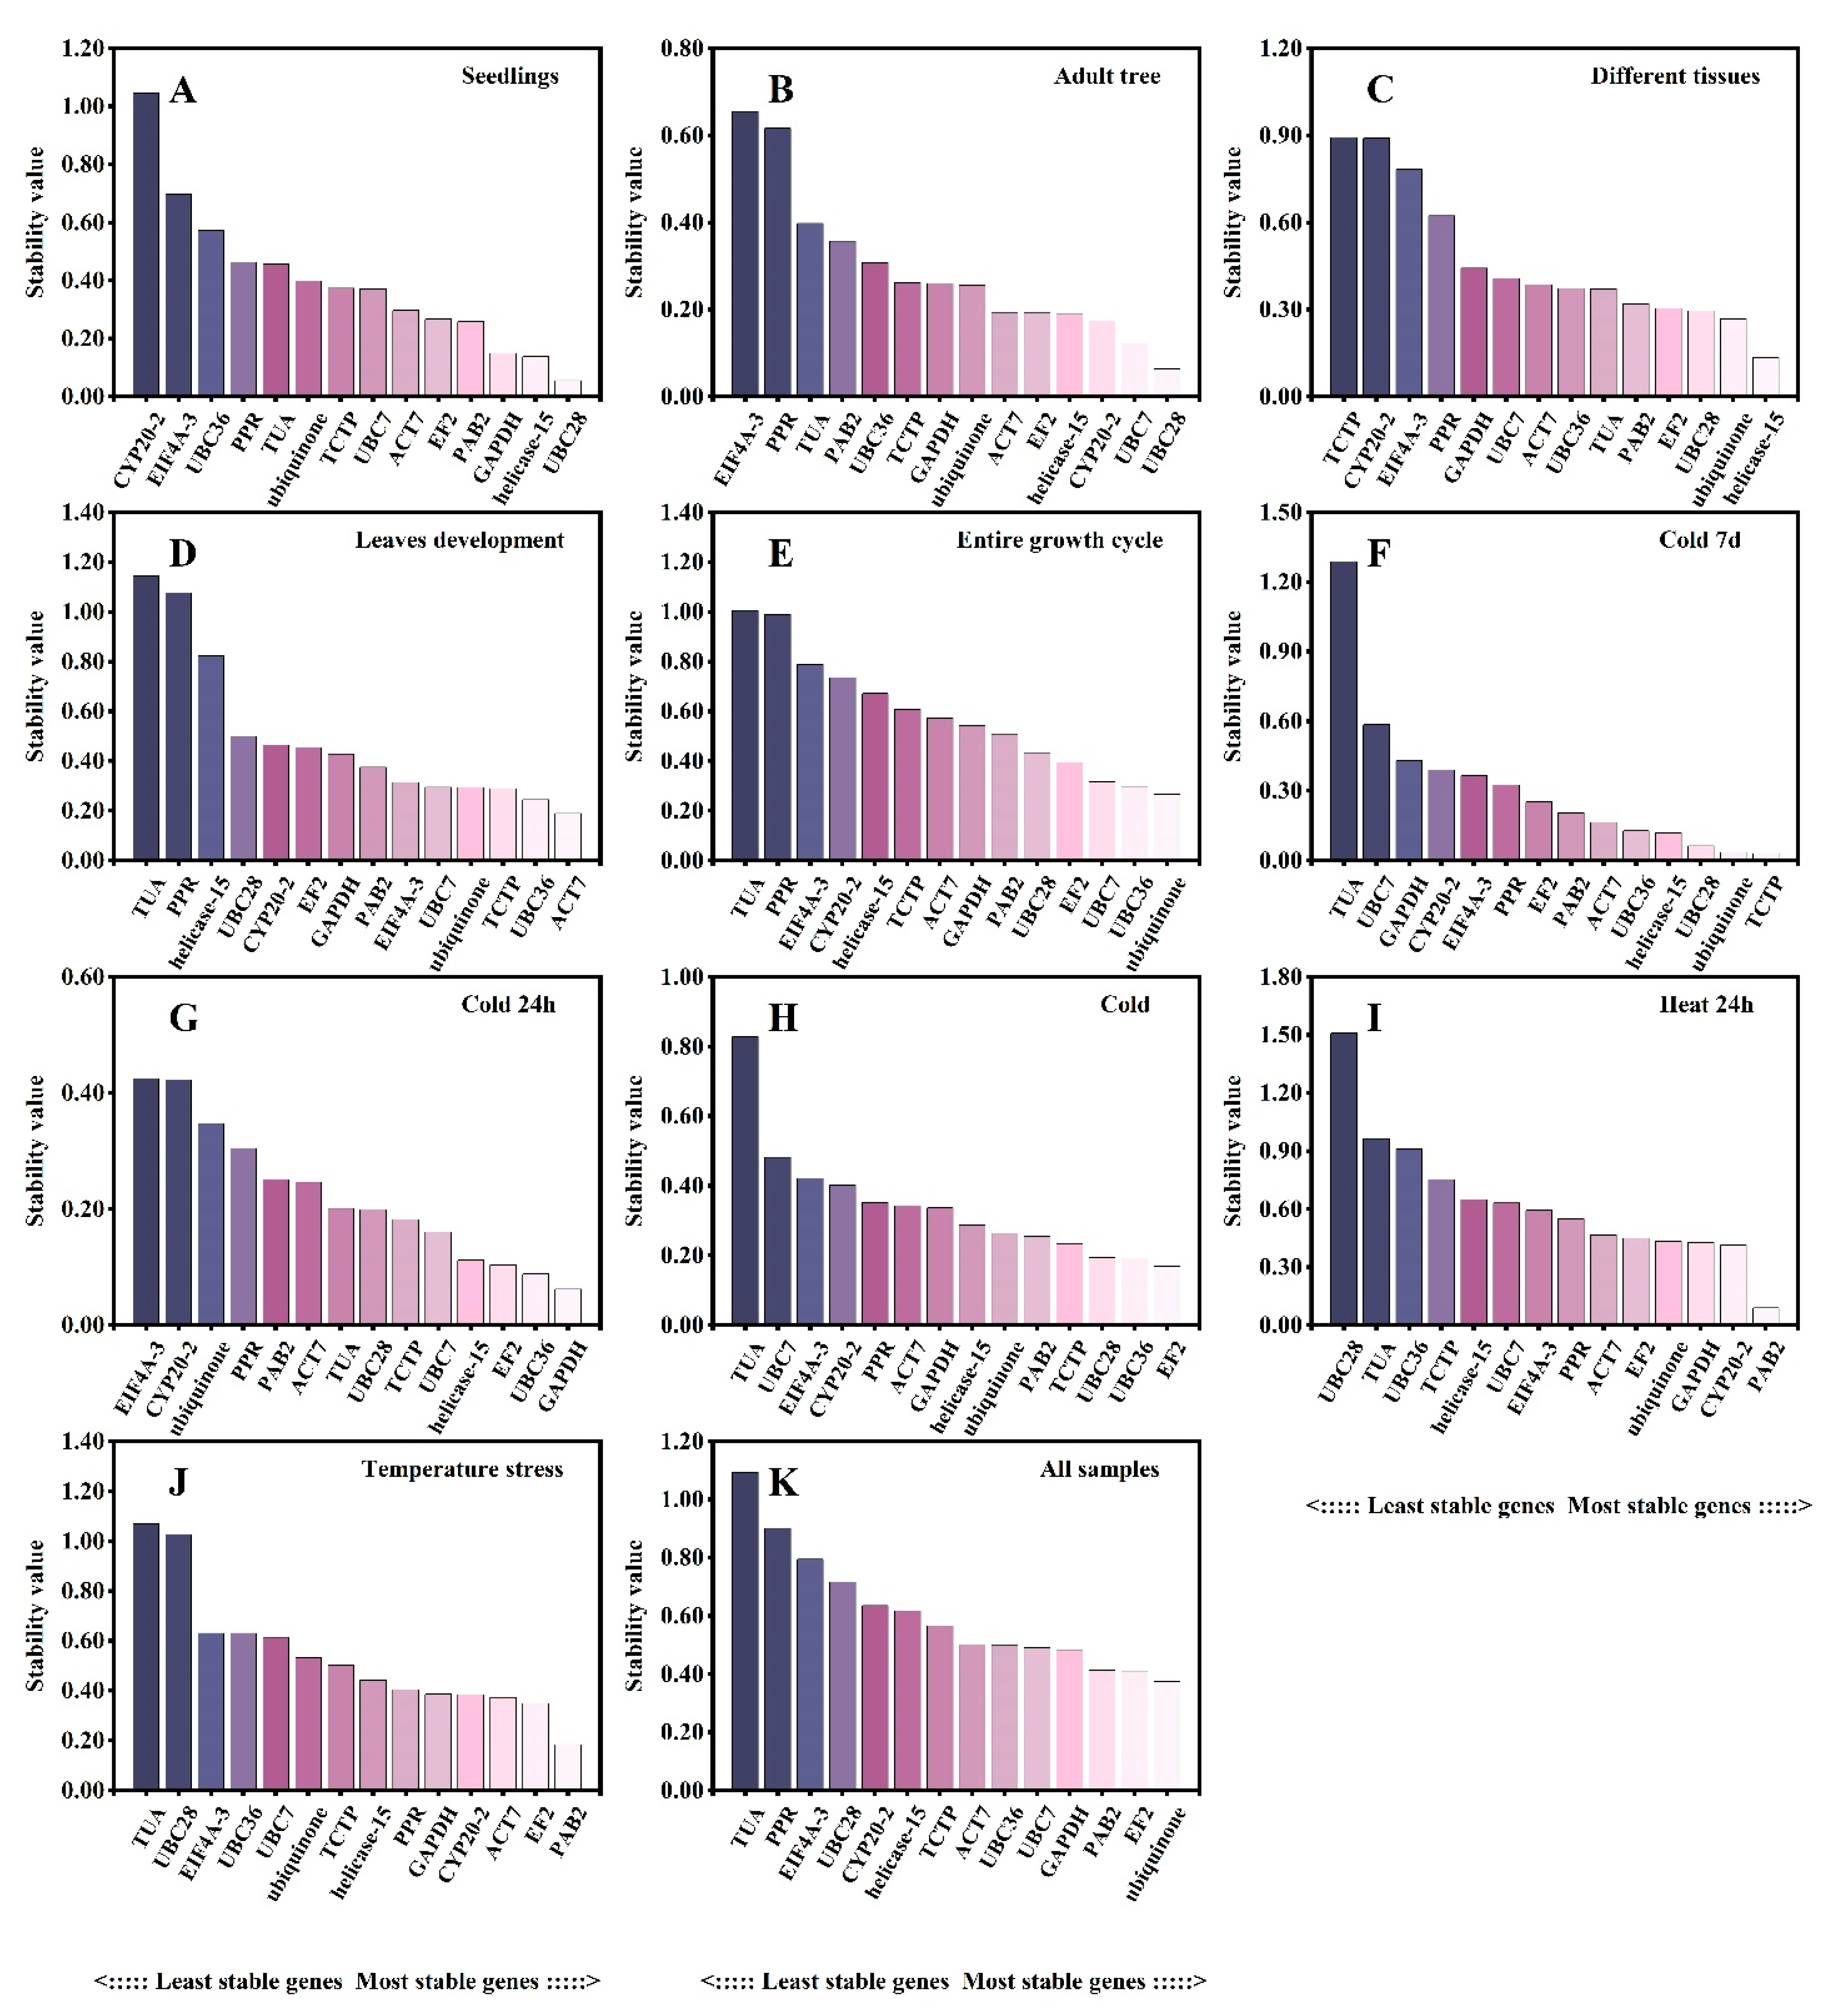
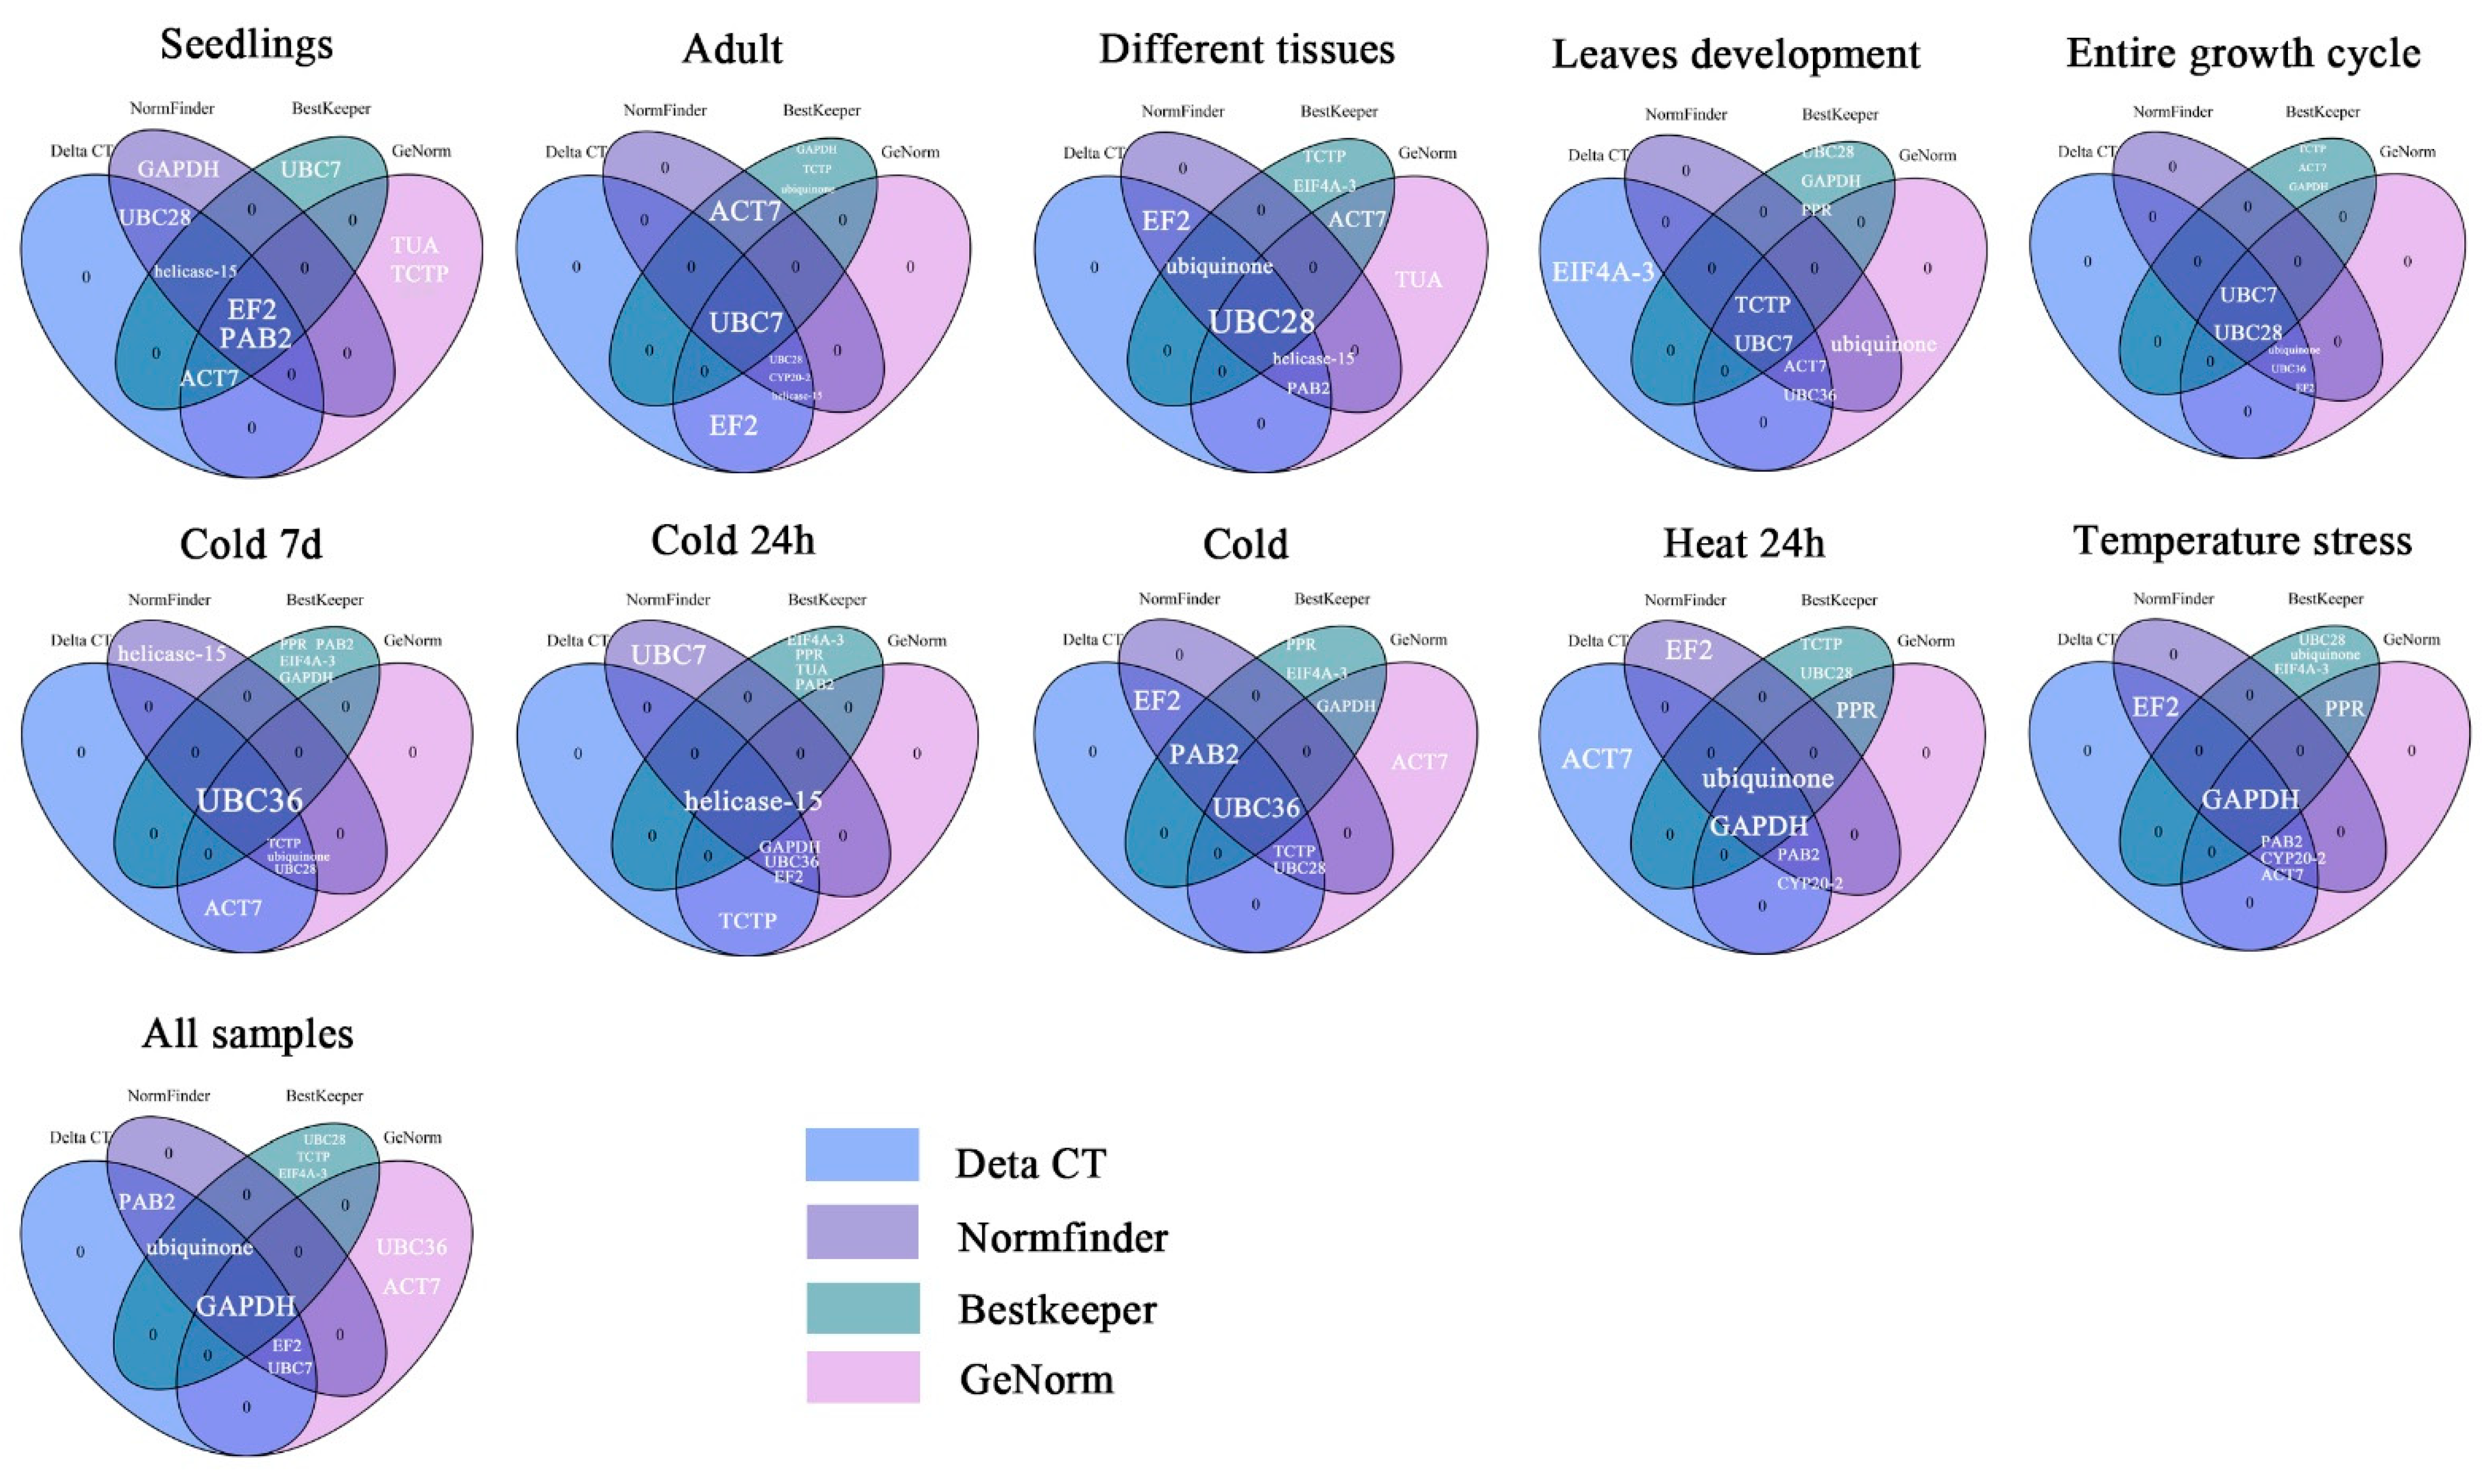
3.8. Comprehensive Stability Analysis Using RefFinder

Since the different algorithms determined different stability rankings for the candidate genes, the program RefFinder was used to calculate the geometric mean of the ranking results from the four methods [16]. The comprehensively ranked candidate genes (Table 4) did not present one or two universal reference genes for the normalization of gene expression data for all samples. However, the consensus for the top two genes in adult trees during leaf development, under cold treatment for 7 days or 24 h, and under heat treatment for 24 h was consistent with the results of the ΔCt and NormFinder analyses. The top two reference genes in seedlings or under temperature stress were consistent with the results of the ΔCt or geNorm analysis, respectively. In the other experimental conditions, the top two most stable genes in the overall ranking appeared in either the top two or top three positions in one of the other four algorithms. In addition, all analyses revealed that TUA was the most unstable gene. We then analyzed the top five most stable genes as determined using the ΔCt, geNorm, NormFinder, BestKeeper, and RefFinder algorithms (Figure 6). The top two most stable reference genes selected using RefFinder for the various experimental sets were ranked highly by three or four of the other software programs.

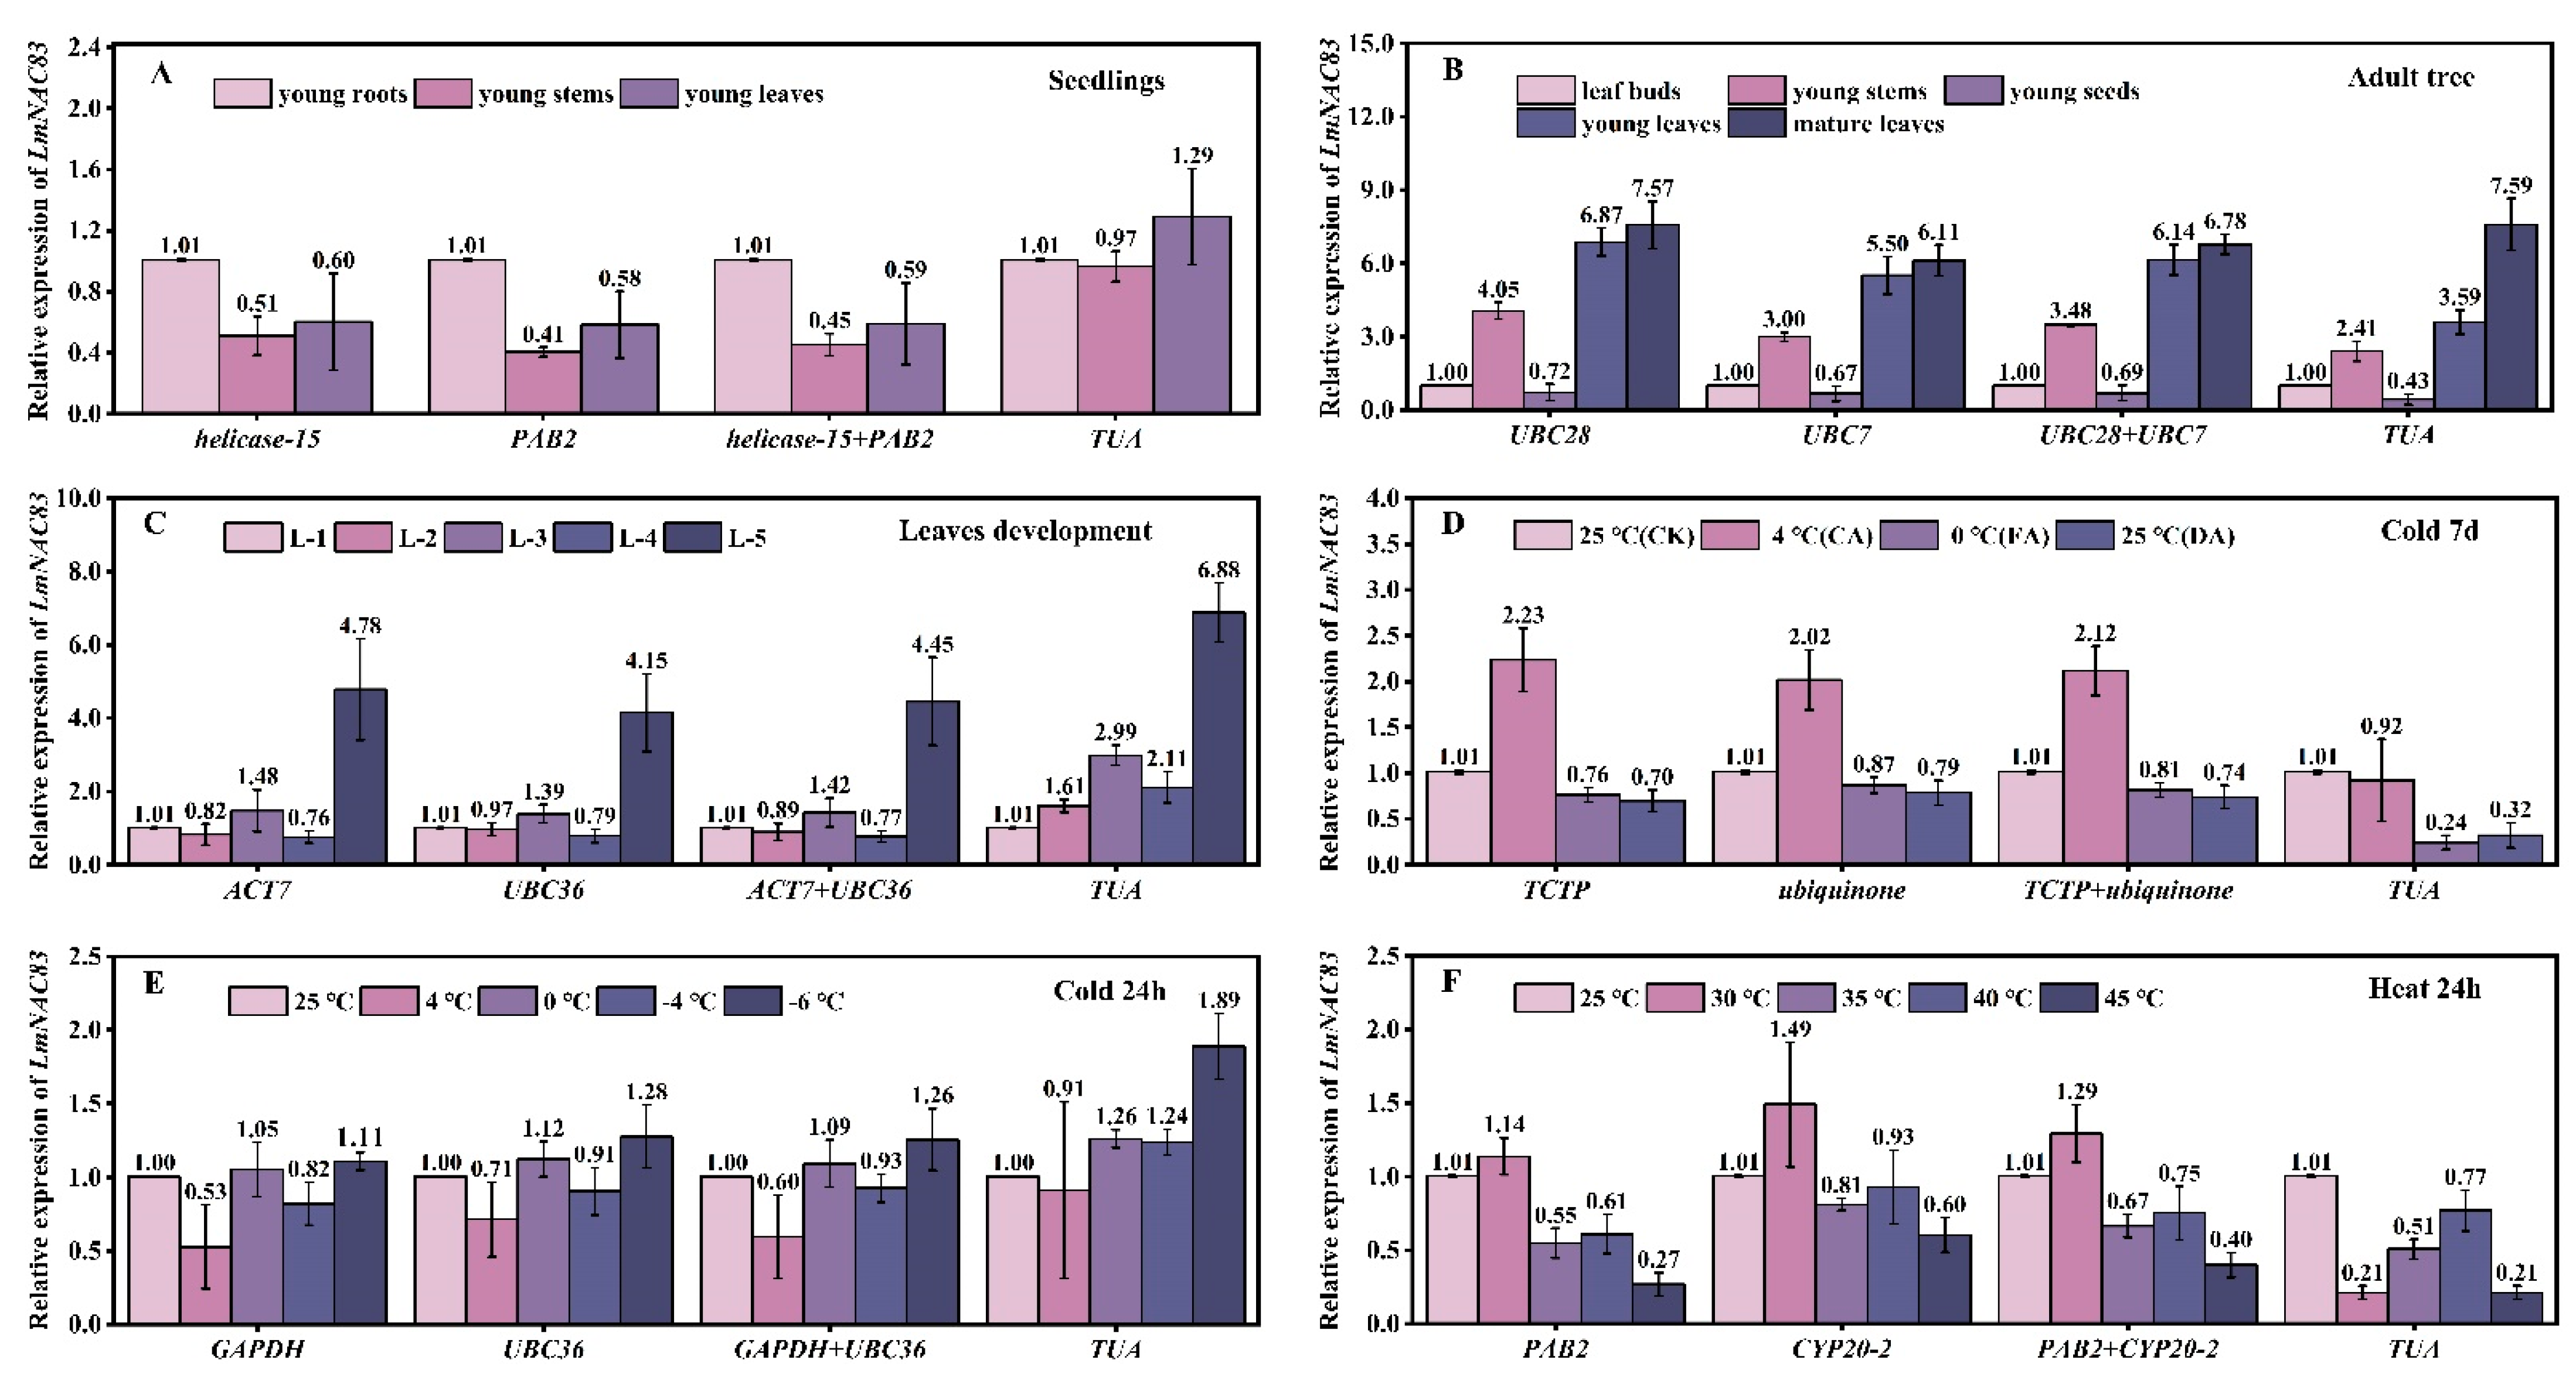
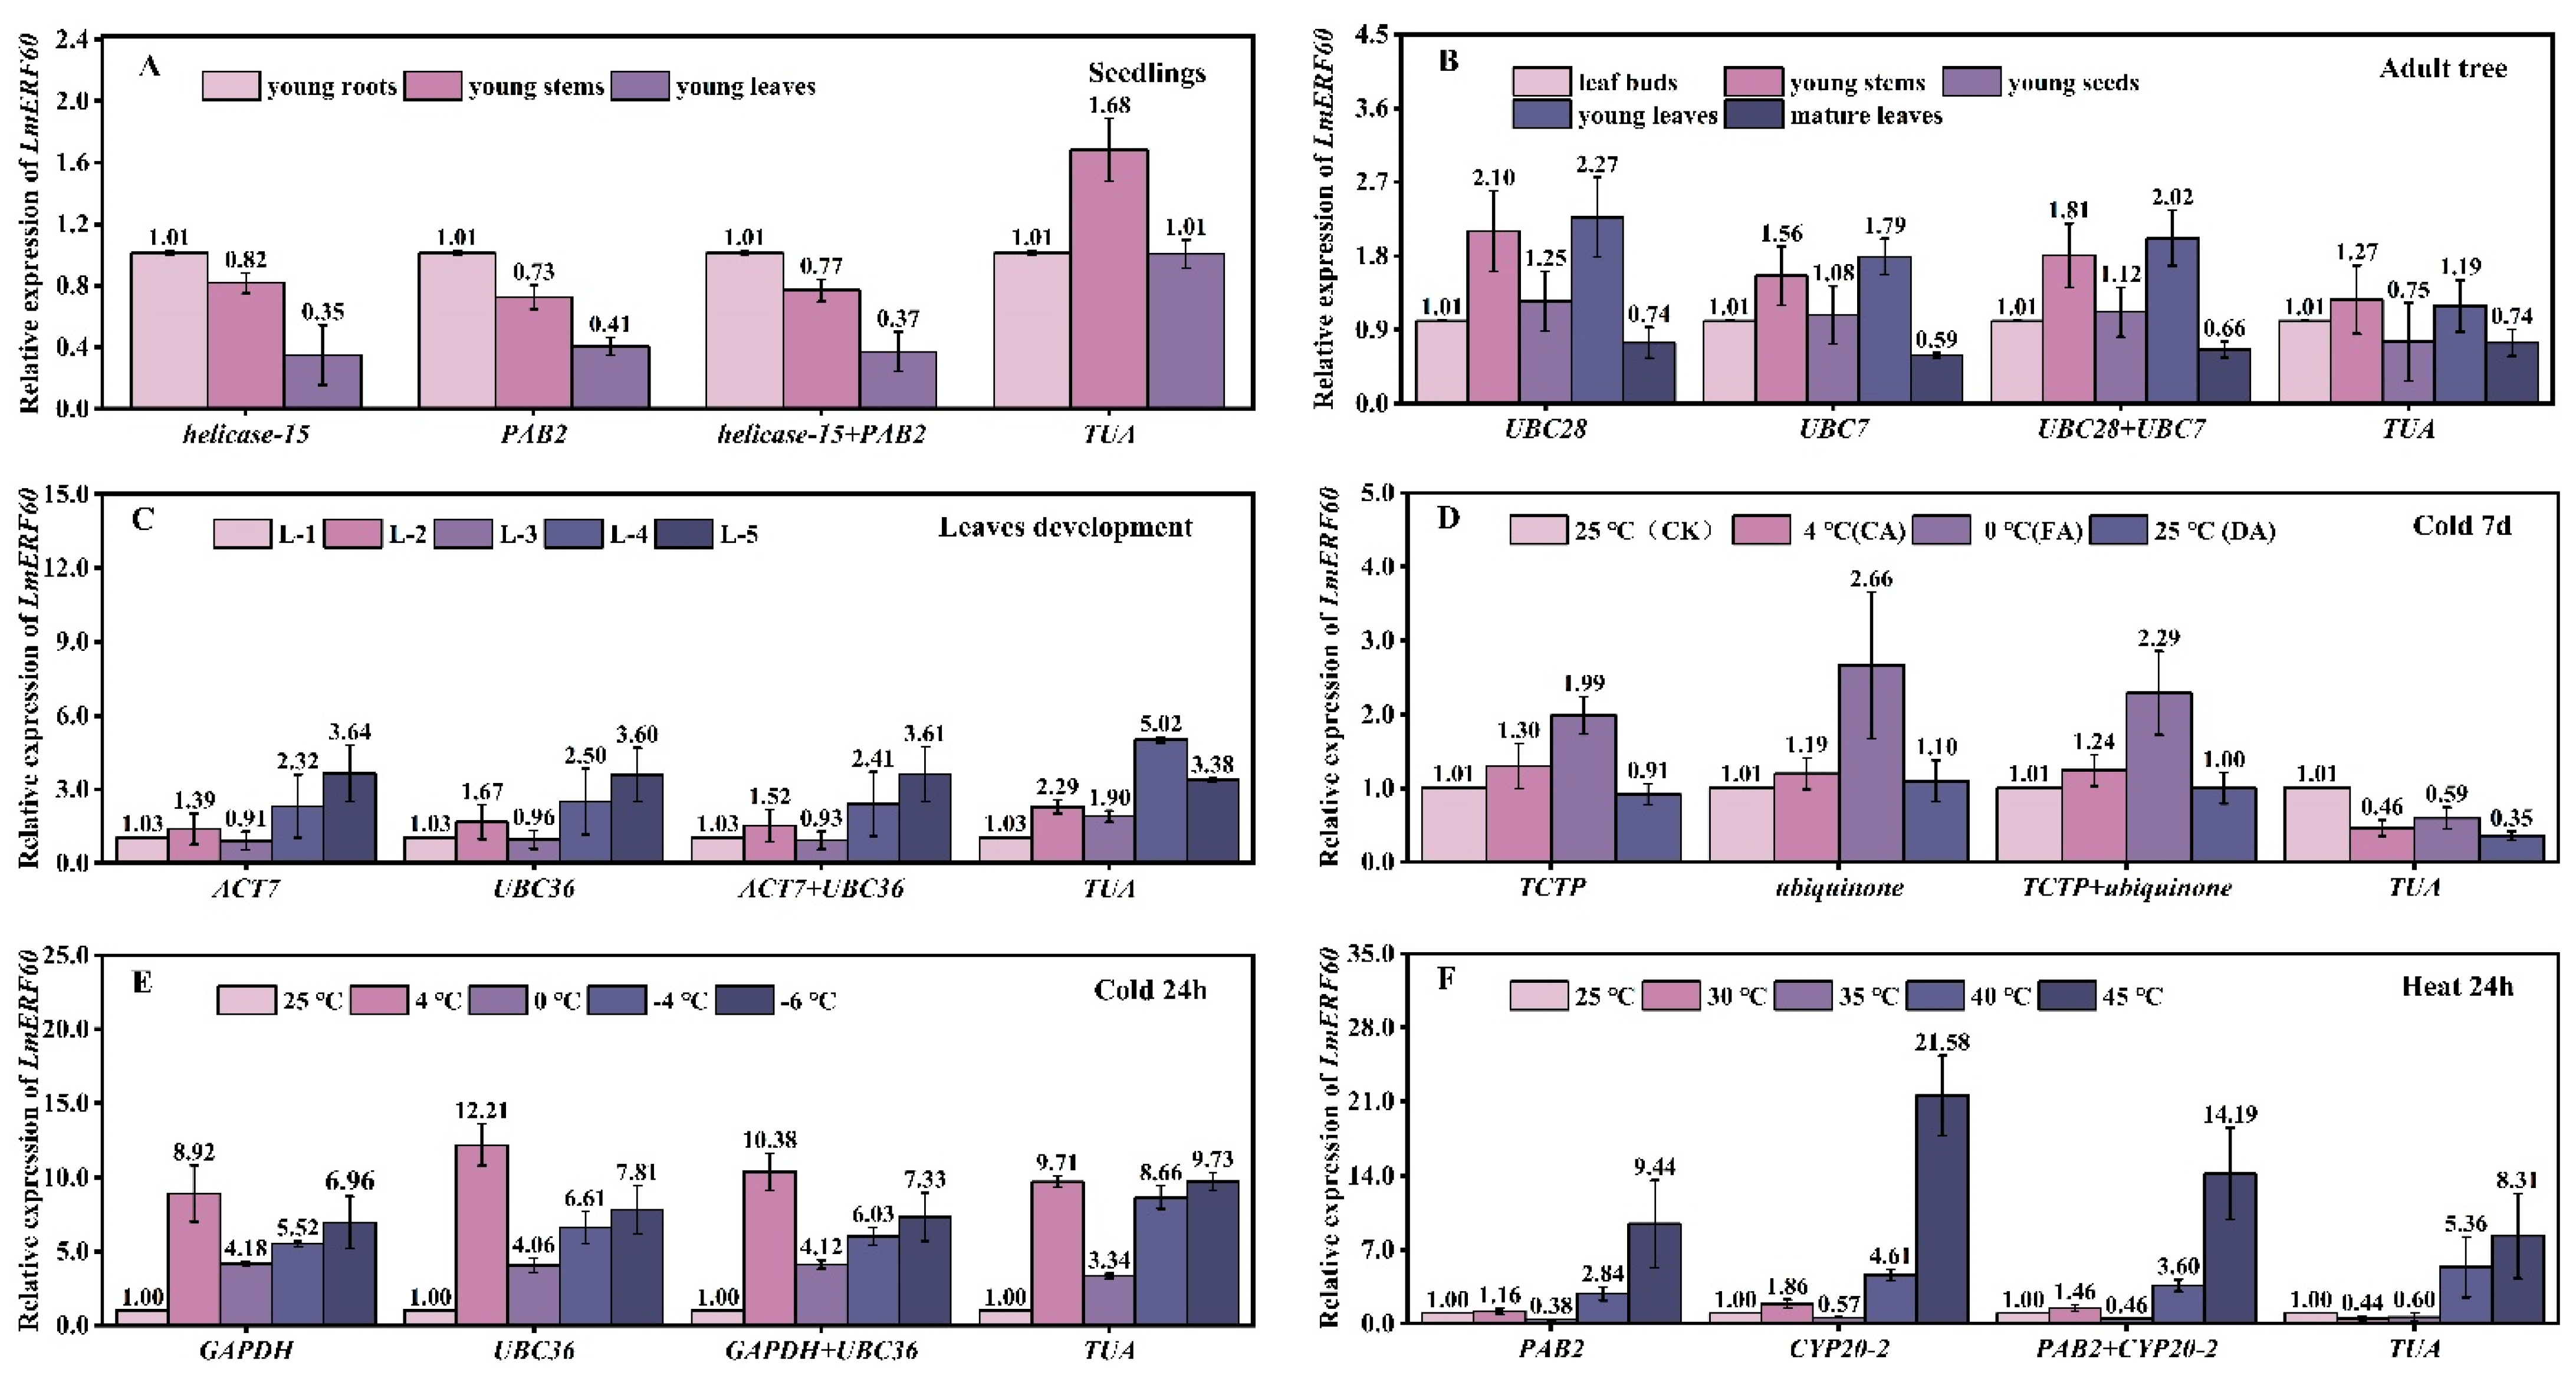
3.9. Validation of Reference Genes

To verify the reliability of the selected reference genes, the transcripts of two genes were quantified using either different combinations of the two most stable genes, using a single reference gene or using the relatively unstable reference gene TUA under six different experimental conditions. The test genes were NAC and ERF, both of which show relatively high abundance levels, with fragments per kilobase of transcript per million fragments mapped (FPKM) values of approximately 22–223. The relative expression patterns and levels of the LmNAC83 gene showed similar trends when the most stable genes were used alone or in combination as reference genes for standardization (Figure 7A–F). In contrast, the relative expression levels of LmNAC83 showed significant fluctuations when the relatively unstable gene TUA was used for relative quantification. For example, under heat treatment for 24 h, the expression levels of LmNAC83 in leaves was the highest at 30 °C when using the most stable genes as the reference genes. However, the relative expression of LmNAC83 was low when using the unstable gene (TUA) as the reference gene (Figure 7F). In addition, the expression levels and trends of the LmERF60 gene (Figure 8) were very similar to those found in the analysis of LmNAC83. It is evident that the use of unstable internal reference genes for gene expression analysis in L. megaphylla can lead to unreliable results. This test illustrates the importance of screening stable internal reference genes under different experimental conditions.

4. Discussion

Changes in plant secondary metabolism are closely related to the transcriptional activities of key genes, and gene expression analysis is a key technique for understanding the mechanisms involved in these processes [32,49]. RT-qPCR is the most accurate technique to obtain gene expression profiles that relate to biological function and regulatory networks [50,51,52]. However, the accuracy of RT-qPCR results mainly depends on using optimal internal reference genes that are stably expressed in samples across different experimental conditions. Reference genes are crucial for normalization of gene expression data and avoiding experimental errors by minimizing non-biological variation between different samples [24,33,35]. To ensure the accuracy of experiments, it is important to select suitable reference genes for each species that similar transcript levels under different experimental conditions.
Lindera megaphylla is an ecologically important and dominant broad-leaved evergreen tree species that is naturally distributed in the warm-temperate and subtropical zones of China [1]. This tree contributes to the seasonal landscape and produces volatile compounds with strong effects on bacteria and toxic gases. For example, the terpenes produced have a strong antibacterial effect [6,10,53]. L. megaphylla is also used as a medicinal plant [2]. However, few studies have focused on the molecular biology of L. megaphylla due to limited genomic information, and to date, no reference genes have been reported. In this study, we obtained transcriptome databases of different tissues of L. megaphylla and identified appropriate internal reference genes for use when studying the expression of genes. We initially used 40 internal reference genes from published model plants such as Arabidopsis thaliana and other species in the Lauraceae family to screen for constitutively expressed reference genes from the transcriptome database of L. megaphylla. We obtained 20 candidate genes based on an FPKM value > 50. As shown in Table 2, the final 14 candidate genes were selected based on their E-values in the range of 91.04–107.17% and R2 values in the range of 0.991–0.999, which indicated that the primer pairs for standardized evaluation by RT-qPCR had high sensitivity and accuracy. In addition, the average Ct values of the candidate genes ranged from 17.94 (PAB2) to 27.51 (UBC36), indicating different expression levels (Figure 1). The results obtained are similar to those of many previous studies, such as on Cryptomeria fortune [33], Gerbera hybrid [19], and Piper species [48]. The results indicate that none of the reference genes had constant expression levels under all tested experimental conditions or in different species. Thus, it is necessary to carefully select the most appropriate reference gene to ensure the accuracy of RT-qPCR analysis for specific conditions and with specific materials. In this study, we combined four statistical algorithms (ΔCt, geNorm, NormFinder, and BestKeeper) to assess the expression stability of 14 candidate genes (TUA, PPR, EIF4A-3, CYP26-2, helicase-15, TCTP, ACT7, PAB2, GAPDH, UBC28, EF2, UBC7, UBC36, and ubiquinone) in different tissues across 16 different leaf developmental stages, and under different temperature stresses. The results demonstrated that the optimal reference genes were not the same under different conditions (Table 4).
There were slight differences in the rankings of candidate reference genes between the different algorithms. However, analysis by the ΔCt and NormFinder algorithms consistently identified the most stable or unstable candidate reference genes for most experimental sets, while in a few experimental groups, the expression patterns of similar genes were the most or least stable in geNorm and NormFinder. The ranking of candidate genes by BestKeeper suggested some differences compared to the other algorithms. For example, for different leaf developmental stages, the ΔCt and NormFinder platforms indicated that the ACT7 and UBC36 genes were the most stable. geNorm placed these genes in fourth and first place, while the BestKeeper program placed these genes in sixth and seventh place. Although the rankings of candidate genes produced by the different algorithms were slightly different, the top five stable candidate genes selected by the algorithms were similar for each group of experimental conditions (Table 3). For instance, ACT7, UBC36, TCTP, UBC7, and ubiquinone were the top five most stable genes based on the geNorm and NormFinder analyses across the leaf development stages, and the ΔCt analysis showed similar results, except for ubiquinone. BestKeeper analysis identified two stable genes: UBC7 and TCTP. Numerous other studies have found similar differences between the outputs of geNorm and NormFinder [32,54], and many studies also demonstrated that these subtle differences result from the use of different algorithm models [33,34,55].
To comprehensively synthesize the results of the four algorithms, RefFinder was utilized to rank the identified candidate genes in L. megaphylla. This analysis plays an important role in integrating the screening results of reference genes from other algorithms by assigning an appropriate weight to each gene and calculating the geometric mean of its weights to produce a final ranking [32,34,35]. Fortunately, we found that the results from RefFinder were similar to those of the different algorithms in each experimental set, proving that RefFinder can assess and screen the optimal reference genes [56], as shown in Figure 6 and Table 4.
The results also indicate that we screened and identified the optimal reference gene combinations for use in L. megaphylla samples generated under different experimental conditions. To compare expression in different seedling tissues, helicase-15 and PAB2 were the most suitable, whereas UBC28 and UBC7 were most stably expressed in different adult trees tissues. When two different groups of tissues were analyzed, helicase-15 and UBC28 emerged as the most stable gene combination. For different leaf developmental stages, ACT7 and UBC36 were best, whereas ubiquinone and UBC7 were best when analyzing samples over the entire growth cycle. Interestingly, for cold stress of 7 days and 24 h, the optimal reference genes were TCTP + ubiquinone and GAPDH + UBC36, respectively. For heat treatment, the best reference genes were PAB2 and CYP20-2, while for overall temperature stress, PAB2 and PPR were most stable. When all samples were tested, ubiquinone, EF2, UBC7, and GAPDH were the optimal candidate reference genes overall for the normalization of gene expression in L. megaphylla (Table 4). These analyses are sufficient to demonstrate the necessity of screening suitable internal reference genes under different experimental conditions for each species.
With increasing demand for accurate scientific data, it has become important to screen for the best internal reference genes in a greater number of plant species and for different experimental treatments [19,32,49]. Some housekeeping genes involved in cytoskeleton structure or primary metabolism, including ACT, TUA, and EIF4α, are extensively used as reference genes in many plant species. For example, ACT2/7 and TUA are the three most stable genes across different developmental stages of Glycine max [57]. AhyACT, AhyMDH, and AhyEF-1a are the most stable genes in different tissues of amaranth [56]. Research on bamboo revealed that eIF4α was most stable in different organs, while CYP, eEF1α, and UBQ5 were found to be the optimal reference genes for different developmental stages of Bambusa tulda [18]. In Litsea cubeba, F-BOX, EF1α, and EIF4α were the most stable reference genes across different tissues and developmental stages [40]. In the present study, TUA was the least stable candidate gene in L. megaphylla, as calculated by the different programs, while the best combinations of genes were helicase-15 + UBC28 and ACT7 + UBC36 in different tissues and developmental stages.
Zhong et al. [24] found that ACT was stably expressed in high-temperature-stressed Psoralea corylifolia. Chen et al. [22] indicated that EF-1α was the most stably expressed and suitable reference gene under heat and cold treatments. In this study, PAB2 + CYP20-2 and UBC36 +TCTP were identified as the most stable reference genes under heat and cold treatments, respectively. The experimental results once again show the importance of screening the best reference genes under different experimental conditions for different species.

5. Conclusions

helicase-15 and UBC28 can be used as internal reference genes when detecting gene expression pattern in different tissues of L. megaphylla. ACT7 and UBC36 were considered to be the most suitable internal reference genes at different leaf developmental stages of L. megaphylla. UBC36, TCTP, PAB2, and CYP20 were optimum reference genes when L. megaphylla was suffering from abiotic stress. Among them, UBC36 and TCTP were the best under cold treatment, while PAB2 and CYP20-2 were the best under heat treatment. We recommend that two internal reference genes be used to normalize RT-qPCR data in future experiments. In short, our results lay a foundation for future molecular biology research on L. megaphylla.

Supplementary Materials

The following supporting information can be downloaded at: https://www.mdpi.com/article/10.3390/plants12112185/s1, Figure S1: The PCR products electrophoresis result of the 20 candidate reference genes; Figure S2: Melting curves of the 20 candidate reference genes in L. megaphylla. Table S1: The cDNA sequences of the 20 candidate reference genes from L. megaphylla; Table S2: Primer sequences of candidate reference genes in L. megaphylla.

Author Contributions

H.L. and Y.L. conceived and designed the research; H.L., J.L. (Jing Liu), P.C., X.Z. and K.W. conducted the experiments; H.L. drafted the manuscript; Y.L., P.C. and J.L. (Jiuxing Lu) revised the manuscript. All authors have read and agreed to the published version of the manuscript.

Funding

The research was supported by the National Natural Science Foundation of China (no. 32201615), the Science and Technology Invigorating Forestry Foundation of He’nan Province (no. YLK202211), and the Key Technology R&D Program of He’nan Province (No. 232102111106).

Data Availability Statement

All data needed to evaluate the conclusions in this paper are present in the paper and/or the Supplementary Materials.

Acknowledgments

We thank the anonymous reviewers for their comments. The authors specifically thank Anita K. Snyder for language editing; their efforts greatly improved the manuscript. We also thank Ruimin Li for revising the manuscript.

Conflicts of Interest

The authors declare no conflict of interest.

References

  1. Jiang, K.; Wang, Z.W.; Huang, W.C.; Hu, Y.H. Characterization of two complete chloroplast genomes of Lindera megaphylla (Lauraceae). Mitochondrial DNA B Resour. 2019, 4, 2851–2852. [Google Scholar] [CrossRef] [PubMed]
  2. Cao, Y.; Xuan, B.; Peng, B.; Li, C.; Chai, X.; Tu, P. The genus Lindera: A source of structurally diverse molecules having pharmacological significance. Phytochem. Rev. 2015, 15, 869–906. [Google Scholar] [CrossRef]
  3. Lin, H.F.; Huang, H.L.; Liao, J.F.; Shen, C.C.; Huang, R.L. Dicentrine analogue-induced G2/M arrest and apoptosis through inhibition of topoisomerase II activity in human cancer cells. Planta Med. 2015, 81, 830–837. [Google Scholar] [CrossRef] [PubMed]
  4. Huang, R.L.; Chen, C.C.; Huang, Y.L.; Ou, J.C.; Hu, C.P.; Chen, C.F.; Chang, C. Anti-tumor effects of d-dicentrine from the root of Lindera megaphylla. Planta Med. 1998, 64, 212–215. [Google Scholar] [CrossRef] [PubMed]
  5. Chou, C.J.; Lin, L.C.; Chen, K.T.; Chen, C.F. Northalifoline, a new isoquinolone alkaloid from the pedicels of Lindera megaphylla. J. Nat. Prod. 1994, 57, 689–694. [Google Scholar] [CrossRef]
  6. Wei, S. Effects of Three Plant Volatiles on Negative Air Ions and Air Microorganisms. Master’s Thesis, Zhejiang A&F University, Hangzhou, China, 2021. [Google Scholar] [CrossRef]
  7. Dong, J.; Zhu, S.; Zhao, H.; Wang, J. The research progress on Lindera megaphylla. J. Henan For. Sci. Technol. 2021, 41, 12–15. [Google Scholar]
  8. Wu, X.; Yuan, J.; Zhou, M.; Ding, Y.; Liu, M. Research on the overwintering survival of Lindera megaphylla in central China. Anhui Agric. Sci. Bull. 2017, 23, 106–108. [Google Scholar] [CrossRef]
  9. Yang, J.; Ning, L.; Yang, L.; Wang, J.; Qian, Y.; Chen, Y. Structural characteristics of Lindera megaphylla wood and its volatile organic compounds. J. Zhejiang AF Univ. 2018, 35, 927–934. [Google Scholar] [CrossRef]
  10. Bian, J.; Cheng, M.; Luo, S.; Chen, S.; Liu, S.; Bai, Z. GC/MS Analysis of volatile substances in essential oilof Lindera megaphylla blade and its application. J. Southwest Univ. (Nat. Sci. Ed.) 2014, 36, 82–88. [Google Scholar] [CrossRef]
  11. Ding, Q.; Zhang, Y.; Liu, G.; Xu, Z.; Fei, Y. Effects of water stress on photosynthesis characteristics of cinnamomum camphora and Lindera megaphylla Seedlings. J. Southwest For. Univ. 2015, 35, 14–20. [Google Scholar] [CrossRef]
  12. Teng, K.; Yang, Q.; Dai, G.; Ji, Y. The effect of low temperature stress on physiological and membrtine lipid peroxidatic reaction of Lindera megaphylla seedling. J. Henan Agric. Univ. 2002, 36, 151–154. [Google Scholar] [CrossRef]
  13. Zhang, L.; Zhang, Q.; Jiang, Y.; Li, Y.; Zhang, H.; Li, R. Reference genes identification for normalization of qPCR under multiple stresses in Hordeum brevisubulatum. Plant Methods 2018, 14, 110. [Google Scholar] [CrossRef]
  14. Lin, Y.; Zhang, A.; Yang, S.; Huang, L. Reference gene selection for real-time quantitative PCR normalization in Hemarthria compressa and Hemarthria altissima leaf tissue. Mol. Biol. Rep. 2019, 46, 4763–4769. [Google Scholar] [CrossRef] [PubMed]
  15. Fleige, S.; Pfaffl, M.W. RNA integrity and the effect on the real-time qRT-PCR performance. Mol. Asp. Med. 2006, 27, 126–139. [Google Scholar] [CrossRef] [PubMed]
  16. Song, H.; Mao, W.; Duan, Z.; Que, Q.; Zhou, W.; Chen, X.; Li, P. Selection and validation of reference genes for measuring gene expression in Toona ciliata under different experimental conditions by quantitative real-time PCR analysis. BMC Plant Biol. 2020, 20, 450. [Google Scholar] [CrossRef]
  17. Czechowski, T.; Stitt, M.; Altmann, T.; Udvardi, M.K.; Scheible, W.R. Genome-wide identification and testing of superior reference genes for transcript normalization in Arabidopsis. Plant Physiol. 2005, 139, 5–17. [Google Scholar] [CrossRef]
  18. Chakraborty, S.; Dutta, S.; Biswas, P.; Das, M. Identification of candidate reference genes in tropical bamboos stable across species, tissues, and developmental stages. Biol. Plant. 2019, 63, 253–261. [Google Scholar] [CrossRef]
  19. Li, F.; Cheng, Y.; Ma, L.; Li, S.; Wang, J. Identification of reference genes provides functional insights into meiotic recombination suppressors in Gerbera hybrida. Hortic. Plant J. 2022, 8, 123–132. [Google Scholar] [CrossRef]
  20. Qu, R.; Miao, Y.; Cui, Y.; Cao, Y.; Zhou, Y.; Tang, X.; Yang, J.; Wang, F. Selection of reference genes for the quantitative real-time PCR normalization of gene expression in Isatis indigotica fortune. BMC Mol. Biol. 2019, 20, 9. [Google Scholar] [CrossRef]
  21. Ragni, E.; Vigano, M.; Rebulla, P.; Giordano, R.; Lazzari, L. What is beyond a qRT-PCR study on mesenchymal stem cell differentiation properties: How to choose the most reliable housekeeping genes. J. Cell Mol. Med. 2013, 17, 168–180. [Google Scholar] [CrossRef]
  22. Chen, M.; Wang, B.; Li, Y.; Zeng, M.; Liu, J.; Ye, X.; Zhu, H.; Wen, Q. Reference gene selection for qRT-PCR analyses of luffa (Luffa cylindrica) plants under abiotic stress conditions. Sci. Rep. 2021, 11, 3161. [Google Scholar] [CrossRef]
  23. Umadevi, P.; Suraby, E.J.; Anandaraj, M.; Nepolean, T. Identification of stable reference gene for transcript normalization in black pepper-Phytophthora capsici pathosystem. Physiol. Mol. Biol. Plants 2019, 25, 945–952. [Google Scholar] [CrossRef] [PubMed]
  24. Zhong, Y.; Gai, Y.; Gao, J.; Nie, W.; Bao, Z.; Wang, W.; Xu, X.; Wu, J.; He, Y. Selection and validation of reference genes for quantitative real-time PCR normalization in Psoralea corylifolia (Babchi) under various abiotic stress. J. Plant Physiol. 2022, 274, 153722. [Google Scholar] [CrossRef] [PubMed]
  25. Sheng, Z.; Luan, Y.; Xu, C.; Tao, J.; Zhao, D. Selection of Stable Reference Genes for Quantitative Real-Time PCR on Herbaceous Peony (Paeonia lactiflora Pall.) in Response to Drought Stress. J. Oceanol. Limnol. 2023, 3, 801–814. [Google Scholar] [CrossRef]
  26. Yao, Y.; Wang, X.; Chen, B.; Zheng, S.; Wang-Pruski, G.; Chen, X.; Guo, R. Evaluation of Reference Genes Suitable for Gene Expression during Root Enlargement in Cherry Radish Based on Transcriptomic Data. Horticulturae 2023, 9, 20. [Google Scholar] [CrossRef]
  27. Silver, N.; Best, S.; Jiang, J.; Thein, S.L. Selection of housekeeping genes for gene expression studies in human reticulocytes using real-time PCR. BMC Mol. Biol. 2006, 7, 33. [Google Scholar] [CrossRef]
  28. Vandesompele, J.; De Preter, K.; Pattyn, F.; Poppe, B.; Van Roy, N.; De Paepe, A.; Speleman, F. Accurate normalization of real-time quantitative RT-PCR data by geometric averaging of multiple internal control genes. Genome Biol. 2002, 3, research0034.1. [Google Scholar] [CrossRef]
  29. Andersen, C.L.; Jensen, J.L.; Orntoft, T.F. Normalization of real-time quantitative RT-PCR data: A model based variance estimation approach to identify genes suited for normalization applied to bladder and colon cancer data sets. Cancer Res. 2004, 64, 5245–5250. [Google Scholar] [CrossRef]
  30. Pfaffl, M.W.; Tichopad, A.; Prgomet, C.; Neuvians, T.P. Determination of stable housekeeping genes, differentially regulated target genes and sample integrity: BestKeeper—Excelbased tool using pair-wise correlations. Biotechnol. Lett. 2004, 26, 509–515. [Google Scholar] [CrossRef]
  31. Xie, F.; Xiao, P.; Chen, D.; Xu, L.; Zhang, B. miRDeepFinder: A miRNA analysis tool for deep sequencing of plant small RNAs. Plant Mol. Biol. 2012, 80, 75–84. [Google Scholar] [CrossRef]
  32. Dudziak, K.; Sozoniuk, M.; Szczerba, H.; Kuzdralinski, A.; Kowalczyk, K.; Borner, A.; Nowak, M. Identification of stable reference genes for qPCR studies in common wheat (Triticum aestivum L.) seedlings under short-term drought stress. Plant Methods 2020, 16, 58. [Google Scholar] [CrossRef] [PubMed]
  33. Zhang, Y.; Xue, J.; Zhu, L.; Hu, H.; Yang, J.; Cui, J.; Xu, J. Selection and optimization of reference genes for microRNA expression normalization by qRT-PCR in chinese cedar (Cryptomeria fortunei) under multiple stresses. Int. J. Mol. Sci. 2021, 22, 7246. [Google Scholar] [CrossRef] [PubMed]
  34. Zhang, Y.; Zhang, Z.; Ren, M.; Liu, X.; Zhou, X.; Yang, J. Selection of reference genes for RT-qPCR analysis in the hawthorn spider mite, amphitetranychus viennensis (Acarina: Tetranychidae), under acaricide treatments. J. Econ. Entomol. 2022, 115, 662–670. [Google Scholar] [CrossRef] [PubMed]
  35. Wu, Y.; Zhang, C.; Yang, H.; Lyu, L.; Li, W.; Wu, W. Selection and validation of candidate reference genes for gene expression analysis by RT-qPCR in rubus. Int. J. Mol. Sci. 2021, 22, 10533. [Google Scholar] [CrossRef] [PubMed]
  36. Chen, X.; Chen, H.; Yuan, J.S.; Kollner, T.G.; Chen, Y.; Guo, Y.; Zhuang, X.; Chen, X.; Zhang, Y.; Fu, J.; et al. The rice terpene synthase gene OsTPS19 functions as an (S)-limonene synthase in planta, and its overexpression leads to enhanced resistance to the blast fungus Magnaporthe oryzae. Plant Biotechnol. J. 2018, 16, 1778–1787. [Google Scholar] [CrossRef]
  37. Qi, C.; Jiang, H.; Zhao, X.; Mao, K.; Liu, H.; Li, Y.; Hao, Y. The characterization, authentication, and gene expression pattern of the mdcer family in malus domestica. Hortic. Plant J. 2019, 5, 1–9. [Google Scholar] [CrossRef]
  38. Mergaert, P.; Kereszt, A.; Kondorosi, E. Gene expression in nitrogen-fixing symbiotic nodule cells in Medicago truncatula and other nodulating plants. Plant Cell 2020, 32, 42–68. [Google Scholar] [CrossRef]
  39. Kiseleva, A.A.; Bragina, M.K.; Muterko, A.F.; Salina, E.A. Functional characterization of genes with daily expression patterns in common wheat. Plant Mol. Biol. 2022, 109, 135–146. [Google Scholar] [CrossRef]
  40. Lin, L.; Han, X.; Chen, Y.; Wu, Q.; Wang, Y. Identification of appropriate reference genes for normalizing transcript expression by quantitative real-time PCR in Litsea cubeba. Mol. Genet. Genom. 2013, 288, 727–737. [Google Scholar] [CrossRef]
  41. Zhao, M.; Jin, J.; Gao, T.; Zhang, N.; Jing, T.; Wang, J.; Ban, Q.; Schwab, W.; Song, C. Glucosyltransferase CsUGT78A14 regulates flavonols accumulation and reactive oxygen species scavenging in response to cold stress in Camellia sinensis. Front Plant Sci. 2019, 10, 1675. [Google Scholar] [CrossRef]
  42. Yang, N.; Liu, J.; Gao, Q.; Gui, S.; Chen, L.; Yang, L.; Huang, J.; Deng, T.; Luo, J.; He, L.; et al. Genome assembly of a tropical maize inbred line provides insights into structural variation and crop improvement. Nat. Genet. 2019, 51, 1052–1059. [Google Scholar] [CrossRef] [PubMed]
  43. Nicot, N.; Hausman, J.F.; Hoffmann, L.; Evers, D. Housekeeping gene selection for real-time RT-PCR normalization in potato during biotic and abiotic stress. J. Exp. Bot. 2005, 56, 2907–2914. [Google Scholar] [CrossRef] [PubMed]
  44. Hu, X.; Xie, F.; Liang, W.; Liang, Y.; Zhang, Z.; Zhao, J.; Hu, G.; Qin, Y. HuNAC20 and HuNAC25, two novel NAC genes from pitaya, confer cold tolerance in transgenic Arabidopsis. Int. J. Mol. Sci. 2022, 23, 2189. [Google Scholar] [CrossRef] [PubMed]
  45. Mijiti, M.; Wang, Y.; Wang, L.; Habuding, X. Tamarix hispida NAC transcription factor ThNAC4 confers salt and drought stress tolerance to transgenic Tamarix and Arabidopsis. Plants 2022, 11, 2647. [Google Scholar] [CrossRef]
  46. Srivastava, R.; Kobayashi, Y.; Koyama, H.; Sahoo, L. Cowpea NAC1/NAC2 transcription factors improve growth and tolerance to drought and heat in transgenic cowpea through combined activation of photosynthetic and antioxidant mechanisms. J. Integr. Plant Biol. 2022, 65, 25–44. [Google Scholar] [CrossRef]
  47. Yu, Y.; Yu, M.; Zhang, S.; Song, T.; Zhang, M.; Zhou, H.; Wang, Y.; Xiang, J.; Zhang, X. Transcriptomic identification of wheat AP2/ERF transcription factors and functional characterization of TaERF-6-3A in response to drought and salinity stresses. Int. J. Mol. Sci. 2022, 23, 3272. [Google Scholar] [CrossRef]
  48. Huang, Y.; Liu, L.; Hu, H.; Tang, N.; Shi, L.; Xu, F.; Wang, S. Arabidopsis ERF012 is a versatile regulator of plant growth, development and abiotic stress responses. Int. J. Mol. Sci. 2022, 23, 6841. [Google Scholar] [CrossRef]
  49. De Oliveira, L.F.; Piovezani, A.R.; Ivanov, D.A.; Yoshida, L.; Segal Floh, E.I.S.; Kato, M.J. Selection and validation of reference genes for measuring gene expression in Piper species at different life stages using RT-qPCR analysis. Plant Physiol. Biochem. 2022, 171, 201–212. [Google Scholar] [CrossRef]
  50. Zhang, L.; Chen, F.; Zhang, X.; Li, Z.; Zhao, Y.; Lohaus, R.; Chang, X.; Dong, W.; Ho, S.Y.W.; Liu, X.; et al. The water lily genome the early evolution of flowering plants. Nature 2020, 577, 79–84. [Google Scholar] [CrossRef]
  51. Exelby, K.; Herrera-Delgado, E.; Perez, L.G.; Perez-Carrasco, R.; Sagner, A.; Metzis, V.; Sollich, P.; Briscoe, J. Precision of tissue patterning is controlled by dynamical properties of gene regulatory networks. Development 2021, 148, dev197566. [Google Scholar] [CrossRef] [PubMed]
  52. Pierandrei, S.; Truglio, G.; Ceci, F.; Del Porto, P.; Bruno, S.M.; Castellani, S.; Conese, M.; Ascenzioni, F.; Lucarelli, M. DNA methylation patterns correlate with the expression of SCNN1A, SCNN1B, and SCNN1G (Epithelial Sodium Channel, ENaC) genes. Int. J. Mol. Sci. 2021, 22, 3754. [Google Scholar] [CrossRef] [PubMed]
  53. Abbas, F.; Ke, Y.; Yu, R.; Yue, Y.; Amanullah, S.; Jahangir, M.M.; Fan, Y. Volatile terpenoids: Multiple functions, biosynthesis, modulation and manipulation by genetic engineering. Planta 2017, 246, 803–816. [Google Scholar] [CrossRef]
  54. Elbl, P.; Navarro, B.V.; de Oliveira, L.F.; Almeida, J.; Mosini, C.; dos Santos, A.L.W.; Rossi, M.; Floh, E.I.S. Identification and evaluation of reference genes for quantitative analysis of Brazilian pine (Araucaria angustifolia Bertol. Kuntze) gene expression. PLoS ONE 2015, 10, e0136714. [Google Scholar] [CrossRef] [PubMed]
  55. Khan, M.M.; Guo, C.F.; Peng, J.; Fan, Z.Y.; Hafeez, M.; Ali, D.; Wang, K.; Almarzoug, M.H.A.; Qiu, B.L. Screening and validation of reference genes using in RT-qPCR for gene expression studies in Paederus fuscipes, a medically and agriculturally important insect. J. King Saud Univ. Sci. 2022, 34, 101654. [Google Scholar] [CrossRef]
  56. Hernandez, F.P.V.; Nunez, M.M.; Rivas, M.R.; Portillo, R.E.V.; Martinez, M.D.B.; Suarez, S.L.; Cardenas, F.D.R. Reference genes for RT-qPCR normalisation in different tissues, developmental stages and stress conditions of amaranth. Plant Biol. 2018, 20, 713–721. [Google Scholar] [CrossRef] [PubMed]
  57. Jian, B.; Liu, B.; Bi, Y.; Hou, W.; Wu, C.; Han, T. Validation of internal control for gene expression study in soybean by quantitative real-time PCR. BMC Mol. Biol. 2008, 9, 59. [Google Scholar] [CrossRef]
Figure 1. Distribution of average cycle threshold (Ct) values of the 14 candidate reference genes across all 38 samples from L. megaphylla. Boxes represent the interquartile range, with the middle solid lines indicating the median Ct values. The upper and lower boundaries of each box represent the 75th and 25th percentiles, respectively. The upper and lower bars represent the maximum and minimum Ct values, respectively, and the small squares represent the average values.
Plants 12 02185 g001
Figure 2. Ranking of expression stability of the 14 candidate reference genes in L. megaphylla using ΔCt analysis. Genes are listed across bottom of each plot in order of increasing stability from left to right. Results from (A) different seedling tissues; (B) different adult tree tissues; (C) all seedling and adult tree tissues; (D) 16 leaf developmental stages; (E) entire growth cycle including all different seedlings and adult tree tissues as well as 16 leaf developmental stages; (F) cold treatment for 7 days; (G) cold treatment for 24 h; (H) cold treatments including 7 days and 24 h; (I) heat treatment for 24 h; (J) different temperature treatments including cold and heat; (K) total samples.
Plants 12 02185 g002
Figure 3. Ranking of expression stability of the 14 candidate reference genes in L. megaphylla using geNorm analysis. Results from (A) different seedling tissues; (B) different adult tree tissues; (C) all seedling and adult tree tissues; (D) 16 leaf developmental stages; (E) entire growth cycle including all different seedling and adult tree tissues as well as 16 leaf developmental stages; (F) cold treatment for 7 days; (G) cold treatment for 24 h; (H) cold treatments including 7 days and 24 h; (I) heat treatment for 24 h; (J) different temperature treatments including cold and heat; (K) total samples.
Plants 12 02185 g003
Figure 4. Pairwise variation values calculated by geNorm were used to determine the optimal number of reference genes from the 14 candidates in L. megaphylla. The cutoff value of Vn/n+1 to determine the optimal number of reference genes for RT-qPCR normalization was 0.15.
Plants 12 02185 g004
Figure 5. Ranking of expression stability of the 14 candidate reference genes in L. megaphylla using NormFinder analysis. Results from (A) different seedling tissues; (B) different adult tree tissues; (C) all seedling and adult tree tissues; (D) 16 leaf developmental stages; (E) entire growth cycle including all different seedling and adult tree tissues as well as 16 leaf developmental stages; (F) cold treatment for 7 days; (G) cold treatment for 24 h; (H) cold treatments including 7 days and 24 h; (I) heat treatment for 24 h; (J) different temperature treatments including cold and heat; (K) total samples.
Plants 12 02185 g005
Figure 6. Venn diagrams displaying the overlap between the top five most stable reference genes as ranked by ΔCt, geNorm, NormFinder, and BestKeeper for the different datasets. Genes in the overlapping area were confirmed by more than one algorithm. The light purple, purple, light green and pink ellipses contain the top five most stable reference genes selected by ΔCt, geNorm, NormFinder, and BestKeeper, respectively.
Plants 12 02185 g006
Figure 7. Relative expression of LmNAC83 in six experimental sample sets. The results were normalized using the stable reference genes (alone or in combination) or an unstable gene in six sample sets, including (A) different seedling tissues; (B) different adult tree tissues; (C) different leaf developmental stages; (D) cold treatment for 7 days; (E) cold treatment for 24 h; and (F) heat treatment for 24 h. The bars indicate the standard deviation (±SD) evaluated from three biological replicates.
Plants 12 02185 g007
Figure 8. Relative expression of LmERF60 in six experimental sample sets. The results were normalized using the stable reference genes (alone or in combination) or an unstable gene in six sample sets, including (A) different seedling tissues; (B) different adult tree tissues; (C) different leaf developmental stages; (D) cold treatment for 7 days; (E) cold treatment for 24 h; and (F) heat treatment for 24 h. The bars indicate the standard deviation (±SD) evaluated from three biological replicates.
Plants 12 02185 g008
Table 1. Six experimental sets of L. megaphylla.
Experimental Sample Sets Tissue TypeBiological Replicates Sampling Dates Total Number of Samples
Different tissues of oneyear-old seedlings Roots, stems and leaves 313
Different tissues of adult trees Leaf buds, young stems, young seeds, young leaves and mature leaves 3115
Developmental stages Leaves315 45
Cold stress for 7 days Leaves3 4 12
Cold stress for 24 h Leaves3 5 15
Heat stress for 24 hLeaves3 5 15
Table 2. Candidate reference genes and designed primers for RT-qPCR normalization in L. megaphylla.
Gene
Symbol
Gene NamePrimer Sequence (5′ → 3′)Product
Length (bp)
Standard CurveE (%)
TCTPtranslationally controlled tumor protein F:GTTTCTCACCCTCCAACTTAGG
R:CATTTCGCCTCCAGGAACA
102 y = −2.4502x + 29.195 95.070 0.9992
ACT7actin-related protein 7 F:AAGCCAACAGGGAGAAGATG
R:CACCCGAGTCCAGAACAATAC
132 y = −2.3523x + 28.25 103.003 0.9971
GAPDHGlyceraldehyde 3-phosphate dehydrogenase F:CGGAGGATGATGTGGTTTCTAC
R:GCGACAAGCTTGACAAAGTG
106 y = −2.3607x + 27.623 98.050 0.9994
UBC36ubiquitin-conjugating enzyme E2
36
F:CCCGAAGGTTCGATTTCTCA
R:TGAAGAGCAGGACTCCATTTATC
102 y = −2.3618x + 29.443 101.509 0.9978
UBC7ubiquitin-conjugating enzyme E2
7
F:TCATGAGCTTCCCAGCAAATTA
R:CGTCCGTCGGGATAAACATTAG
91 y = −2.442x + 29.477 96.932 0.9974
EF2elongation factor 2-like F:GCGGATAAGGGTAGGTTCTTT
R:TTCTGGCCAGGAACATAGTTAG
104 y = −1.9725x + 27.627 96.045 0.9919
CYP20-2peptidyl-prolyl cis-trans isomerase CYP20-2, chloroplastic F:AACACCAACGGTAGCCAAT
R:TCCAGAACCTGCCCAAATAC
86 y = −2.4129x + 27.719 101.307 0.9963
UBQpolyubiquitin F:CCTCGCCGACTACAATATTCA
R:CACCTCCAGAGTAATCGTCTTC
115 y = −2.2086x + 23.796 85.947 0.9989
TUAAlpha-tubulin F:GCCTTACAACAGTGTGCTTTC
R:ATCTAGAGATCGACGGCAGATA
106 y = −2.3673x + 27.37 101.414 0.9972
UBC28ubiquitin-conjugating enzyme E2
28-like
F:ACAATTATGGGACCAGCAGATAG
R:GGGTGGCTTGAATGGGTAAT
90 y = −2.3925x + 28.93 101.491 0.9972
IClnchloride conductance regulatory protein ICln F:TGAGCGACACCGATAGAGAA
R:TAAATGCAAGGAGAGGCGTAAG
103 y = −2.6401x + 31.012 64.420 0.9953
ubiquinoneNADH dehydrogenase F:ATCCGACGGGCGATTAAAG
R:TCTAGCCTCTTCTTCCAGATACT
123 y = −2.1552x + 28.534 107.169 0.9975
PPRpentatricopeptide repeatcontaining protein F:CTTTAAGCCAGACCAGCAAATG
R:TCCTCTTTCAGCCATCTTTCC
106 y = −2.3288x + 29.75 102.616 0.9976
SDE2replication stress response regulator SDE2-like F:TAGACGGGCGGACCAGAT
R:GAGGAGGACGGTGCAGGAG
197 y = −2.7496x + 30.276 86.753 0.9912
EIF4A-3eukaryotic initiation factor 4A-3like F:TCTTTGTTGCGGTTGAGCG
R:ACCAATCCACCTTTCTTTTCG
117 y = −2.8406x + 28.345 95.752 0.9918
helicase-15DEAD-box ATP-dependent RNA
helicase 15
F:CCTGGGAGAATACTGGCACTG
R:GGCCTCGTCGTCCACATAA
249 y = −3.1364x + 30.269 92.361 0.9992
PAB2polyadenylate-binding protein 2like F:CCCAAGCTGTTGAGGATCTTA
R:CCTTTCAGCTCCATCTCTCTTT
100 y = −2.4748x + 31.269 91.035 0.9919
CYP95peptidyl-prolyl cis-trans isomerase CYP95 like F:GGGTTCAGTCATCGTTACTCTT
R:GCGTTCACTTCTTCCTCCATA
99 y = −2.4245x + 29.937 103.599 0.9898
RHA2AE3 ubiquitin-protein ligase
RHA2A
F:CTTTAGCGGGAGCGATGT
R:CAAGCACTCTCTGTGGAAGA
112 y = −2.3815x + 31.29 93.904 0.9870
EF1αTranslation elongation factor
EF1A
F:AAATGAGGAGGAGCGTGTAAAG
R:CGCTGATCATGTTAGGGACATAG
128 y = −2.6481x + 30.807 83.491 0.8779
Table 3. Ranking of expression stability of the 14 candidate reference genes in L. megaphylla using BestKeeper analysis.
RankingSeedlingsAdult TreeDifferent TissuesLeaf DevelopmentEntire Growth CycleCold 7 d
Gene NameSDCV
(%)
Gene NameSDCV
(%)
Gene NameSDCV
(%)
Gene NameSDCV
(%)
Gene NameSDCV
(%)
Gene NameSDCV (%)
1UBC70.060.24GAPDH0.090.48ACT70.291.36UBC280.602.76UBC280.582.64PPR0.060.27
2helicase-150.140.57TCTP0.180.83UBC280.311.40GAPDH0.663.24TCTP0.592.73PAB20.110.55
3EF20.220.93ubiquinone0.210.91TCTP0.371.71TCTP0.713.27UBC70.693.01EIF4A-30.140.68
4PAB20.221.01UBC70.241.08EIF4α0.371.80UBC70.733.21ACT70.693.20GAPDH0.211.04
5ACT70.271.28ACT70.251.20ubiquinone0.391.69PPR0.803.56GAPDH0.693.40UBC360.231.01
6GAPDH0.281.32EIF4A-30.271.30PTB0.391.85ACT70.803.67ubiquinone0.753.27TCTP0.251.15
7UBC280.31.35UBC280.301.37TUA0.451.97EIF4A-30.884.11UBC360.783.44UBC280.251.15
8PPR0.341.38TUA0.351.54helicase-150.461.93UBC360.893.97EIF4A-30.783.69ACT70.251.19
9TUA0.351.51UBC360.361.58UBC360.502.17CYP20-20.894.21EF20.894.04ubiquinone0.271.16
10TCTP0.371.73EF20.361.64EF20.602.66ubiquinone0.913.98PPR0.954.17CYP20-20.321.47
11ubiquinone0.461.93CYP20-20.41.85PPR0.692.92EF21.054.78CYP20-20.974.51helicase-150.341.45
12EIF4A-30.542.63helicase-150.421.79UBC70.692.97PAB21.065.34PAB21.025.05EF20.401.80
13UBC360.582.46PAB20.432.05GAPDH0.733.62helicase-151.386.02helicase-151.144.91UBC70.632.74
14CYP20-20.803.40PPR0.612.65CYP26-20.964.33TUA1.597.25TUA1.325.93TUA1.104.79
RankingCold 24 hColdHeat 24 hStress TreatmentAll Samples
Gene NameSDCV (%)Gene NameSDCV
(%)
Gene NameSDCV
(%)
Gene NameSDCV
(%)
Gene NameSDCV
(%)
1EIF4A-30.10.46PPR0.180.82UBC280.221.03UBC280.371.7UBC280.512.32
2PPR0.140.65EIF4A-30.190.91ubiquinone0.542.35PPR0.421.86TCTP0.562.57
3helicase-150.31.29PAB20.291.42TCTP0.773.5ubiquinone0.451.94GAPDH0.62.98
4TUA0.321.41UBC360.31.29PPR0.83.5EIF4A-30.472.24ubiquinone0.642.76
5PAB20.331.64GAPDH0.321.55GAPDH0.823.98GAPDH0.492.39EIF4A-30.663.14
6GAPDH0.351.69ubiquinone0.341.45EF20.833.55TCTP0.512.35ACT70.683.12
7UBC70.361.54UBC280.361.65PAB20.914.39PAB20.512.52UBC70.713.08
8ubiquinone0.371.59TCTP0.371.71EIF4A-30.914.44CYP20-20.632.96UBC360.723.16
9UBC360.381.65helicase-150.391.67CYP20-20.954.38ACT70.663.04EF20.813.62
10UBC280.421.87ACT70.41.83ACT71.034.63EF20.682.99PAB20.824.05
11EF20.431.94EF20.421.86UBC71.094.5UBC70.72.97PPR0.833.64
12TCTP0.512.3UBC70.431.84helicase-151.174.81UBC360.723.09CYP20-20.853.94
13ACT70.532.43CYP20-20.532.48TUA1.35.33helicase-150.733.08helicase-150.984.18
14CYP20-20.663.11TUA0.672.93UBC361.365.64TUA1.215.2TUA1.225.4
Table 4. Ranking of expression stability of the 14 candidate reference genes in L. megaphylla using RefFinder analysis.
RankingSeedlingsAdult TreeDifferent TissuesLeaf DevelopmentEntire Growth CycleCold 7 d
Gene NameGeomean of
Ranking Values
Gene NameGeomean of
Ranking Values
Gene NameGeomean of
Ranking Values
Gene NameGeomean of
Ranking Values
Gene NameGeomean of
Ranking Values
Gene NameGeomean of
Ranking Values
1PAB22.21UBC282.21helicase-151.68ACT72.11ubiquinone2.21TCTP1.86
2helicase-152.21UBC72.21UBC282.91UBC362.45UBC72.45ubiquinone2.71
3EF22.78CYP20-22.78PAB23.34UBC72.99UBC363.13UBC362.94
4UBC284.09helicase-154.09ACT73.72TCTP3.00UBC283.34UBC284.53
5ACT74.36GAPDH4.36ubiquinone3.98GAPDH5.29EF23.46PPR4.74
6UBC74.58ACT74.58EF24.68UBC285.30GAPDH5.45PAB24.74
7GAPDH5.58ubiquinone5.58TUA6.19ubiquinone5.89TCTP6.00ACT75.57
8TCTP7.27EF27.27UBC367.97EIF4A-35.96ACT76.88EIF4A-37.00
9TUA7.33TCTP7.33EIF4A-39.30PAB28.82PAB27.90helicase-157.26
10ubiquinone10.22UBC3610.22UBC79.46CYP20-29.69EIF4A-310.02GAPDH9.12
11PPR10.38TUA10.38TCTP9.53EF210.22helicase-1510.94EF29.64
12EIF4A-311.93EIF4A-311.93GAPDH10.68PPR10.72CYP20-211.24CYP20-210.74
13UBC3612.49PAB212.49PPR11.24helicase-1512.24PPR12.17UBC713.00
14CYP20-214.00PPR14.00CYP20-212.98TUA14.00TUA14.00TUA14.00
RankingCold 24 hColdHeat 24 hStress TreatmentAll Samples
Gene NameGeomean of
Ranking Values
Gene NameGeomean of
Ranking Values
Gene NameGeomean of
Ranking Values
Gene NameGeomean of
Ranking Values
Gene NameGeomean of
Ranking Values
1GAPDH1.57UBC362.21PAB22.30PAB21.57ubiquinone2.21
2UBC362.45TCTP3.13CYP20-22.45PPR2.91EF23.22
3helicase-153.72UBC283.60GAPDH2.59ACT74.05UBC73.64
4EF24.15EF24.03ubiquinone3.76GAPDH4.16GAPDH3.94
5UBC76.40PAB24.79PPR4.92EF24.68UBC364.12
6TUA6.51ACT75.33ACT76.16CYP20-24.68PAB25.01
7TCTP6.51PPR5.62EF26.16UBC286.85TCTP5.83
8PPR7.18GAPDH6.32UBC287.24ubiquinone7.19ACT75.86
9EIF4A-37.24ubiquinone6.45TCTP7.95helicase-158.17UBC286.04
10UBC287.36EIF4A-37.50UBC78.89TCTP8.18helicase-159.58
11PAB28.41helicase-157.94EIF4A-38.94EIF4A-38.92EIF4A-39.64
12ACT79.87CYP20-211.72helicase-159.64UBC710.22CYP20-210.47
13ubiquinone10.84UBC712.74UBC3612.47UBC3610.36PPR12.47
14CYP20-213.24TUA14.00TUA13.00TUA14.00TUA14.00
Disclaimer/Publisher’s Note: The statements, opinions and data contained in all publications are solely those of the individual author(s) and contributor(s) and not of MDPI and/or the editor(s). MDPI and/or the editor(s) disclaim responsibility for any injury to people or property resulting from any ideas, methods, instructions or products referred to in the content.

