


Physiological and Transcriptome Analyses of Photosynthesis in Three Mulberry Cultivars within Two Propagation Methods (Cutting and Grafting) under Waterlogging Stress
 , and
, and 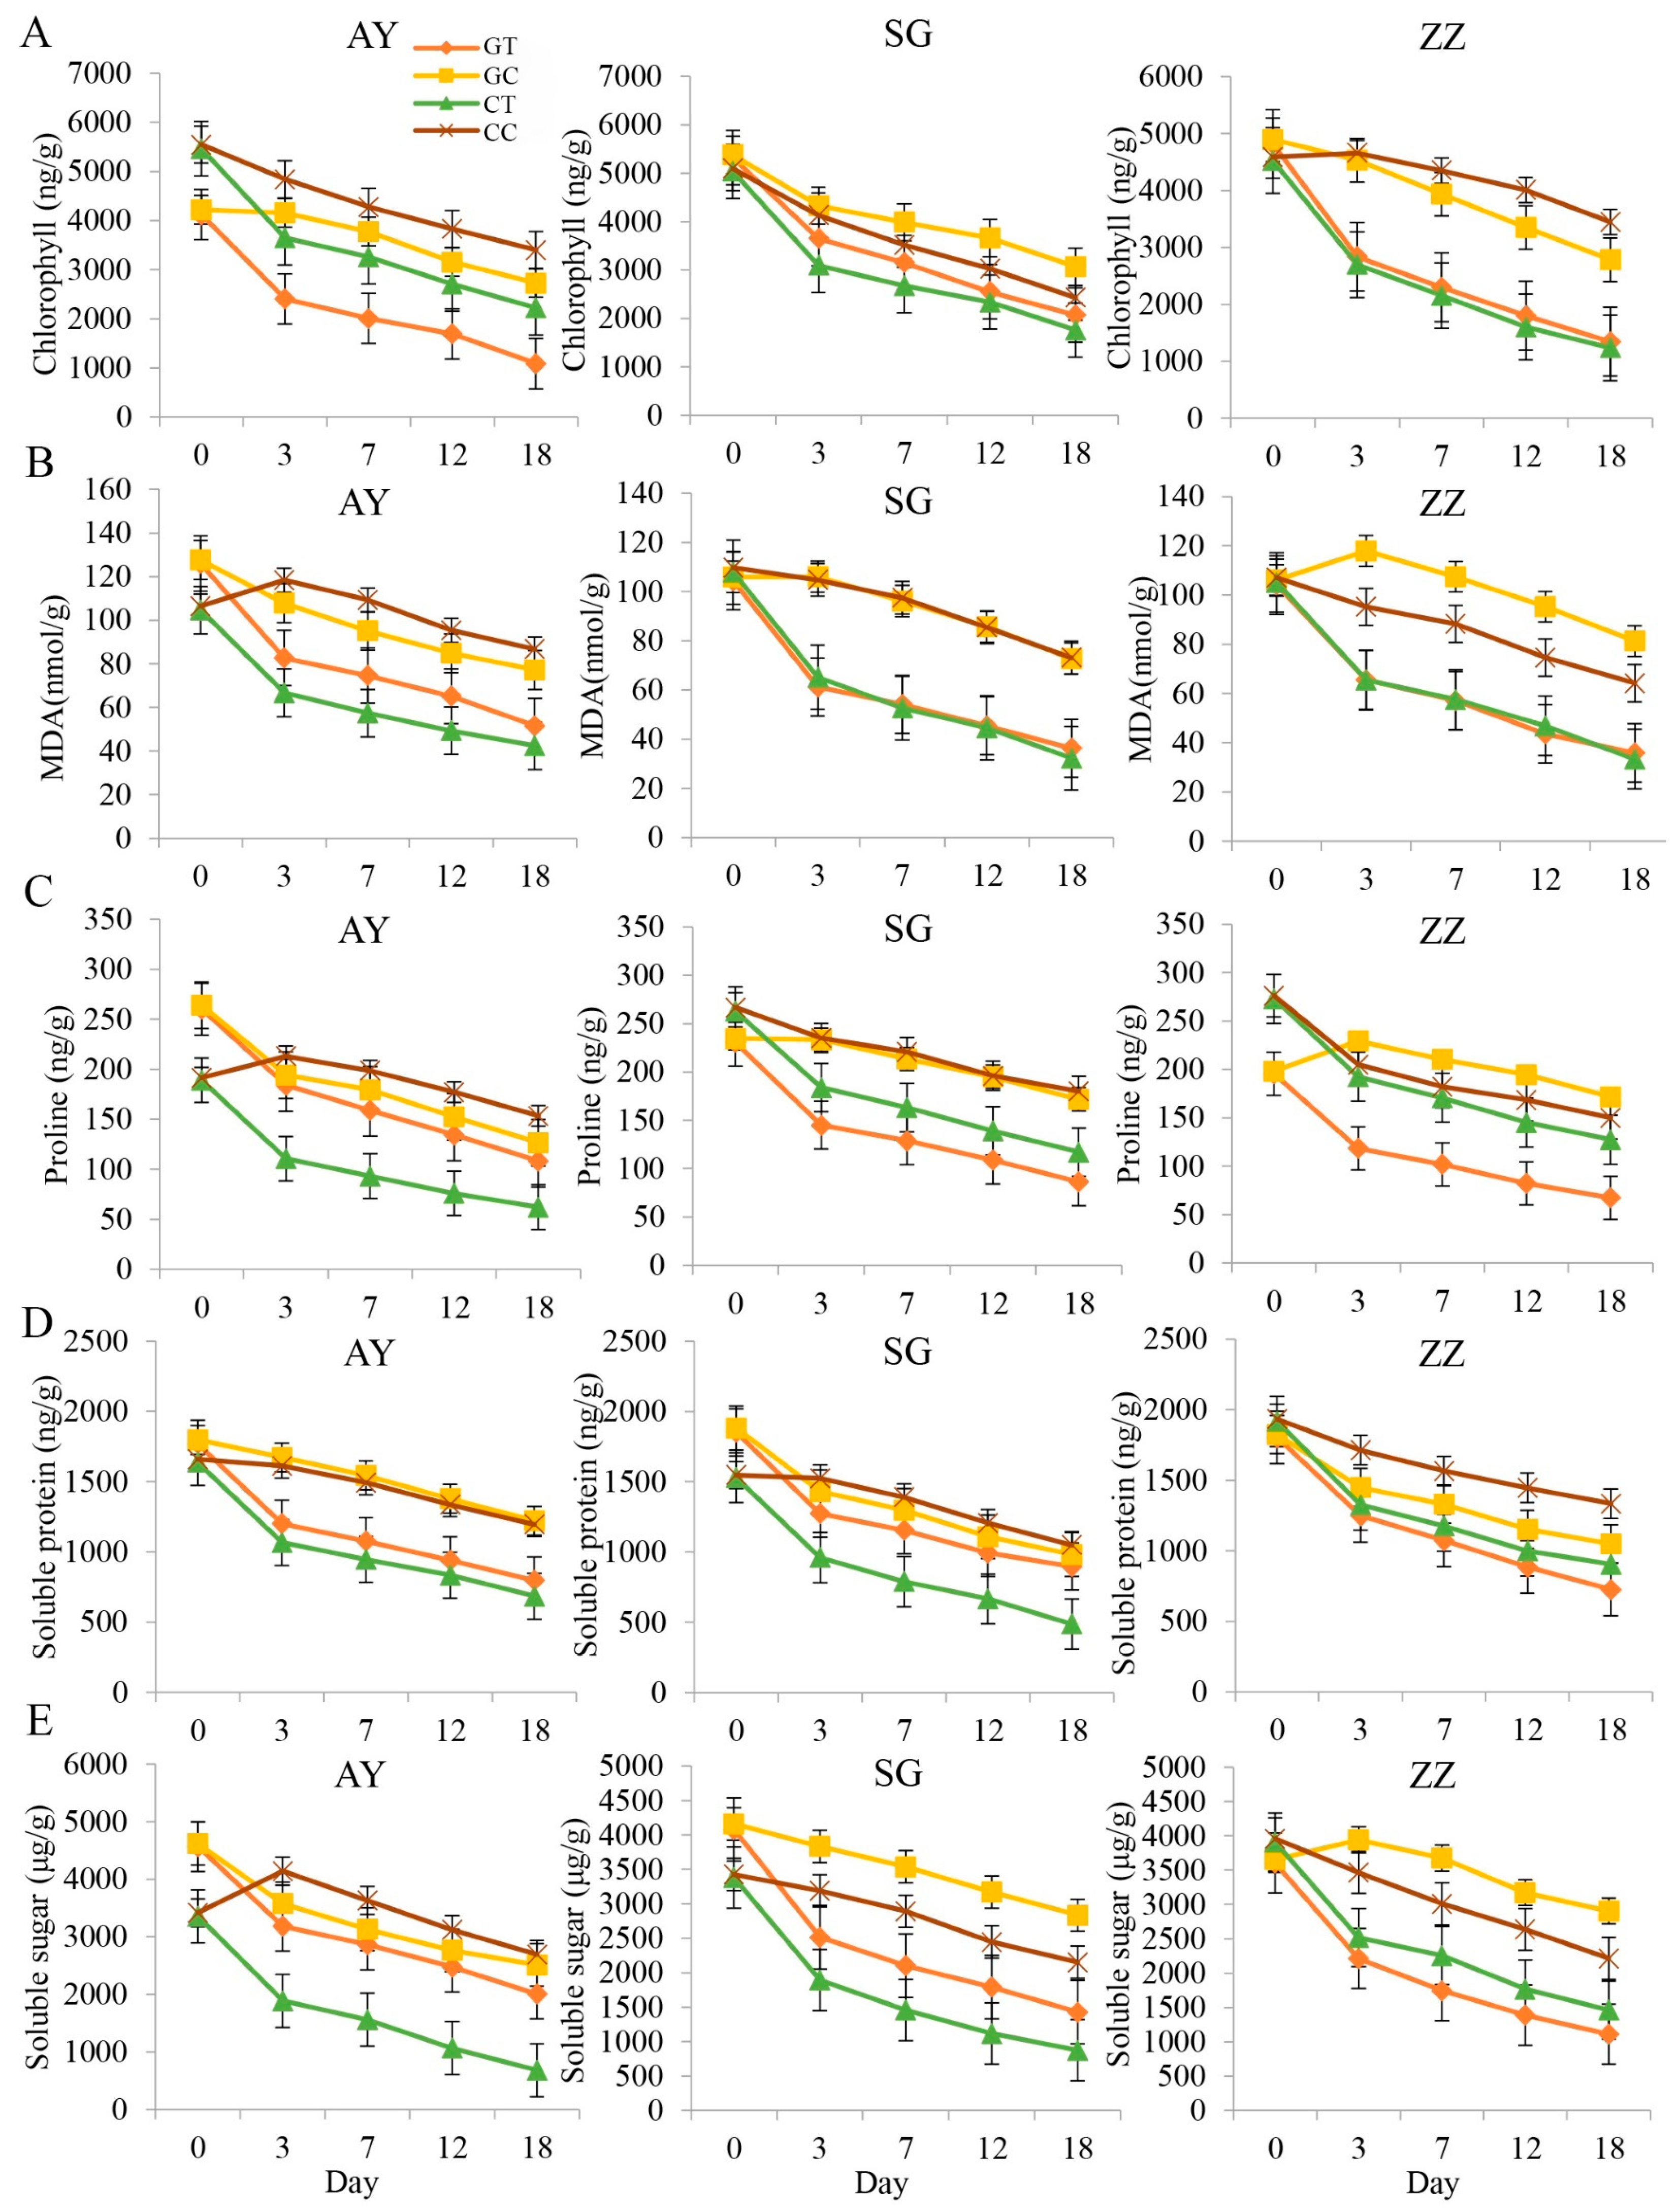
Abstract
:1. Introduction
2. Results
2.1. Comparisons of Osmotic Regulatory Substances between Cutting and Grafting Groups in Three Cultivars
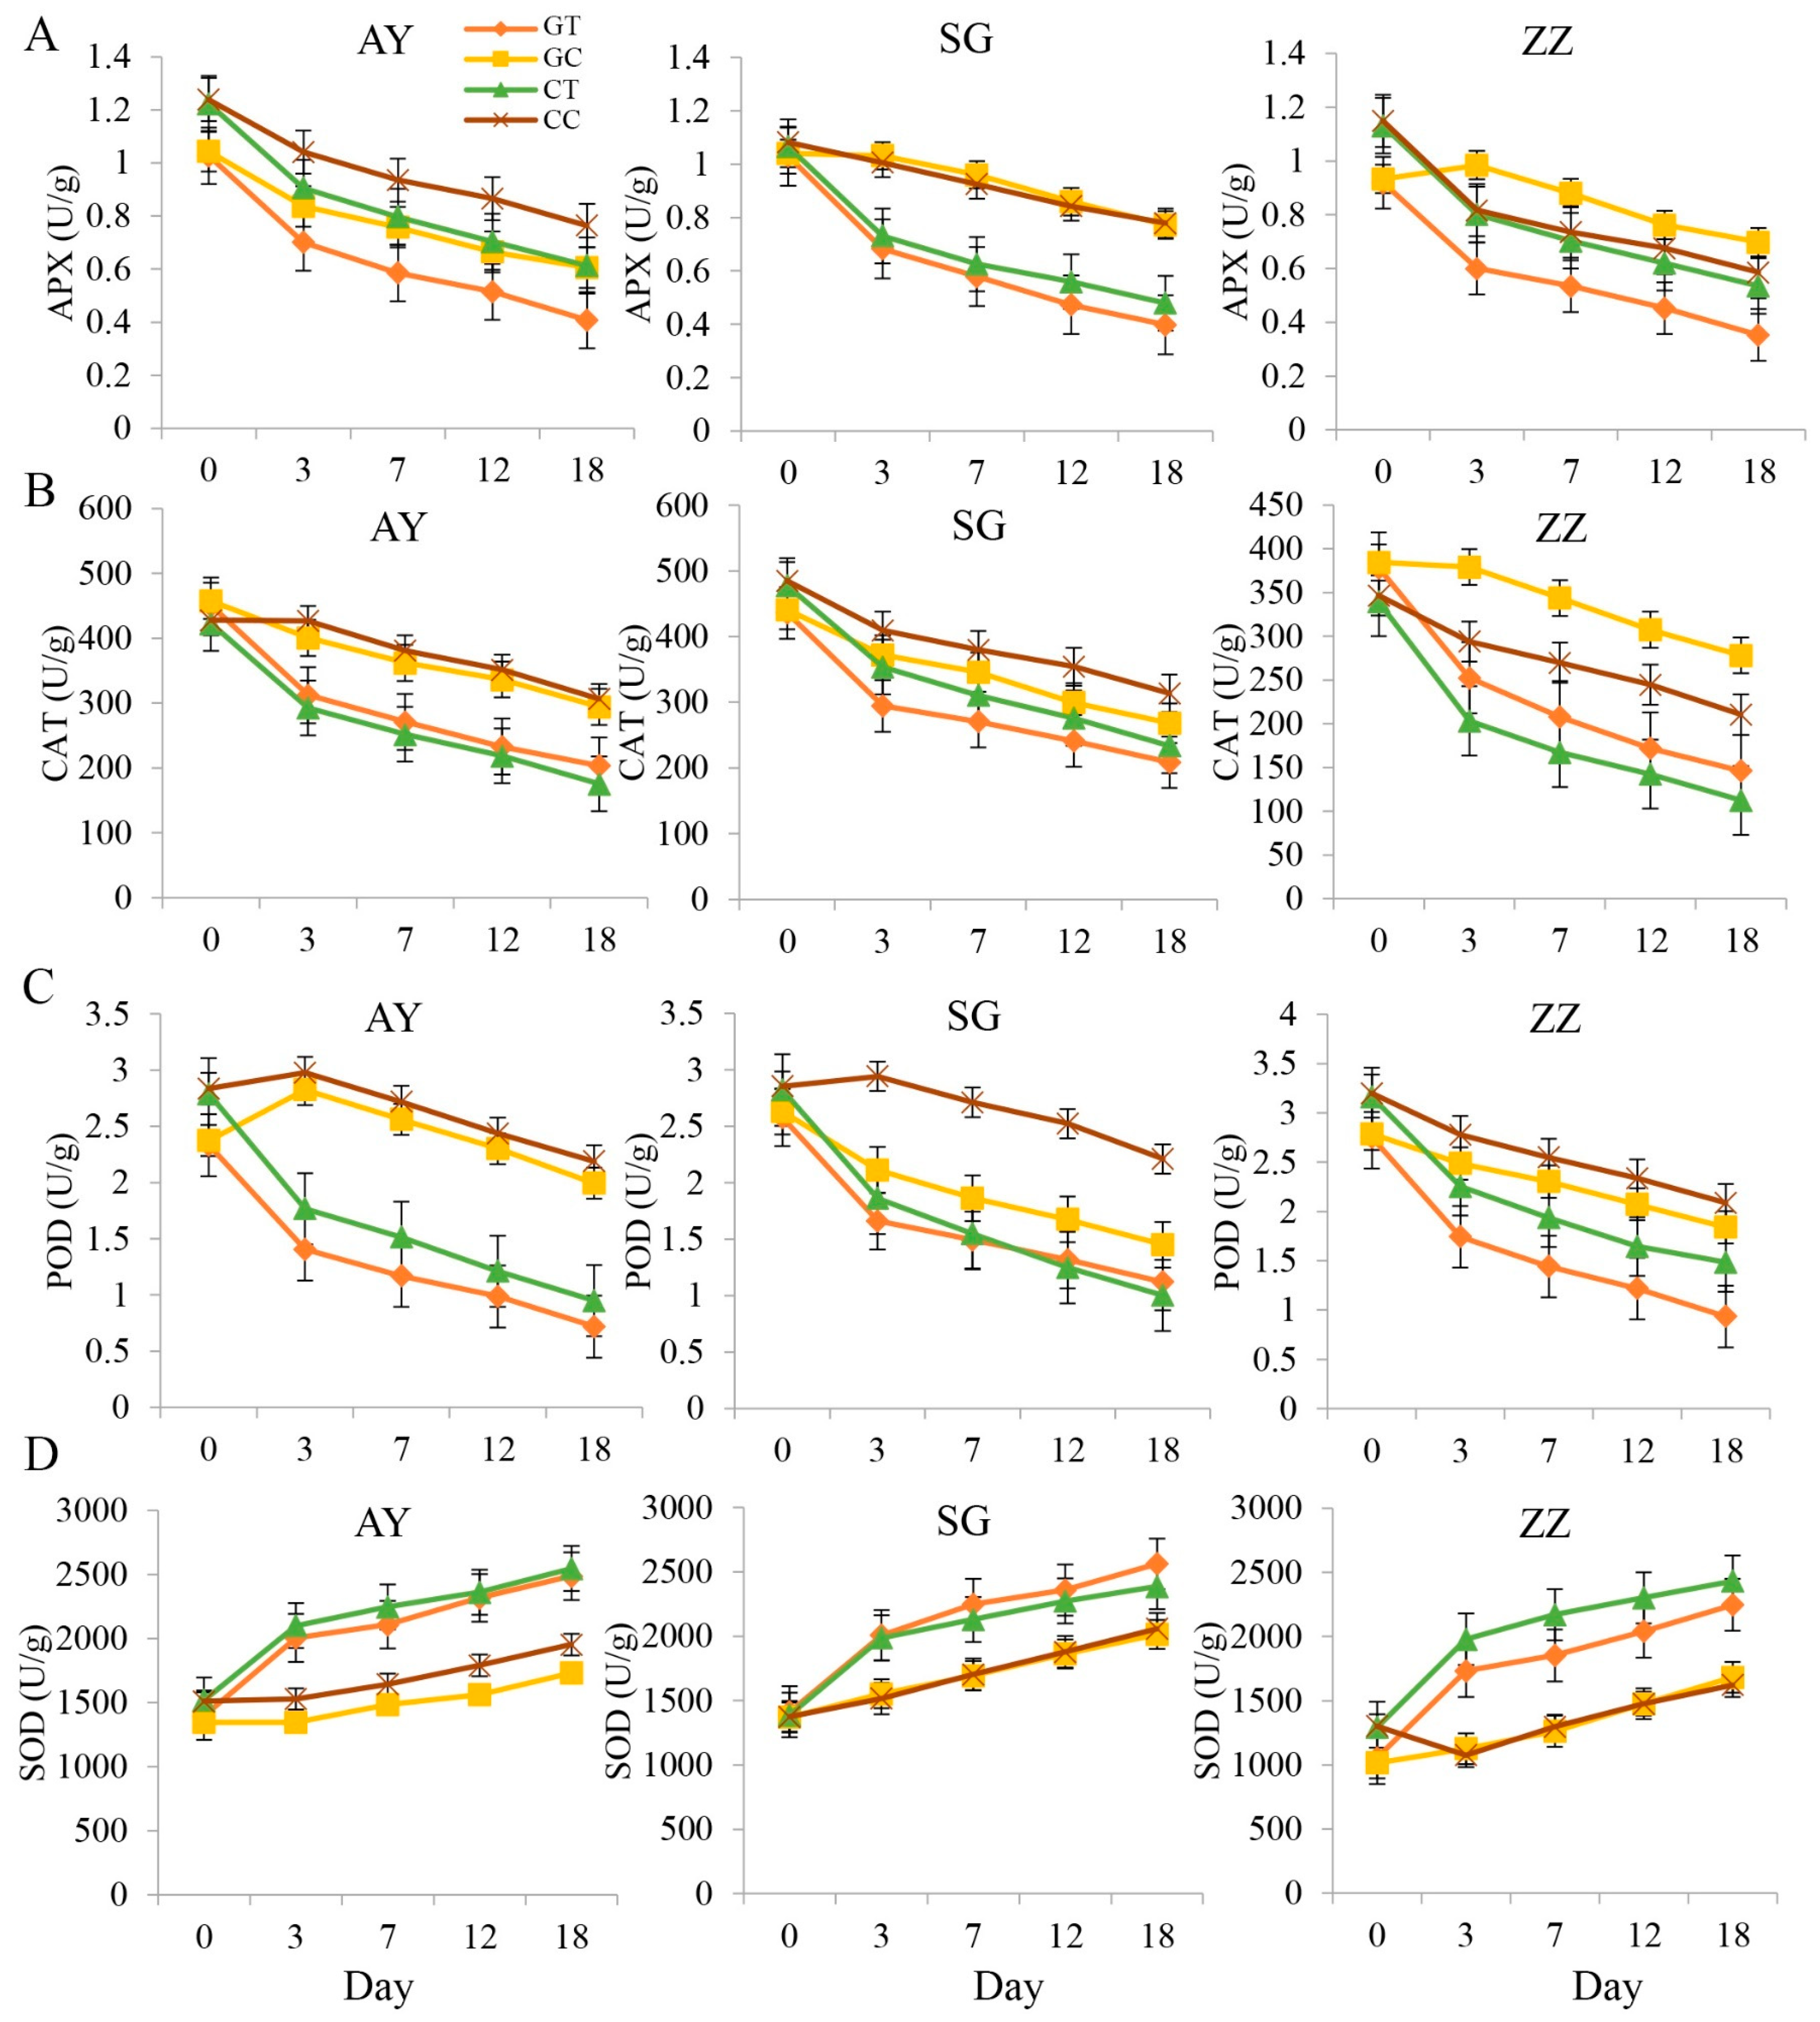
2.2. Dynamics of Enzyme Activities after Waterlogging Treatments
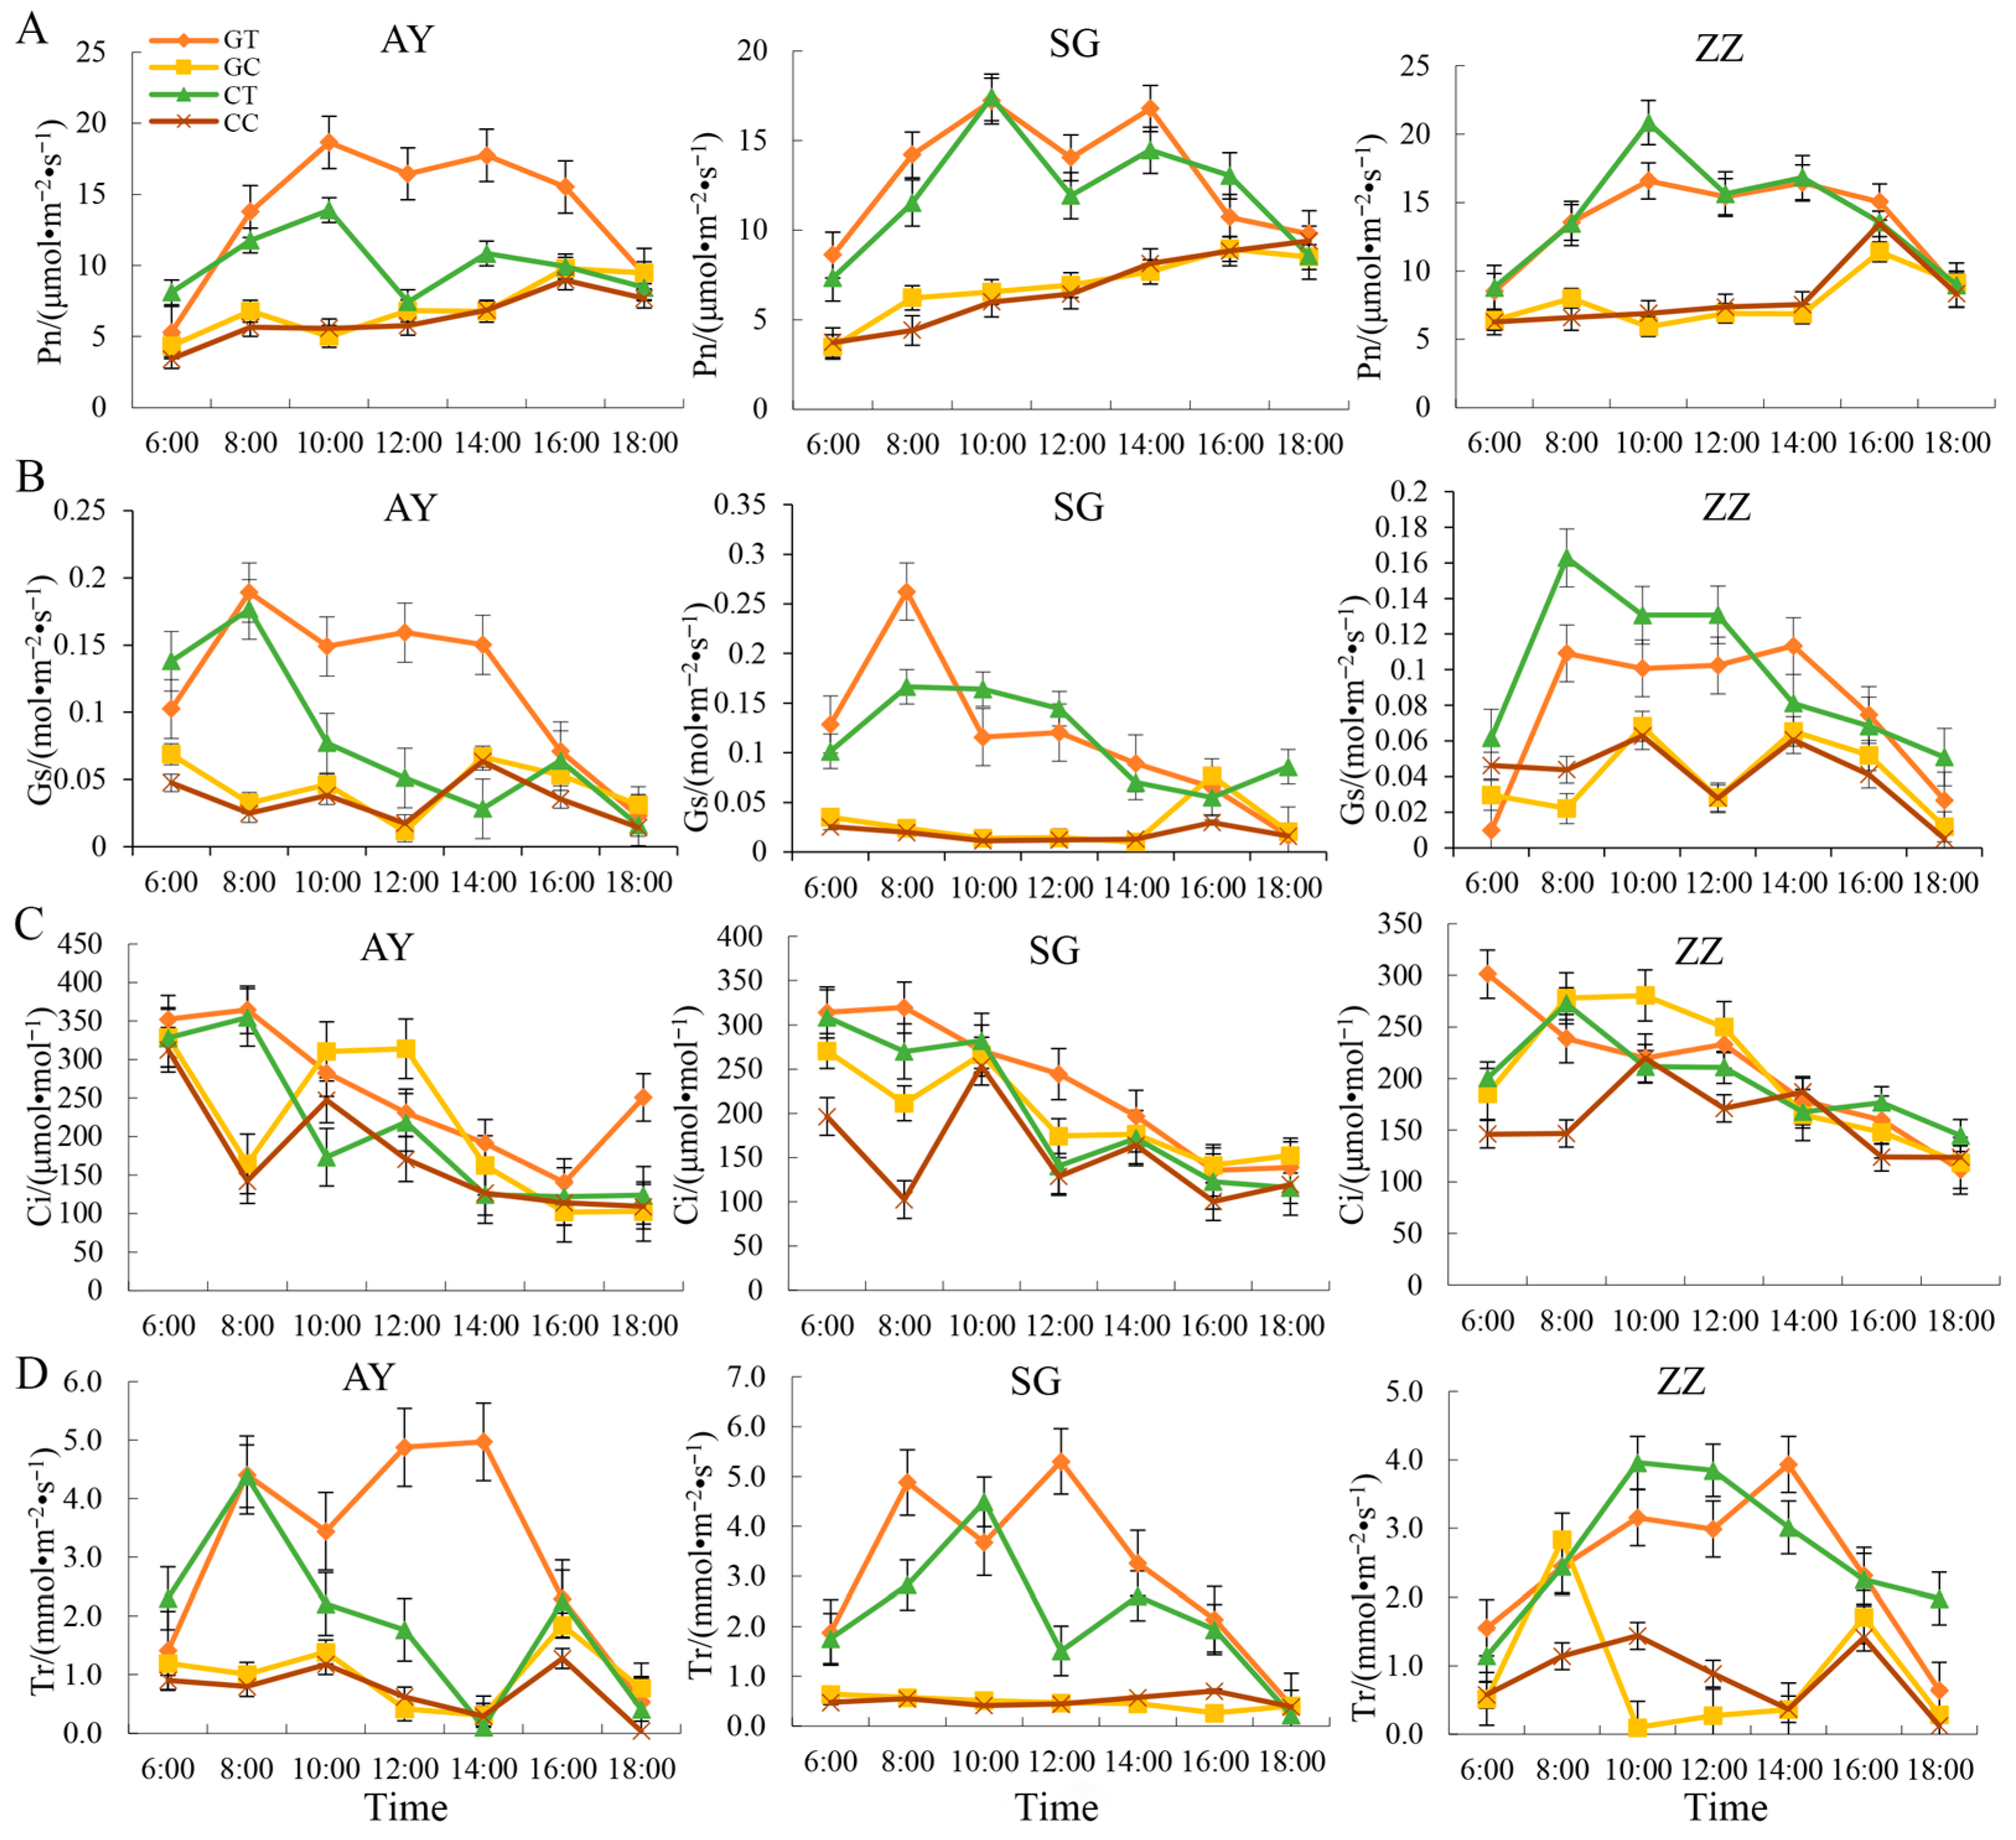
2.3. Dynamic Changes of Photosynthetic Characters in Three Mulberry Cultivars after Waterlogging Treatment
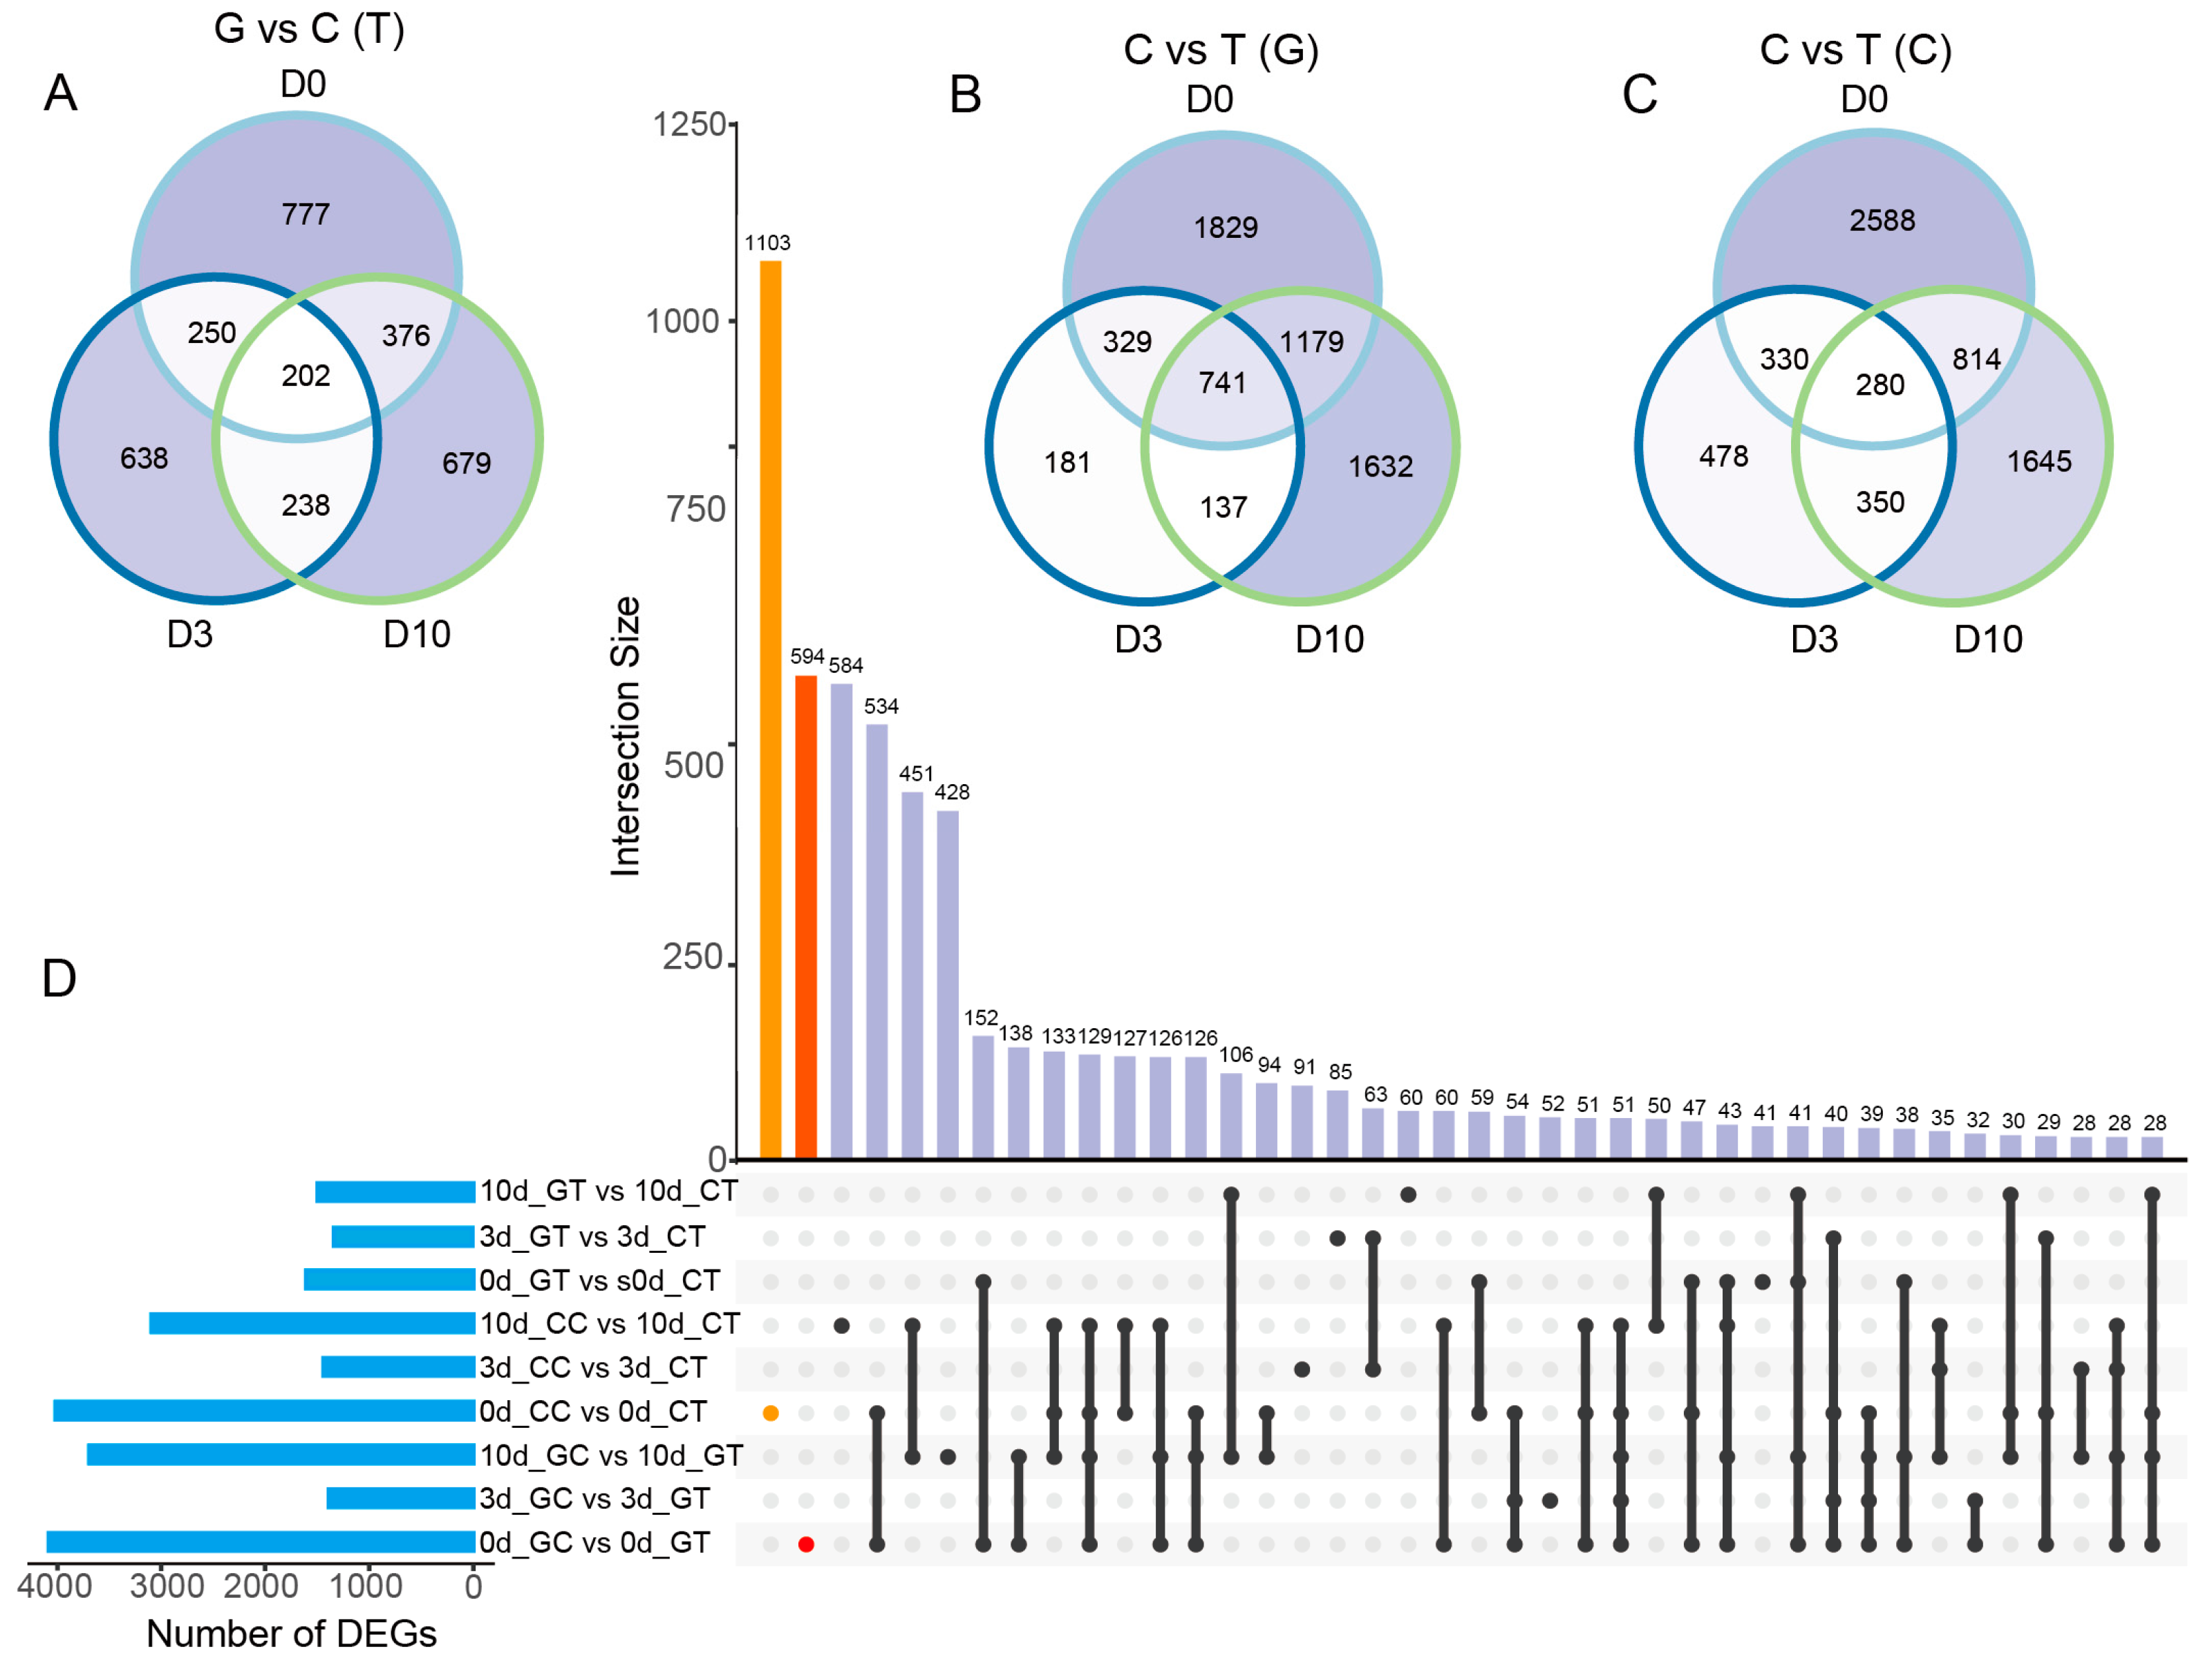
2.4. The Number of DEGs in Cut and Grafted Mulberry Responding to Waterlogging Stress
2.5. Dynamics of Photosynthesis-Related Gene Expression in Mulberry with Waterlogging Stress
2.6. Propagation Methods Affect Photosynthesis-Related Gene Expression Responding to Waterlogging Stress
2.7. Validation of Photosynthesis-Related Genes Expression with qPCR Method
3. Discussion
3.1. Dynamic Changes in Physiological Indices of Mulberry under Waterlogging Stress
3.2. Cutting Propagation Methods Displayed Better Recovery Capacity from Waterlogging Stress than Grafting
4. Materials and Methods
4.1. Plants and Sample Preparation
4.2. Measurements of Osmotic Regulation Substances and Chlorophyll Content
4.3. Measurements of Enzyme Activities
4.4. Measurements of Photosynthetic Characters
4.5. Statistical Analysis
4.6. RNA-Seq of Mulberry Leaves
4.7. Validation of RNA-Seq Data
5. Conclusions
Supplementary Materials
Author Contributions
Funding
Institutional Review Board Statement
Informed Consent Statement
Data Availability Statement
Conflicts of Interest
References
- Kaur, G.; Singh, G.; Motavalli, P.P.; Nelson, K.A.; Orlowski, J.M.; Golden, B.R. Impacts and management strategies for crop production in waterlogged or flooded soils: A review. Agron. J. 2020, 112, 1475–1501. [Google Scholar] [CrossRef]
- Hasanuzzaman, M.; Bhuyan, M.H.M.B.; Zulfiqar, F.; Raza, A.; Mohsin, S.M.; Al Mahmud, J.; Fujita, M.; Fotopoulos, V. Reactive Oxygen Species and Antioxidant Defense in Plants under Abiotic Stress: Revisiting the Crucial Role of a Universal Defense Regulator. Antioxidants 2020, 9, 681. [Google Scholar] [CrossRef]
- Irfan, M.; Hayat, S.; Hayat, Q.; Afroz, S.; Ahmad, A. Physiological and biochemical changes in plants under waterlogging. Protoplasma 2010, 241, 3–17. [Google Scholar] [CrossRef] [PubMed]
- Fukao, T.; Barrera-Figueroa, B.E.; Juntawong, P.; Pena-Castro, J.M. Submergence and Waterlogging Stress in Plants: A Review Highlighting Research Opportunities and Understudied Aspects. Front. Plant Sci. 2019, 10, 340. [Google Scholar] [CrossRef] [PubMed]
- Sharma, J.K.; Sihmar, M.; Santal, A.R.; Singh, N.P. Impact assessment of major abiotic stresses on the proteome profiling of some important crop plants: A current update. Biotechnol. Genet. Eng. 2019, 35, 126–160. [Google Scholar] [CrossRef] [PubMed]
- Xie, L.J.; Zhou, Y.; Chen, Q.F.; Xiao, S. New insights into the role of lipids in plant hypoxia responses. Prog. Lipid Res. 2021, 81, 101072. [Google Scholar] [CrossRef] [PubMed]
- Adak, M.K.; Saha, I.; Dolui, D.; Hasanuzzaman, M. An updated overview of the physiological and molecular responses of rice to anoxia. Front. Biosci.-Landmrk 2021, 26, 1240–1255. [Google Scholar]
- Bhusal, N.; Kim, H.S.; Han, S.-G.; Yoon, T.-M. Photosynthetic traits and plant–water relations of two apple cultivars grown as bi-leader trees under long-term waterlogging conditions. Environ. Exp. Bot. 2020, 176, 104111. [Google Scholar] [CrossRef]
- Jacobsen, A.L.; Agenbag, L.; Esler, K.J.; Pratt, R.B.; Ewers, F.W.; Davis, S.D. Xylem density, biomechanics and anatomical traits correlate with water stress in 17 evergreen shrub species of the Mediterranean-type climate region of South Africa. J. Ecol. 2007, 95, 171–183. [Google Scholar] [CrossRef]
- Lee, Y.-H.; Kim, K.-S.; Jang, Y.-S.; Choi, I.-H. Nitric oxide production and scavenging in waterlogged roots of rape seedlings. Genes Genom. 2014, 36, 691–699. [Google Scholar] [CrossRef]
- Özçubukçu, S.; Ergün, N.; Ilhan, E. Waterlogging and nitric oxide induce gene expression and increase antioxidant enzyme activity in wheat (Triticum aestivum L.). Acta Biol. Hung. 2014, 65, 47–60. [Google Scholar] [CrossRef] [PubMed]
- Jia, L.; Qin, X.; Lyu, D.; Qin, S.; Zhang, P. ROS production and scavenging in three cherry rootstocks under short-term waterlogging conditions. Sci. Hortic. 2019, 257, 108647. [Google Scholar] [CrossRef]
- Peng, Y.; Zhou, Z.; Tong, R.; Hu, X.; Du, K. Anatomy and ultrastructure adaptations to soil flooding of two full-sib poplar clones differing in flood-tolerance. Flora 2017, 233, 90–98. [Google Scholar] [CrossRef]
- Oliveira, A.S.d.; Ferreira, C.S.; Graciano-Ribeiro, D.; Franco, A.C. Anatomical and morphological modifications in response to flooding by six Cerrado tree species. Acta Bot. Bras. 2015, 29, 478–488. [Google Scholar] [CrossRef]
- Li, M.; López, R.; Venturas, M.; Pita, P.; Gordaliza, G.G.; Gil, L.; Rodríguez-Calcerrada, J. Greater resistance to flooding of seedlings of Ulmus laevis than Ulmus minor is related to the maintenance of a more positive carbon balance. Trees 2015, 29, 835–848. [Google Scholar] [CrossRef]
- Olorunwa, O.J.; Adhikari, B.; Brazel, S.; Shi, A.; Popescu, S.C.; Popescu, G.V.; Barickman, T.C. Growth and Photosynthetic Responses of Cowpea Genotypes under Waterlogging at the Reproductive Stage. Plants 2022, 11, 2315. [Google Scholar] [CrossRef]
- Barickman, T.C.; Simpson, C.R.; Sams, C.E. Waterlogging Causes Early Modification in the Physiological Performance, Carotenoids, Chlorophylls, Proline, and Soluble Sugars of Cucumber Plants. Plants 2019, 8, 160. [Google Scholar] [CrossRef]
- Chen, C.C.; Li, M.S.; Chen, K.T.; Lin, Y.H.; Ko, S.S. Photosynthetic and Morphological Responses of Sacha Inchi (Plukenetia volubilis L.) to Waterlogging Stress. Plants 2022, 11, 249. [Google Scholar] [CrossRef]
- Sharma, S.; Bhatt, U.; Sharma, J.; Darkalt, A.; Mojski, J.; Soni, V. Effect of different waterlogging periods on biochemistry, growth, and chlorophyll a fluorescence of Arachis hypogaea L. Front Plant. Sci. 2022, 13, 1006258. [Google Scholar] [CrossRef]
- Phukan, U.J.; Mishra, S.; Shukla, R.K. Waterlogging and submergence stress: Affects and acclimation. Crit. Rev. Biotechnol. 2016, 36, 956–966. [Google Scholar] [CrossRef]
- Salazar, C.; Hernández, C.; Pino, M.T. Plant water stress: Associations between ethylene and abscisic acid response. Chil. J. Agric. Res. 2015, 75, 71–79. [Google Scholar] [CrossRef]
- Chen, W.; Yao, Q.; Patil, G.B.; Agarwal, G.; Deshmukh, R.K.; Lin, L.; Wang, B.; Wang, Y.; Prince, S.J.; Song, L. Identification and comparative analysis of differential gene expression in soybean leaf tissue under drought and flooding stress revealed by RNA-Seq. Front. Plant Sci. 2016, 7, 1044. [Google Scholar] [CrossRef] [PubMed]
- Dossa, K.; You, J.; Wang, L.; Zhang, Y.; Li, D.; Zhou, R.; Yu, J.; Wei, X.; Zhu, X.; Jiang, S. Transcriptomic profiling of sesame during waterlogging and recovery. Sci. Data 2019, 6, 204. [Google Scholar] [CrossRef]
- Yu, C.; Huang, S.J.; Hu, X.M.; Deng, W.; Xiong, C.; Ye, C.H.; Li, Y.; Peng, B. Changes in photosynthesis, chlorophyll fluorescence, and antioxidant enzymes of mulberry (Morus ssp.) in response to salinity and high-temperature stress. Biologia 2013, 68, 404–413. [Google Scholar] [CrossRef]
- Yuan, Q.; Zhao, L. The Mulberry (Morus alba L.) Fruit A Review of Characteristic Components and Health Benefits. J. Agric. Food Chem. 2017, 65, 10383–10394. [Google Scholar] [CrossRef] [PubMed]
- Hosali, R.; Murthy, C. To analyse the cost of mulberry and cocoon production in Haveri district. Int. J. Commer. Bus. Manag. 2015, 8, 58–63. [Google Scholar] [CrossRef]
- Zenginbal, H.; Eşitken, A. Effects of the application of various substances and grafting methods on the grafting success and growth of black mulberry (Morus nigra L.). Acta Sci. Pol. Hortorum Cultus 2016, 15, 99–109. [Google Scholar]
- Zhang, H.H.; Li, X.; Zhang, S.B.; Yin, Z.P.; Zhu, W.X.; Li, J.B.; Meng, L.; Zhong, H.X.; Xu, N.; Wu, Y.N.; et al. Rootstock Alleviates Salt Stress in Grafted Mulberry Seedlings: Physiological and PSII Function Responses. Front. Plant Sci. 2018, 9, 1806. [Google Scholar] [CrossRef]
- Zahoor, R.; Dong, H.; Abid, M.; Zhao, W.; Wang, Y.; Zhou, Z. Potassium fertilizer improves drought stress alleviation potential in cotton by enhancing photosynthesis and carbohydrate metabolism. Environ. Exp. Bot. 2017, 137, 73–83. [Google Scholar] [CrossRef]
- Lan, Y.; Song, Y.; Zhao, F.; Cao, Y.; Luo, D.; Qiao, D.; Cao, Y.; Xu, H. Phylogenetic, Structural and Functional Evolution of the LHC Gene Family in Plant Species. Int. J. Mol. Sci. 2022, 24, 488. [Google Scholar] [CrossRef]
- Jiang, Q.; Xu, Z.S.; Wang, F.; Li, M.Y.; Ma, J.; Xiong, A.S. Effects of abiotic stresses on the expression of Lhcb1 gene and photosynthesis of Oenanthe javanica and Apium graveolens. Biol. Plant. 2014, 58, 256–264. [Google Scholar] [CrossRef]
- de Bianchi, S.; Betterle, N.; Kouril, R.; Cazzaniga, S.; Boekema, E.; Bassi, R.; Dall’Osto, L. Arabidopsis mutants deleted in the light-harvesting protein Lhcb4 have a disrupted photosystem II macrostructure and are defective in photoprotection. Plant Cell 2011, 23, 2659–2679. [Google Scholar] [CrossRef] [PubMed]
- Chen, Y.E.; Ma, J.; Wu, N.; Su, Y.Q.; Zhang, Z.W.; Yuan, M.; Zhang, H.Y.; Zeng, X.Y.; Yuan, S. The roles of Arabidopsis proteins of Lhcb4, Lhcb5 and Lhcb6 in oxidative stress under natural light conditions. Plant Physiol. Biochem. 2018, 130, 267–276. [Google Scholar] [CrossRef] [PubMed]
- Deng, Y.S.; Kong, F.Y.; Zhou, B.; Zhang, S.; Yue, M.M.; Meng, Q.W. Heterology expression of the tomato LeLhcb2 gene confers elevated tolerance to chilling stress in transgenic tobacco. Plant Physiol. Biochem. 2014, 80, 318–327. [Google Scholar] [CrossRef] [PubMed]
- Voss, I.; Koelmann, M.; Wojtera, J.; Holtgrefe, S.; Kitzmann, C.; Backhausen, J.E.; Scheibe, R. Knockout of major leaf ferredoxin reveals new redox-regulatory adaptations in Arabidopsis thaliana. Physiol. Plant 2008, 133, 584–598. [Google Scholar] [CrossRef]
- Yamori, W.; Kusumi, K.; Iba, K.; Terashima, I. Increased stomatal conductance induces rapid changes to photosynthetic rate in response to naturally fluctuating light conditions in rice. Plant Cell Environ. 2020, 43, 1230–1240. [Google Scholar] [CrossRef]
- Yang, X.H.; Chen, L.S.; Cheng, L.L. Leaf Photosynthesis and Carbon Metabolism Adapt to Crop Load in ‘Gala’ Apple Trees. Horticulturae 2021, 7, 47. [Google Scholar] [CrossRef]
- Treves, H.; Kuken, A.; Arrivault, S.; Ishihara, H.; Hoppe, I.; Erban, A.; Hohne, M.; Moraes, T.A.; Kopka, J.; Szymanski, J.; et al. Carbon flux through photosynthesis and central carbon metabolism show distinct patterns between algae, C-3 and C-4 plants. Nat. Plants 2022, 8, 78–91. [Google Scholar] [CrossRef]
- Rho, H.; Yu, D.J.; Kim, S.J.; Lee, H.J. Limitation Factors for Photosynthesis in ‘Bluecrop’ Highbush Blueberry (Vaccinium corymbosum) Leaves in Response to Moderate Water Stress. J. Plant Biol. 2012, 55, 450–457. [Google Scholar] [CrossRef]
- Hazrati, S.; Tahmasebi-Sarvestani, Z.; Modarres-Sanavy, S.A.M.; Mokhtassi-Bidgoli, A.; Nicola, S. Effects of water stress and light intensity on chlorophyll fluorescence parameters and pigments of Aloe vera L. Plant Physiol. Bioch. 2016, 106, 141–148. [Google Scholar] [CrossRef]
- Pinnola, A.; Bassi, R. Molecular mechanisms involved in plant photoprotection. Biochem. Soc. T 2018, 46, 467–482. [Google Scholar] [CrossRef] [PubMed]
- Liu, Y.; Ji, D.F.; Turgeon, R.; Chen, J.; Lin, T.B.; Huang, J.; Luo, J.; Zhu, Y.; Zhang, C.K.; Lv, Z.Q. Physiological and Proteomic Responses of Mulberry Trees (Morus alba. L.) to Combined Salt and Drought Stress. Int. J. Mol. Sci. 2019, 20, 2486. [Google Scholar] [CrossRef] [PubMed]
- Mohan, R.; Kaur, T.; Bhat, H.A.; Khajuria, M.; Pal, S.; Vyas, D. Paclobutrazol Induces Photochemical Efficiency in Mulberry (Morus alba L.) Under Water Stress and Affects Leaf Yield Without Influencing Biotic Interactions. J. Plant Growth Regul. 2020, 39, 205–215. [Google Scholar] [CrossRef]
- Bhusal, N.; Adhikari, A.; Lee, M.; Han, A.; Han, A.R.; Kim, H.S. Evaluation of growth responses of six gymnosperm species under long-term excessive irrigation and traits determining species resistance to waterlogging. Agric. For. Meteorol. 2022, 323, 109071. [Google Scholar] [CrossRef]
- Bhusal, N.; Han, S.-G.; Yoon, T.-M. Impact of drought stress on photosynthetic response, leaf water potential, and stem sap flow in two cultivars of bi-leader apple trees (Malus × domestica Borkh.). Sci. Hortic. 2019, 246, 535–543. [Google Scholar] [CrossRef]
- Ren, B.Z.; Hu, J.; Zhang, J.W.; Dong, S.T.; Liu, P.; Zhao, B. Effects of urea mixed with nitrapyrin on leaf photosynthetic and senescence characteristics of summer maize (Zea mays L.) waterlogged in the field. J. Integr. Agric. 2020, 19, 1586–1595. [Google Scholar] [CrossRef]
- Wollmer, A.C.; Pitann, B.; Muhling, K.H. Waterlogging events during stem elongation or flowering affect yield of oilseed rape (Brassica napus L.) but not seed quality. J. Agron. Crop. Sci. 2018, 204, 165–174. [Google Scholar] [CrossRef]
- Blokhina, O.; Virolainen, E.; Fagerstedt, K.V. Antioxidants, oxidative damage and oxygen deprivation stress: A review. Ann. Bot. 2003, 91, 179–194. [Google Scholar] [CrossRef]
- Alscher, R.G.; Erturk, N.; Heath, L.S. Role of superoxide dismutases (SODs) in controlling oxidative stress in plants. J. Exp. Bot. 2002, 53, 1331–1341. [Google Scholar] [CrossRef]
- Apel, K.; Hirt, H. Reactive oxygen species: Metabolism, oxidative stress, and signal transduction. Annu. Rev. Plant Biol. 2004, 55, 373–399. [Google Scholar] [CrossRef]
- Bailey-Serres, J.; Voesenek, L.A. Flooding stress: Acclimations and genetic diversity. Annu. Rev. Plant Biol. 2008, 59, 313–339. [Google Scholar] [CrossRef]
- Zhang, Z.H.; Liu, Y.; Cao, B.L.; Chen, Z.J.; Xu, K. The effectiveness of grafting to improve drought tolerance in tomato. Plant Growth Regul. 2020, 91, 157–167. [Google Scholar] [CrossRef]
- Pagliarani, C.; Vitali, M.; Ferrero, M.; Vitulo, N.; Incarbone, M.; Lovisolo, C.; Valle, G.; Schubert, A. The Accumulation of miRNAs Differentially Modulated by Drought Stress Is Affected by Grafting in Grapevine. Plant Physiol. 2017, 173, 2180–2195. [Google Scholar] [CrossRef] [PubMed]
- Nawaz, M.A.; Chen, C.; Shireen, F.; Zheng, Z.H.; Jiao, Y.Y.; Sohail, H.; Afzal, M.; Imtiaz, M.; Ali, M.A.; Huang, Y.; et al. Improving vanadium stress tolerance of watermelon by grafting onto bottle gourd and pumpkin rootstock. Plant Growth Regul. 2018, 85, 41–56. [Google Scholar] [CrossRef]
- Jia, C.S.; Cao, D.D.; Ji, S.P.; Lin, W.T.; Zhang, X.M.; Muhoza, B. Whey protein isolate conjugated with xylo-oligosaccharides via maillard reaction: Characterization, antioxidant capacity, and application for lycopene microencapsulation. LWT-Food Sci. Technol. 2020, 118, 108837. [Google Scholar] [CrossRef]
- Dao, T.T.; Linthorst, H.J.; Verpoorte, R. Chalcone synthase and its functions in plant resistance. Phytochem. Rev. 2011, 10, 397–412. [Google Scholar] [CrossRef]
- Sinha, A.K.; Jaggi, M.; Raghuram, B.; Tuteja, N. Mitogen-activated protein kinase signaling in plants under abiotic stress. Plant Signal Behav. 2011, 6, 196–203. [Google Scholar] [CrossRef]
- Zhang, H.; Zhu, J.; Gong, Z.; Zhu, J.K. Abiotic stress responses in plants. Nat. Rev. Genet 2022, 23, 104–119. [Google Scholar] [CrossRef]
- Hori, K.; Matsubara, K.; Yano, M. Genetic control of flowering time in rice: Integration of Mendelian genetics and genomics. Theor. Appl. Genet 2016, 129, 2241–2252. [Google Scholar] [CrossRef]
- Zhao, Y.; Li, Y.S.; Gao, X.F. A New Method for Accurate Determination of Peroxidase Activity Based on Fluorescence Decrease of Guaiacol. Chinese J. Anal. Chem. 2015, 43, 1040–1046. [Google Scholar]
- Chen, S.F.; Zhou, Y.Q.; Chen, Y.R.; Gu, J. fastp: An ultra-fast all-in-one FASTQ preprocessor. Bioinformatics 2018, 34, 884–890. [Google Scholar] [CrossRef] [PubMed]
- He, N.; Zhang, C.; Qi, X.; Zhao, S.; Tao, Y.; Yang, G.; Lee, T.H.; Wang, X.; Cai, Q.; Li, D.; et al. Draft genome sequence of the mulberry tree Morus notabilis. Nat. Commun. 2013, 4, 2445. [Google Scholar] [CrossRef] [PubMed]
- Love, M.I.; Huber, W.; Anders, S. Moderated estimation of fold change and dispersion for RNA-seq data with DESeq2. Genome Biol. 2014, 15, 550. [Google Scholar] [CrossRef] [PubMed]


Disclaimer/Publisher’s Note: The statements, opinions and data contained in all publications are solely those of the individual author(s) and contributor(s) and not of MDPI and/or the editor(s). MDPI and/or the editor(s) disclaim responsibility for any injury to people or property resulting from any ideas, methods, instructions or products referred to in the content. |
© 2023 by the authors. Licensee MDPI, Basel, Switzerland. This article is an open access article distributed under the terms and conditions of the Creative Commons Attribution (CC BY) license (https://creativecommons.org/licenses/by/4.0/).
Share and Cite
Li, Y.; Huang, J.; Yu, C.; Mo, R.; Zhu, Z.; Dong, Z.; Hu, X.; Zhuang, C.; Deng, W. Physiological and Transcriptome Analyses of Photosynthesis in Three Mulberry Cultivars within Two Propagation Methods (Cutting and Grafting) under Waterlogging Stress. Plants 2023, 12, 2066. https://doi.org/10.3390/plants12112066
Li Y, Huang J, Yu C, Mo R, Zhu Z, Dong Z, Hu X, Zhuang C, Deng W. Physiological and Transcriptome Analyses of Photosynthesis in Three Mulberry Cultivars within Two Propagation Methods (Cutting and Grafting) under Waterlogging Stress. Plants. 2023; 12(11):2066. https://doi.org/10.3390/plants12112066
Chicago/Turabian StyleLi, Yong, Jin Huang, Cui Yu, Rongli Mo, Zhixian Zhu, Zhaoxia Dong, Xingming Hu, Chuxiong Zhuang, and Wen Deng. 2023. "Physiological and Transcriptome Analyses of Photosynthesis in Three Mulberry Cultivars within Two Propagation Methods (Cutting and Grafting) under Waterlogging Stress" Plants 12, no. 11: 2066. https://doi.org/10.3390/plants12112066