
The Nitrogen Dynamics of Newly Developed Lignite-Based Controlled-Release Fertilisers in the Soil-Plant Cycle
 , , ,
, , ,
Abstract
:1. Introduction
2. Results and Discussion
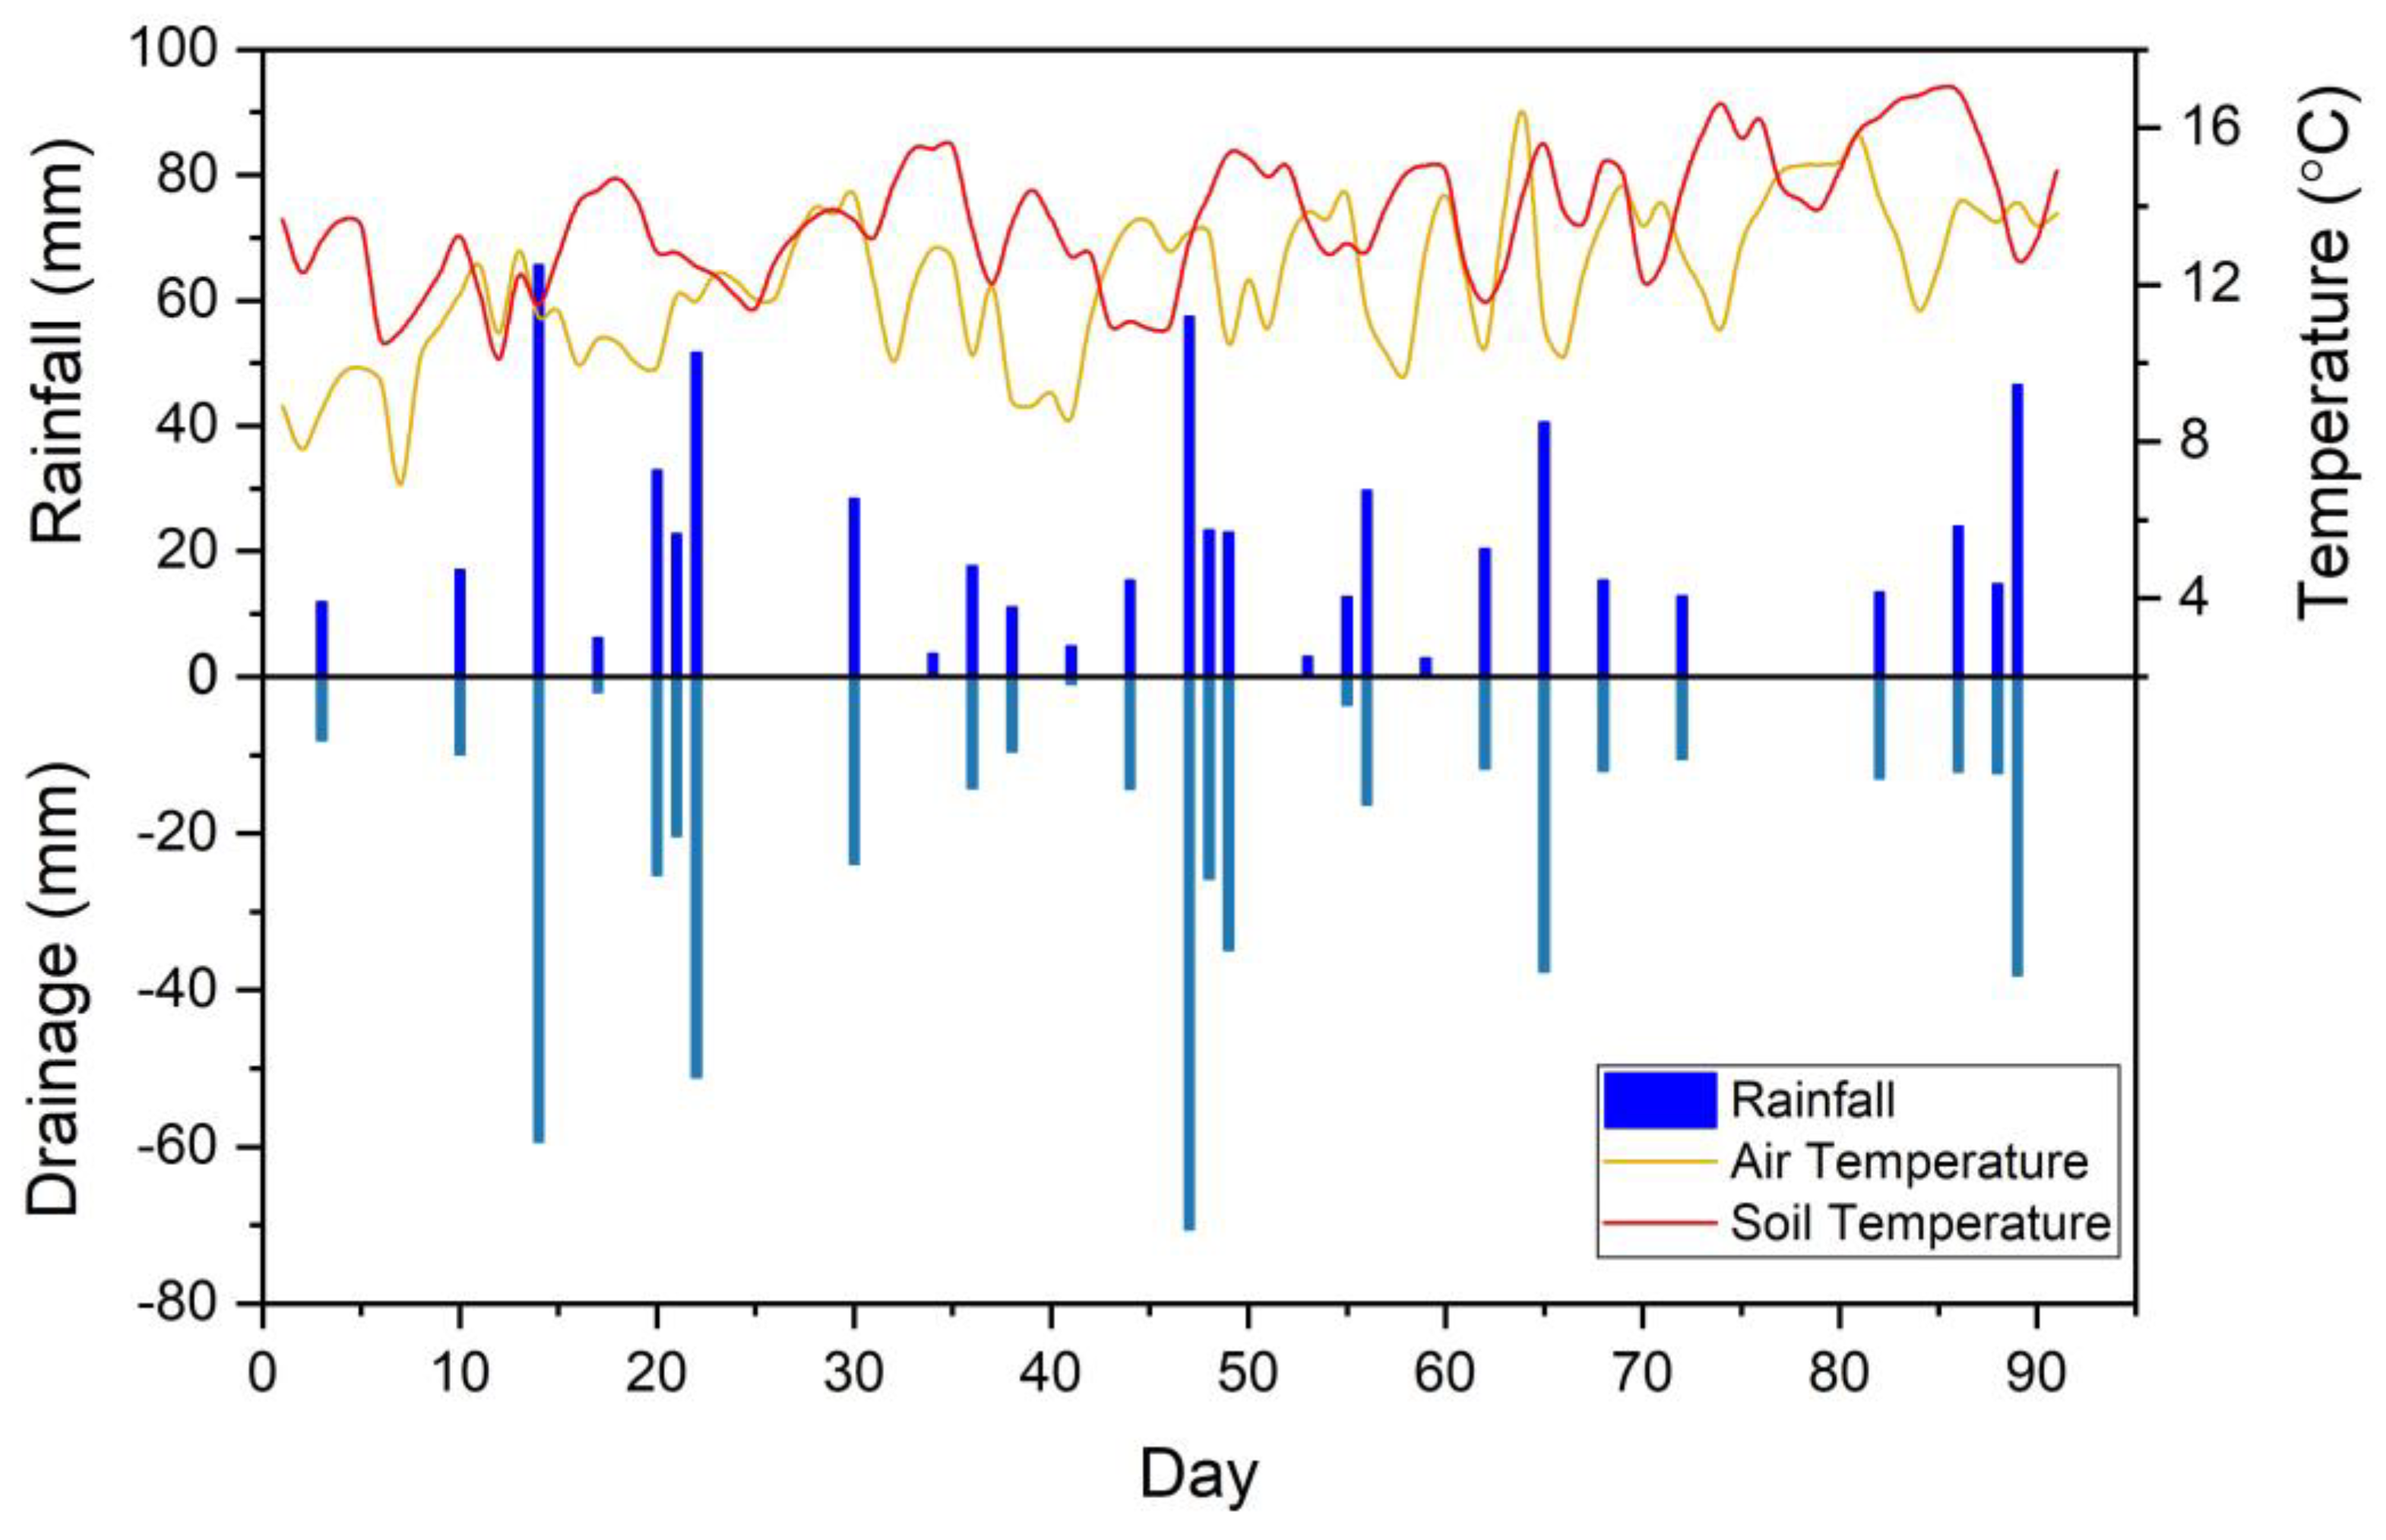
2.1. Climate Data
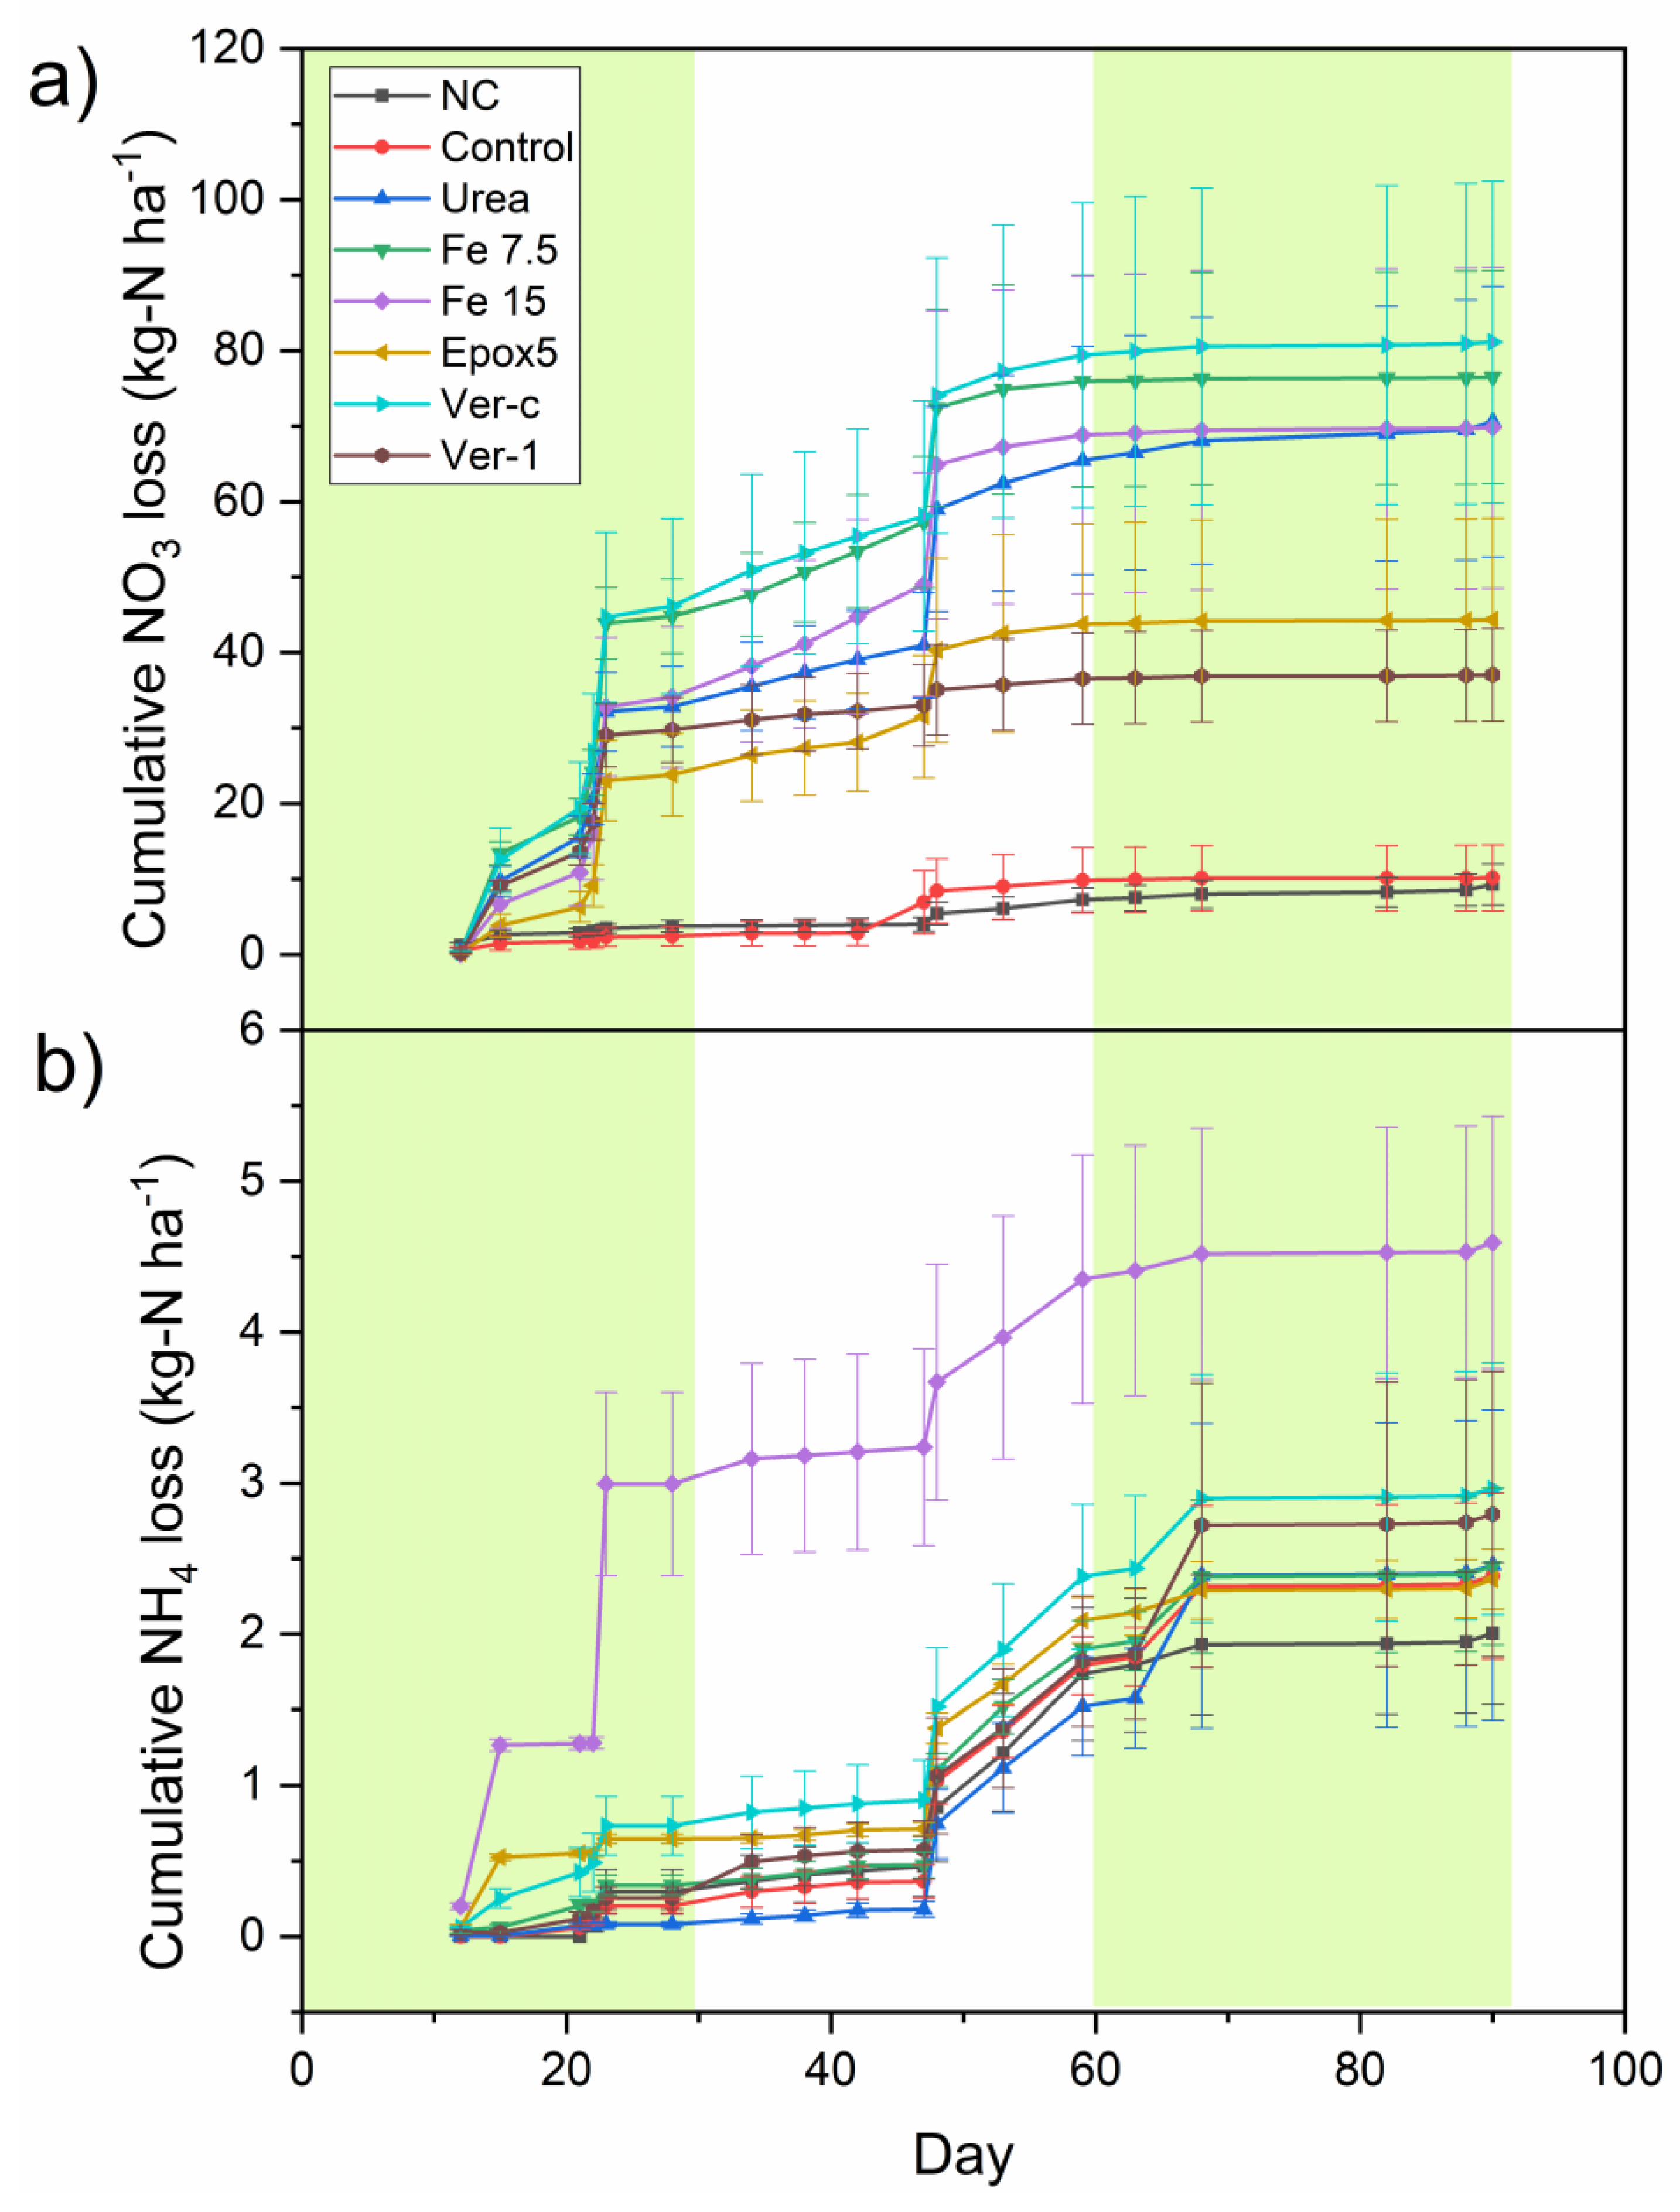
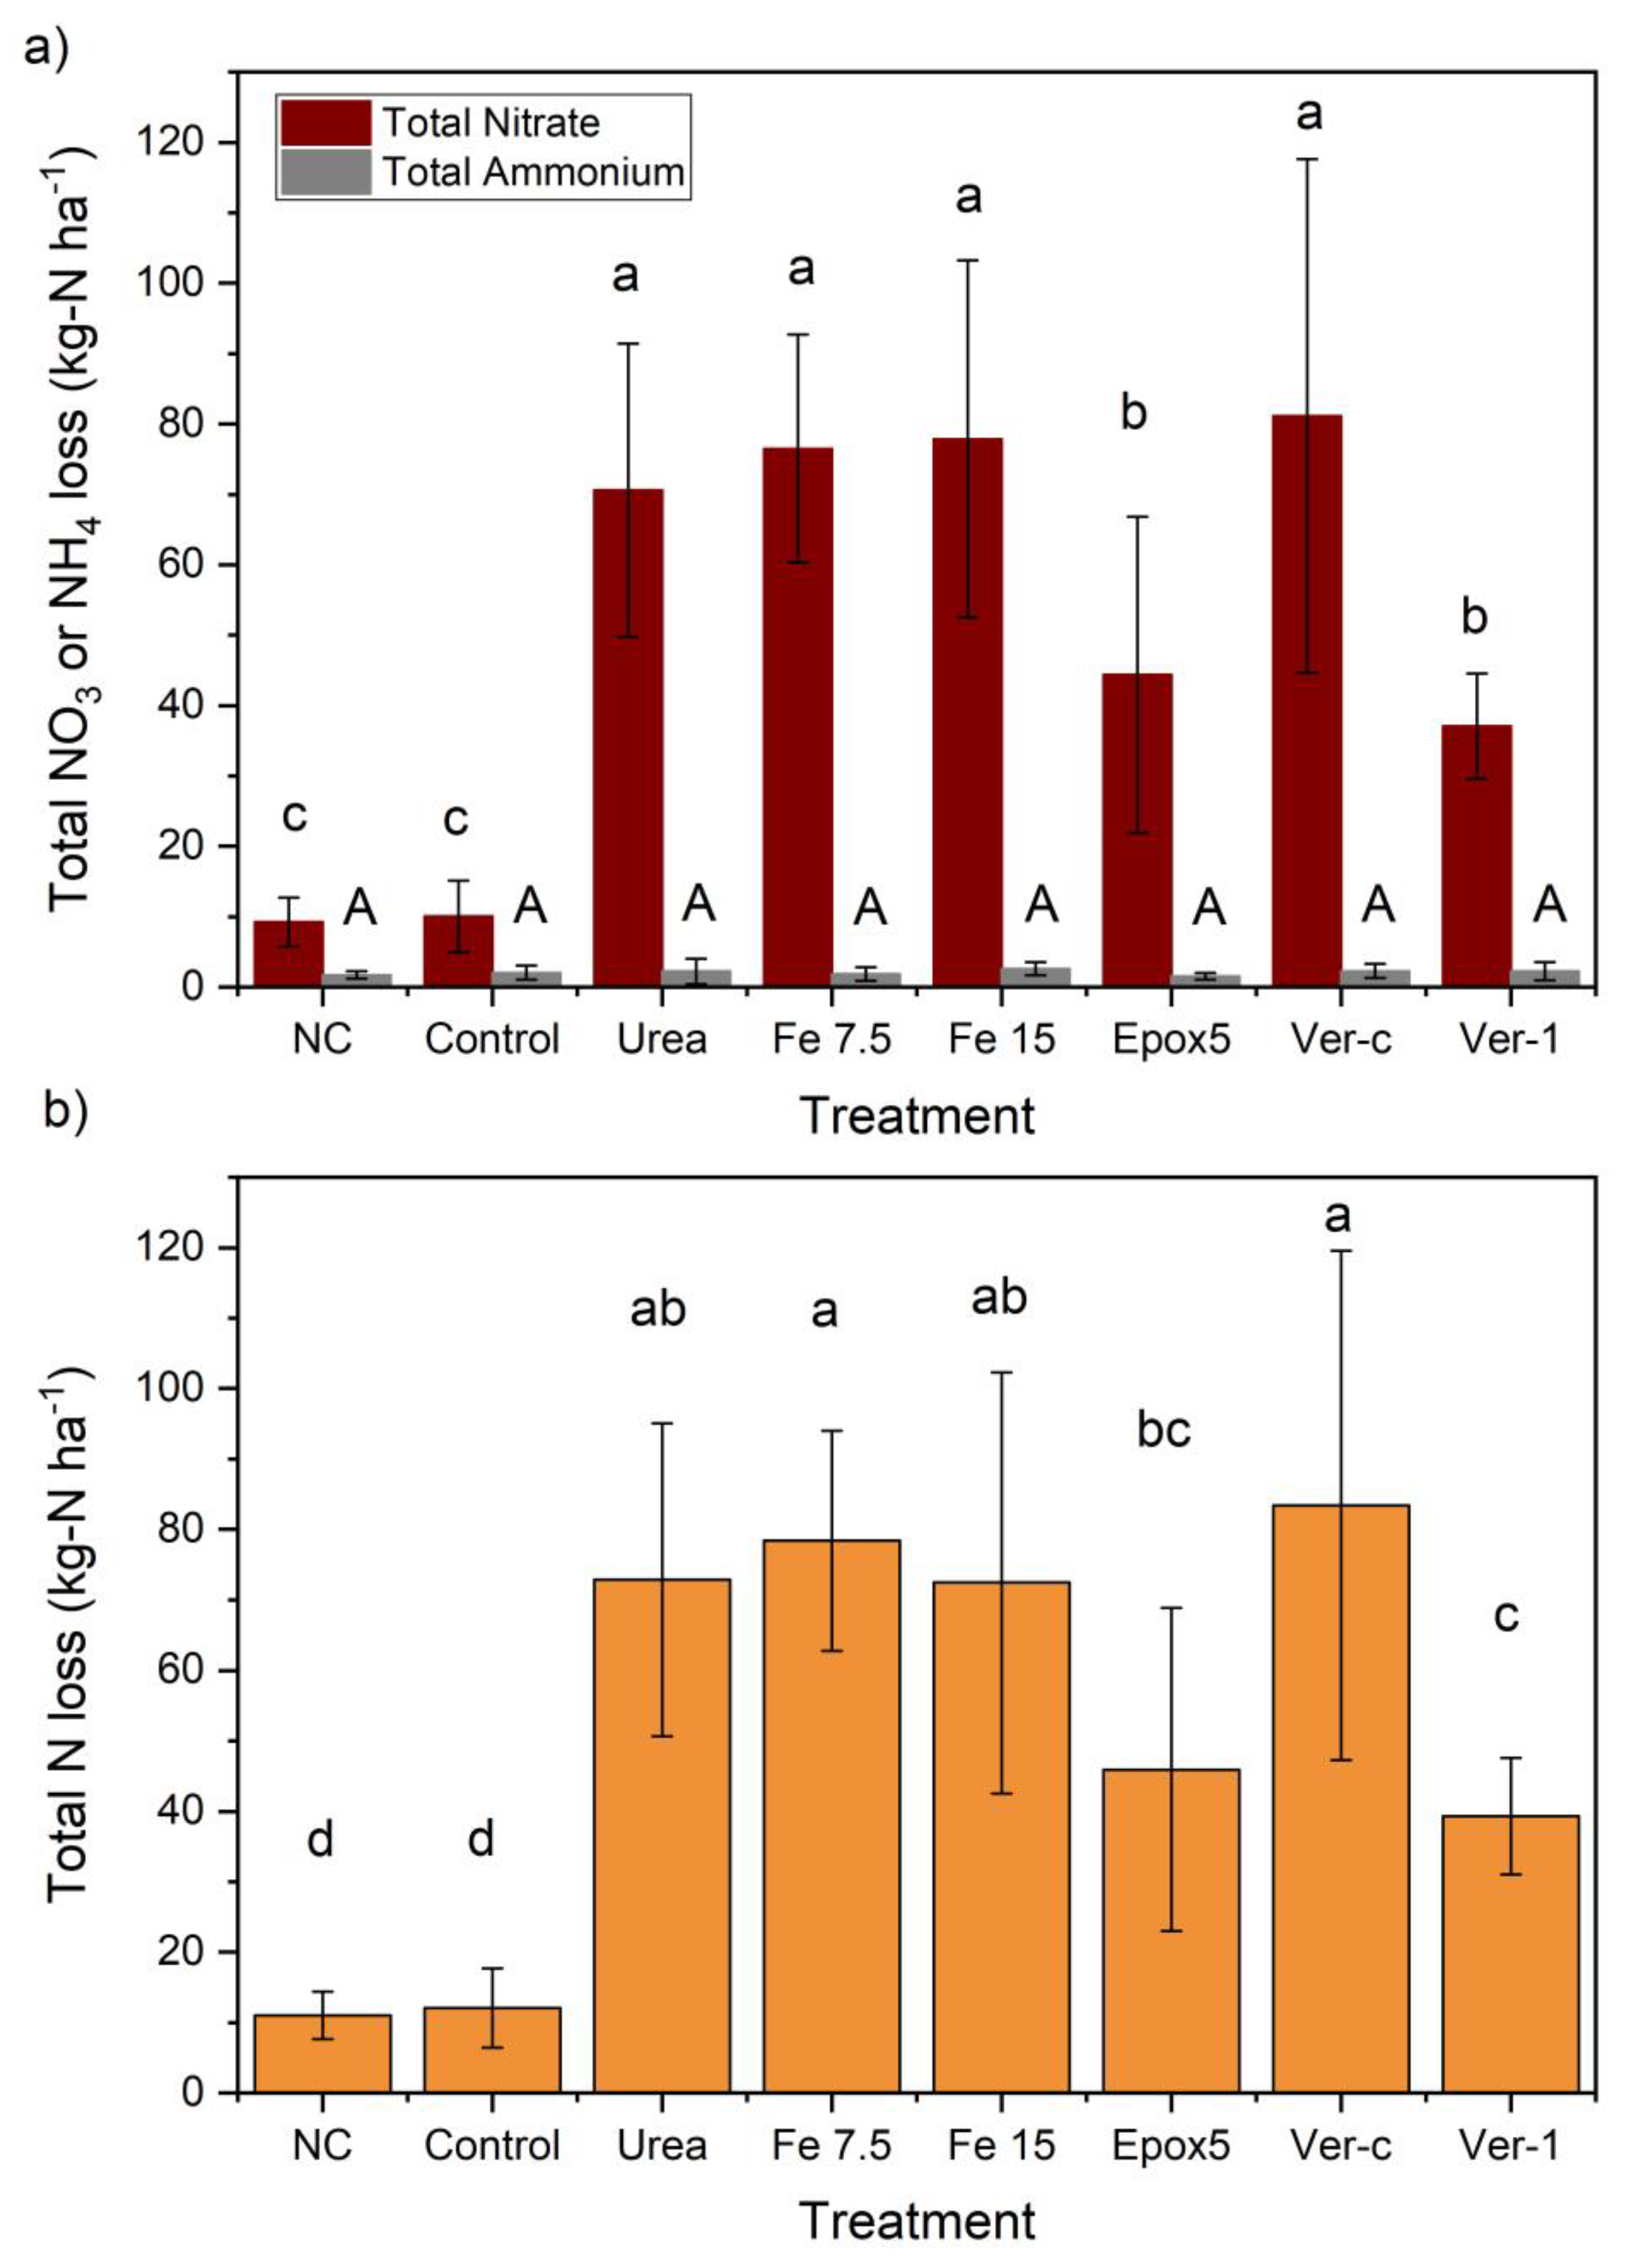
2.2. Nitrate (NO3− -N) and Ammonium (NH4+ -N) Leaching Losses
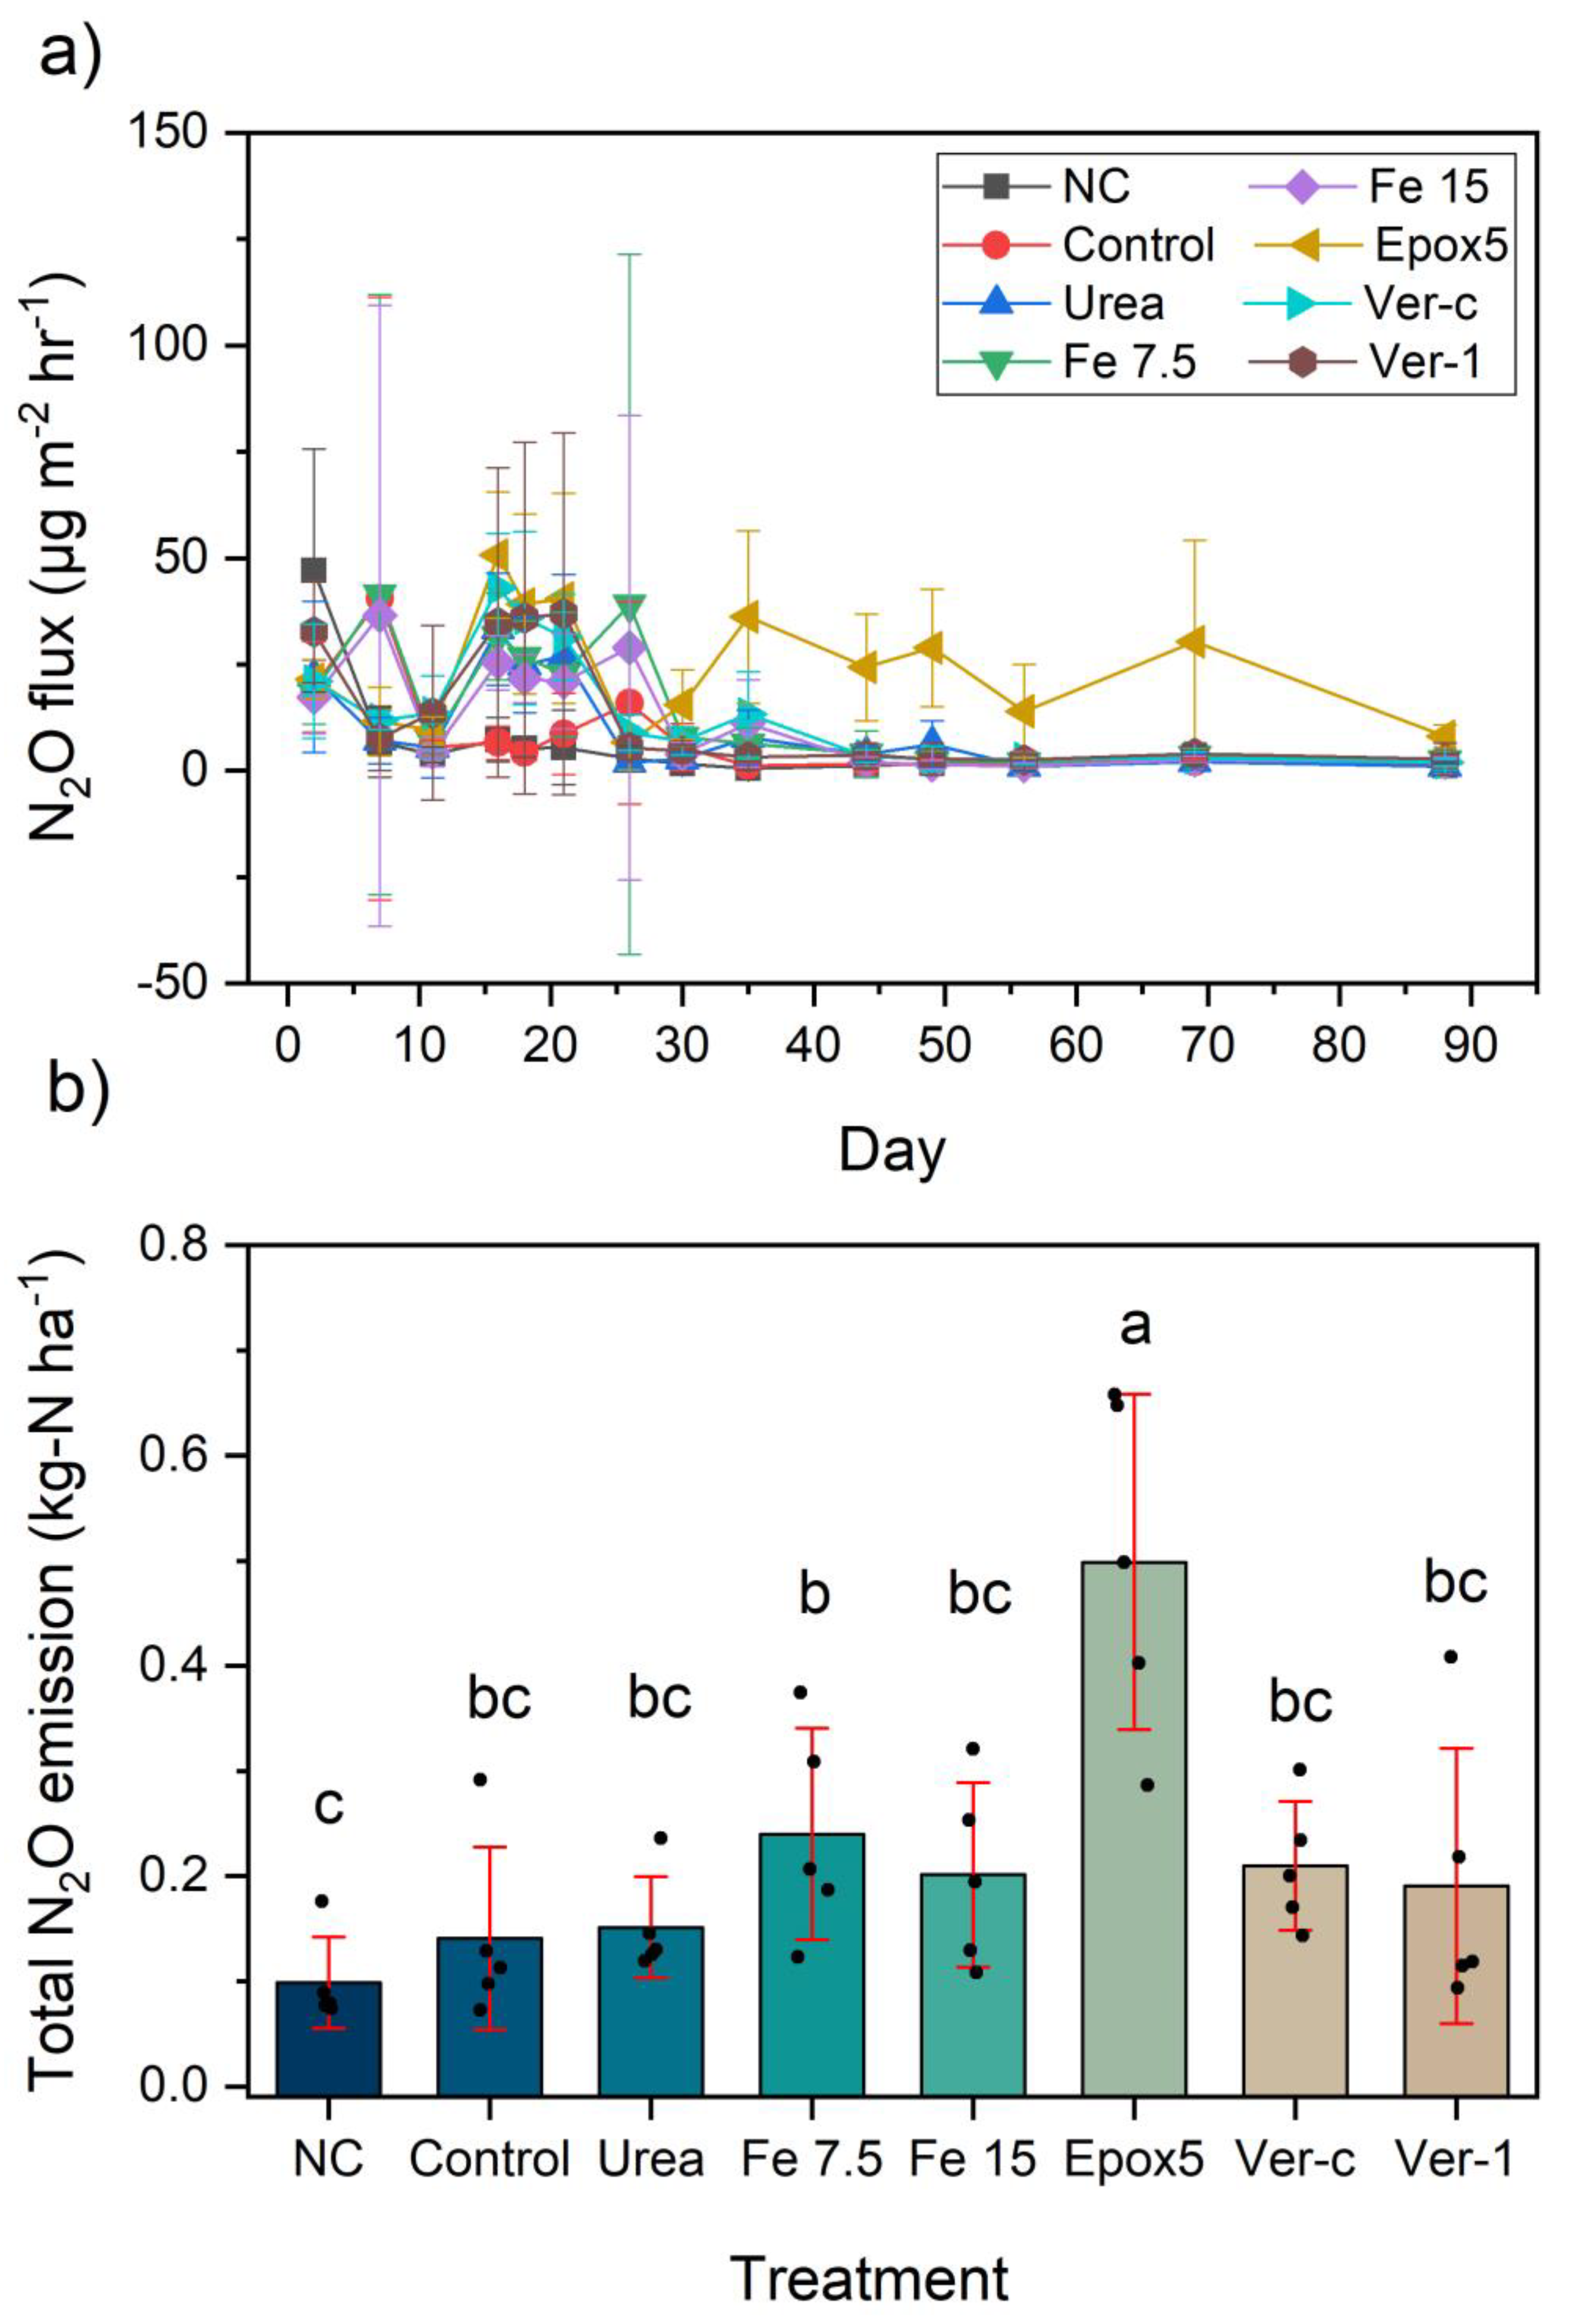
2.3. Nitrous Oxide Emission
2.4. Residual Soil Nitrogen
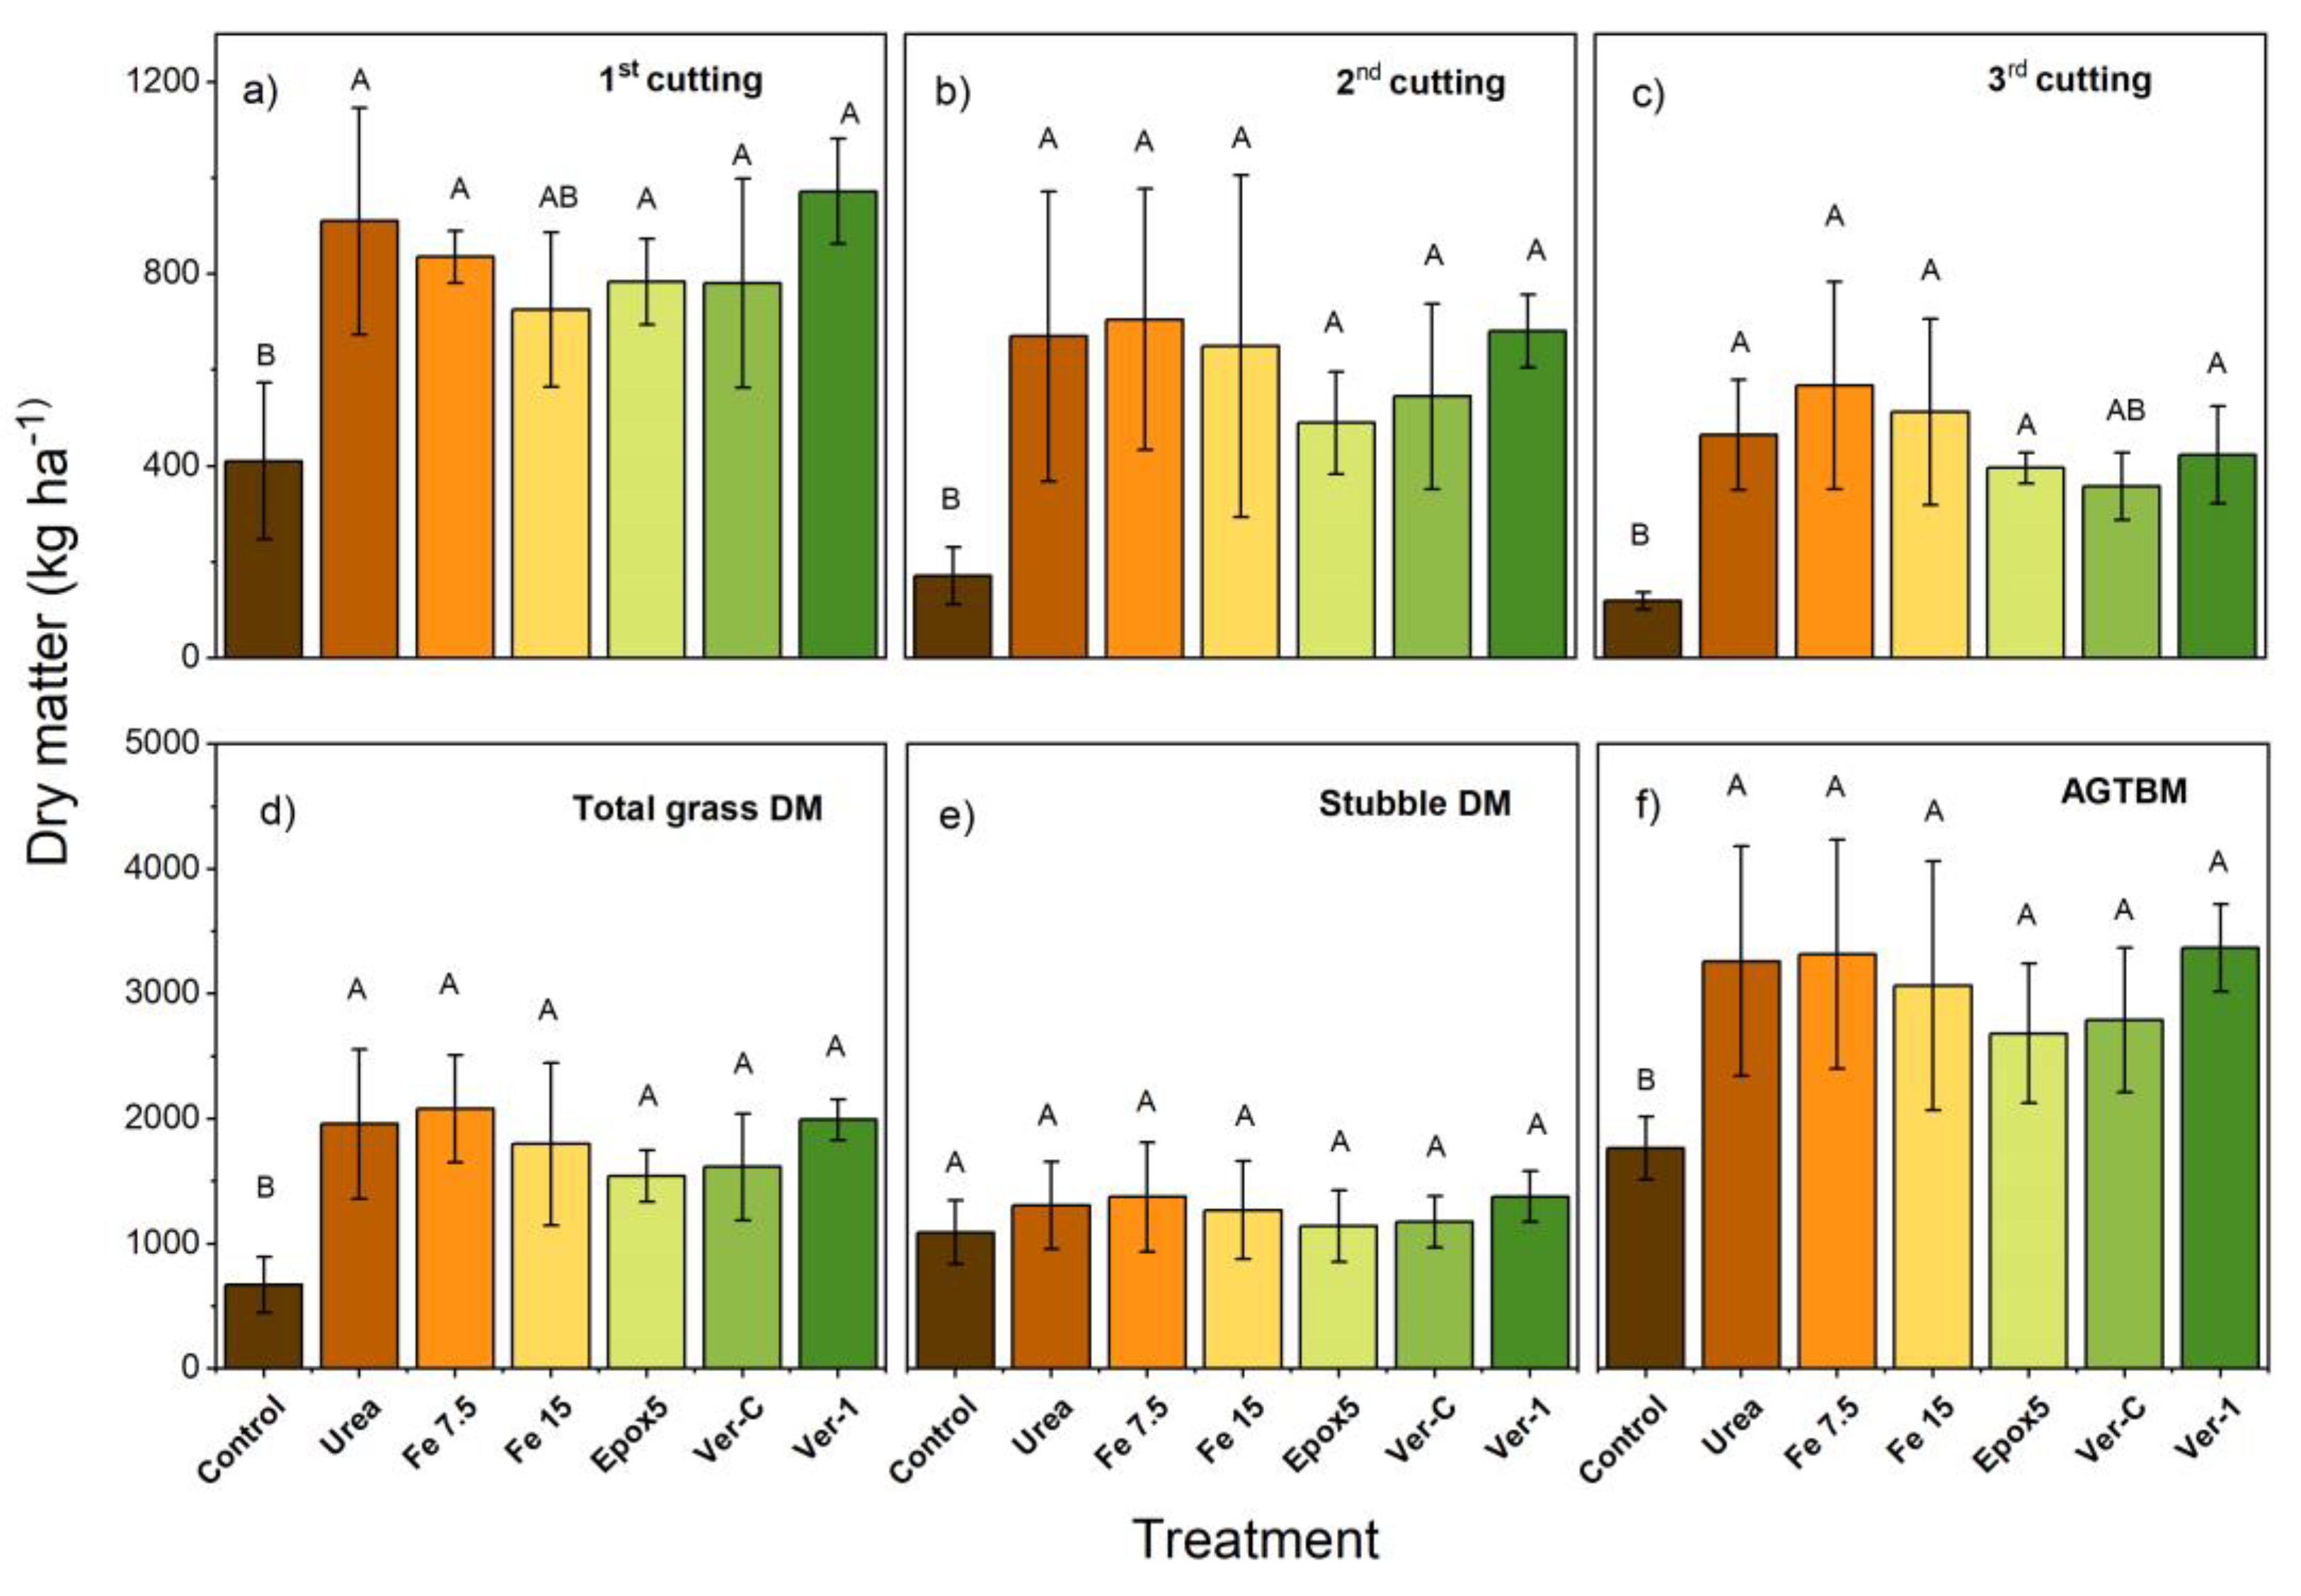
2.5. Dry Matter Yield
2.6. N Accumulation and N Utilisation Efficiencies
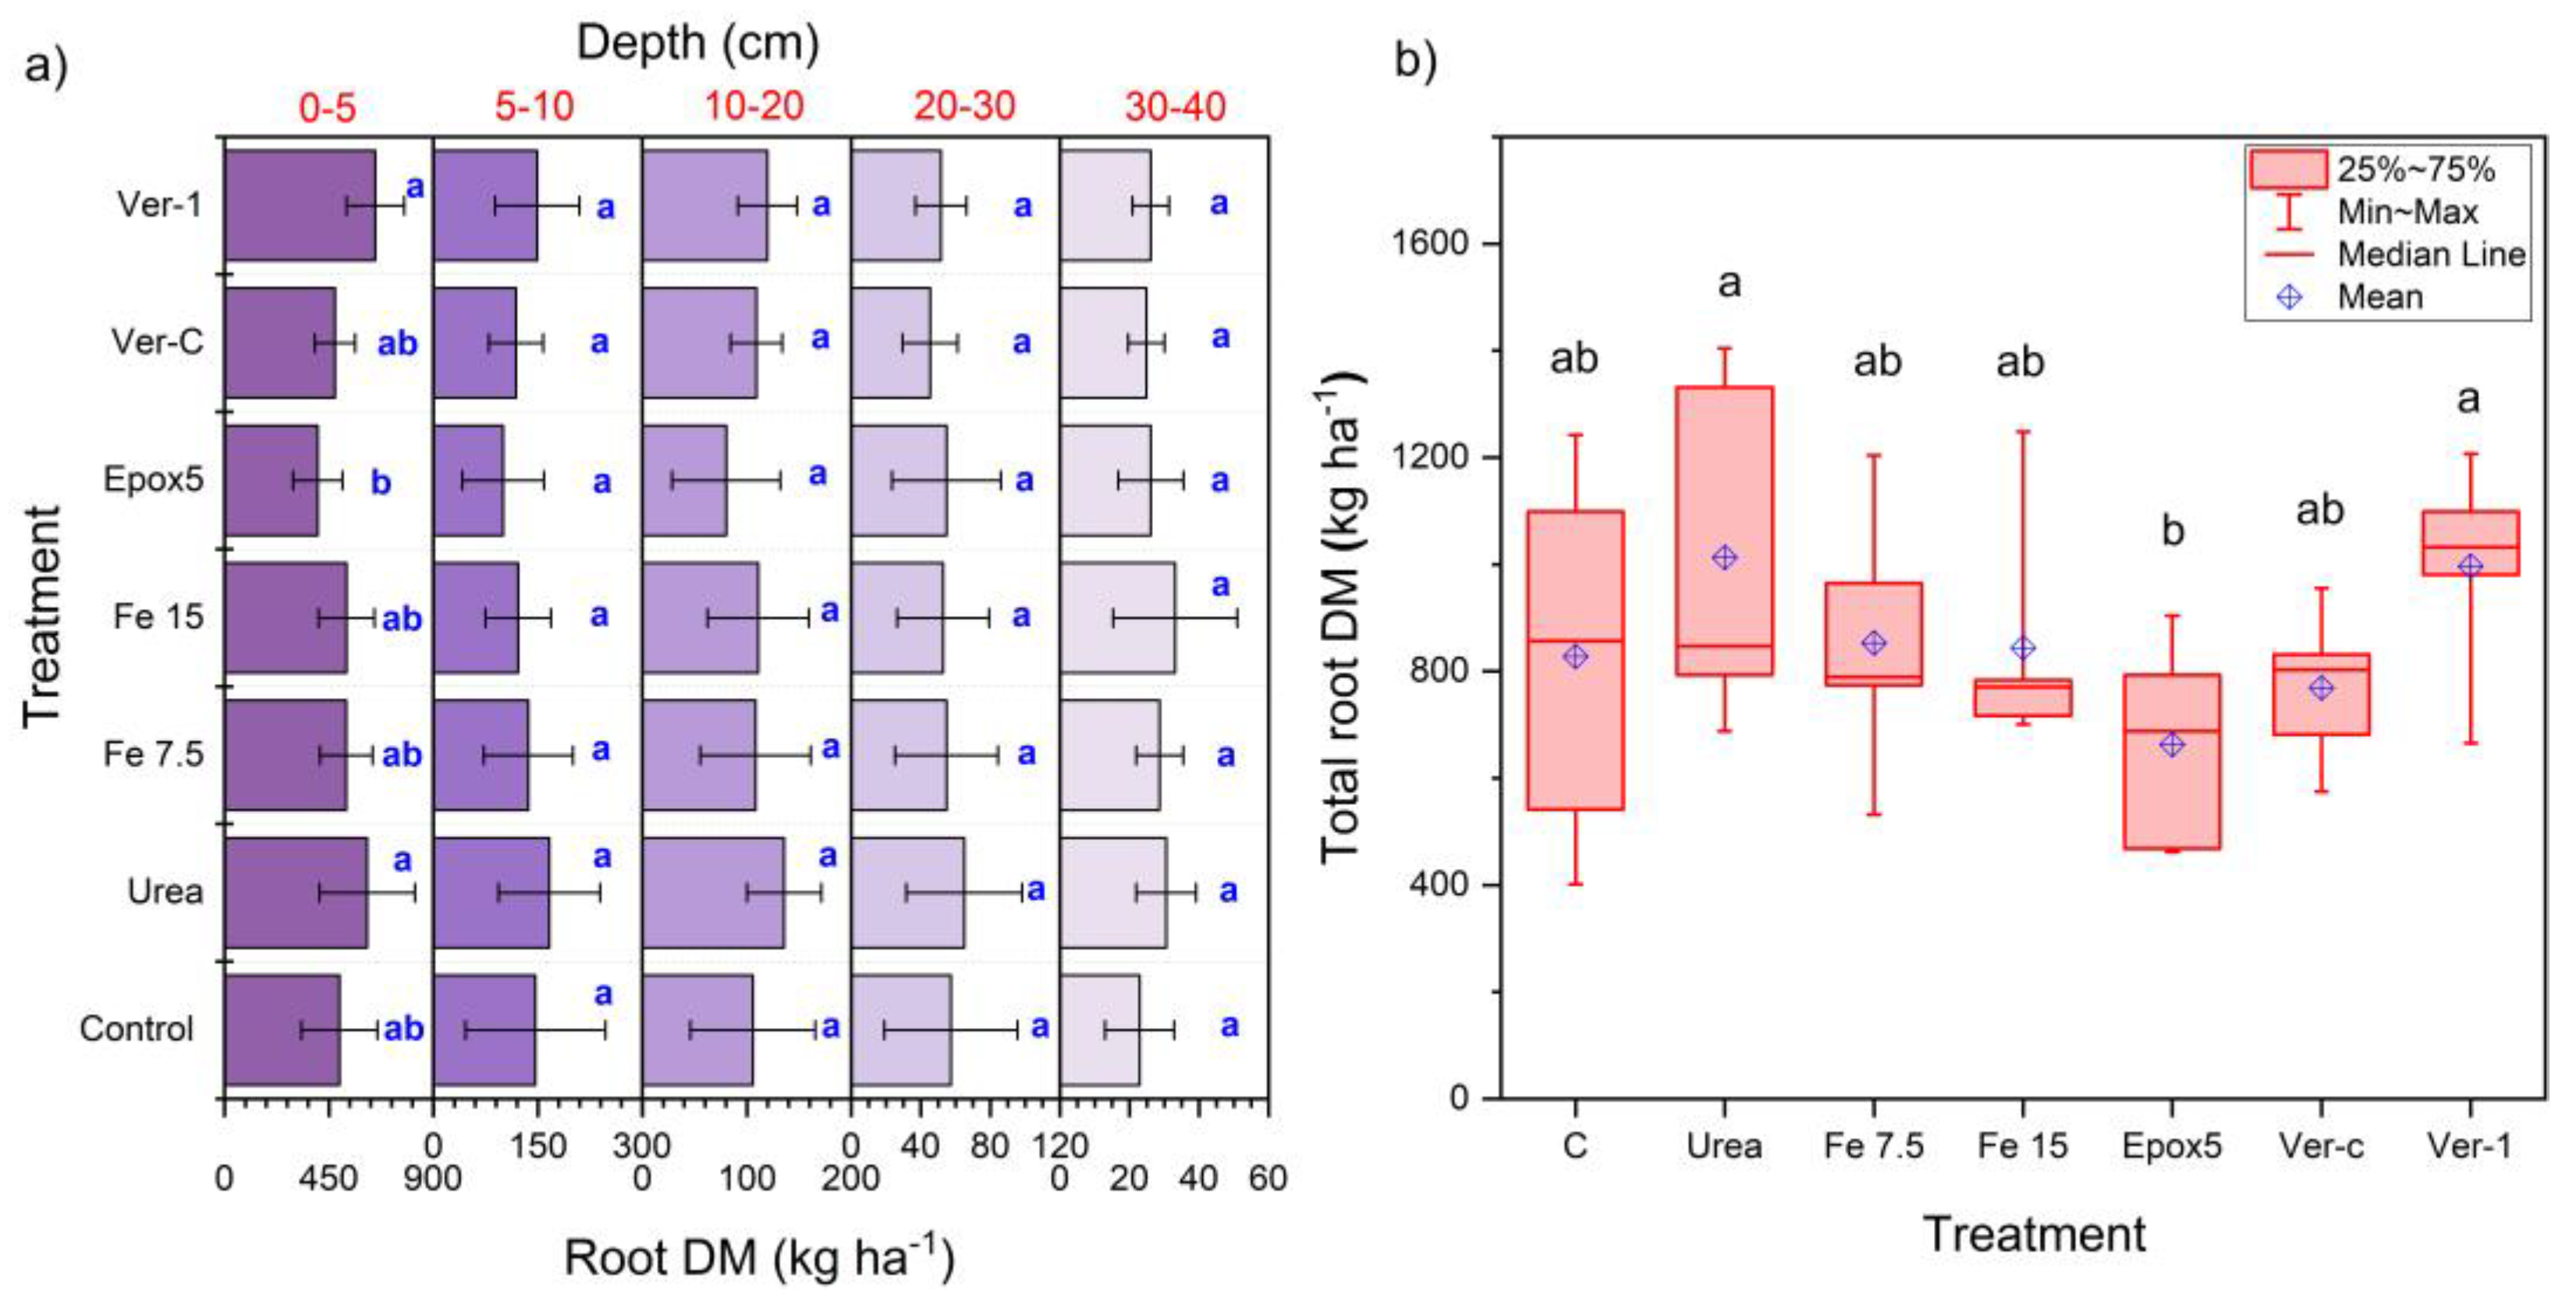
2.7. Root Dry Matter Distribution
2.8. Nitrogen Budget
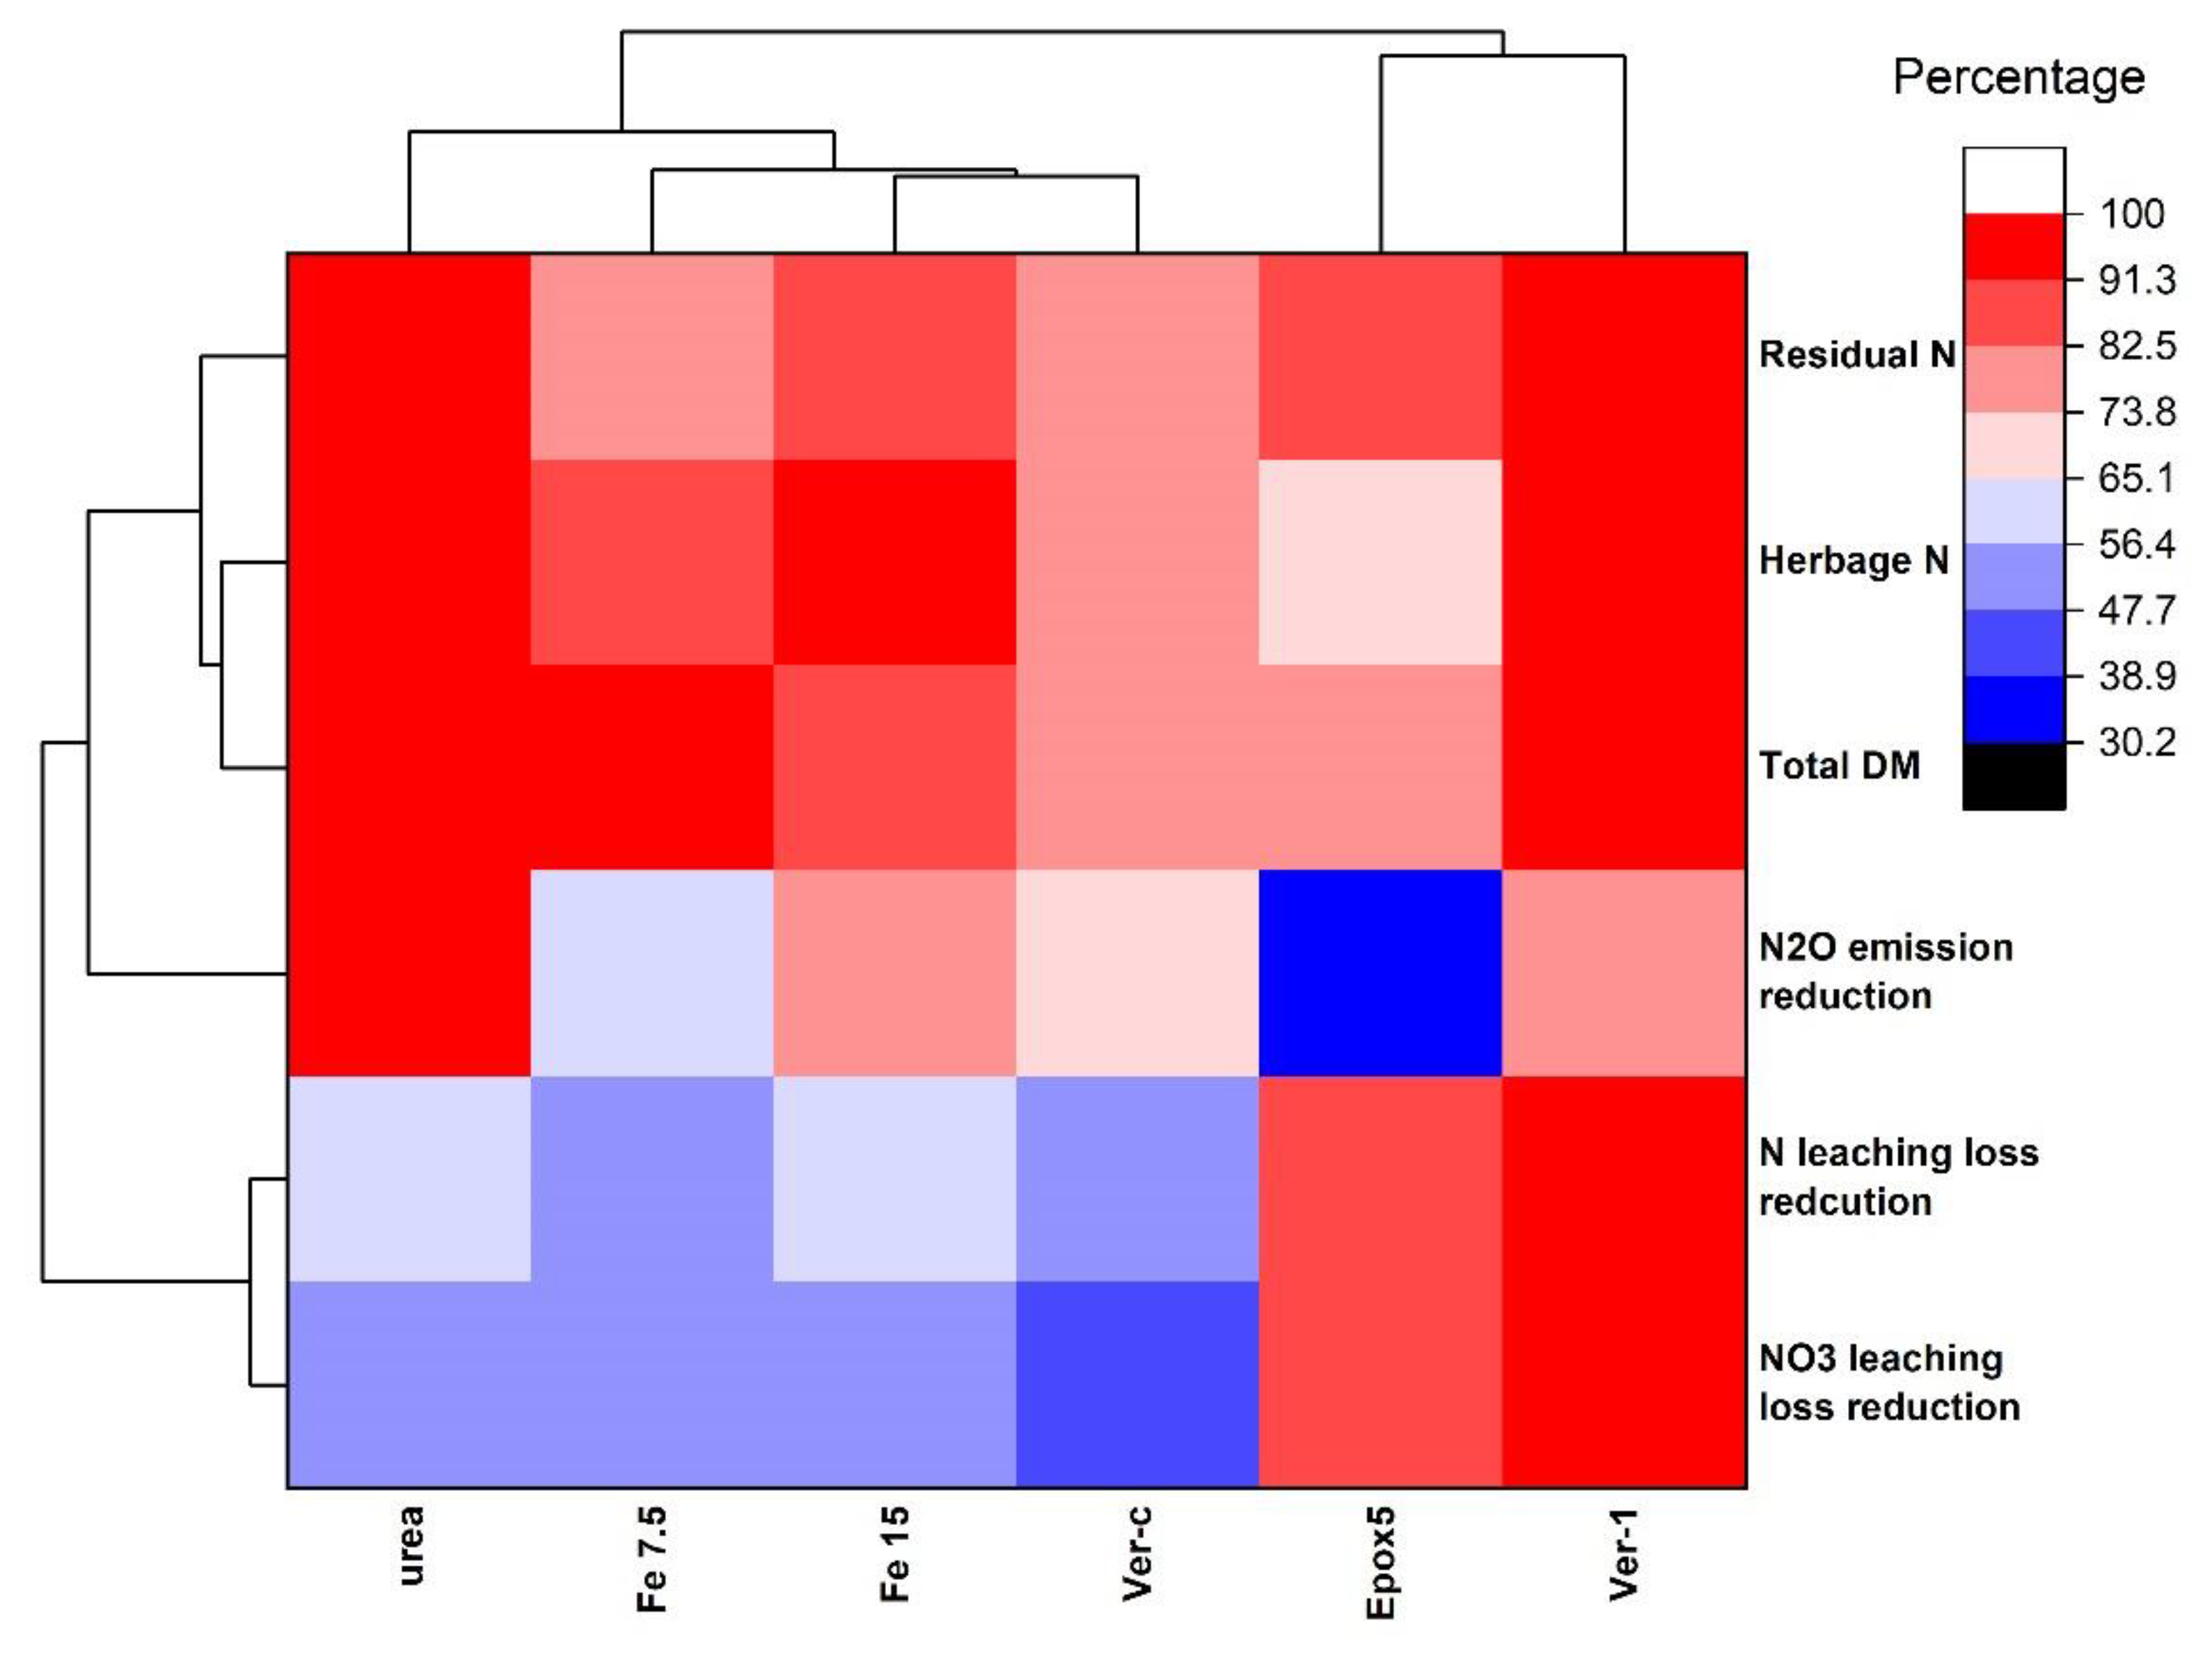
2.9. Hierarchical Clustering of the Fertiliser Treatments
2.10. Importance of the Study for Pastoral Agriculture
3. Materials and Methods
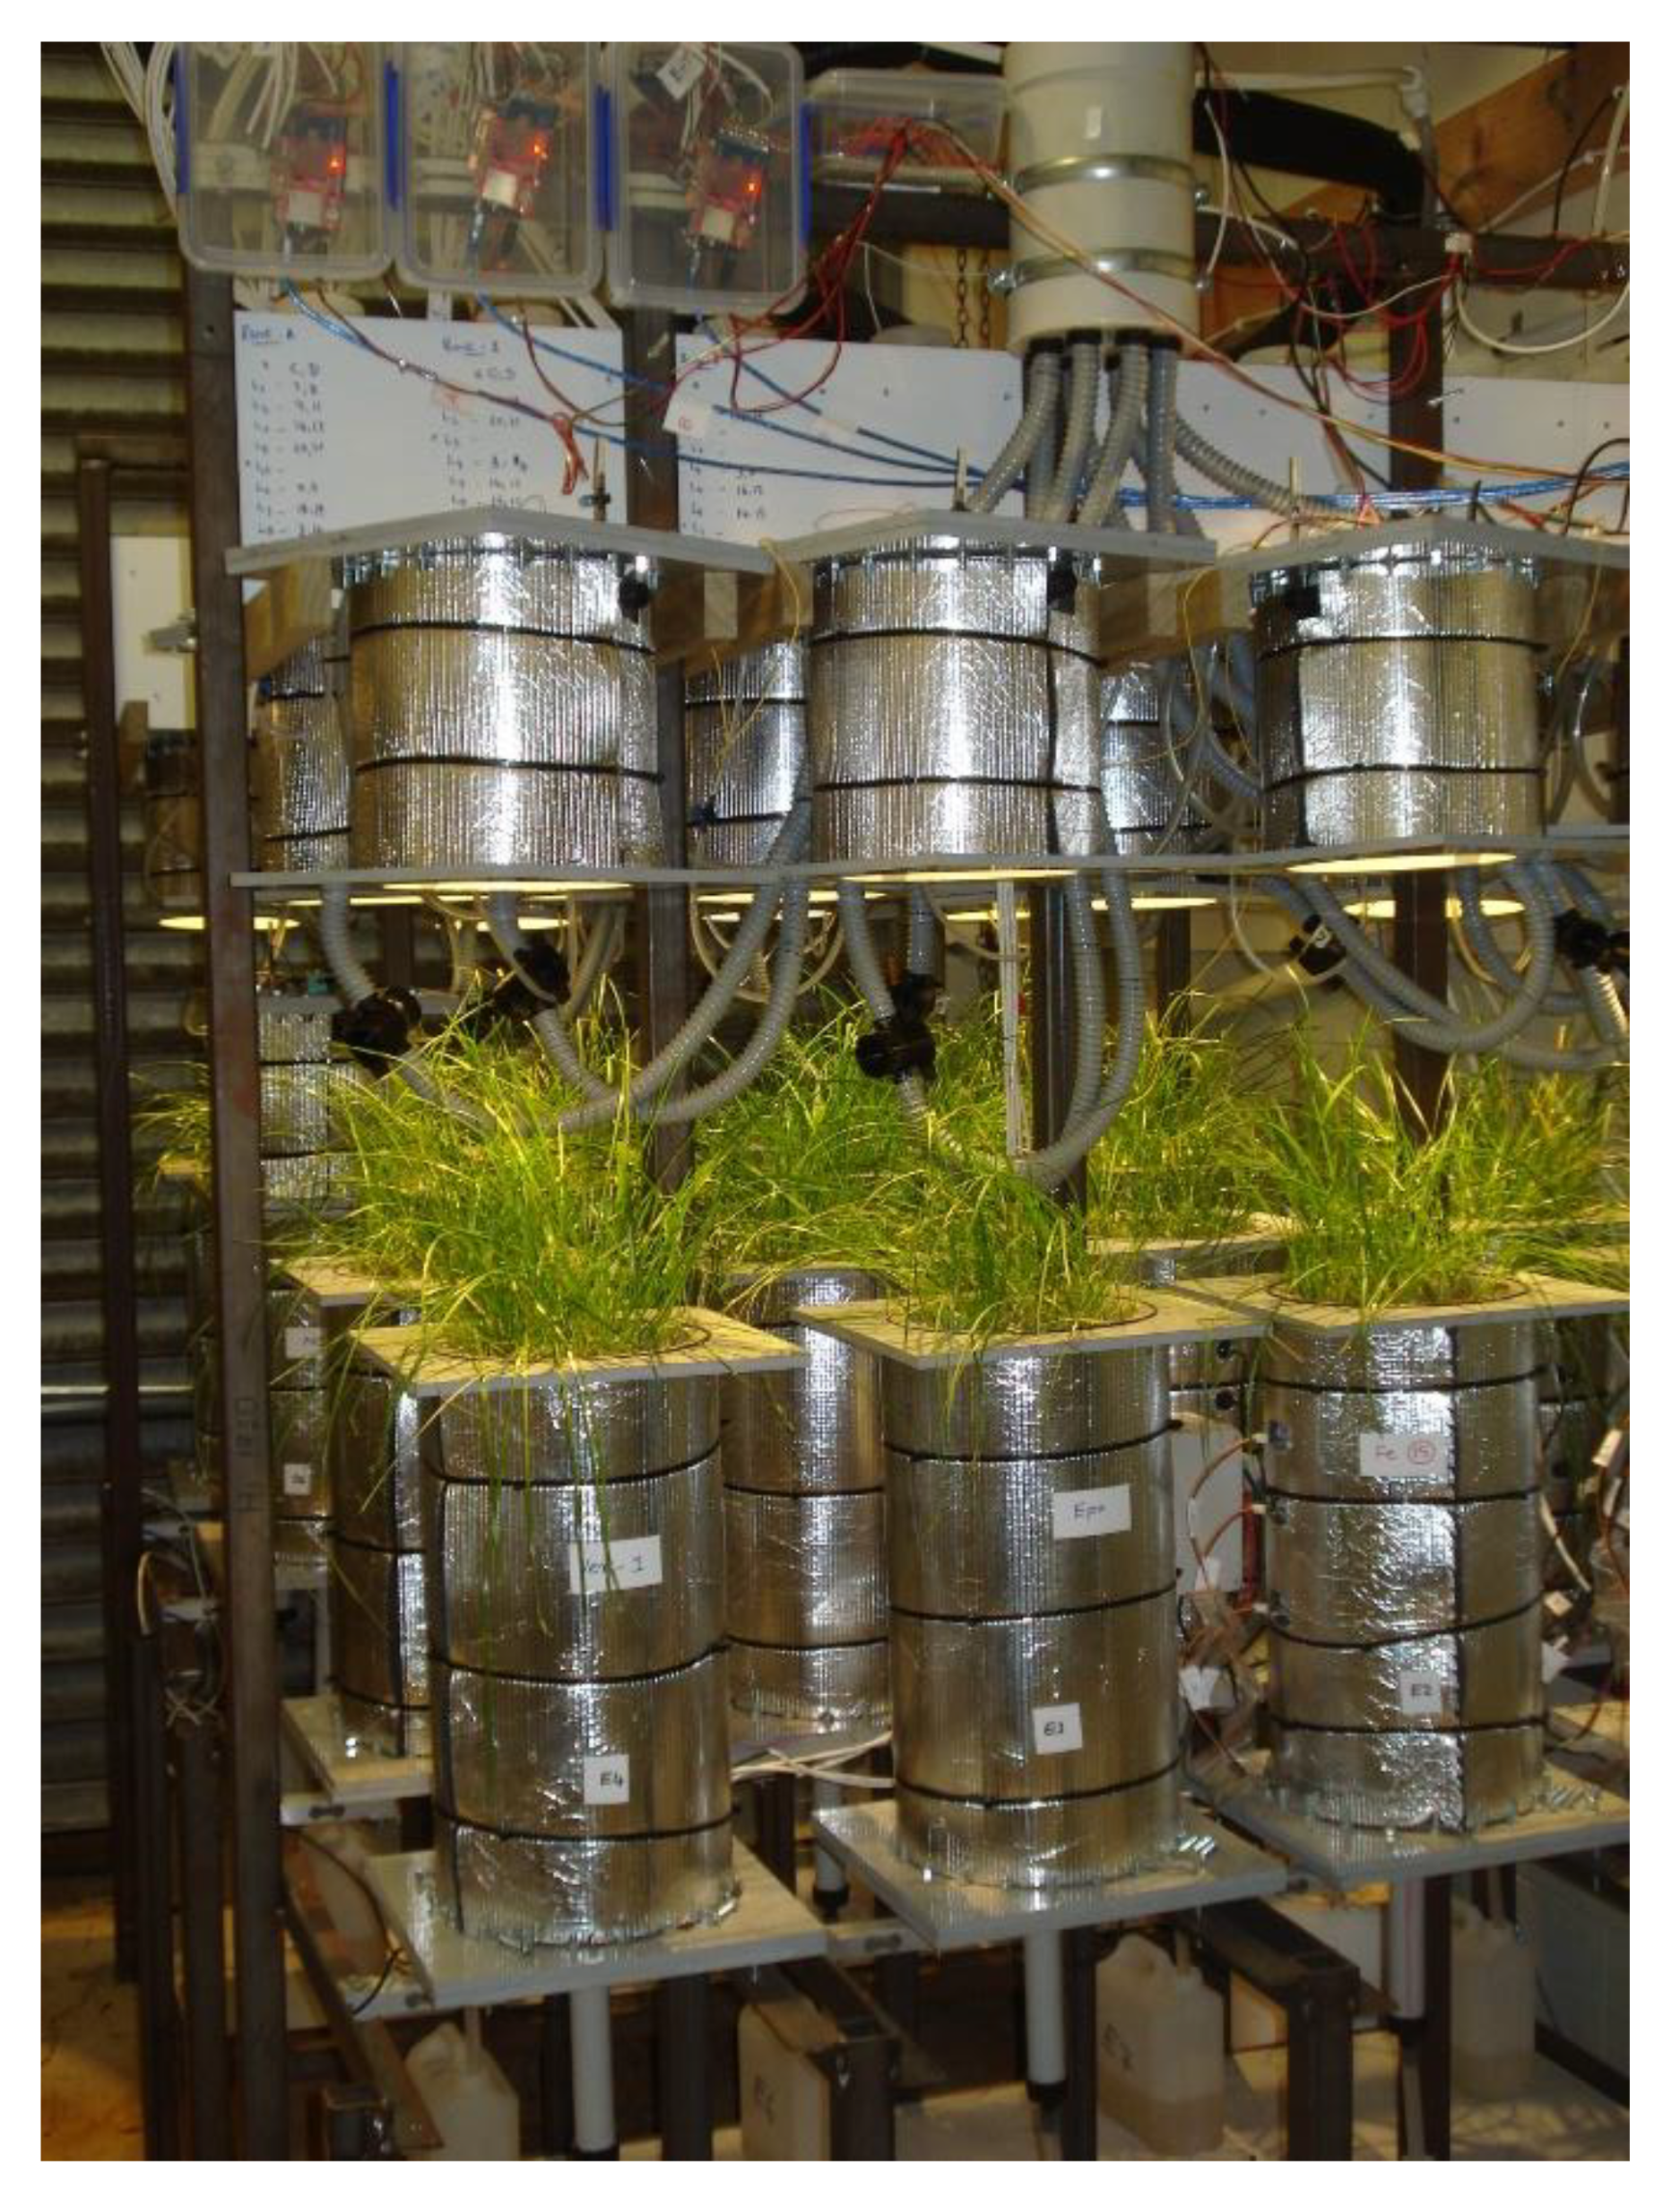
3.1. Experimental Design
3.2. Treatments and Climate Model
3.3. Leachate Analysis
3.4. Lock-Off Nitrogen in CRFs
3.5. Nitrous Oxide Measurement
3.6. Soil Residual Nitrogen
3.7. Grass Analysis
3.7.1. Grass and Stubble Harvest
3.7.2. N Accumulation in Plant
3.8. Root Analysis
3.9. N Use Efficiency
3.10. Nitrogen Budget
3.11. Data Analysis
4. Conclusions
Author Contributions
Funding
Data Availability Statement
Conflicts of Interest
References
- Kelliher, F.; Cox, N.; Van Der Weerden, T.; De Klein, C.; Luo, J.; Cameron, K.; Di, H.; Giltrap, D.; Rys, G. Statistical analysis of nitrous oxide emission factors from pastoral agriculture field trials conducted in New Zealand. Environ. Pollut. 2014, 186, 63–66. [Google Scholar] [CrossRef] [PubMed] [Green Version]
- Gunaratnam, A.; McCurdy, M.; Grafton, M.; Jeyakumar, P.; Bishop, P.; Davies, C. Assessment of nitrogen fertilizers under controlled environment—A lysimeter design. In Proceedings of the Nutrient Loss Mitigations for Compliance in Agriculture, Massey University, Palmerston North, New Zealand, 12 February 2019; pp. 1–8. [Google Scholar]
- Richards, J.; Chambers, T.; Hales, S.; Joy, M.; Radu, T.; Woodward, A.; Humphrey, A.; Randal, E.; Baker, M.G. Nitrate contamination in drinking water and colorectal cancer: Exposure assessment and estimated health burden in New Zealand. Environ. Res. 2022, 204, 112322. [Google Scholar] [CrossRef]
- Gunaratnam, A. Design and Fabrication of a Climate-Controlled Lysimeter and Testing of New Controlled-Release Fertilisers. Ph.D. Thesis, Massey University, Palmerston North, New Zealand, 2021. [Google Scholar]
- Abhiram, G.; Bishop, P.; Jeyakumar, P.; Grafton, M.; Davies, C.E.; McCurdy, M. Formulation and characterization of polyester-lignite composite coated slow-release fertilizers. J. Coat. Technol. Res. 2022, 19. [Google Scholar] [CrossRef]
- Bishop, P.; Liu, H.; Hedley, M.; Loganathan, P. New zealand made controlled release coated urea increases winter growth rates of Italian ryegrass with lower N leaching than uncoated urea. N. Zeal. Grassl. Assoc. 2008, 70, 85–89. [Google Scholar] [CrossRef]
- Gil-Ortiz, R.; Naranjo, M.Á.; Ruiz-Navarro, A.; Caballero-Molada, M.; Atares, S.; García, C.; Vicente, O. Agronomic assessment of a controlled-release polymer-coated urea-based fertilizer in maize. Plants 2021, 10, 594. [Google Scholar] [CrossRef]
- Matocha, C.; Dhakal, P.; Pyzola, S. The role of abiotic and coupled biotic/abiotic mineral controlled redox processes in nitrate reduction. Adv. Agron. 2012, 115, 181–214. [Google Scholar]
- Matse, D.T.; Jeyakumar, P.; Bishop, P.; Anderson, C.W. Bioavailable Cu can influence nitrification rate in New Zealand dairy farm soils. J. Soils Sediments 2022, 22, 916–930. [Google Scholar] [CrossRef]
- Liu, T.; Chen, D.; Li, X.; Li, F. Microbially mediated coupling of nitrate reduction and Fe (II) oxidation under anoxic conditions. FEMS Microbiol. Ecol. 2019, 95, fiz030. [Google Scholar] [CrossRef]
- Mehta, T.; Coppi, M.V.; Childers, S.E.; Lovley, D.R. Outer membrane c-type cytochromes required for Fe (III) and Mn (IV) oxide reduction in Geobacter sulfurreducens. Appl. Environ. Microbiol. 2005, 71, 8634–8641. [Google Scholar] [CrossRef] [Green Version]
- Kiskira, K.; Papirio, S.; Van Hullebusch, E.; Esposito, G. Fe (II)-mediated autotrophic denitrification: A new bioprocess for iron bioprecipitation/biorecovery and simultaneous treatment of nitrate-containing wastewaters. Int. Biodeterior. Biodegrad. 2017, 119, 631–648. [Google Scholar] [CrossRef]
- Wang, X.J.; Yang, J.; Chen, X.-P.; Sun, G.-X.; Zhu, Y.-G. Phylogenetic diversity of dissimilatory ferric iron reducers in paddy soil of Hunan, South China. J. Soils Sediments 2009, 9, 568–577. [Google Scholar] [CrossRef]
- Ratering, S.; Schnell, S. Nitrate-dependent iron (II) oxidation in paddy soil. Environ. Microbiol. 2001, 3, 100–109. [Google Scholar] [CrossRef] [PubMed]
- Huang, T.; Ju, X.; Yang, H. Nitrate leaching in a winter wheat-summer maize rotation on a calcareous soil as affected by nitrogen and straw management. Sci. Rep. 2017, 7, 1–11. [Google Scholar] [CrossRef] [Green Version]
- Li, T.; Zhang, W.; Yin, J.; Chadwick, D.; Norse, D.; Lu, Y.; Liu, X.; Chen, X.; Zhang, F.; Powlson, D. Enhanced-efficiency fertilizers are not a panacea for resolving the nitrogen problem. Glob. Change Biol. 2018, 24, e511–e521. [Google Scholar] [CrossRef] [PubMed]
- Jamieson, J.; Prommer, H.; Kaksonen, A.H.; Sun, J.; Siade, A.J.; Yusov, A.; Bostick, B. Identifying and quantifying the intermediate processes during nitrate-dependent iron (II) oxidation. Environ. Sci. Technol. 2018, 52, 5771–5781. [Google Scholar] [CrossRef] [PubMed]
- Paramashivam, D.; Clough, T.J.; Carlton, A.; Gough, K.; Dickinson, N.; Horswell, J.; Sherlock, R.R.; Clucas, L.; Robinson, B.H. The effect of lignite on nitrogen mobility in a low-fertility soil amended with biosolids and urea. Sci. Total Environ. 2016, 543, 601–608. [Google Scholar] [CrossRef]
- Hénault, C.; Devis, X.; Page, S.; Justes, E.; Reau, R.; Germon, J. Nitrous oxide emissions under different soil and land management conditions. Biol. Fertil. Soils 1998, 26, 199–207. [Google Scholar] [CrossRef]
- Soares, J.R.; Cantarella, H.; Vargas, V.P.; Carmo, J.B.; Martins, A.A.; Sousa, R.M.; Andrade, C.A. Enhanced-efficiency fertilizers in nitrous oxide emissions from urea applied to sugarcane. J. Environ. Qual. 2015, 44, 423–430. [Google Scholar] [CrossRef] [Green Version]
- Wong, M.H.; Bradshaw, A. A comparison of the toxicity of heavy metals, using root elongation of rye grass, Lolium perenne. New Phytol. 1982, 91, 255–261. [Google Scholar] [CrossRef]
- Van Eerd, L.; Turnbull, J.; Bakker, C.; Vyn, R.; McKeown, A.; Westerveld, S. Comparing soluble to controlled-release nitrogen fertilizers: Storage cabbage yield, profit margins, and N use efficiency. Can. J. Plant Sci. 2017, 98, 815–829. [Google Scholar] [CrossRef] [Green Version]
- Jiang, Y.; Li, Y.; Nie, G.; Liu, H. Leaf and root growth, carbon and nitrogen contents, and gene expression of perennial ryegrass to different nitrogen supplies. J. Am. Soc. Hortic. Sci. 2016, 141, 555–562. [Google Scholar] [CrossRef]
- Wang, Y.; Zhang, X.; Chen, J.; Chen, A.; Wang, L.; Guo, X.; Niu, Y.; Liu, S.; Mi, G.; Gao, Q. Reducing basal nitrogen rate to improve maize seedling growth, water and nitrogen use efficiencies under drought stress by optimizing root morphology and distribution. Agric. Water Manag. 2019, 212, 328–337. [Google Scholar] [CrossRef]
- Bremer, E.; Kuikman, P. Influence of competition for nitrogen in soil on net mineralization of nitrogen. Plant Soil 1997, 190, 119–126. [Google Scholar] [CrossRef]
- McCurdy, M.; Davies, C.; Gunaratnam, A.; Grafton, M.; Bishop, P.; Jeyakumar, P. Instrumentation of a bank of lysimeters: Sensors and sensibility. In Proceedings of the Chemeca 2019: Chemical Engineering Megatrends and Elements, Sydney, NSW, Australia, 29 September 2019; pp. 425–438. [Google Scholar]
- Gunaratnam, A.; Grafton, M.; Jeyakumar, P.; Bishop, P.; Davies, C.; McCurdy, M. Study the influence of soil moisture and packing incremental level on soil physical and hydraulic properties. In Proceedings of the 33rd Annual FLRC Workshop, Palmerston North, New Zealand, 11–13 February 2020; pp. 1–6. [Google Scholar]
- Blakemore, L.; Searle, P.; Daly, B. Methods for Chemical Analysis of Soils; New Zealand Soil Bureau Scientific Report 80; New Zealand Society of Soil Science: Lower Hutt, New Zealand, 1987; p. 103. [Google Scholar]
- Collier, S.M.; Ruark, M.D.; Oates, L.G.; Jokela, W.E.; Dell, C.J. Measurement of greenhouse gas flux from agricultural soils using static chambers. J. Vis. Exp. JoVE 2014, e52110. [Google Scholar] [CrossRef]


| Parameter | Depth (cm) | Treatment | |||||||
|---|---|---|---|---|---|---|---|---|---|
| NC | Control | Urea | Fe 7.5 | Fe 15 | Epox5 | Ver-c | Ver-1 | ||
| kg-N ha− | |||||||||
| NO3-N | 0–5 | 28.5 ± 6.7 a | 33.7 ± 10.7 a | 43.2 ± 13.7 a | 36.2 ± 11.6 a | 39.3 ± 14.1 a | 34.0 ± 23.8 a | 36.3 ± 12.6 a | 38.8 ± 23.1 a |
| 5–10 | 21.1 ± 5.4 a | 32.7 ± 7.9 a | 31.7 ± 7.3 a | 29.5 ± 9.4 a | 34.5 ± 4.2 a | 32.6 ± 11.2 a | 33.4 ± 8.7 a | 33.0 ± 7.3 a | |
| 10–20 | 1.4 ± 0.6 a | 2.9 ± 0.7 a | 3.3 ± 1.1 a | 2.8 ± 0.4 a | 3.4 ± 1.8 a | 2.7 ± 0.4 a | 2.9 ± 0.9 a | 3.5 ± 1.4 a | |
| 20–30 | 1.7 ± 0.5 a | 2.2 ± 0.9 a | 2.1 ± 0.9 a | 1.8 ± 0.8 a | 2.1 ± 0.7 a | 2.1 ± 1.3 a | 1.9 ± 1.1 a | 2.5 ± 1.3 a | |
| 30–40 | 0.8 ± 0.3 a | 1.8 ± 1.0 a | 2.2 ± 1.7 a | 2.4 ± 1.7 a | 2.3 ± 1.7 a | 1.9 ± 1.2 a | 1.4 ± 0.6 a | 1.5 ± 0.9 a | |
| Total | 53.5 ± 12.4 a | 73.2 ± 18.5 a | 82.5 ± 20.6 a | 72.7 ± 21.7 a | 81.5 ± 20.4 a | 80.3 ± 24.3 a | 76.0 ± 20.7 a | 79.3 ± 30.5 a | |
| NH4-N | 0–5 | 2.4 ± 1.2 a | 3.8 ± 2.3 a | 3.9 ± 2.2 a | 3.2 ± 1.7 a | 3.3 ± 1.2 a | 3.0 ± 3.0 a | 3.1 ± 1.9 a | 3.8 ± 5.5 a |
| 5–10 | 2.1 ± 0.9 a | 2.5 ± 1.1 a | 2.8 ± 1.1 a | 2.7 ± 1.5 a | 3.1 ± 1.5 a | 2.3 ± 1.2 a | 2.2 ± 1.5 a | 2.6 ± 2.3 a | |
| 10–20 | 1.1 ± 1.1 a | 1.9 ± 1.2 a | 1.3 ± 1.8 a | 0.9 ± 1.0 a | 1.9 ± 1.8 a | 2.2 ± 2.3 a | 1.6 ± 2.4 a | 1.5 ± 1.5 a | |
| 20–30 | 0.5 ± 0.8 a | 1.8 ± 1.6 a | 1.3 ± 2.0 a | 0.2 ± 0.4 a | 1.4 ± 1.4 a | 1.0 ± 1.0 a | 0.7 ± 1.3 a | 0.9 ± 0.9 a | |
| 30–40 | 0.4 ± 0.7 a | 1.9 ± 1.7 a | 1.7 ± 2.2 a | 1.1 ± 1.4 a | 1.4 ± 1.7 a | 1.1 ± 1.0 a | 0.5 ± 1.0 a | 1.2 ± 1.9 a | |
| Total | 6.5 ± 2.8 a | 14.4 ± 1.7 a | 13.3 ± 6.3 a | 6.5 ± 3.3 a | 11.1 ± 6.7 a | 11.5 ± 5.9 a | 9.4 ± 7.9 a | 12.0 ± 9.6 a | |
| Total-N | 0–5 | 30.9 ± 8.5 a | 37.5 ± 12.2 a | 47.0 ± 15.7 a | 39.4 ± 12.2 a | 42.6 ± 15.1 a | 46.3 ± 19.2 a | 39.4 ± 14.4 a | 42.6 ± 28.2 a |
| 5–10 | 23.2 ± 5.8 a | 35.2 ± 8.8 a | 34.5 ± 8.1 a | 32.3 ± 10.8 a | 37.6 ± 4.7 a | 34.9 ± 11.8 a | 35.6 ± 9.4 a | 35.6 ± 8.6 a | |
| 10–20 | 2.5 ± 1.6 a | 4.8 ± 1.8 a | 4.6 ± 2.6 a | 3.6 ± 0.7 a | 5.3 ± 3.3 a | 5.0 ± 2.5 a | 4.5 ± 2.5 a | 4.9 ± 2.6 a | |
| 20–30 | 2.2 ± 1.3 a | 3.9 ± 2.3 a | 3.4 ± 2.9 a | 1.9 ± 1.1 a | 3.4 ± 2.0 a | 3.1 ± 2.0 a | 2.6 ± 2.4 a | 3.3 ± 1.5 a | |
| 30–40 | 1.2 ± 1.5 a | 3.7 ± 2.6 a | 3.9 ± 3.8 a | 3.5 ± 3.1 a | 3.7 ± 3.4 a | 3.0 ± 2.1 a | 1.9 ± 1.6 a | 2.7 ± 2.3 a | |
| Total | 60.0 ± 14.3 a | 93.2 ± 16.8 a | 104.4 ± 8.9 a | 77.1 ± 27.2 a | 92.6 ± 25.6 a | 91.8 ± 28.1 a | 84.1 ± 26.6 a | 100.5 ± 31.7a | |
| Treatment | TN in 1st Cutting | TN in 2nd Cutting | TN in 3rd Cutting | TN in Stubble | Total Herbage N | AUE | ARE |
|---|---|---|---|---|---|---|---|
| (kg-N ha−1) | (kg-DM kg-N−1) | - | |||||
| Control | 10.8 ± 4.7 d | 3.3 ± 1.1 c | 1.5 ± 1.1 b | 9.5 ± 3.7 b | 15.6 ± 6.2 b | - | - |
| Urea | 44.1 ± 12.4 ab | 23.0 ± 10.7 ab | 6.4 ± 3.6 a | 18.0 ± 2.8 a | 73.5 ± 25.8 a | 6.4 ± 3.0 a | 0.29 ± 0.13 a |
| Fe 7.5 | 35.9 ± 2.7 abc | 22.1 ± 8.7 ab | 6.6 ± 2.1 a | 15.3 ± 7.7 ab | 66.7 ± 5.5 a | 7.1 ± 2.1 a | 0.26 ± 0.03 a |
| Fe 15 | 34.0 ± 8.2 bc | 29.7 ± 9.2 a | 10.0 ± 2.0 a | 16.1 ± 2.7 ab | 77.3 ± 20.1 a | 5.6 ± 3.2 a | 0.31 ± 0.10 a |
| Epox5 | 33.8 ± 6.3 c | 17.9 ± 3.2 b | 7.6 ± 3.9 a | 17.8 ± 6.9 a | 56.7 ± 12.5 a | 5.0 ± 1.0 a | 0.21 ± 0.06 a |
| Ver-C | 38.2 ± 11.5 abc | 18.3 ± 6.0 b | 5.8 ± 2.6 a | 17.8 ± 2.8 a | 62.3 ± 13.8 a | 4.7 ± 2.1 a | 0.23 ± 0.07 a |
| Ver-1 | 44.8 ± 3.7 a | 20.7 ± 3.3 ab | 8.5 ± 3.3 a | 17.5 ± 6.6 a | 77.1 ± 2.5 a | 6.6 ± 0.8 a | 0.30 ± 0.03 a |
| Variable | Treatment | |||||||
|---|---|---|---|---|---|---|---|---|
| NC | Control | Urea | Fe 7.5 | Fe 15 | Epox5 | Ver-c | Ver-1 | |
| kg-N ha−1 | ||||||||
| Fertiliser N | 0 | 0 | 200 | 200 | 200 | 200 | 200 | 200 |
| Mineralised N | 84.6 | 84.6 | 84.6 | 84.6 | 84.6 | 84.6 | 84.6 | 84.6 |
| SIMN * | 46 | 46 | 46 | 46 | 46 | 46 | 46 | 46 |
| Herbage N | - | −15.6 | −73.5 | −66.7 | −77.3 | −56.7 | −62.3 | −77.1 |
| Stubble N | - | −9.5 | −18 | −15.3 | −16.1 | −17.8 | −17.8 | −17.5 |
| Leaching N | −11.0 | −12.1 | −72.9 | −78.4 | −80.5 | −45.9 | −83.4 | −39.3 |
| N2O-N | −0.1 | −0.1 | −0.2 | −0.2 | −0.2 | −0.5 | −0.2 | −0.2 |
| SFMN * | −60.0 | −93.2 | −104 | −77.1 | −92.6 | −91.8 | −84.1 | −100.5 |
| Unreleased N | 0 | 0 | 0 | 0 | 0 | 9.7 | 0 | 0 |
| N Balance | 59.4 | 0.0 | 61.6 | 92.8 | 63.8 | 108.1 | 82.8 | 95.9 |
Publisher’s Note: MDPI stays neutral with regard to jurisdictional claims in published maps and institutional affiliations. |
© 2022 by the authors. Licensee MDPI, Basel, Switzerland. This article is an open access article distributed under the terms and conditions of the Creative Commons Attribution (CC BY) license (https://creativecommons.org/licenses/by/4.0/).
Share and Cite
Abhiram, G.; Grafton, M.; Jeyakumar, P.; Bishop, P.; Davies, C.E.; McCurdy, M. The Nitrogen Dynamics of Newly Developed Lignite-Based Controlled-Release Fertilisers in the Soil-Plant Cycle. Plants 2022, 11, 3288. https://doi.org/10.3390/plants11233288
Abhiram G, Grafton M, Jeyakumar P, Bishop P, Davies CE, McCurdy M. The Nitrogen Dynamics of Newly Developed Lignite-Based Controlled-Release Fertilisers in the Soil-Plant Cycle. Plants. 2022; 11(23):3288. https://doi.org/10.3390/plants11233288
Chicago/Turabian StyleAbhiram, Gunaratnam, Miles Grafton, Paramsothy Jeyakumar, Peter Bishop, Clive E. Davies, and Murray McCurdy. 2022. "The Nitrogen Dynamics of Newly Developed Lignite-Based Controlled-Release Fertilisers in the Soil-Plant Cycle" Plants 11, no. 23: 3288. https://doi.org/10.3390/plants11233288