
Diurnal Change of the Photosynthetic Light-Response Curve of Buckbean (Menyanthes trifoliata), an Emergent Aquatic Plant


Abstract
:1. Introduction
2. Results
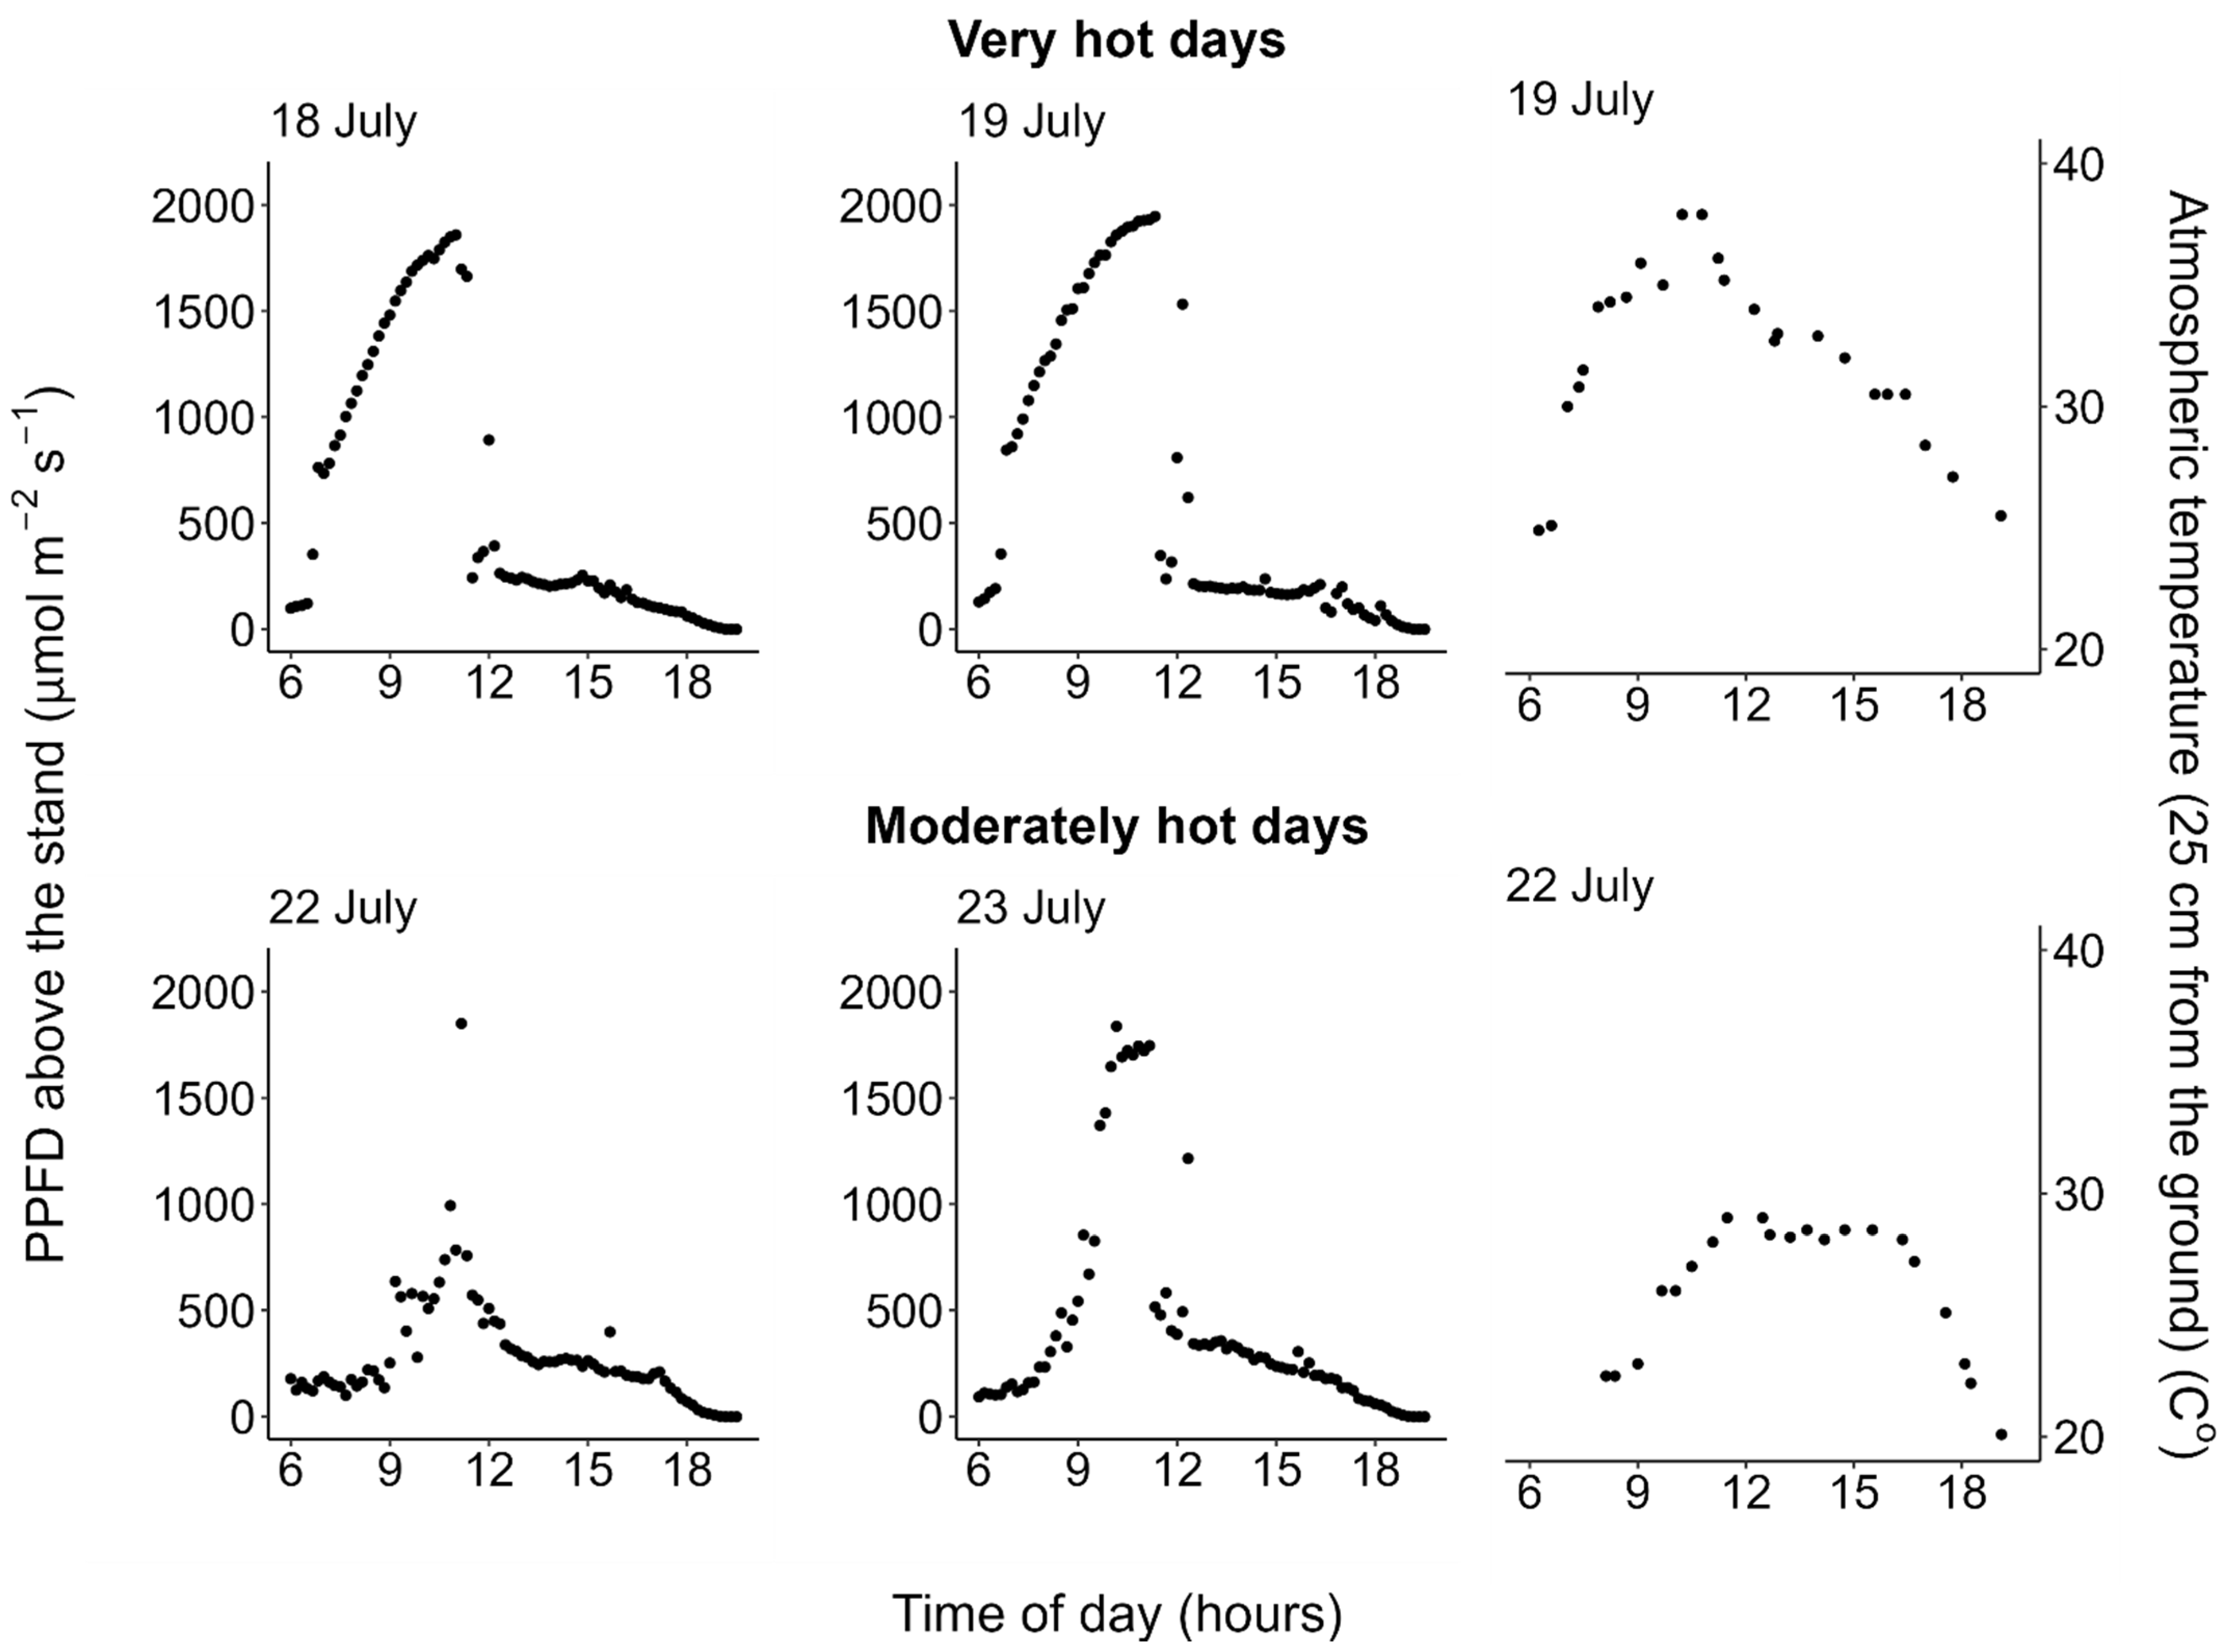
2.1. Weather Conditions
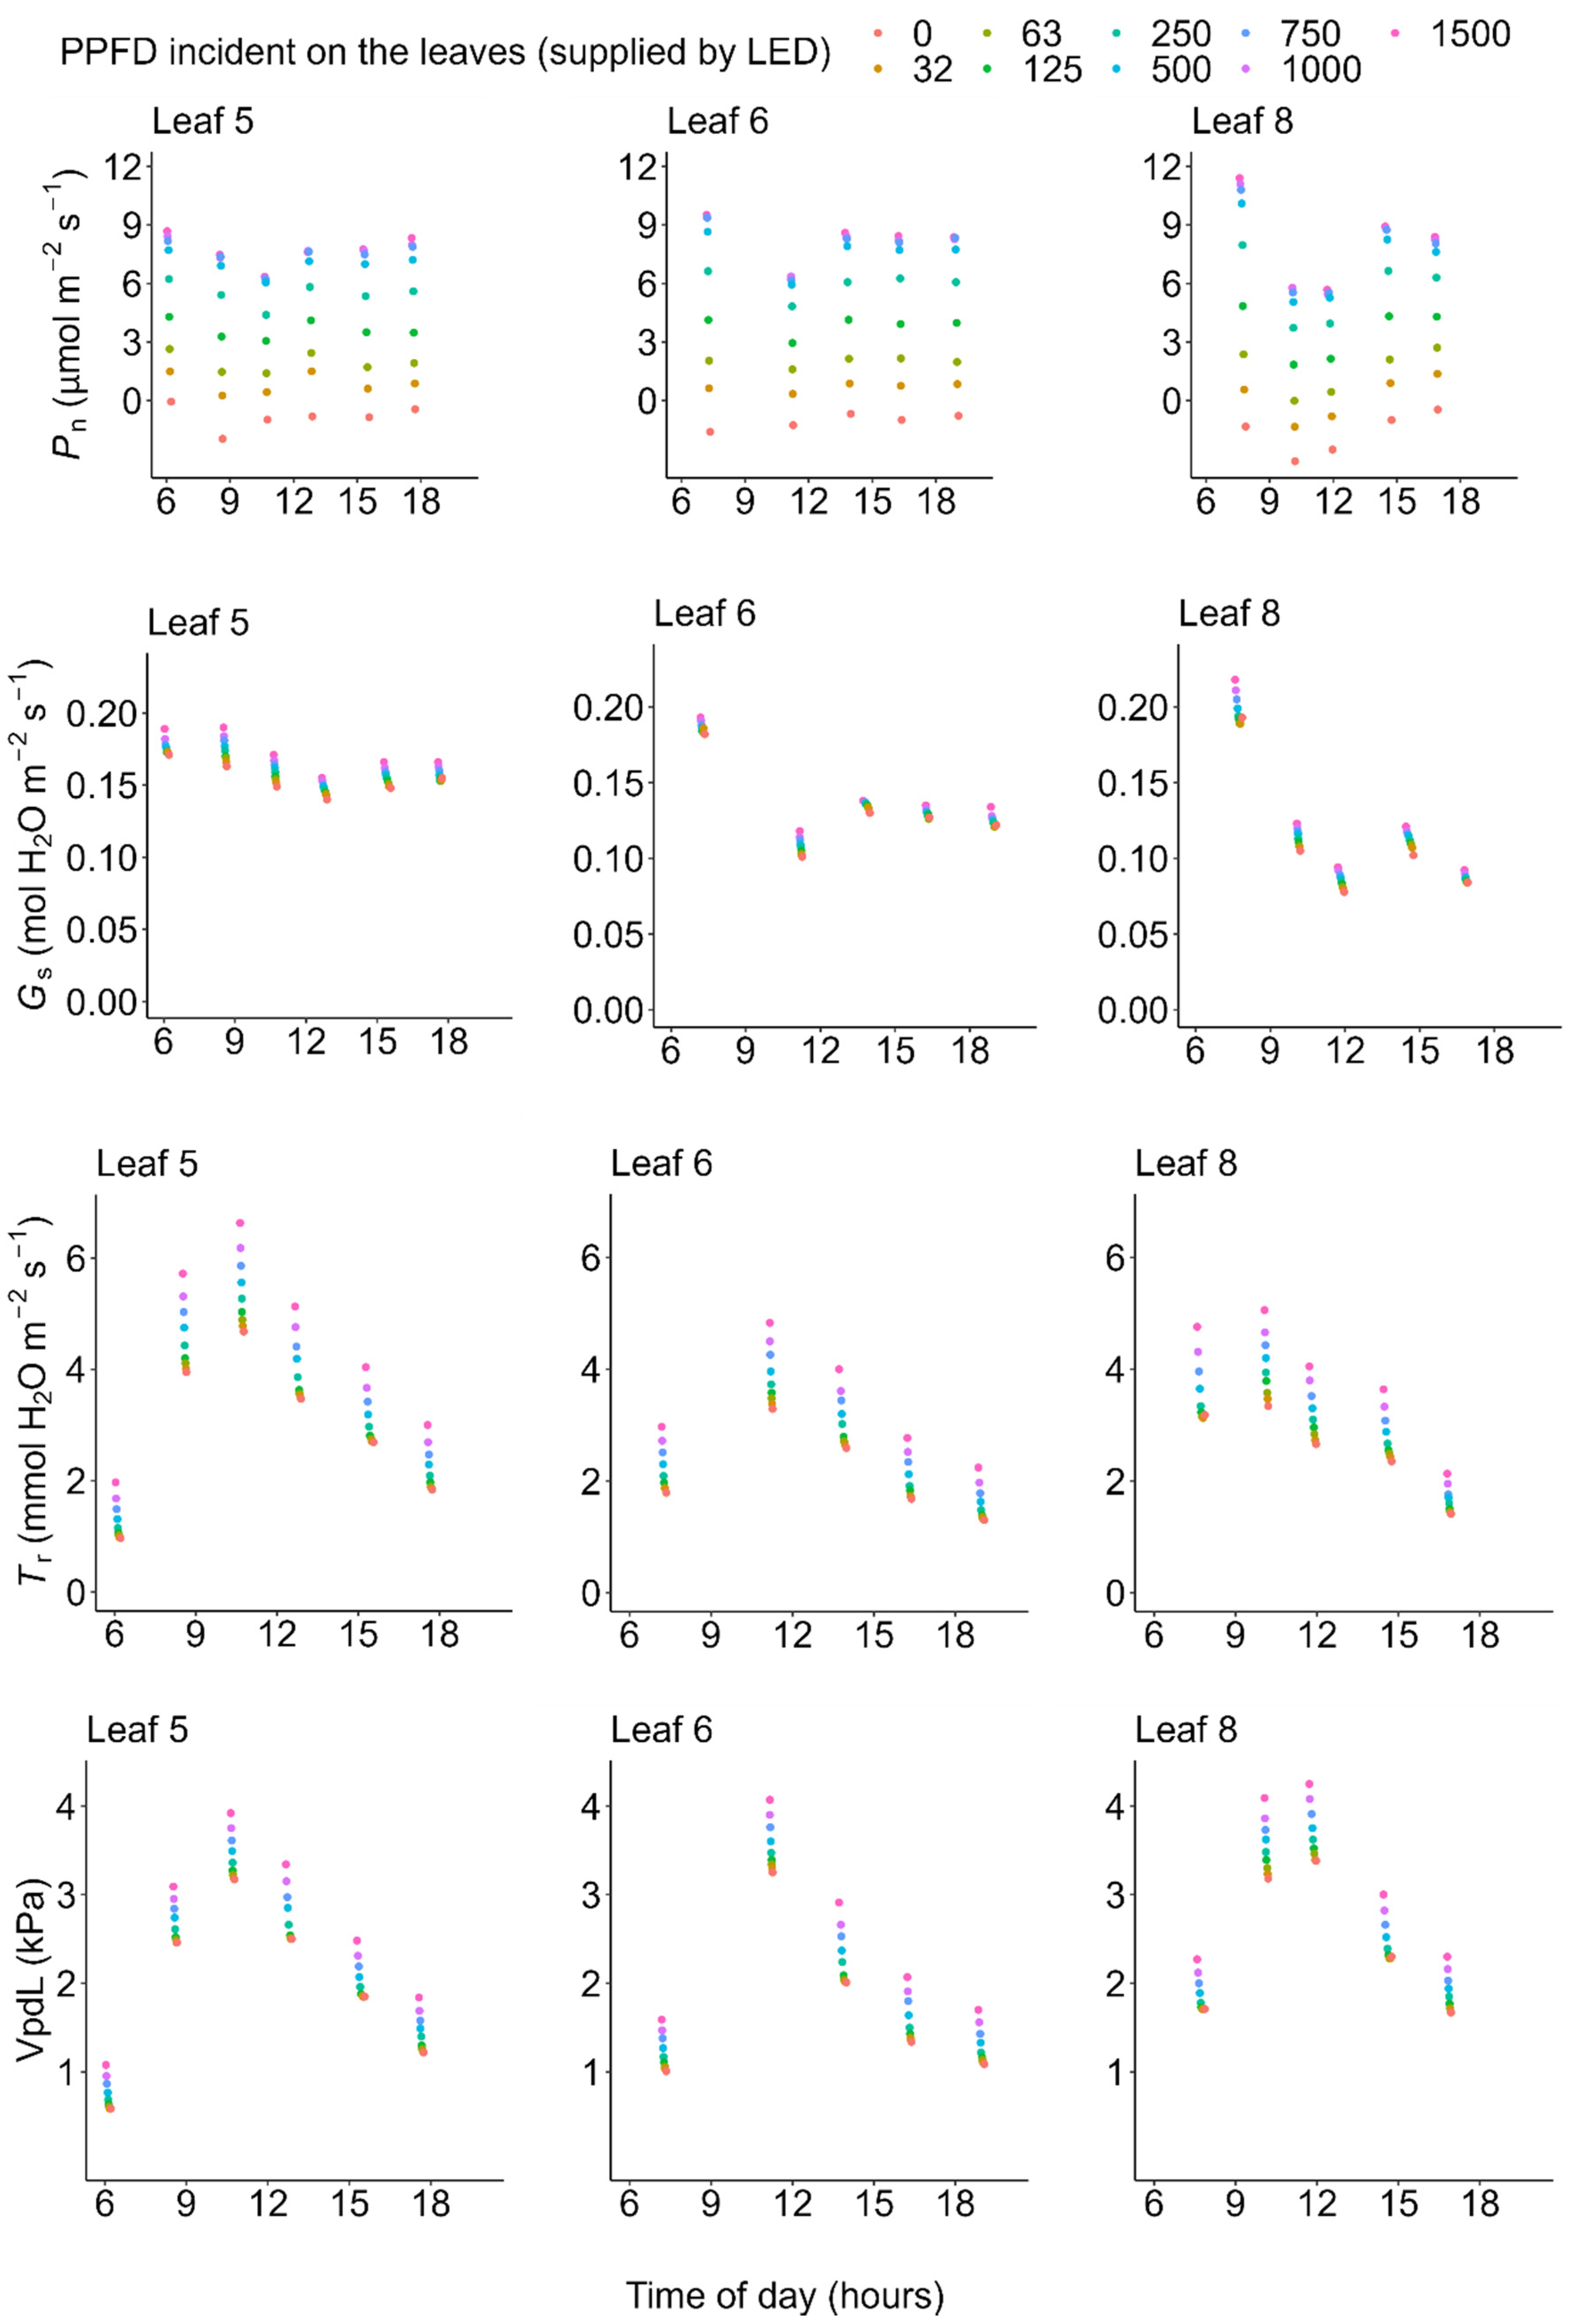
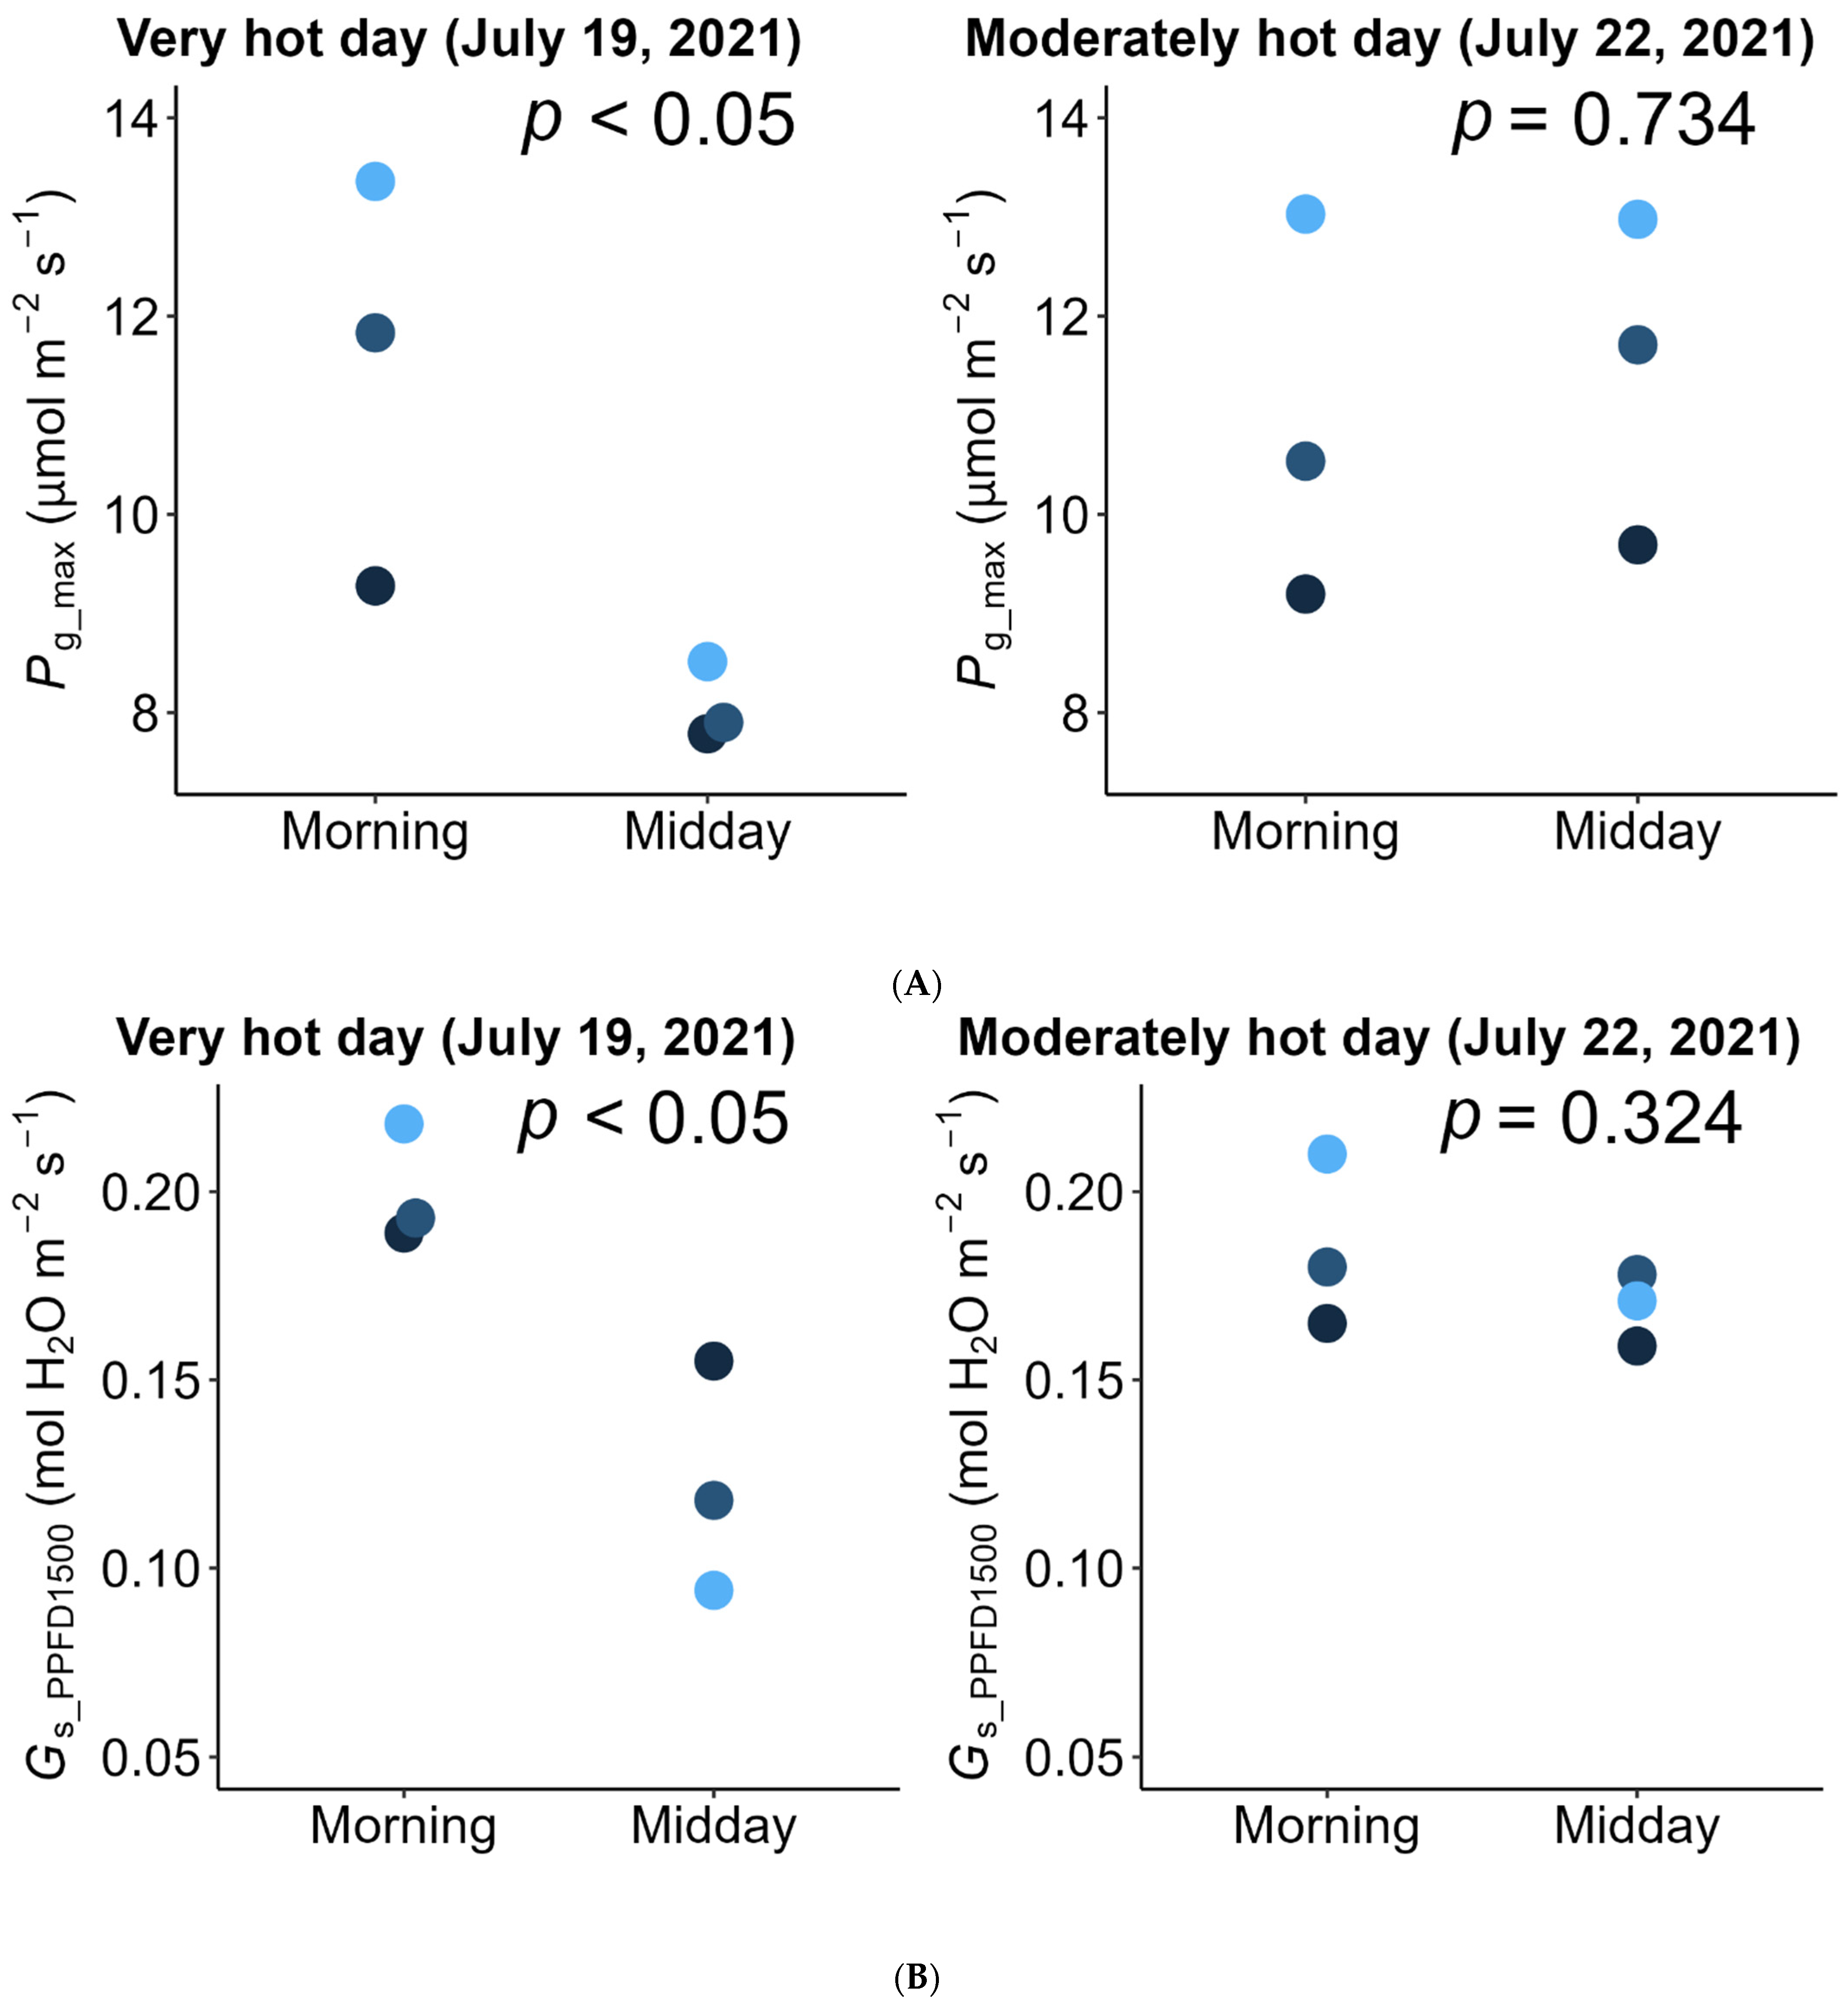
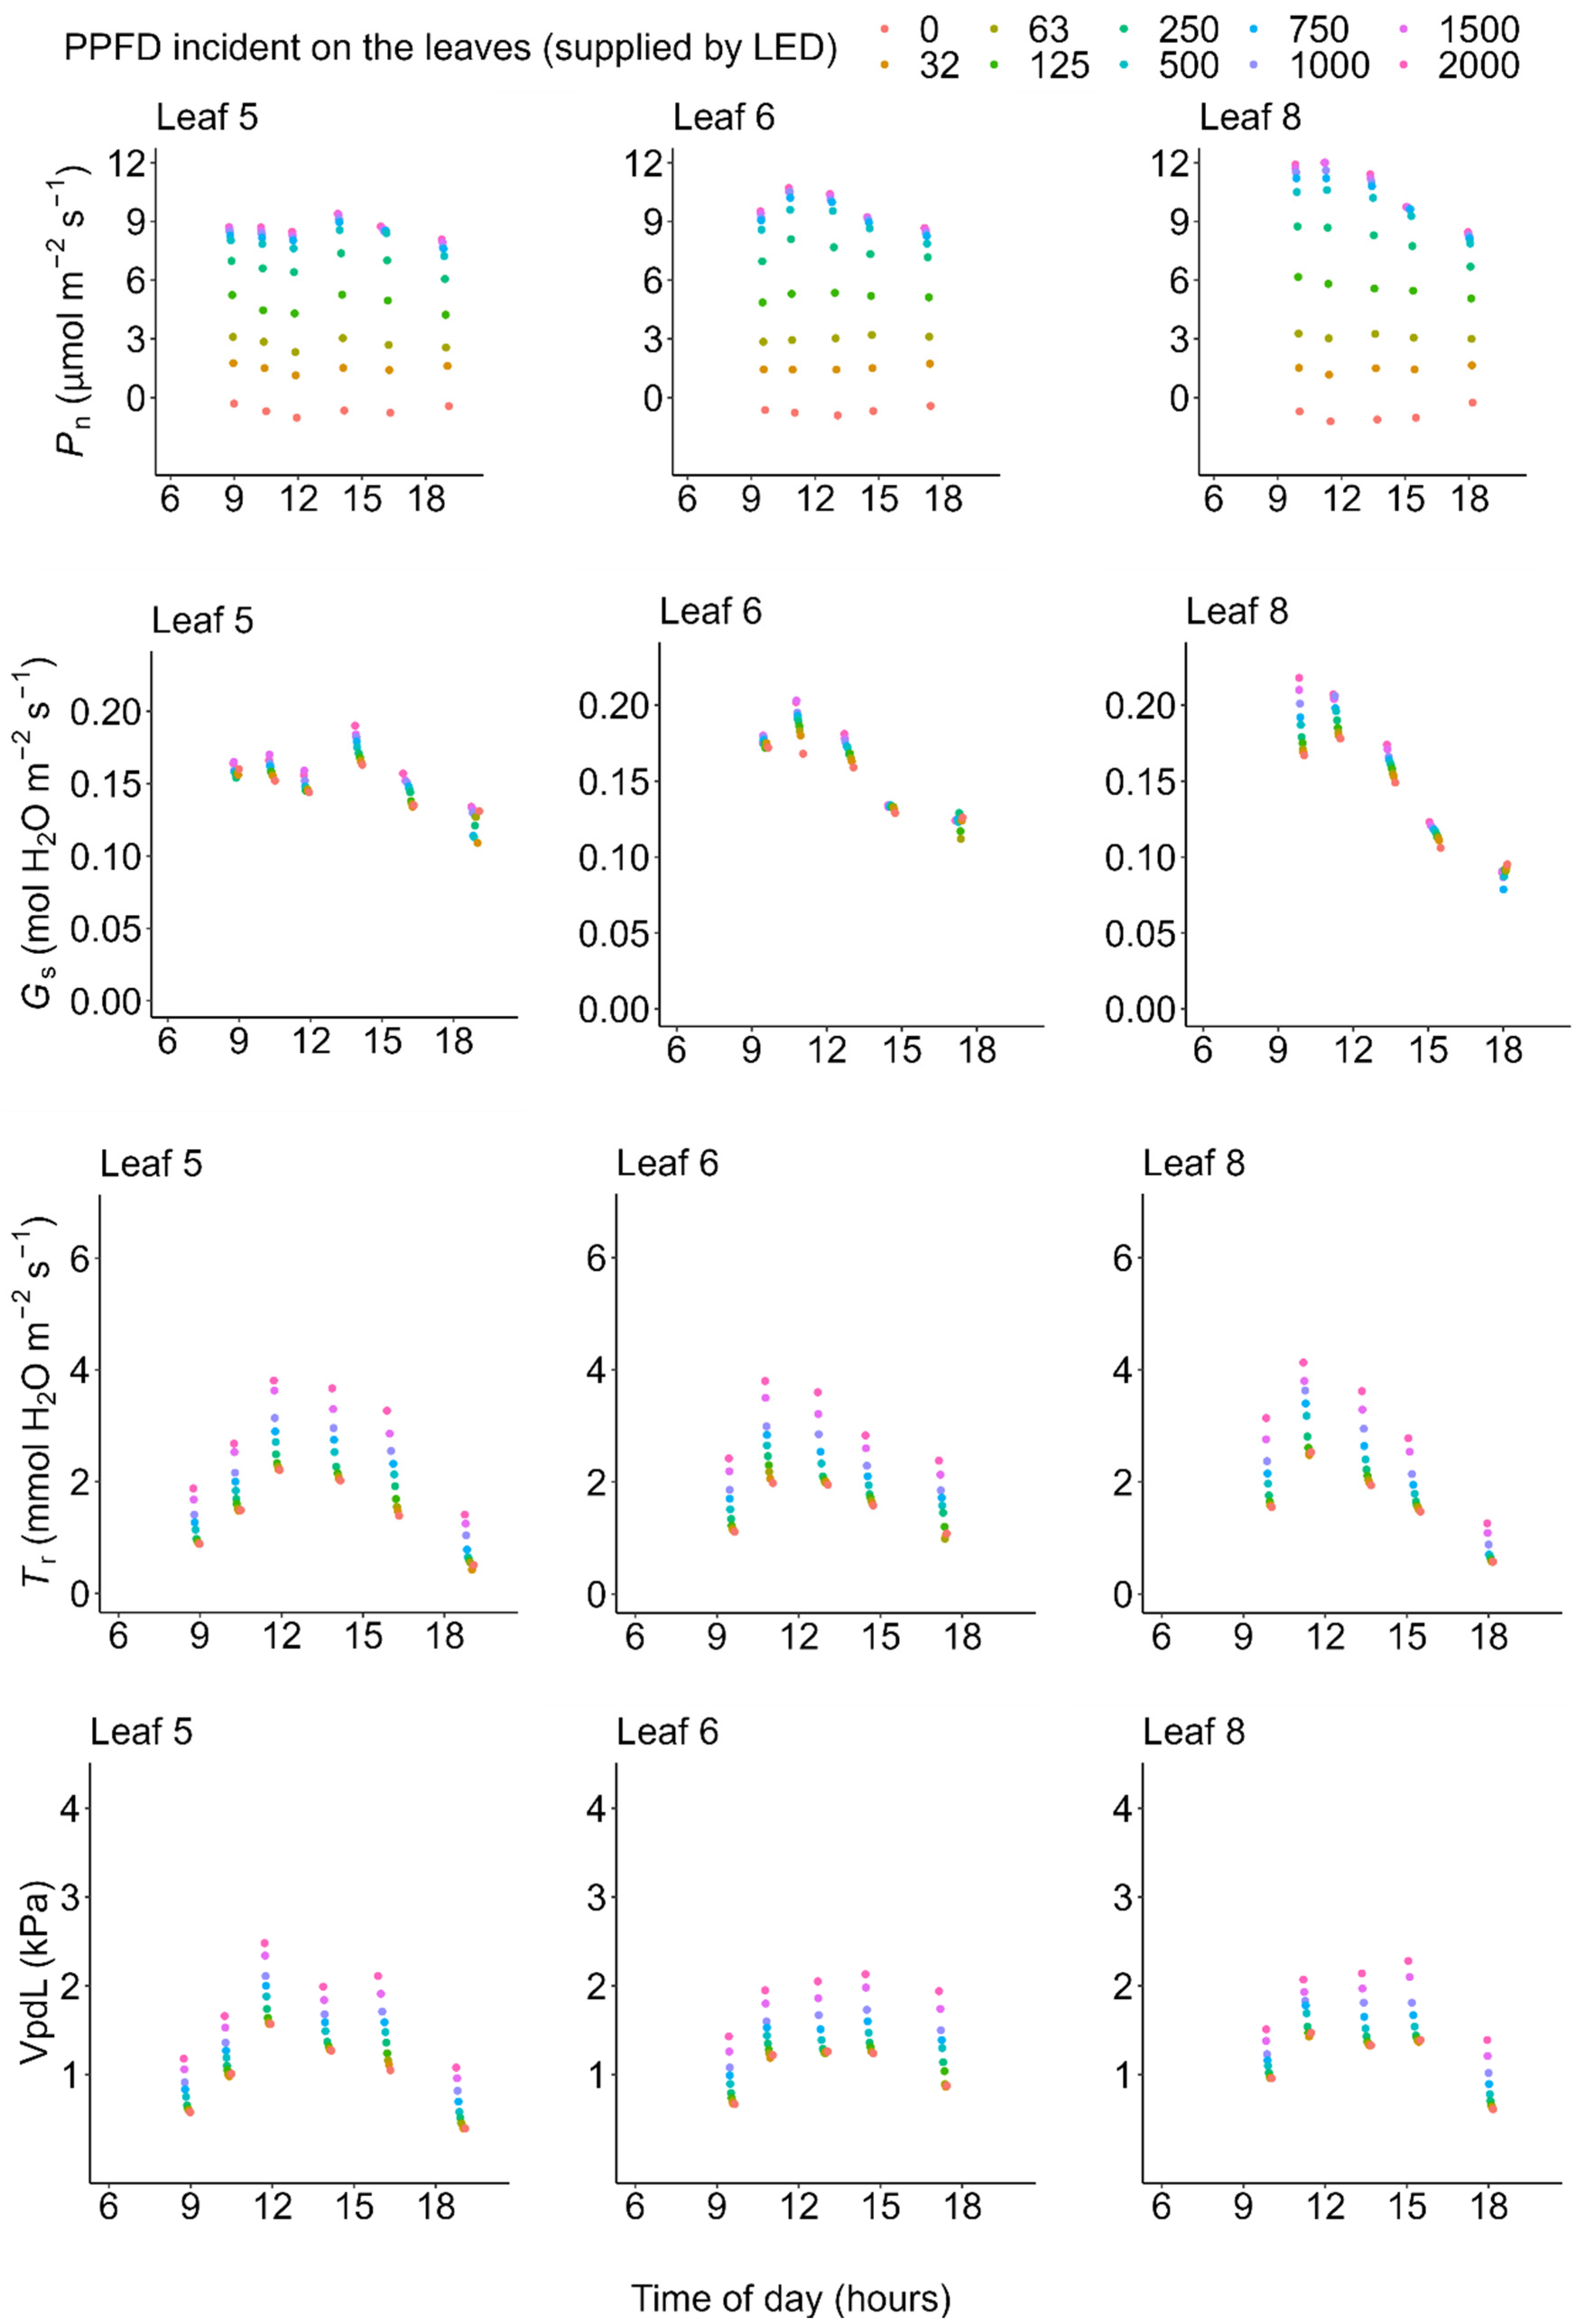
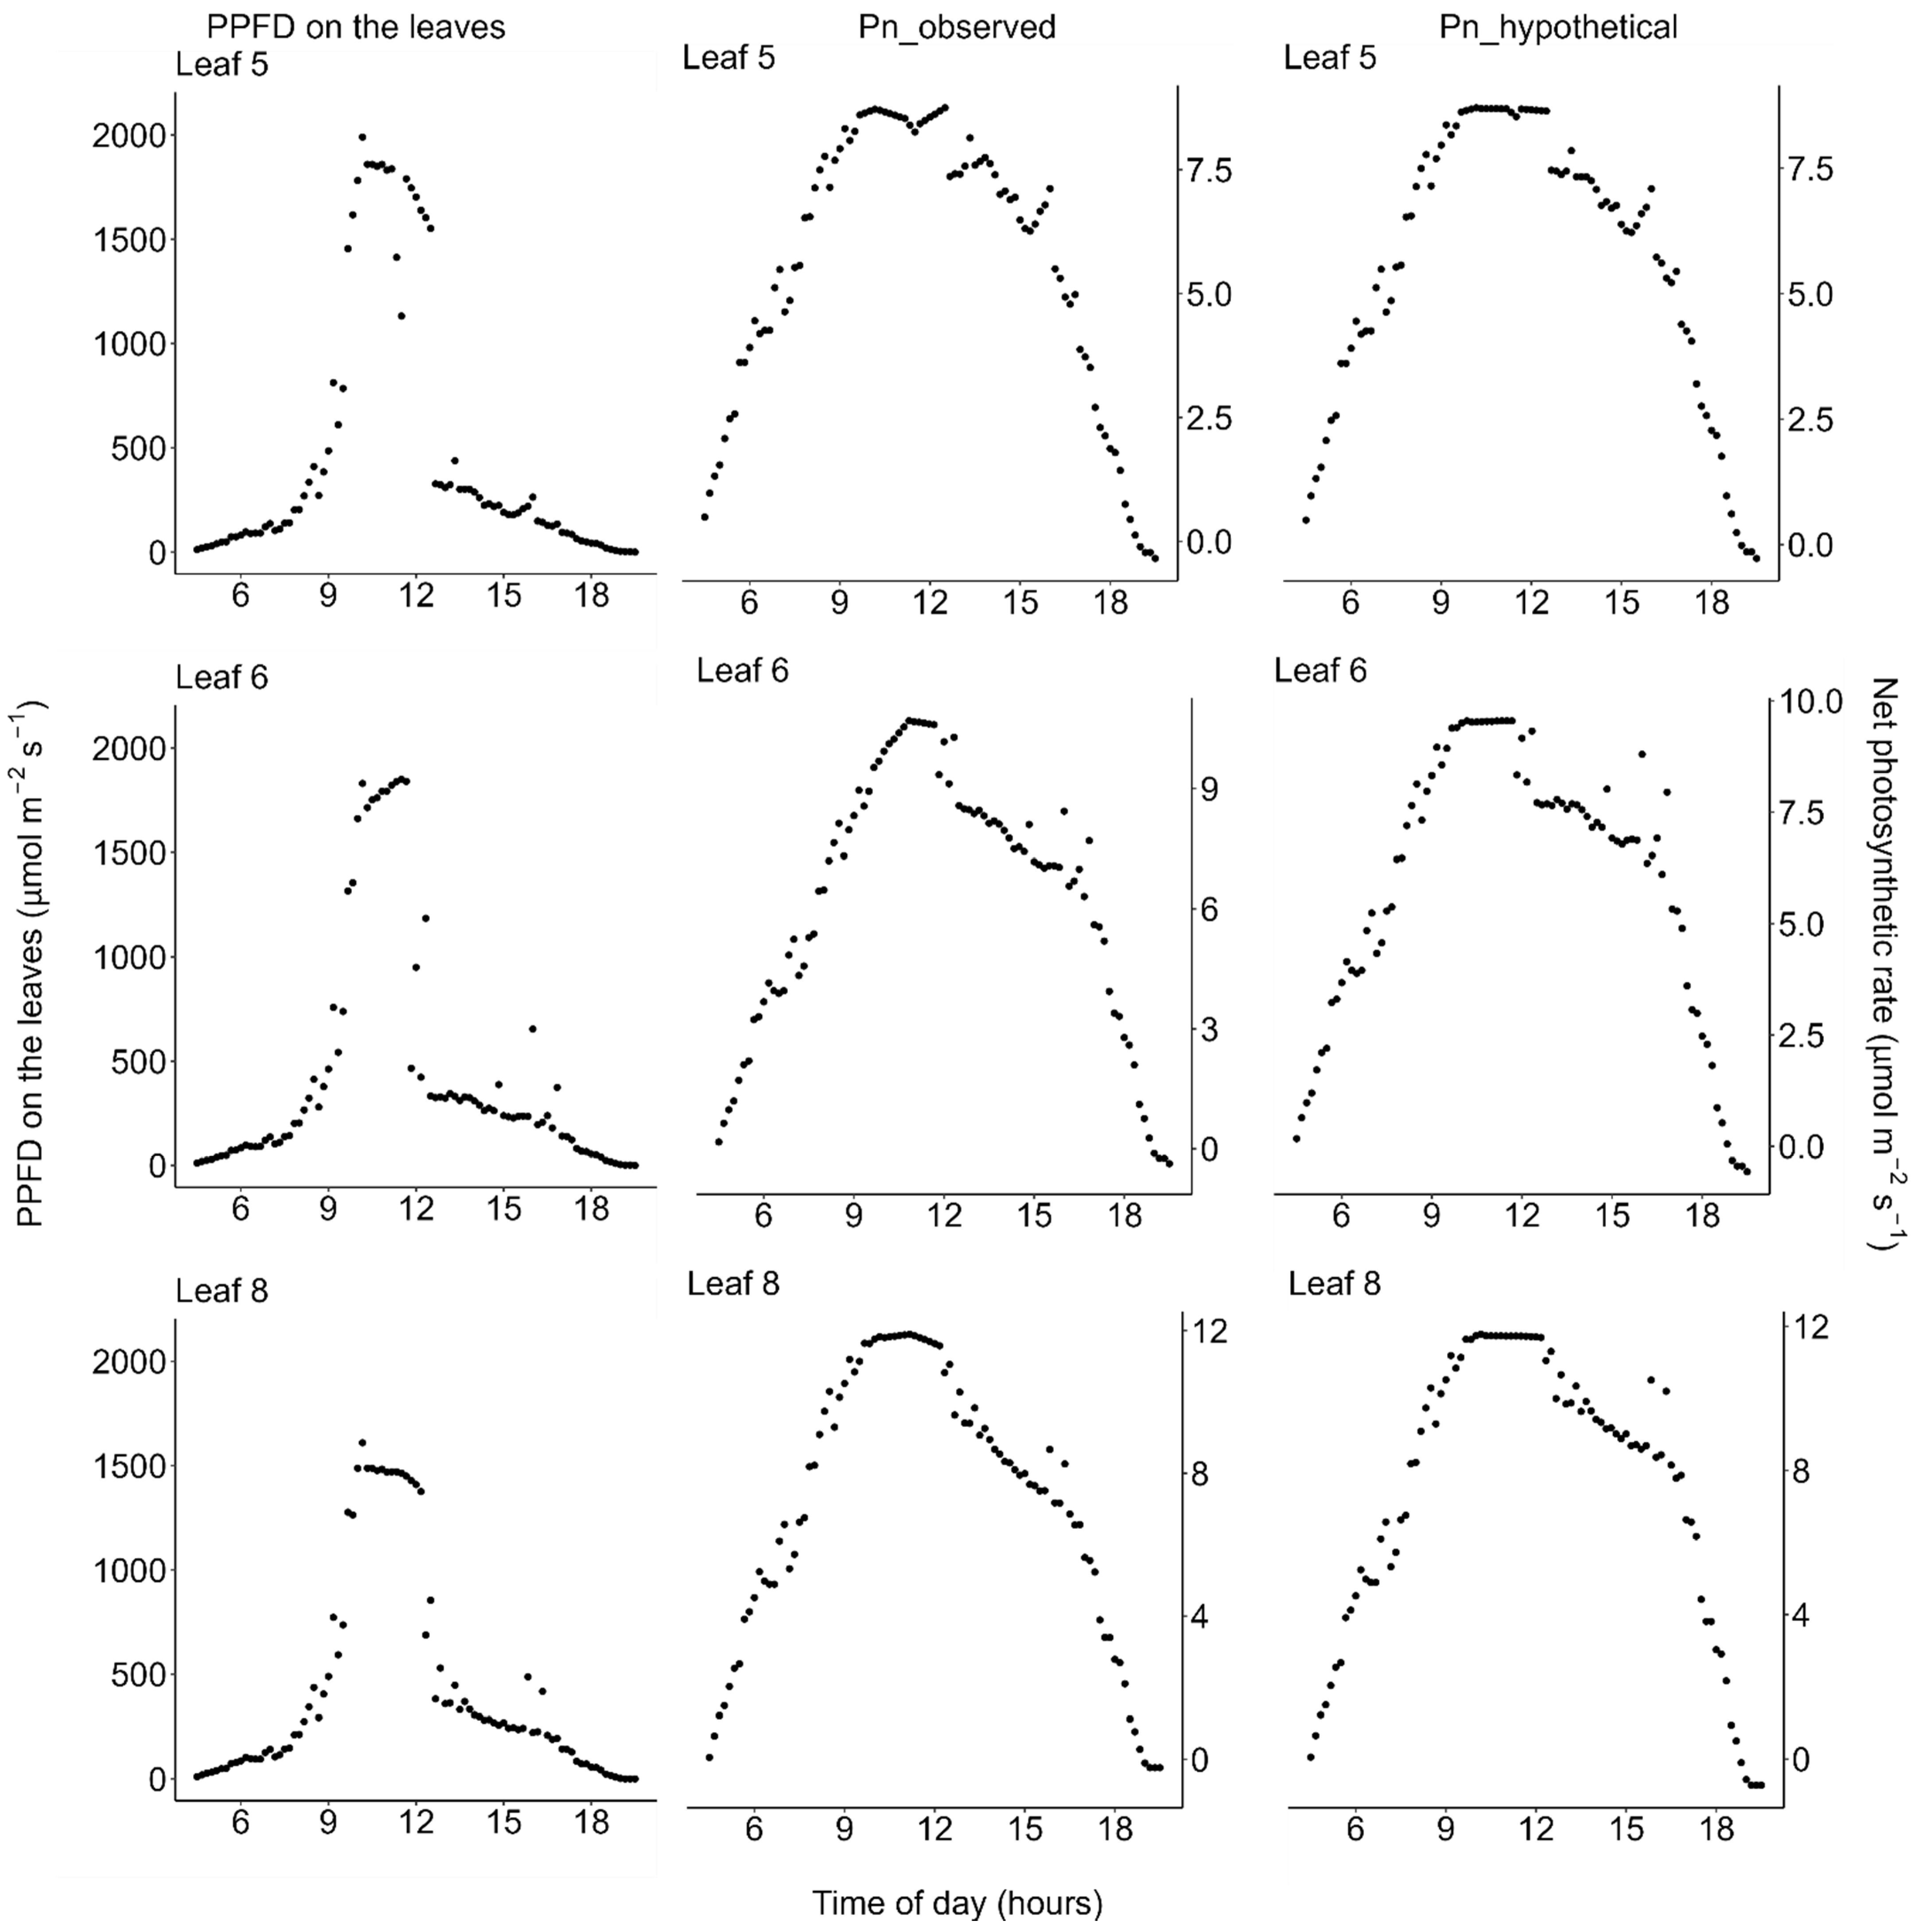
2.2. Photosynthesis
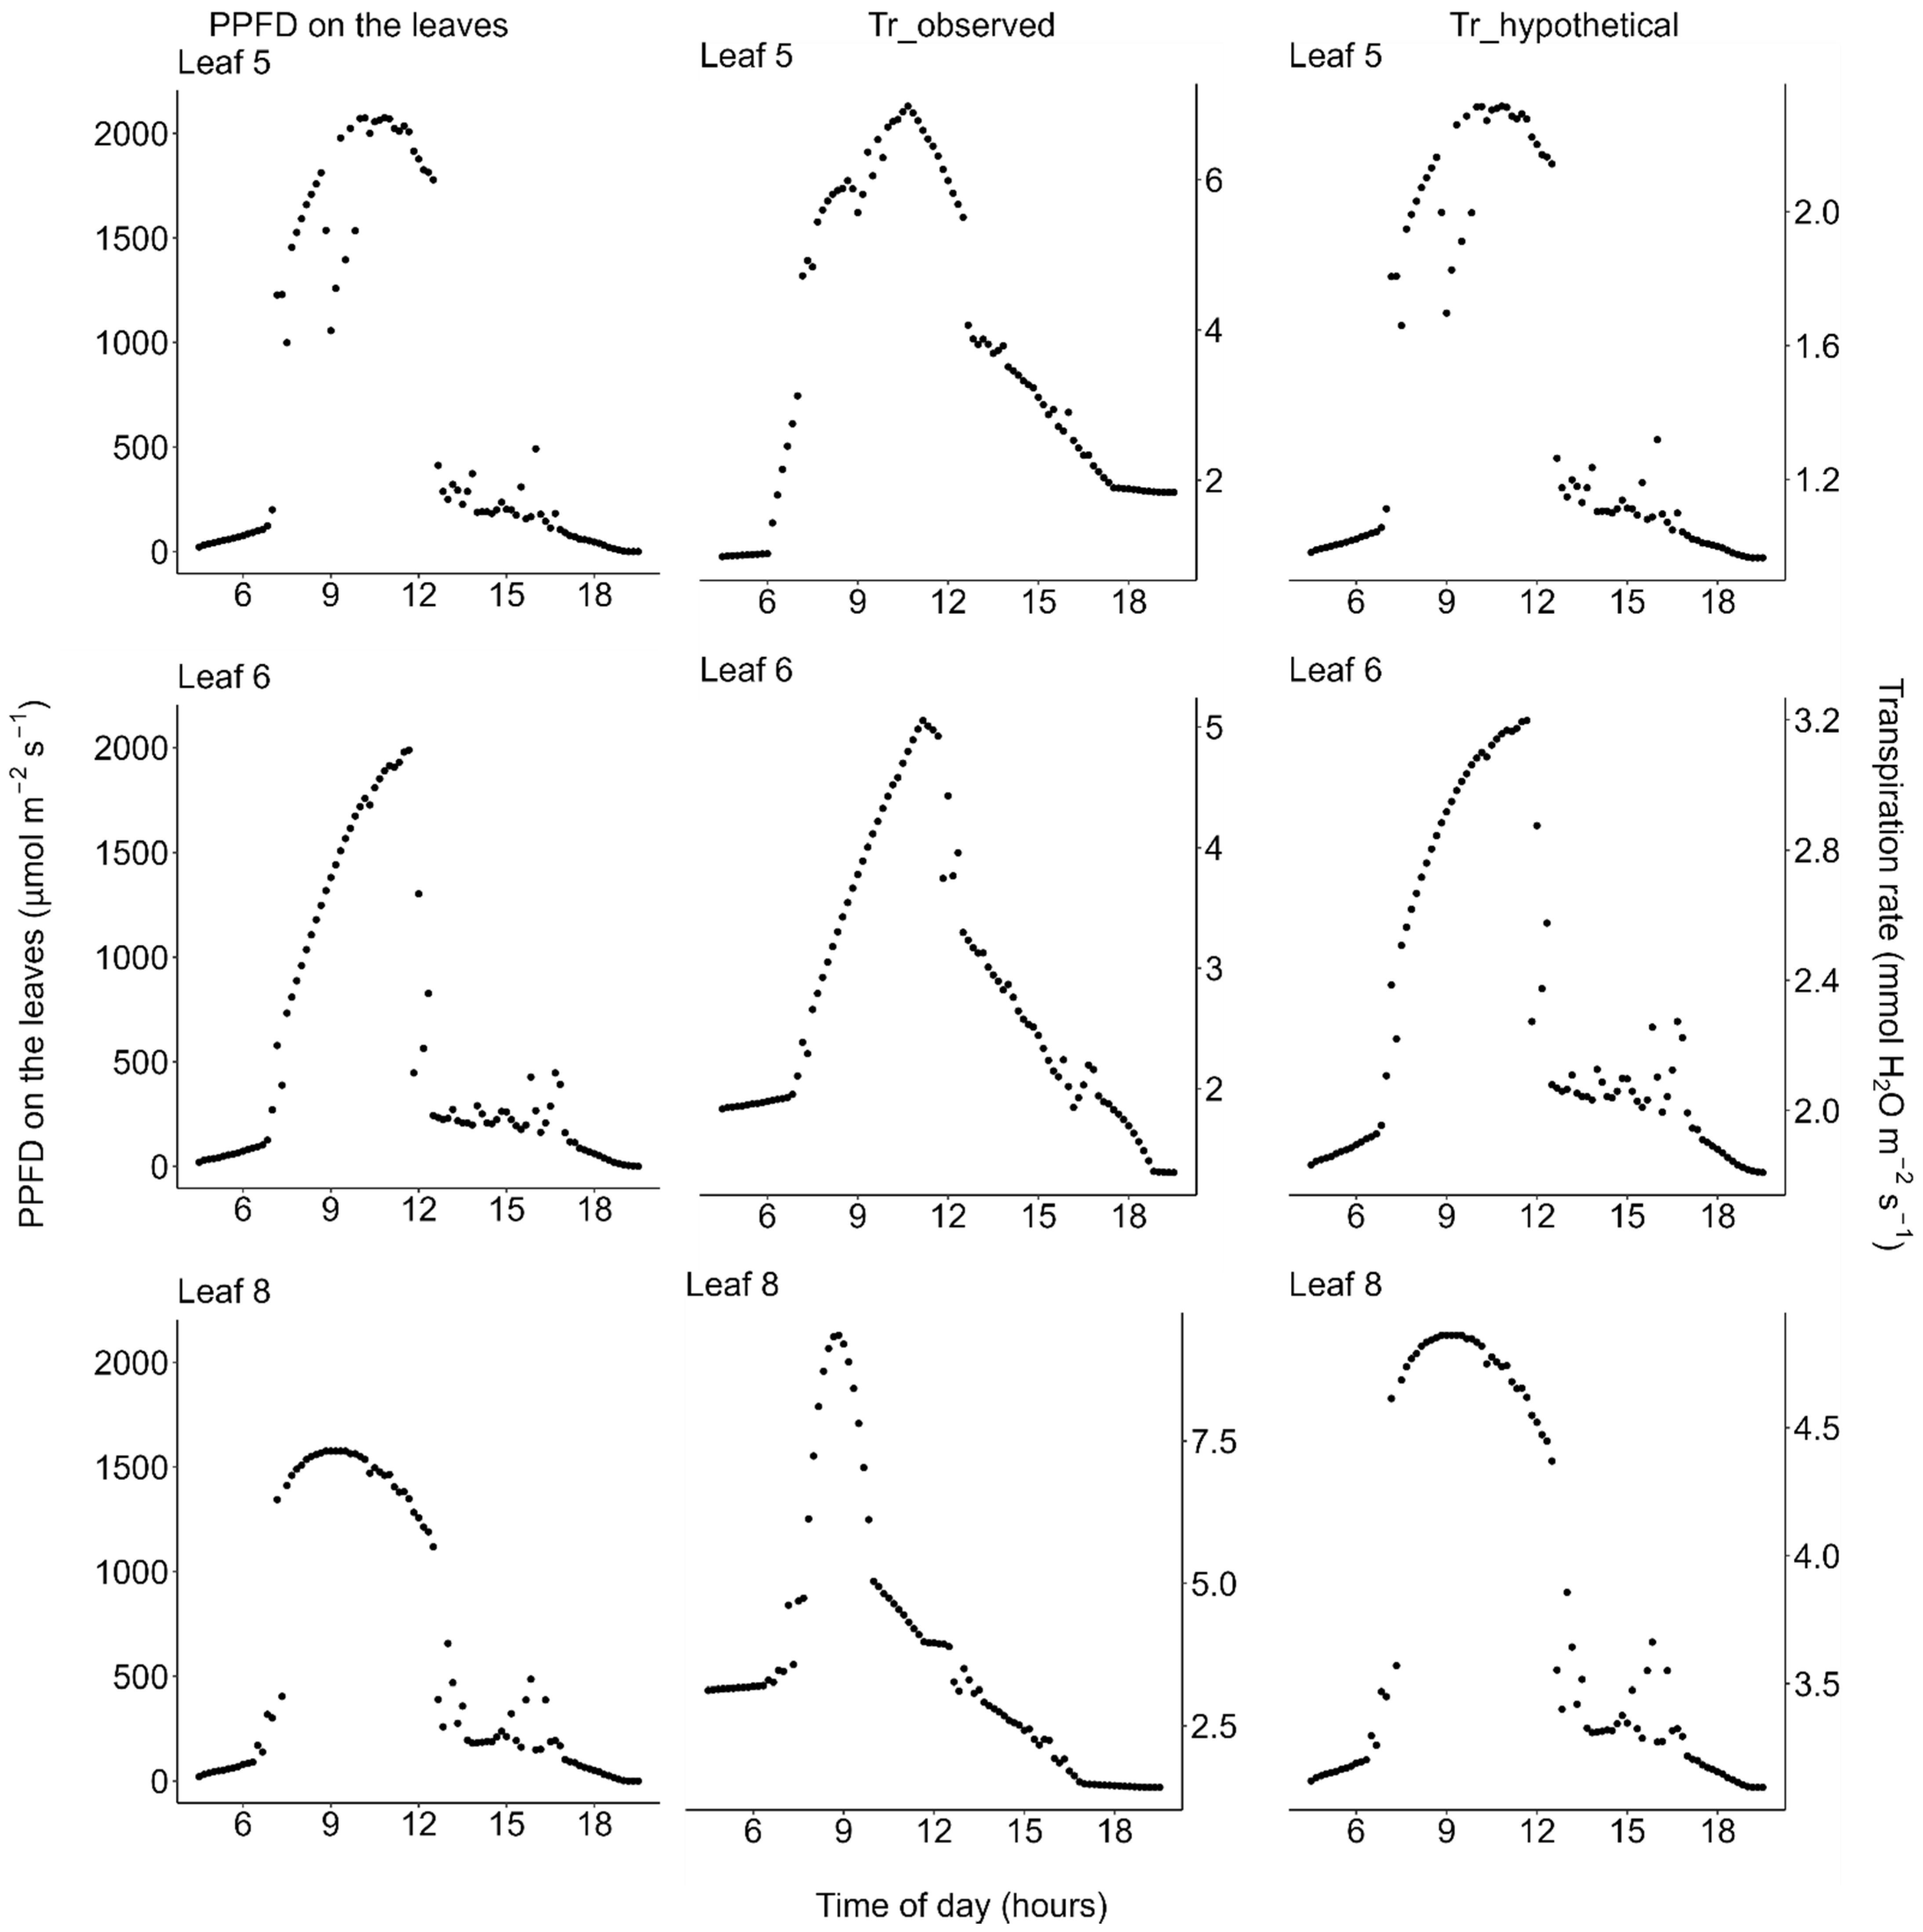
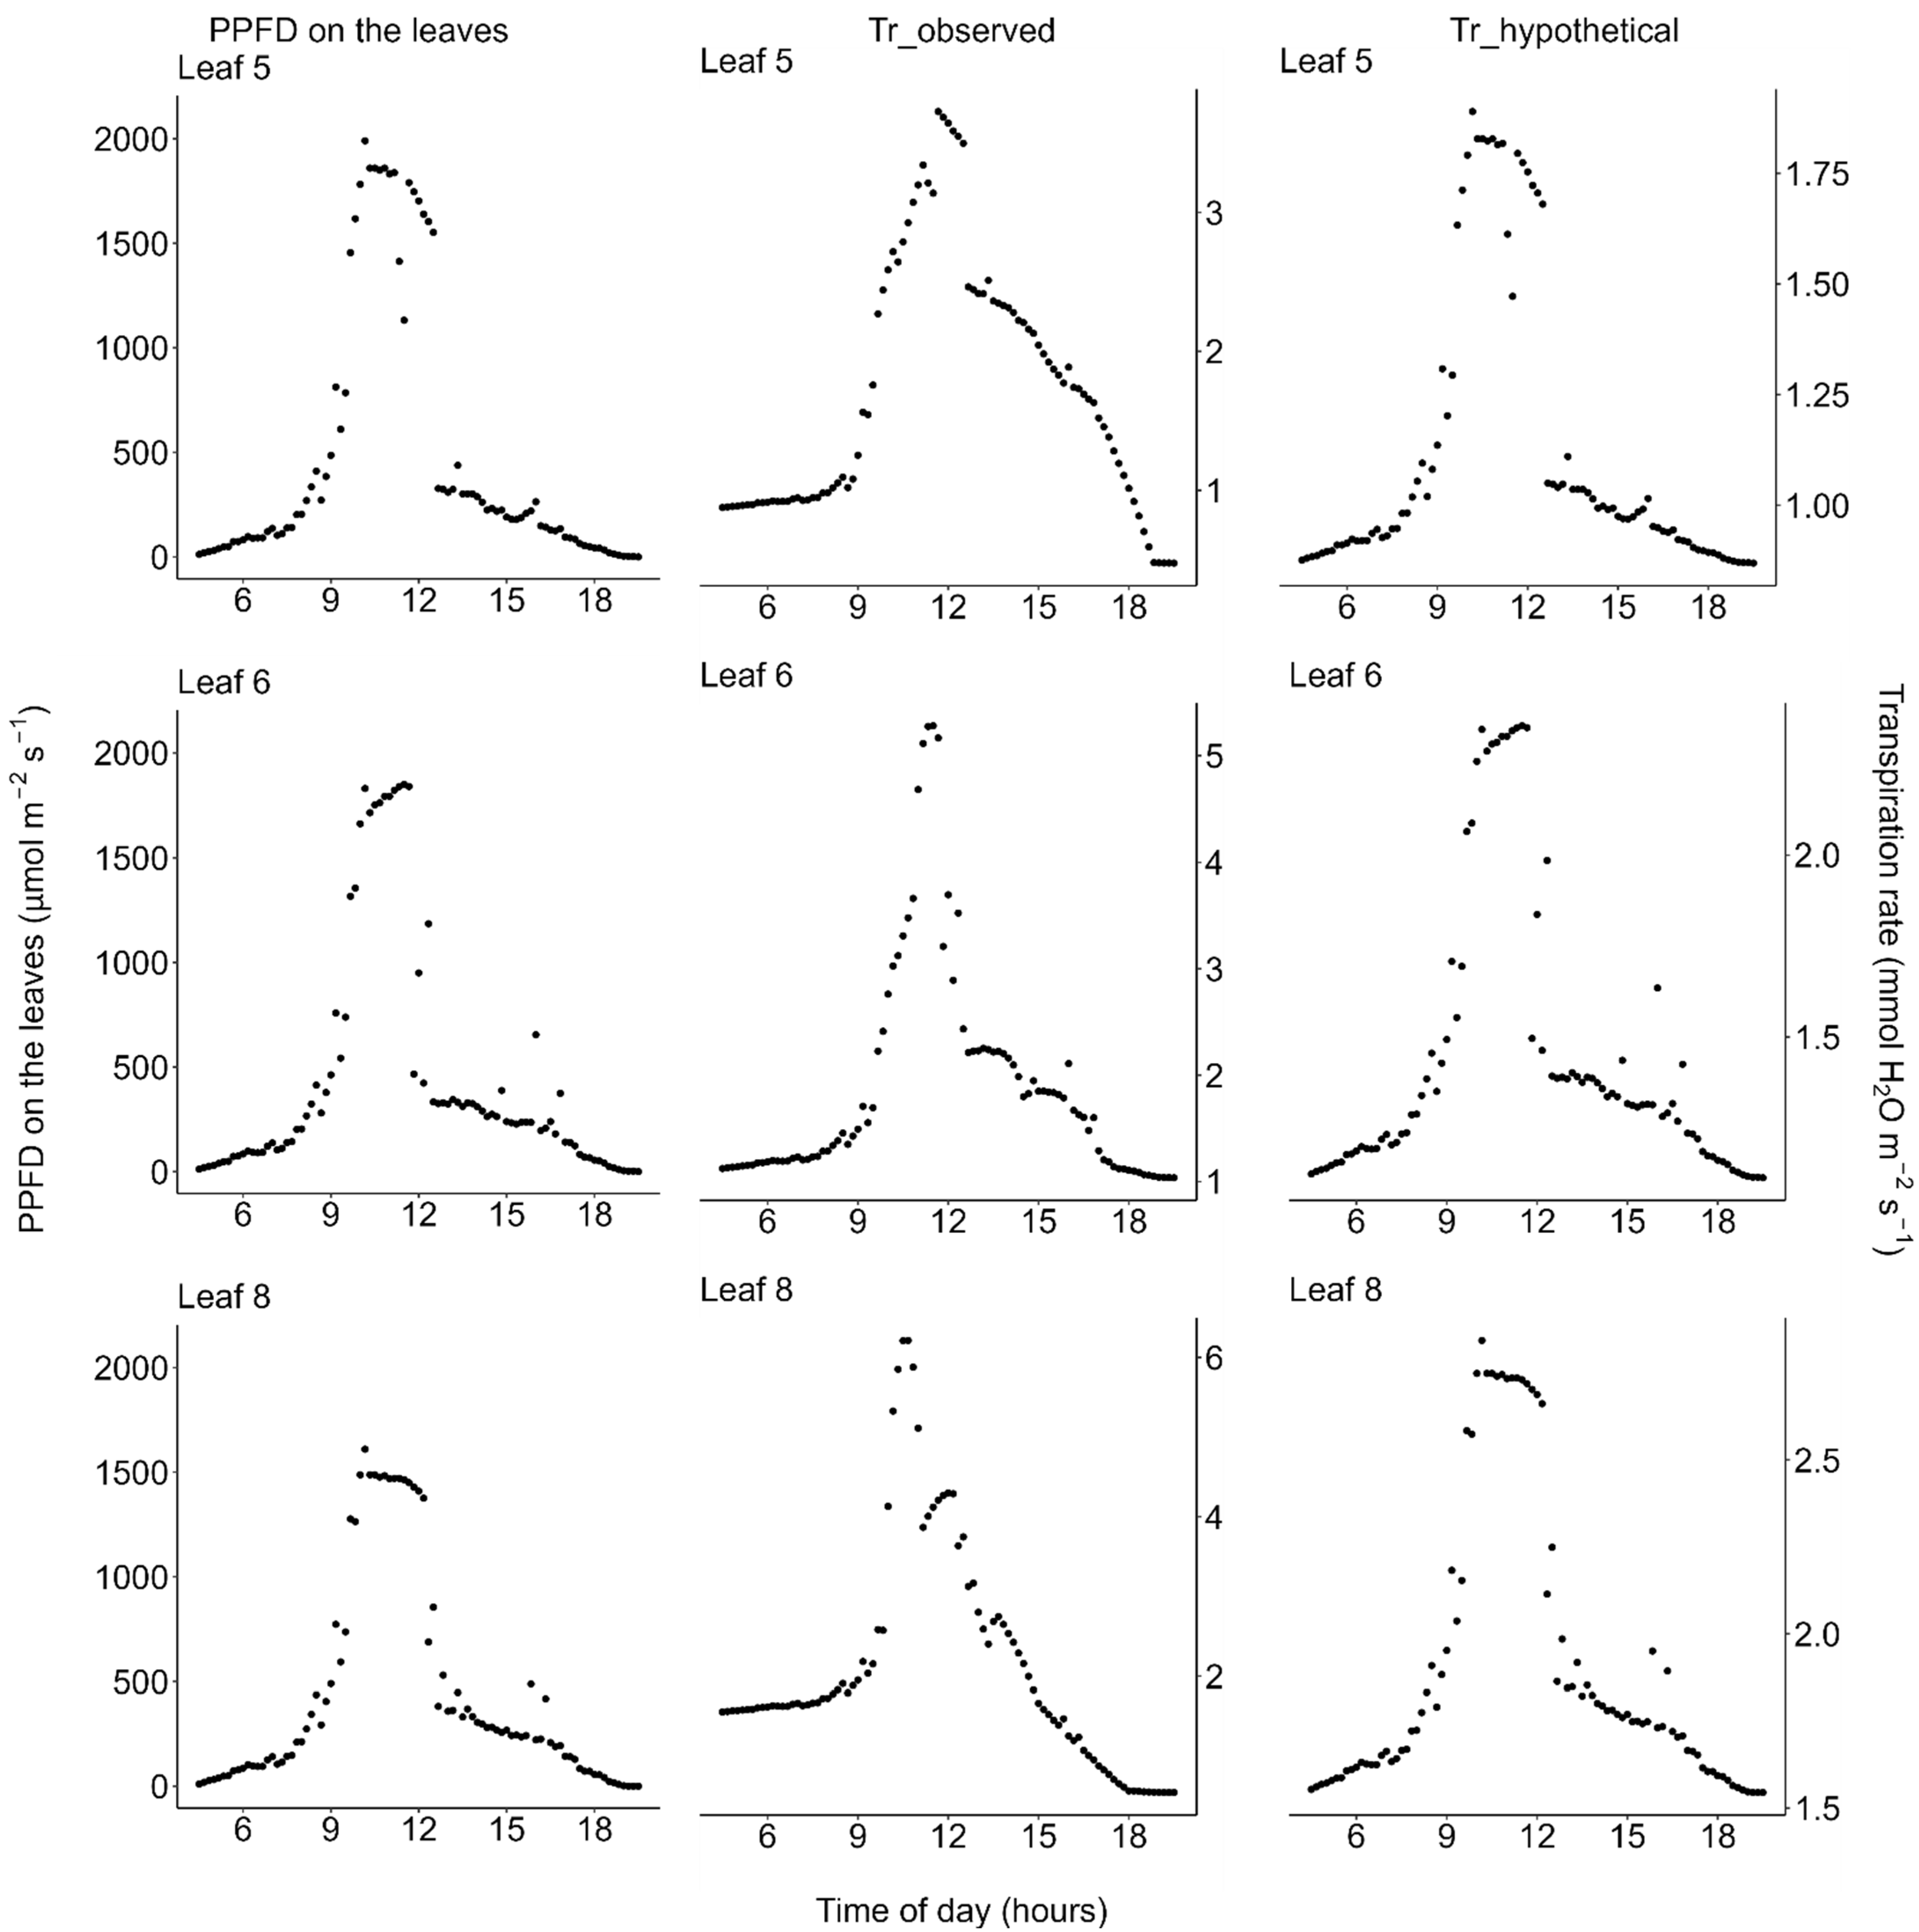
2.3. Transpiration
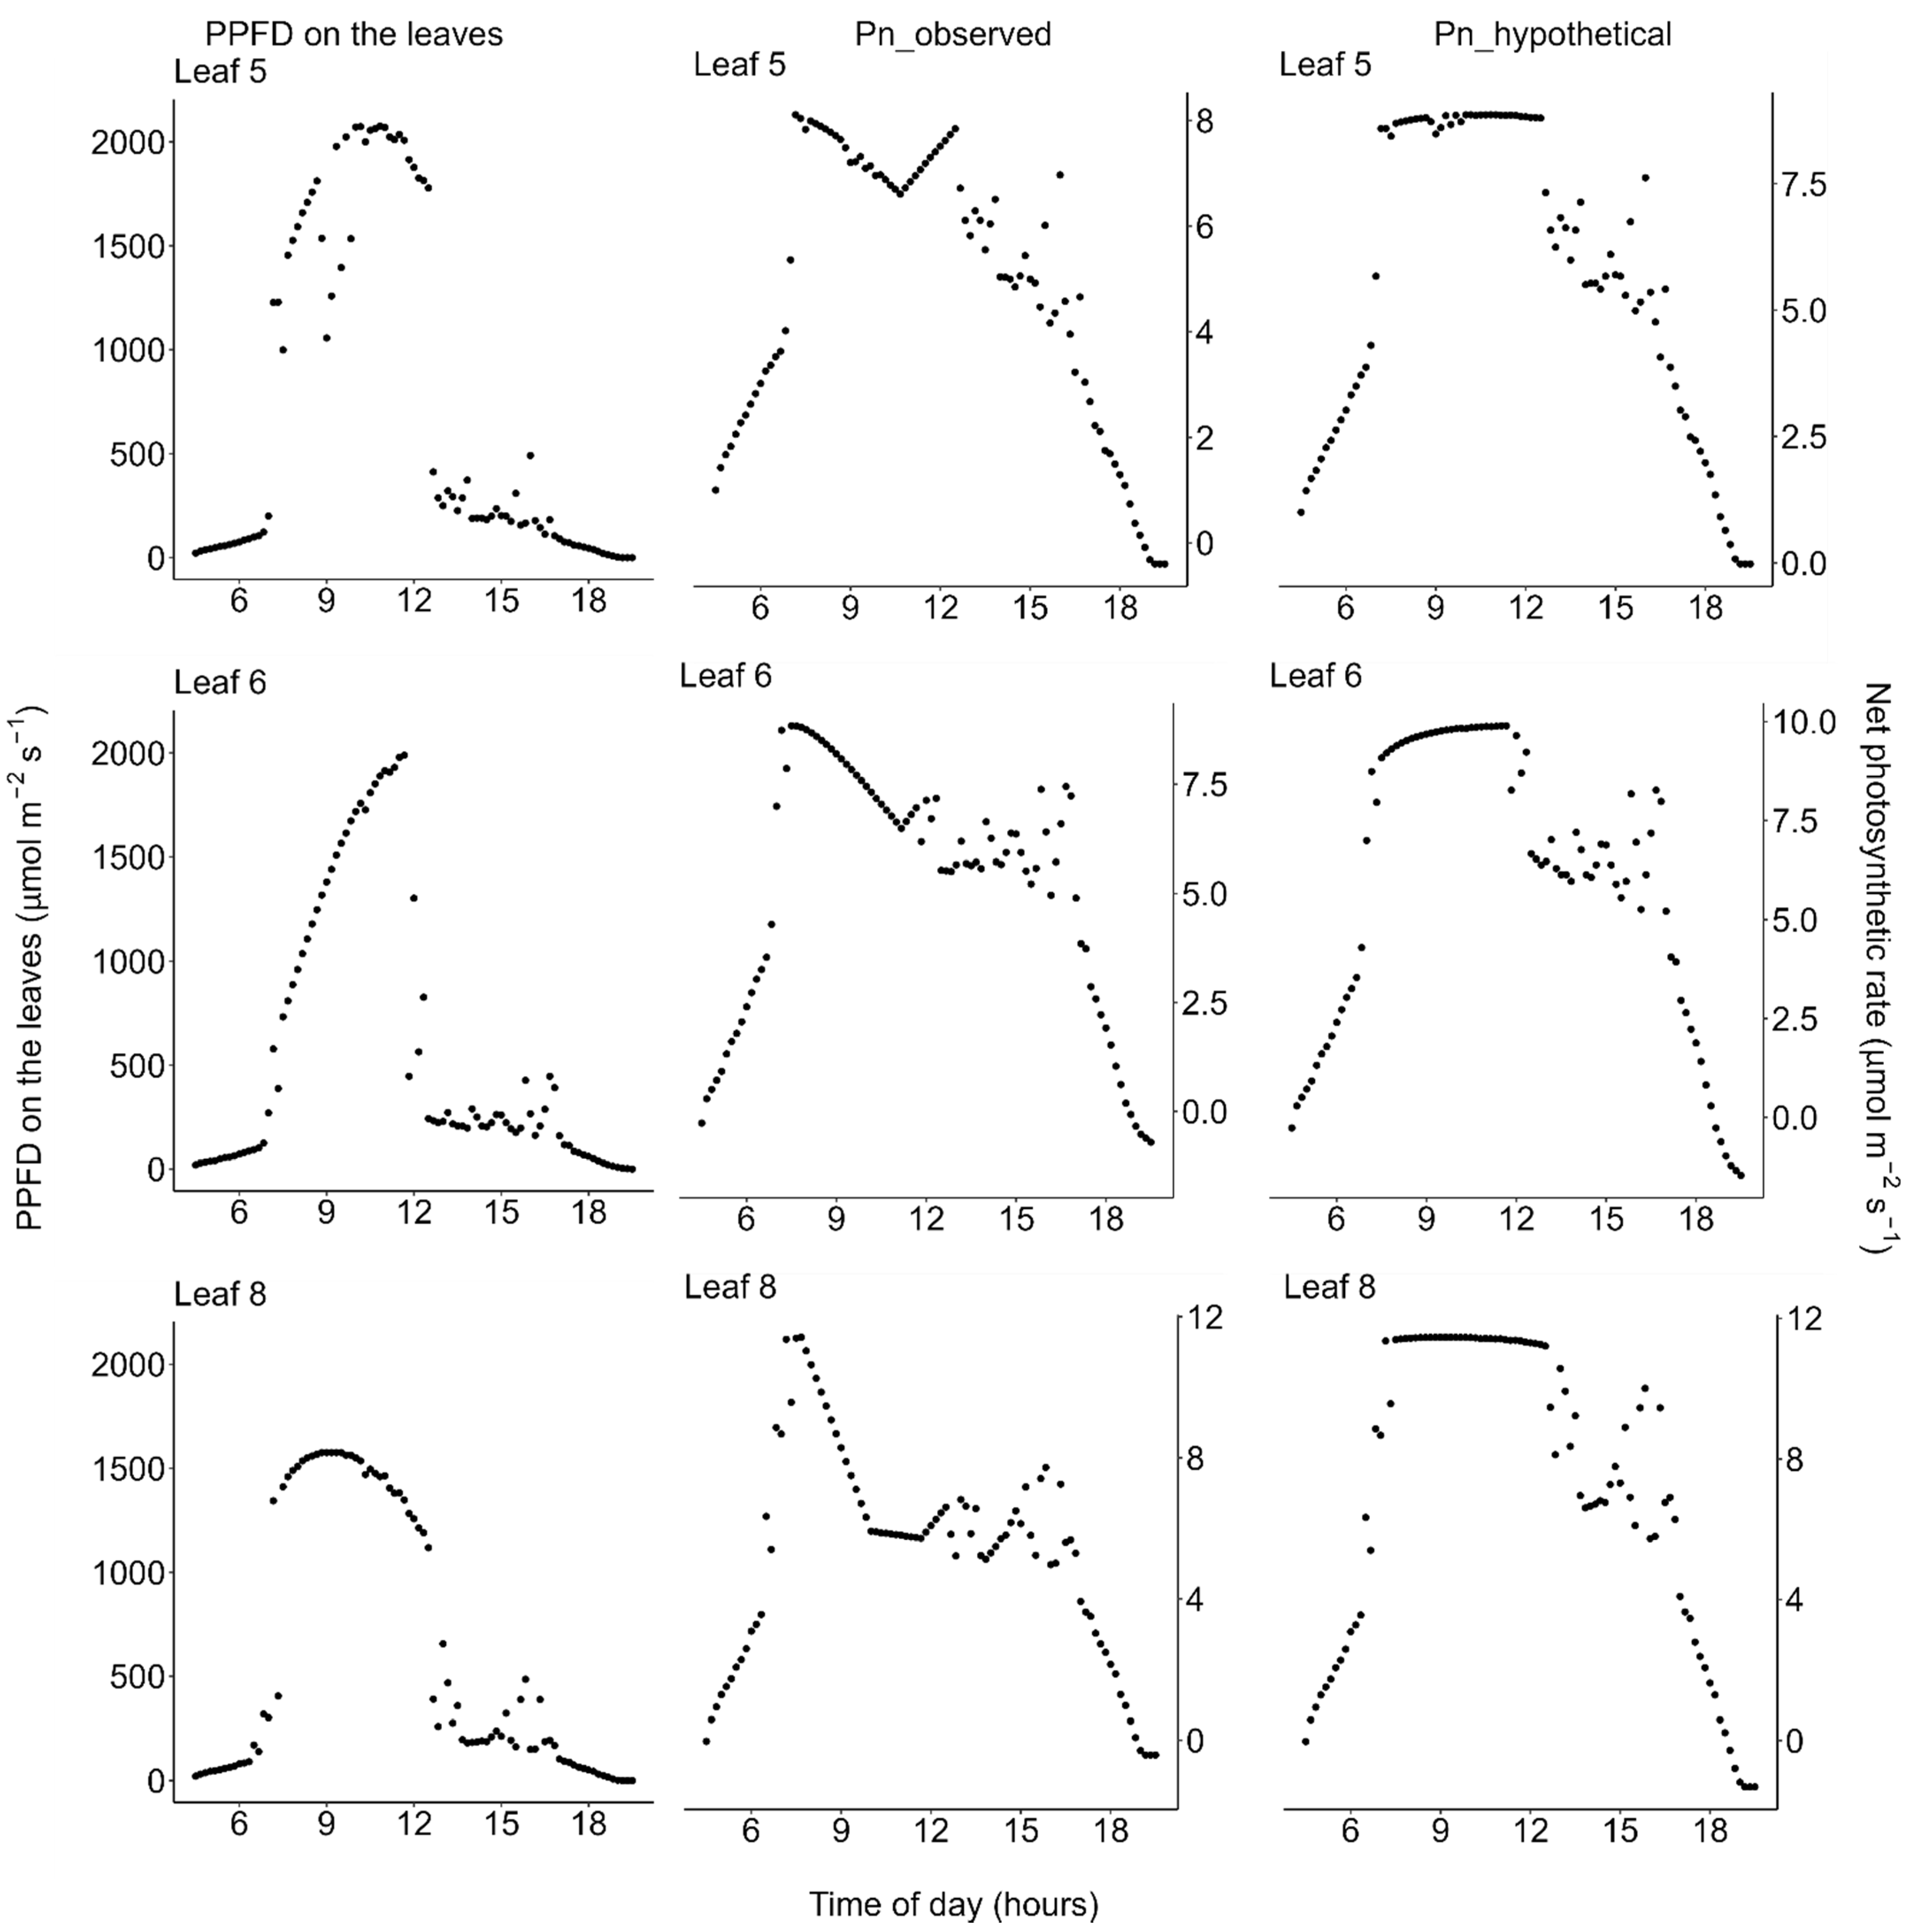
2.4. Daily Carbon Gain
3. Discussion
4. Materials and Methods
4.1. Study Site
4.2. Plant Materials
4.3. Field Measurements
4.4. Photosynthetic Measurements
4.5. PPFD Measurements
4.6. Data Analysis
4.7. Simulation
Supplementary Materials
Author Contributions
Funding
Institutional Review Board Statement
Informed Consent Statement
Data Availability Statement
Acknowledgments
Conflicts of Interest
References
- Luyssaert, S.; Schulze, E.D.; Borner, A.; Knohl, A.; Hessenmoller, D.; Law, B.E.; Ciais, P.; Grace, J. Old-growth forests as global carbon sinks. Nature 2008, 455, 213–215. [Google Scholar] [CrossRef]
- Hubau, W.; Lewis, S.L.; Phillips, O.L.; Affum-Baffoe, K.; Beeckman, H.; Cuní-Sanchez, A.; Daniels, A.K.; Ewango, C.E.N.; Fauset, S.; Mukinzi, J.M.; et al. Asynchronous carbon sink saturation in African and Amazonian tropical forests. Nature 2020, 579, 80–87. [Google Scholar] [CrossRef] [PubMed] [Green Version]
- Whiting, G.J. CO2 exchange in the Hudson Bay lowlands: Community characteristics and multispectral reflectance properties. J. Geophys. Res. Atmos. 1994, 99, 1519–1528. [Google Scholar] [CrossRef]
- Suyker, A.E.; Verma, S.B.; Arkebauer, T.J. Season-long measurement of carbon dioxide exchange in a boreal fen. J. Geophys. Res. Atmos. 1997, 102, 29021–29028. [Google Scholar] [CrossRef]
- Glenn, A.J.; Flanagan, L.B.; Syed, K.H.; Carlson, P.J. Comparison of net ecosystem CO2 exchange in two peatlands in western Canada with contrasting dominant vegetation, Sphagnum and Carex. Agric. For. Meteorol. 2006, 140, 115–135. [Google Scholar] [CrossRef]
- Liu, L.; Guan, L.; Liu, X. Directly estimating diurnal changes in GPP for C3 and C4 crops using far-red sun-induced chlorophyll fluorescence. Agric. For. Meteorol. 2017, 232, 1–9. [Google Scholar] [CrossRef]
- Harenda, K.M.; Lamentowicz, M.; Samson, M.; Chojnicki, B.H. The role of peatlands and their carbon storage function in the context of climate change. In Interdisciplinary Approaches for Sustainable Development Goals; Springer: Cham, Switzerland, 2018; pp. 169–187. [Google Scholar] [CrossRef]
- Harenda, K.M.; Samson, M.; Juszczak, R.; Markowicz, K.M.; Stachlewska, I.S.; Kleniewska, M.; MacArthur, A.; Schüttemeyer, D.; Chojnicki, B.H. Impact of atmospheric optical properties on net ecosystem productivity of peatland in poland. Remote Sens. 2021, 13, 2124. [Google Scholar] [CrossRef]
- Stangl, Z.R.; Tarvainen, L.; Wallin, G.; Marshall, J.D. Limits to photosynthesis: Seasonal shifts in supply and demand for CO2 in Scots pine. New Phytol. 2021, 233, 1108–1120. [Google Scholar] [CrossRef]
- Wu, Y.; Mao, X.; Zhang, Z.; Tang, W.; Cao, G.; Zhou, H.; Ma, J.; Yin, X. Temporal and spatial characteristics of CO2 flux in plateau urban wetlands and their influencing factors based on eddy covariance technique. Water 2021, 13, 1176. [Google Scholar] [CrossRef]
- Chen, F.; Cui, N.; Huang, Y.; Hu, X.; Gong, D.; Wang, Y.; Lv, M.; Jiang, S. Investigating the Patterns and Controls of Ecosystem Light Use Efficiency with the Data from the Global Farmland Fluxdata Network. Sustainability 2021, 13, 12673. [Google Scholar] [CrossRef]
- Cheng, X.; Zhou, Y.; Hu, M.; Wang, F.; Huang, H.; Zhang, J. The Links between Canopy Solar-Induced Chlorophyll Fluorescence and Gross Primary Production Responses to Meteorological Factors in the Growing Season in Deciduous Broadleaf Forest. Remote Sens. 2021, 13, 2363. [Google Scholar] [CrossRef]
- Jiao, L.; Kosugi, Y.; Sempuku, Y.; Chang, T.-w. Canopy conductance and gas exchange of a Japanese cypress forest after rainfall-induced wetness. Ecol. Res. 2021, 36, 947–960. [Google Scholar] [CrossRef]
- Kato, Y.; Tomotsune, M.; Shiote, F.; Koyama, Y.; Koizumi, H.; Yoshitake, S. Comparison of inter-annual variation in net primary production among three forest types in the same region over 7 years. J. For. Res. 2021, 26, 110–115. [Google Scholar] [CrossRef]
- Colina, M.; Kosten, S.; Silvera, N.; Clemente, J.M.; Meerhoff, M. Carbon fluxes in subtropical shallow lakes: Contrasting regimes differ in CH4 emissions. Hydrobiologia 2021, 1–18, in press. [Google Scholar] [CrossRef]
- Koyama, K.; Kikuzawa, K. Can we estimate forest gross primary production from leaf lifespan? A test in a young Fagus crenata forest. J. Ecol. Field Biol. 2010, 33, 253–260. [Google Scholar] [CrossRef] [Green Version]
- Field, C.B. Ecological scaling of carbon gain to stress and resource availability. In Response of Plants to Multiple Stresses; Mooney, H.A., Winner, W.E., Pell, E.J., Eds.; Academic Press: San Diego, USA, 1991; pp. 35–65. [Google Scholar]
- Koyama, K.; Kikuzawa, K. Is whole-plant photosynthetic rate proportional to leaf area? A test of scalings and a logistic equation by leaf demography census. Am. Nat. 2009, 173, 640–649. [Google Scholar] [CrossRef]
- Koyama, K.; Kikuzawa, K. Geometrical similarity analysis of photosynthetic light response curves, light saturation and light use efficiency. Oecologia 2010, 164, 53–63. [Google Scholar] [CrossRef] [PubMed] [Green Version]
- Hikosaka, K. Optimality of nitrogen distribution among leaves in plant canopies. J. Plant Res. 2016, 129, 299–311. [Google Scholar] [CrossRef]
- Ventre-Lespiaucq, A.; Flanagan, N.S.; Ospina-Calderón, N.H.; Delgado, J.A.; Escudero, A. Midday Depression vs. Midday Peak in Diurnal Light Interception: Contrasting Patterns at Crown and Leaf Scales in a Tropical Evergreen Tree. Front. Plant Sci. 2018, 9, 727. [Google Scholar] [CrossRef] [PubMed] [Green Version]
- Tang, L.; Yin, D.; Chen, C.; Yu, D.; Han, W. Optimal Design of Plant Canopy Based on Light Interception: A Case Study with Loquat. Front. Plant Sci. 2019, 10, 364. [Google Scholar] [CrossRef]
- Lin, Y.-S.; Medlyn, B.E.; Duursma, R.A.; Prentice, I.C.; Wang, H.; Baig, S.; Eamus, D.; de Dios, V.R.; Mitchell, P.; Ellsworth, D.S.; et al. Optimal stomatal behaviour around the world. Nat. Clim. Chang. 2015, 5, 459–464. [Google Scholar] [CrossRef] [Green Version]
- Xiao, J.; Fisher, J.B.; Hashimoto, H.; Ichii, K.; Parazoo, N.C. Emerging satellite observations for diurnal cycling of ecosystem processes. Nat. Plants 2021, 7, 877–887. [Google Scholar] [CrossRef] [PubMed]
- Rastogi, A.; Stróżecki, M.; Kalaji, H.M.; Łuców, D.; Lamentowicz, M.; Juszczak, R. Impact of warming and reduced precipitation on photosynthetic and remote sensing properties of peatland vegetation. Environ. Exp. Bot. 2019, 160, 71–80. [Google Scholar] [CrossRef]
- Liu, Z.; Guo, C.; Bai, Y.; Zhang, N.; Yu, Q.; Zhao, F.; Lu, X. Far-Red Chlorophyll Fluorescence Radiance Tracks Photosynthetic Carbon Assimilation Efficiency of Dark Reactions. Appl. Sci. 2021, 11, 10821. [Google Scholar] [CrossRef]
- Miao, Y.; Cai, Y.; Wu, H.; Wang, D. Diurnal and seasonal variations in the photosynthetic characteristics and the gas exchange simulations of two rice cultivars grown at ambient and elevated CO2. Front. Plant Sci. 2021, 12, 651606. [Google Scholar] [CrossRef]
- Hirasawa, T. Leaf Photosynthesis of Upland and Lowland Crops Grown under Moisture-Rich Conditions. In The Leaf: A Platform for Performing Photosynthesis; Adams, W.W., III, Terashima, I., Eds.; Springer International Publishing: Cham, Switzerland, 2018; pp. 345–369. [Google Scholar] [CrossRef]
- Maai, E.; Nishimura, K.; Takisawa, R.; Nakazaki, T. Light stress-induced chloroplast movement and midday depression of photosynthesis in sorghum leaves. Plant Prod. Sci. 2020, 23, 172–181. [Google Scholar] [CrossRef]
- Marino, G.; Scalisi, A.; Guzmán-Delgado, P.; Caruso, T.; Marra, F.P.; Lo Bianco, R. Detecting Mild Water Stress in Olive with Multiple Plant-Based Continuous Sensors. Plants 2021, 10, 131. [Google Scholar] [CrossRef] [PubMed]
- Mihaljević, I.; Viljevac-Vuletić, M.; Šimić, D.; Tomaš, V.; Horvat, D.; Josipović, M.; Zdunić, Z.; Dugalić, K.; Vuković, D. Comparative Study of Drought Stress Effects on Traditional and Modern Apple Cultivars. Plants 2021, 10, 561. [Google Scholar] [CrossRef] [PubMed]
- Romero-Trigueros, C.; Gambín, J.M.B.; Nortes Tortosa, P.A.; Cabañero, J.J.A.; Nicolás Nicolás, E. Isohydricity of Two Different Citrus Species under Deficit Irrigation and Reclaimed Water Conditions. Plants 2021, 10, 2121. [Google Scholar] [CrossRef]
- Shapira, O.; Chernoivanov, S.; Neuberger, I.; Levy, S.; Rubinovich, L. Physiological Characterization of Young ‘Hass’ Avocado Plant Leaves Following Exposure to High Temperatures and Low Light Intensity. Plants 2021, 10, 1562. [Google Scholar] [CrossRef] [PubMed]
- Cabrera, J.A.; Ritter, A.; Raya, V.; Pérez, E.; Lobo, M.G. Papaya (Carica papaya L.) Phenology under Different Agronomic Conditions in the Subtropics. Agriculture 2021, 11, 173. [Google Scholar] [CrossRef]
- Faralli, M.; Bianchedi, P.L.; Bertamini, M.; Varotto, C. Rootstock genotypes shape the response of cv. Pinot gris to water deficit. Agronomy 2021, 11, 75. [Google Scholar] [CrossRef]
- Zheng, K.; Bo, Y.; Bao, Y.; Zhu, X.; Wang, J.; Wang, Y. A machine learning model for photorespiration response to multi-factors. Horticulturae 2021, 7, 207. [Google Scholar] [CrossRef]
- Ben Hamed, S.; Lefi, E.; Chaieb, M. Diurnal kinetics related to physiological parameters in Pistacia vera L. versus Pistacia atlantica Desf. under water stress conditions. Acta Physiol. Plant 2021, 43, 126. [Google Scholar] [CrossRef]
- Peng, X.; Hu, X.; Chen, D.; Zhou, Z.; Guo, Y.; Deng, X.; Zhang, X.; Yu, T. Prediction of Grape Sap Flow in a Greenhouse Based on Random Forest and Partial Least Squares Models. Water 2021, 13, 3078. [Google Scholar] [CrossRef]
- Angmo, P.; Phuntsog, N.; Namgail, D.; Chaurasia, O.P.; Stobdan, T. Effect of shading and high temperature amplitude in greenhouse on growth, photosynthesis, yield and phenolic contents of tomato (Lycopersicum esculentum Mill.). Physiol. Mol. Biol. Plants 2021, 27, 1539–1546. [Google Scholar] [CrossRef]
- Azhar, A.; Makihara, D.; Naito, H.; Ehara, H. Photosynthesis of Sago Palm (Metroxylon sagu Rottb.) Seedling at Different Air Temperatures. Agriculture 2018, 8, 4. [Google Scholar] [CrossRef] [Green Version]
- Oliveira da Silva, P.S.; de Oliveira Alves Sena, E.; Silva Gonzaga, M.I.; Ganassali de Oliveira, L.F.; dos Santos Maciel, L.B.; Pinheiro Fiaes dos Santos, M.; Costa de Mattos, E.; Lima Dias, K.L.; Botelho Carneiro, R.; Gutierrez Carnelossi, M.A. Calcium carbonate particle films and water regimes affect the acclimatization, ecophysiology and reproduction of tomato. Environ. Exp. Bot. 2019, 165, 19–29. [Google Scholar] [CrossRef]
- Hua, L.; Yu, F.; Qiu, Q.; He, Q.; Su, Y.; Liu, X.; Li, J. Relationships between diurnal and seasonal variation of photosynthetic characteristics of Eucalyptus plantation and environmental factors under dry-season irrigation with fertilization. Agric. Water Manag. 2021, 248, 106737. [Google Scholar] [CrossRef]
- Kenzo, T.; Inoue, Y.; Araki, M.G.; Kawasaki, T.; Kitaoka, S.; Tsurita, T.; Sakata, T.; Saito, S. Effects of Throughfall Exclusion on Photosynthetic Traits in Mature Japanese Cedar (Cryptomeria japonica (L. f.) D. Don.). Forests 2021, 12, 971. [Google Scholar] [CrossRef]
- Farquhar, G.D.; von Caemmerer, S.; Berry, J.A. A biochemical model of photosynthetic CO2 assimilation in leaves of C3 species. Planta 1980, 149, 78–90. [Google Scholar] [CrossRef] [PubMed] [Green Version]
- Wünsche, J.N.; Palmer, J.W.; Greer, D.H. Effects of Crop Load on Fruiting and Gas-exchange Characteristics of ‘Braeburn’/M.26 Apple Trees at Full Canopy. J. Am. Soc. Hort. Sci. 2000, 125, 93–99. [Google Scholar] [CrossRef] [Green Version]
- Snir, A.; Gurevitz, M.; Marcus, Y. Alterations in Rubisco activity and in stomatal behavior induce a daily rhythm in photosynthesis of aerial leaves in the amphibious-plant Nuphar lutea. Photosynth. Res. 2006, 90, 233–242. [Google Scholar] [CrossRef] [PubMed]
- Jarvis, P.G. The interpretation of the variations in leaf water potential and stomatal conductance found in canopies in the field. Philos. T. R. Soc. B 1976, 273, 593–610. [Google Scholar] [CrossRef]
- Schulze, E.D. Carbon Dioxide and Water Vapor Exchange in Response to Drought in the Atmosphere and in the Soil. Annu. Rev. Plant Physiol. 1986, 37, 247–274. [Google Scholar] [CrossRef]
- Ball, J.T.; Woodrow, I.E.; Berry, J. A model predicting stomatal conductance and its contribution to the control of photosynthesis under different environmental conditions. In Progress in Photosynthesis Research; Biggins, J., Ed.; Springer: Dordrecht, The Netherlands, 1987; pp. 221–224. [Google Scholar] [CrossRef]
- Tenhunen, J.; Pearcy, R.; Lnge, O. Diurnal variations in leaf conductance and gas exchange in natural environments. In Stomatal function; Zeiger, E., Farquhar, G.D., Cowan, I., Eds.; Stanford University Press: Stanford, CA, USA, 1987; pp. 323–351. [Google Scholar]
- Leuning, R. A critical appraisal of a combined stomatal-photosynthesis model for C3 plants. Plant Cell Environ. 1995, 18, 339–355. [Google Scholar] [CrossRef]
- Katul, G.; Manzoni, S.; Palmroth, S.; Oren, R. A stomatal optimization theory to describe the effects of atmospheric CO2 on leaf photosynthesis and transpiration. Ann. Bot. 2010, 105, 431–442. [Google Scholar] [CrossRef] [Green Version]
- Medlyn, B.E.; Duursma, R.A.; Eamus, D.; Ellsworth, D.S.; Prentice, I.C.; Barton, C.V.M.; Crous, K.Y.; De Angelis, P.; Freeman, M.; Wingate, L. Reconciling the optimal and empirical approaches to modelling stomatal conductance. Glob. Chang. Biol. 2011, 17, 2134–2144. [Google Scholar] [CrossRef] [Green Version]
- Schulze, E.-D.; Lange, O.; Evenari, M.; Kappen, L.; Buschbom, U. Long-term effects of drought on wild and cultivated plants in the Negev desert. Oecologia 1980, 45, 19–25. [Google Scholar] [CrossRef]
- Tenhunen, J.D.; Lange, O.L.; Gebel, J.; Beyschlag, W.; Weber, J.A. Changes in photosynthetic capacity, carboxylation efficiency, and CO2 compensation point associated with midday stomatal closure and midday depression of net CO2 exchange of leaves of Quercus suber. Planta 1984, 162, 193–203. [Google Scholar] [CrossRef] [PubMed] [Green Version]
- Muraoka, H.; Tang, Y.H.; Terashima, I.; Koizumi, H.; Washitani, I. Contributions of diffusional limitation, photoinhibition and photorespiration to midday depression of photosynthesis in Arisaema heterophyllum in natural high light. Plant Cell Environ. 2000, 23, 235–250. [Google Scholar] [CrossRef]
- Li, J.; Hou, F.; Ren, J. Grazing Intensity Alters Leaf and Spike Photosynthesis, Transpiration, and Related Parameters of Three Grass Species on an Alpine Steppe in the Qilian Mountains. Plants 2021, 10, 294. [Google Scholar] [CrossRef] [PubMed]
- Deng, X.; Shi, Z.; Zeng, L.; Lei, L.; Xin, X.; Pei, S.; Xiao, W. Photosynthetic Product Allocations to the Organs of Pinus massoniana Are Not Affected by Differences in Synthesis or Temporal Variations in Translocation Rates. Forests 2021, 12, 471. [Google Scholar] [CrossRef]
- Tazaki, T.; Ishihara, K.; Ushijima, T. Influence of water stress on the photosynthesis and productivity of plants in humid areas. In Adaptation of Plants to Water and High Temperature Stress; Turner, N., Krammer, P., Eds.; Wiley: New York, NY, USA, 1980; pp. 309–321. [Google Scholar]
- Bates, L.M.; Hall, A.E. Stomatal closure with soil water depletion not associated with changes in Bulk leaf water status. Oecologia 1981, 50, 62–65. [Google Scholar] [CrossRef] [PubMed]
- Valladares, F.; Pearcy, R.W. Interactions between water stress, sun-shade acclimation, heat tolerance and photoinhibition in the sclerophyll Heteromeles arbutifolia. Plant Cell Environ. 1997, 20, 25–36. [Google Scholar] [CrossRef] [Green Version]
- Koyama, K.; Kikuzawa, K. Reduction of photosynthesis before midday depression occurred: Leaf photosynthesis of Fagus crenata in a temperate forest in relation to canopy position and a number of days after rainfall. Ecol. Res. 2011, 26, 999–1006. [Google Scholar] [CrossRef]
- Scoffoni, C.; Sack, L.; Ort, D. The causes and consequences of leaf hydraulic decline with dehydration. J. Exp. Bot. 2017, 68, 4479–4496. [Google Scholar] [CrossRef] [Green Version]
- Bhusal, N.; Kim, H.S.; Han, S.-G.; Yoon, T.-M. Photosynthetic traits and plant–water relations of two apple cultivars grown as bi-leader trees under long-term waterlogging conditions. Environ. Exp. Bot. 2020, 176, 104111. [Google Scholar] [CrossRef]
- Gadi, V.K.; Hussain, R.; Bordoloi, S.; Hossain, S.; Singh, S.R.; Garg, A.; Sekharan, S.; Karangat, R.; Lingaraj, S. Relating stomatal conductance and surface area with evapotranspiration induced suction in a heterogeneous grass cover. J. Hydrol. 2019, 568, 867–876. [Google Scholar] [CrossRef]
- Hirasawa, T.; Tsuchida, M.; Ishihara, K. Relationship between Resistance to Water Transport and Exudation Rate and the Effect of the Resistance on the Midday Depression of Stomatal Aperture in Rice Plants. Jpn. J. Crop Sci. 1992, 61, 145–152. [Google Scholar] [CrossRef] [Green Version]
- Fabre, D.; Yin, X.; Dingkuhn, M.; Clément-Vidal, A.; Roques, S.; Rouan, L.; Soutiras, A.; Luquet, D. Is triose phosphate utilization involved in the feedback inhibition of photosynthesis in rice under conditions of sink limitation? J. Exp. Bot. 2019, 70, 5773–5785. [Google Scholar] [CrossRef]
- Niinemets, U.; Sonninen, E.; Tobias, M. Canopy gradients in leaf intercellular CO2 mole fractions revisited: Interactions between leaf irradiance and water stress need consideration. Plant Cell Environ. 2004, 27, 569–583. [Google Scholar] [CrossRef]
- Ishida, A.; Toma, T.; Marjenah. Leaf gas exchange and chlorophyll fluorescence in relation to leaf angle, azimuth, and canopy position in the tropical pioneer tree, Macaranga conifera. Tree Physiol. 1999, 19, 117–124. [Google Scholar] [CrossRef]
- Ishida, A.; Toma, T.; Marjenah. Limitation of leaf carbon gain by stomatal and photochemical processes in the top canopy of Macaranga conifera, a tropical pioneer tree. Tree Physiol. 1999, 19, 467–473. [Google Scholar] [CrossRef]
- Koyama, K.; Takemoto, S. Morning reduction of photosynthetic capacity before midday depression. Sci. Rep. 2014, 4, 4389. [Google Scholar] [CrossRef]
- Murakami, K.; Hamasaki, T.; Nemoto, M.; Inoue, S.; Hirota, T. Photosynthetic and respiratory activities of spinach in an unheated greenhouse during winter in Sapporo, Japan. J. Agric. Meteorol. 2021, 77, 109–117. [Google Scholar] [CrossRef]
- Pearcy, R.; Berry, J.; Bartholoomew, B. Field photosynthetic performance and leaf temperatures of Phragmites communis under summer conditions in Death Valley, California. Photosynthetica 1974, 8, 104–108. [Google Scholar]
- Tsuchiya, T.; Shinozuka, A.; Ikusima, I. Photosynthesis and transpiration of an emergent Plant Zizania latifolia. Jpn. J. Limnol. 1995, 56, 33–38. [Google Scholar] [CrossRef]
- Jones, M.B. The photosynthetic characteristics of papyrus in a tropical swamp. Oecologia 1987, 71, 355–359. [Google Scholar] [CrossRef]
- Sale, P.J.M.; Orr, P.T. Gas exchange of Typha orientalis Presl. communities in artificial ponds. Aquat. Bot. 1986, 23, 329–339. [Google Scholar] [CrossRef]
- Sale, P.J.M.; Orr, P.T.; Shell, G.S.; Erskine, D.J.C. Photosynthesis and growth rates in Salvinia molesta and Eichhornia crassipes. J. Appl. Ecol. 1985, 22, 125–137. [Google Scholar] [CrossRef]
- Takanashi, S.; Kosugi, Y.; Matsuo, N.; Tani, M.; Ohte, N. Patchy stomatal behavior in broad-leaved trees grown in different habitats. Tree Physiol. 2006, 26, 1565–1578. [Google Scholar] [CrossRef] [Green Version]
- Kosugi, Y.; Takanashi, S.; Matsuo, N.; Nik, A.R. Midday depression of leaf CO2 exchange within the crown of Dipterocarpus sublamellatus in a lowland dipterocarp forest in Peninsular Malaysia. Tree Physiol. 2009, 29, 505–515. [Google Scholar] [CrossRef]
- Kamakura, M.; Kosugi, Y.; Takanashi, S.; Tobita, H.; Uemura, A.; Utsugi, H. Observation of the scale of patchy stomatal behavior in leaves of Quercus crispula using an Imaging-PAM chlorophyll fluorometer. Tree Physiol. 2012, 32, 839–846. [Google Scholar] [CrossRef] [PubMed] [Green Version]
- Zedler, J.B.; Kercher, S. WETLAND RESOURCES: Status, Trends, Ecosystem Services, and Restorability. Annu. Rev. Environ. Resour. 2005, 30, 39–74. [Google Scholar] [CrossRef] [Green Version]
- Erwin, K.L. Wetlands and global climate change: The role of wetland restoration in a changing world. Wetl. Ecol. Manag. 2008, 17, 71. [Google Scholar] [CrossRef]
- Short, F.T.; Kosten, S.; Morgan, P.A.; Malone, S.; Moore, G.E. Impacts of climate change on submerged and emergent wetland plants. Aquat. Bot. 2016, 135, 3–17. [Google Scholar] [CrossRef]
- Valentini, R.; Epron, D.; Deangelis, P.; Matteucci, G.; Dreyer, E. In situ estimation of net CO2 assimilation, photosynthetic electron flow and photorespiration in Turkey oak (Q. cerris L.) leaves: Diurnal cycles under different levels of water-supply. Plant Cell Environ. 1995, 18, 631–640. [Google Scholar] [CrossRef]
- Ishida, A.; Nakano, T.; Matsumoto, Y.; Sakoda, M.; Ang, L.H. Diurnal changes in leaf gas exchange and chlorophyll fluorescence in tropical tree species with contrasting light requirements. Ecol. Res. 1999, 14, 77–88. [Google Scholar] [CrossRef]
- Yamazaki, J.-Y.; Yoda, E.; Takahashi, A.; Sonoike, K.; Maruta, E. Pacific Ocean and Japan Sea ecotypes of Japanese beech (Fagus crenata) differ in photosystem responses to continuous high light. Tree Physiol. 2007, 27, 961–968. [Google Scholar] [CrossRef] [PubMed]
- Misson, L.; Limousin, J.M.; Rodriguez, R.; Letts, M.G. Leaf physiological responses to extreme droughts in Mediterranean Quercus ilex forest. Plant Cell Environ. 2010, 33, 1898–1910. [Google Scholar] [CrossRef] [PubMed]
- Palma, C.F.F.; Castro-Alves, V.; Morales, L.O.; Rosenqvist, E.; Ottosen, C.-O.; Strid, Å. Spectral Composition of Light Affects Sensitivity to UV-B and Photoinhibition in Cucumber. Front. Plant Sci. 2021, 11, 610011. [Google Scholar] [CrossRef] [PubMed]
- Weis, E. Reversible heat-inactivation of the Calvin cycle: A possible mechanism of the temperature regulation of photosynthesis. Planta 1981, 151, 33–39. [Google Scholar] [CrossRef] [PubMed]
- Yamori, W.; Suzuki, K.; Noguchi, K.O.; Nakai, M.; Terashima, I. Effects of Rubisco kinetics and Rubisco activation state on the temperature dependence of the photosynthetic rate in spinach leaves from contrasting growth temperatures. Plant Cell Environ. 2006, 29, 1659–1670. [Google Scholar] [CrossRef]
- Miyashita, A.; Sugiura, D.; Sawakami, K.; Ichihashi, R.; Tani, T.; Tateno, M. Long-term, short-interval measurements of the frequency distributions of the photosynthetically active photon flux density and net assimilation rate of leaves in a cool-temperate forest. Agric. For. Meteorol. 2012, 152, 1–10. [Google Scholar] [CrossRef]
- Deguchi, R.; Koyama, K. Photosynthetic and morphological acclimation to high and low light environments in Petasites japonicus subsp. giganteus. Forests 2020, 11, 1365. [Google Scholar] [CrossRef]
- Morales, A.; Kaiser, E. Photosynthetic acclimation to fluctuating irradiance in plants. Front. Plant Sci. 2020, 11, 268. [Google Scholar] [CrossRef] [PubMed]
- Way, D.A.; Pearcy, R.W. Sunflecks in trees and forests: From photosynthetic physiology to global change biology. Tree Physiol. 2012, 32, 1066–1081. [Google Scholar] [CrossRef] [PubMed] [Green Version]
- Kaiser, E.; Morales, A.; Harbinson, J. Fluctuating light takes crop photosynthesis on a rollercoaster ride. Plant Physiol. 2018, 176, 977–989. [Google Scholar] [CrossRef] [Green Version]
- Sakoda, K.; Yamori, W.; Groszmann, M.; Evans, J.R. Stomatal, mesophyll conductance, and biochemical limitations to photosynthesis during induction. Plant Physiol. 2021, 185, 146–160. [Google Scholar] [CrossRef] [PubMed]
- Kimura, H.; Hashimoto-Sugimoto, M.; Iba, K.; Terashima, I.; Yamori, W. Improved stomatal opening enhances photosynthetic rate and biomass production in fluctuating light. J. Exp. Bot. 2020, 71, 2339–2350. [Google Scholar] [CrossRef]
- Shimadzu, S.; Seo, M.; Terashima, I.; Yamori, W. Whole irradiated plant leaves showed faster photosynthetic induction than individually irradiated leaves via improved stomatal opening. Front. Plant Sci. 2019, 10, 1512. [Google Scholar] [CrossRef] [Green Version]
- Yamori, W.; Kusumi, K.; Iba, K.; Terashima, I. Increased stomatal conductance induces rapid changes to photosynthetic rate in response to naturally fluctuating light conditions in rice. Plant Cell Environ. 2020, 43, 1230–1240. [Google Scholar] [CrossRef]
- Tatsumi, K.; Kuwabara, Y.; Motobayashi, T. Photosynthetic light-use efficiency of rice leaves under fluctuating incident light. Agrosyst. Geosci. Environ. 2020, 3, e20030. [Google Scholar] [CrossRef]
- Okajima, Y.; Taneda, H.; Noguchi, K.; Terashima, I. Optimum leaf size predicted by a novel leaf energy balance model incorporating dependencies of photosynthesis on light and temperature. Ecol. Res. 2012, 27, 333–346. [Google Scholar] [CrossRef]
- Leigh, A.; Sevanto, S.; Close, J.D.; Nicotra, A.B. The influence of leaf size and shape on leaf thermal dynamics: Does theory hold up under natural conditions? Plant Cell Environ. 2017, 40, 237–248. [Google Scholar] [CrossRef] [PubMed]
- Jagadish, S.V.K.; Way, D.A.; Sharkey, T.D. Plant heat stress: Concepts directing future research. Plant Cell Environ. 2021, 44, 1992–2005. [Google Scholar] [CrossRef]
- Madsen, J.D.; Morgan, C.M. Water temperature controls the growth of waterhyacinth and South American sponge plant. J. Aquat. Plant Manag. 2021, 59s, 28–32. [Google Scholar]
- Chen, Y.-J.; Choat, B.; Sterck, F.; Maenpuen, P.; Katabuchi, M.; Zhang, S.-B.; Tomlinson, K.W.; Oliveira, R.S.; Zhang, Y.-J.; Shen, J.-X.; et al. Hydraulic prediction of drought-induced plant dieback and top-kill depends on leaf habit and growth form. Ecol. Lett. 2021, 24, 2350–2363. [Google Scholar] [CrossRef] [PubMed]
- Bhusal, N.; Lee, M.; Reum Han, A.; Han, A.; Kim, H.S. Responses to drought stress in Prunus sargentii and Larix kaempferi seedlings using morphological and physiological parameters. For. Ecol. Manag. 2020, 465, 118099. [Google Scholar] [CrossRef]
- Bhusal, N.; Bhusal, S.J.; Yoon, T.-M. Comparisons of physiological and anatomical characteristics between two cultivars in bi-leader apple trees (Malus × domestica Borkh.). Sci. Hortic. 2018, 231, 73–81. [Google Scholar] [CrossRef]
- Japan Meteorological Agency. 2020. Available online: https://www.jma.go.jp (accessed on 14 September 2020).
- The Global Biodiversity Information Facility. 2021. Available online: http://www.gbif.org (accessed on 30 November 2021).
- Haraguchi, A. Seasonal changes in redox properties of peat, nutrition and phenology of Menyanthes trifoliata L. in a floating peat mat in Mizorogaike Pond, central Japan. Aquat. Ecol. 2004, 38, 351–357. [Google Scholar] [CrossRef]
- Tagawa, K. Repellence of nectar-thieving ants by a physical barrier: Adaptive role of petal hairs on Menyanthes trifoliata (Menyanthaceae). J. Asia-Pac. Entomol. 2018, 21, 1211–1214. [Google Scholar] [CrossRef]
- Baasanmunkh, S.; Oyuntsetseg, B.; Urgamal, M.; Norris, J.; Shiga, T.; Choi, H.J. Notes on the taxonomy of Nymphaeaceae and Menyanthaceae in Mongolia. J. Asia-Pac. Biodivers. 2021, in press. [Google Scholar] [CrossRef]
- Niwa, H. Assessing the activity of deer and their influence on vegetation in a wetland using automatic cameras and low altitude remote sensing (LARS). Eur. J. Wildl. Res. 2021, 67, 3. [Google Scholar] [CrossRef]
- Zhu, J.-J.; Yang, H.-X.; Li, Z.-H.; Wang, G.-K.; Feng, T.; Liu, J.-K. Anti-inflammatory lupane triterpenoids from Menyanthes trifoliata. J. Asian Nat. Prod. Res. 2019, 21, 597–602. [Google Scholar] [CrossRef]
- Kim, Y.; Lee, Y.-S.; Wee, J.; Hong, J.; Lee, M.; Kim, J.G.; Bae, Y.J.; Cho, K. Process-based modeling to assess the nutrient removal efficiency of two endangered hydrophytes: Linking nutrient-cycle with a multiple-quotas approach. Sci. Total Environ. 2021, 763, 144223. [Google Scholar] [CrossRef]
- Martz, F.; Turunen, M.; Julkunen-Tiitto, R.; Lakkala, K.; Sutinen, M.-L. Effect of the temperature and the exclusion of UVB radiation on the phenolics and iridoids in Menyanthes trifoliata L. leaves in the subarctic. Environ. Pollut. 2009, 157, 3471–3478. [Google Scholar] [CrossRef] [PubMed]
- Turusova, E.V.; Aleksandrova, L.N.; Lyshchikov, A.N.; Nasakin, O.E. Chemical Composition of Menyanthes trifoliata L. Leaves. Pharm. Chem. J. 2021, 55, 265–268. [Google Scholar] [CrossRef]
- R Core Team. R: A Language and Environment for Statistical Computing; R Foundation for Statistical Computing: Vienna, Austria, 2021. [Google Scholar]
- Clarke, E.; Sherrill-Mix, S. ggbeeswarm: Categorical Scatter (Violin Point) Plots. 2017. Available online: https://cran.r-project.org/web/packages/ggbeeswarm/index.html (accessed on 29 November 2021).
- Wickham, H. ggplot2: Elegant Graphics for Data Analysis; Springer International Publishing: Cham, Switzerland, 2016. [Google Scholar]
- Kassambara, A. ggpubr: ‘ggplot2’ Based Publication Ready Plots. R Package Version 0.4.0. 2020. Available online: https://CRAN.R-project.org/package=ggpubr (accessed on 30 November 2021).
- Elzhov, T.V.; Mullen, K.M.; Spiess, A.-N.; Bolker, B. minpack.lm: R Interface to the Levenberg-Marquardt Nonlinear Least-Squares Algorithm Found in MINPACK, Plus Support for Bounds. R Package Version 1.2-1. 2016. Available online: https://CRAN.R-project.org/package=minpack.lm (accessed on 30 November 2021).
- Johnson, I.R.; Thornley, J.H.M. A model of instantaneous and daily canopy photosynthesis. J. Theor. Biol. 1984, 107, 531–545. [Google Scholar] [CrossRef]
- Liu, Y.Y.; Li, J.; Liu, S.C.; Yu, Q.; Tong, X.J.; Zhu, T.T.; Gao, X.X.; Yu, L.X. Sugarcane leaf photosynthetic light responses and their difference between varieties under high temperature stress. Photosynthetica 2020, 58, 1009–1018. [Google Scholar] [CrossRef]
- Case, S.B.; Tarwater, C.E. Functional traits of avian frugivores have shifted following species extinction and introduction in the Hawaiian Islands. Funct. Ecol. 2020, 34, 2467–2476. [Google Scholar] [CrossRef]
- Koyama, K.; Tashiro, M. No effect of selective maturation on fruit traits for a bird-dispersed species, Sambucus racemosa. Plants 2021, 10, 376. [Google Scholar] [CrossRef] [PubMed]


| Unit | Median Value (Range) | ||
|---|---|---|---|
| Very Hot Day (19 July) | Moderately Hot Day (22 July) | ||
| Daily light integral incident on the inclined leaflet surfaces | mol photon m−2 leaf day−1 | 34.7 (31.1–39.2) | 24.8 (23.9–26.2) |
| Actual daily integrated net photosynthesis (A) | mol CO2 m−2 leaf day−1 | 0.255 (0.245–0.263) | 0.332 (0.295–0.375) |
| Simulated daily integrated net photosynthesis (with no midday depression) (B) | 0.309 (0.276–0.345) | 0.329 (0.299–0.383) | |
| Reduction 1: (B − A)/B (%) | % | 17.0% (11.2–23.6%) | −1.0% (−6.5–2.1%) |
Publisher’s Note: MDPI stays neutral with regard to jurisdictional claims in published maps and institutional affiliations. |
© 2022 by the authors. Licensee MDPI, Basel, Switzerland. This article is an open access article distributed under the terms and conditions of the Creative Commons Attribution (CC BY) license (https://creativecommons.org/licenses/by/4.0/).
Share and Cite
Okamoto, A.; Koyama, K.; Bhusal, N. Diurnal Change of the Photosynthetic Light-Response Curve of Buckbean (Menyanthes trifoliata), an Emergent Aquatic Plant. Plants 2022, 11, 174. https://doi.org/10.3390/plants11020174
Okamoto A, Koyama K, Bhusal N. Diurnal Change of the Photosynthetic Light-Response Curve of Buckbean (Menyanthes trifoliata), an Emergent Aquatic Plant. Plants. 2022; 11(2):174. https://doi.org/10.3390/plants11020174
Chicago/Turabian StyleOkamoto, Azumi, Kohei Koyama, and Narayan Bhusal. 2022. "Diurnal Change of the Photosynthetic Light-Response Curve of Buckbean (Menyanthes trifoliata), an Emergent Aquatic Plant" Plants 11, no. 2: 174. https://doi.org/10.3390/plants11020174