Article

Transcriptome Analysis Reveals Molecular Mechanisms under Salt Stress in Leaves of Foxtail Millet (Setaria italica L.)

1
National Engineering Research Center for the Efficient Utilization of Soil and Fertilizer, College of Resources and Environment, Shandong Agricultural University, Tai’an 271018, China
2
College of Agronomy, Northwest A&F University, Xianyang 712100, China
*
Authors to whom correspondence should be addressed.
Plants 2022, 11(14), 1864; https://doi.org/10.3390/plants11141864
Submission received: 2 June 2022 / Revised: 5 July 2022 / Accepted: 13 July 2022 / Published: 18 July 2022
(This article belongs to the Topic Plant Domestication and Crop Evolution)

Abstract

:
Foxtail millet (Setaria italica L.) is an important cereal for managing future water scarcity and ensuring food security, due to its strong drought and salt stress resistance owing to its developed root system. However, the molecular responses of foxtail millet leaves to salt stress are largely unknown. In this study, seeds of 104 foxtail millet accessions were subjected to 0.17 mol·L−1 NaCl stress during germination, and various germination-related parameters were analyzed to derive 5 salt-sensitive accessions and 13 salt-tolerant accessions. Hong Gu 2000 and Pu Huang Yu were the most salt-tolerant and salt-sensitive accessions, respectively. To determine the mechanism of the salt stress response, transcriptomic differences between the control and salt-treated groups were investigated. We obtained 2019 and 736 differentially expressed genes under salt stress in the salt-sensitive and salt-tolerant accessions, respectively. The transcription factor families bHLH, WRKY, AP2/ERF, and MYB-MYC were found to play critical roles in foxtail millet’s response to salt stress. Additionally, the down-regulation of ribosomal protein-related genes causes stunted growth in the salt-sensitive accessions. The salt-tolerant accession alleviates salt stress by increasing energy production. Our findings provide novel insights into the molecular mechanism of foxtail millet’s response to salt stress.

1. Introduction

Soil salinization poses significant ecological and environmental challenges in dry farming areas [1,2]. According to the World Food and Agriculture Organization and the Scientific and Educational Organization, salinized land covers approximately 950 million ha, accounting for 10% of the global land area [3,4]. Although salinized land has great agriculture potential due to its flat terrain and deep soil layer suitable for farming, the high salt content, high alkalinity, poor physical structure, and lack of nutrients in saline–alkali soil hinder the normal growth of plants and seriously threaten agricultural production [5]. Specifically, the lack of suitable salt-tolerant crops and limited understanding of the salt-tolerant mechanism restricts the development and utilization of salinized land [6,7].
Foxtail millet (Setaria italica L.; family Gramineae) is one of the oldest crops grown in the world, dating back some 7400–7935 years in northern China [8]. Foxtail millet occurs naturally in arid areas and semi-arid regions, with Asia and Africa producing nearly 95% of global production [9,10]. Foxtail millet contains a wide range of vitamins, amino acids, fats, minerals, and crude fiber [11,12]. In addition to its nutritional properties, foxtail millet has also been shown to provide several health benefits, such as the prevention of cancer and cardiac–cerebral vascular disease [13]. Therefore, the cultivation and processing of foxtail millet into high-value-added food can contribute significantly to the economic development of many countries in Asia and Africa [10]. More importantly, foxtail millet has a suitable adaptive ability to change environmental conditions, especially under increasingly intensified land aridification. Foxtail millet has a great potential for salt tolerance due to its strong fibrous root system, high water utilization rate, strong drought tolerance, and salt tolerance potential [14,15]. Nahar et al. [16] found that the salt tolerance of a foxtail millet accession could maintain higher dry matter and grain yield at 6 dS·m−1 salt level. Krishnamurthy et al. [17] identified 155 foxtail millet accessions in India on soil saturated with 100 mM NaCl, of which 13 accessions were highly tolerant. However, the salt-tolerance mechanism is unclear and the lack of genetic information related to salt tolerance restricts the popularization of foxtail millet cultivation in salinized land.
Transcriptome analysis is an important method for revealing the molecular mechanism underlying plant stress resistance [18]. Transcriptome refers to the collection of transcriptional products of a specific tissue or cell in a certain state [19,20]. Comparing differentially expressed genes (DEGs) of accessions with different salt tolerances by transcriptome technology can reveal the changes in plant expression pathways and the salt-tolerance mechanism.
The publication of the foxtail millet genome provided an opportunity to better understand the salt tolerance mechanism. Suppression subtractive hybridization of the whole seedlings allows the detection of effective signal-perception mechanisms in tolerant cultivars for metabolic adjustments under high saline conditions, and 81 differentially expressed transcripts not reported in other plants were identified [21]. Based on the differences in root transcription between the two foxtail millets studied by Pan et al. [22], the salt tolerance of foxtail millet was attributed to highly efficient ion channels and excellent antioxidant capacity. Nevertheless, foxtail millet leaves are more sensitive to salt stress at the seedling stage.
In this study, salt tolerance during germination and seeding of foxtail millet accessions in China was analyzed and evaluated to determine the salt-tolerant and salt-sensitive accessions. Then, the Illumina technology platform was employed to evaluate the gene expression changes in foxtail millet leaves during salt stress treatment at the molecular level. Through functional annotation of the transcriptome, DEGs in foxtail millet under salt stress were identified. The present study also reports the effects of salt stress on the expression of hub genes in foxtail millet leaf cells, which could provide both a theoretical and experimental basis for further work.

2. Results

2.1. Salt Tolerance Identification

The RGR, RGP, RGI, RPL, and RRL of 104 foxtail millet accessions (Table S1) at the germination stage were reduced under 0.17 mol·L−1 NaCl, suggesting that the foxtail millet underwent salt stress during germination. Based on fuzzy mathematics analysis for RGR, RGP, RGI, RPL, and RRL of 104 foxtail millet accessions during the germination stage, 5 salt-tolerant accessions and 13 salt-sensitive accessions were selected.
To determine the most salt-tolerant and salt-sensitive accessions, 5 salt-tolerant and 13 salt-sensitive accessions from the initial screening were subjected to secondary salt-tolerance identification. The 18 accessions were cultured to the seedling stage; the changes in relative biomass, relative growth rate, relative chlorophyll content, and relative K+/Na+ ratio under 0.13, 0.17, and 0.22 mol·L−1 NaCl concentrations were evaluated (Table 1 and Table S2). According to fuzzy mathematics analysis, FM6 ranked third, second, and first at 0.13, 0.17, and 0.22 mol·L−1 NaCl, respectively, which was the most salt-tolerant accession; FM90 was the most salt-sensitive accession, with the worst performance under all NaCl concentrations.

2.2. Transcriptome Assembly and Expression Analysis of DEGs

Between the salt-sensitive accession with salt stress (SS) library and salt-sensitive accession without salt stress (SC) library, the screened DEGs were labeled as SS/SC, while the screened DEGs between the salt-tolerant accession with salt stress (TS) library and salt-tolerant accession without salt stress (TC) library were labeled as TS/TC. Compared with SC, a total of 1176 genes were down-regulated in SS, 843 genes were up-regulated, and the expression of 21,741 genes was not significantly enriched. Compared with TC, 345 genes were down-regulated in SC treatment, 391 were up-regulated, and the expression of 21,004 did not differ significantly. There were 295 common DEGs in the SS/SC and TS/TC.

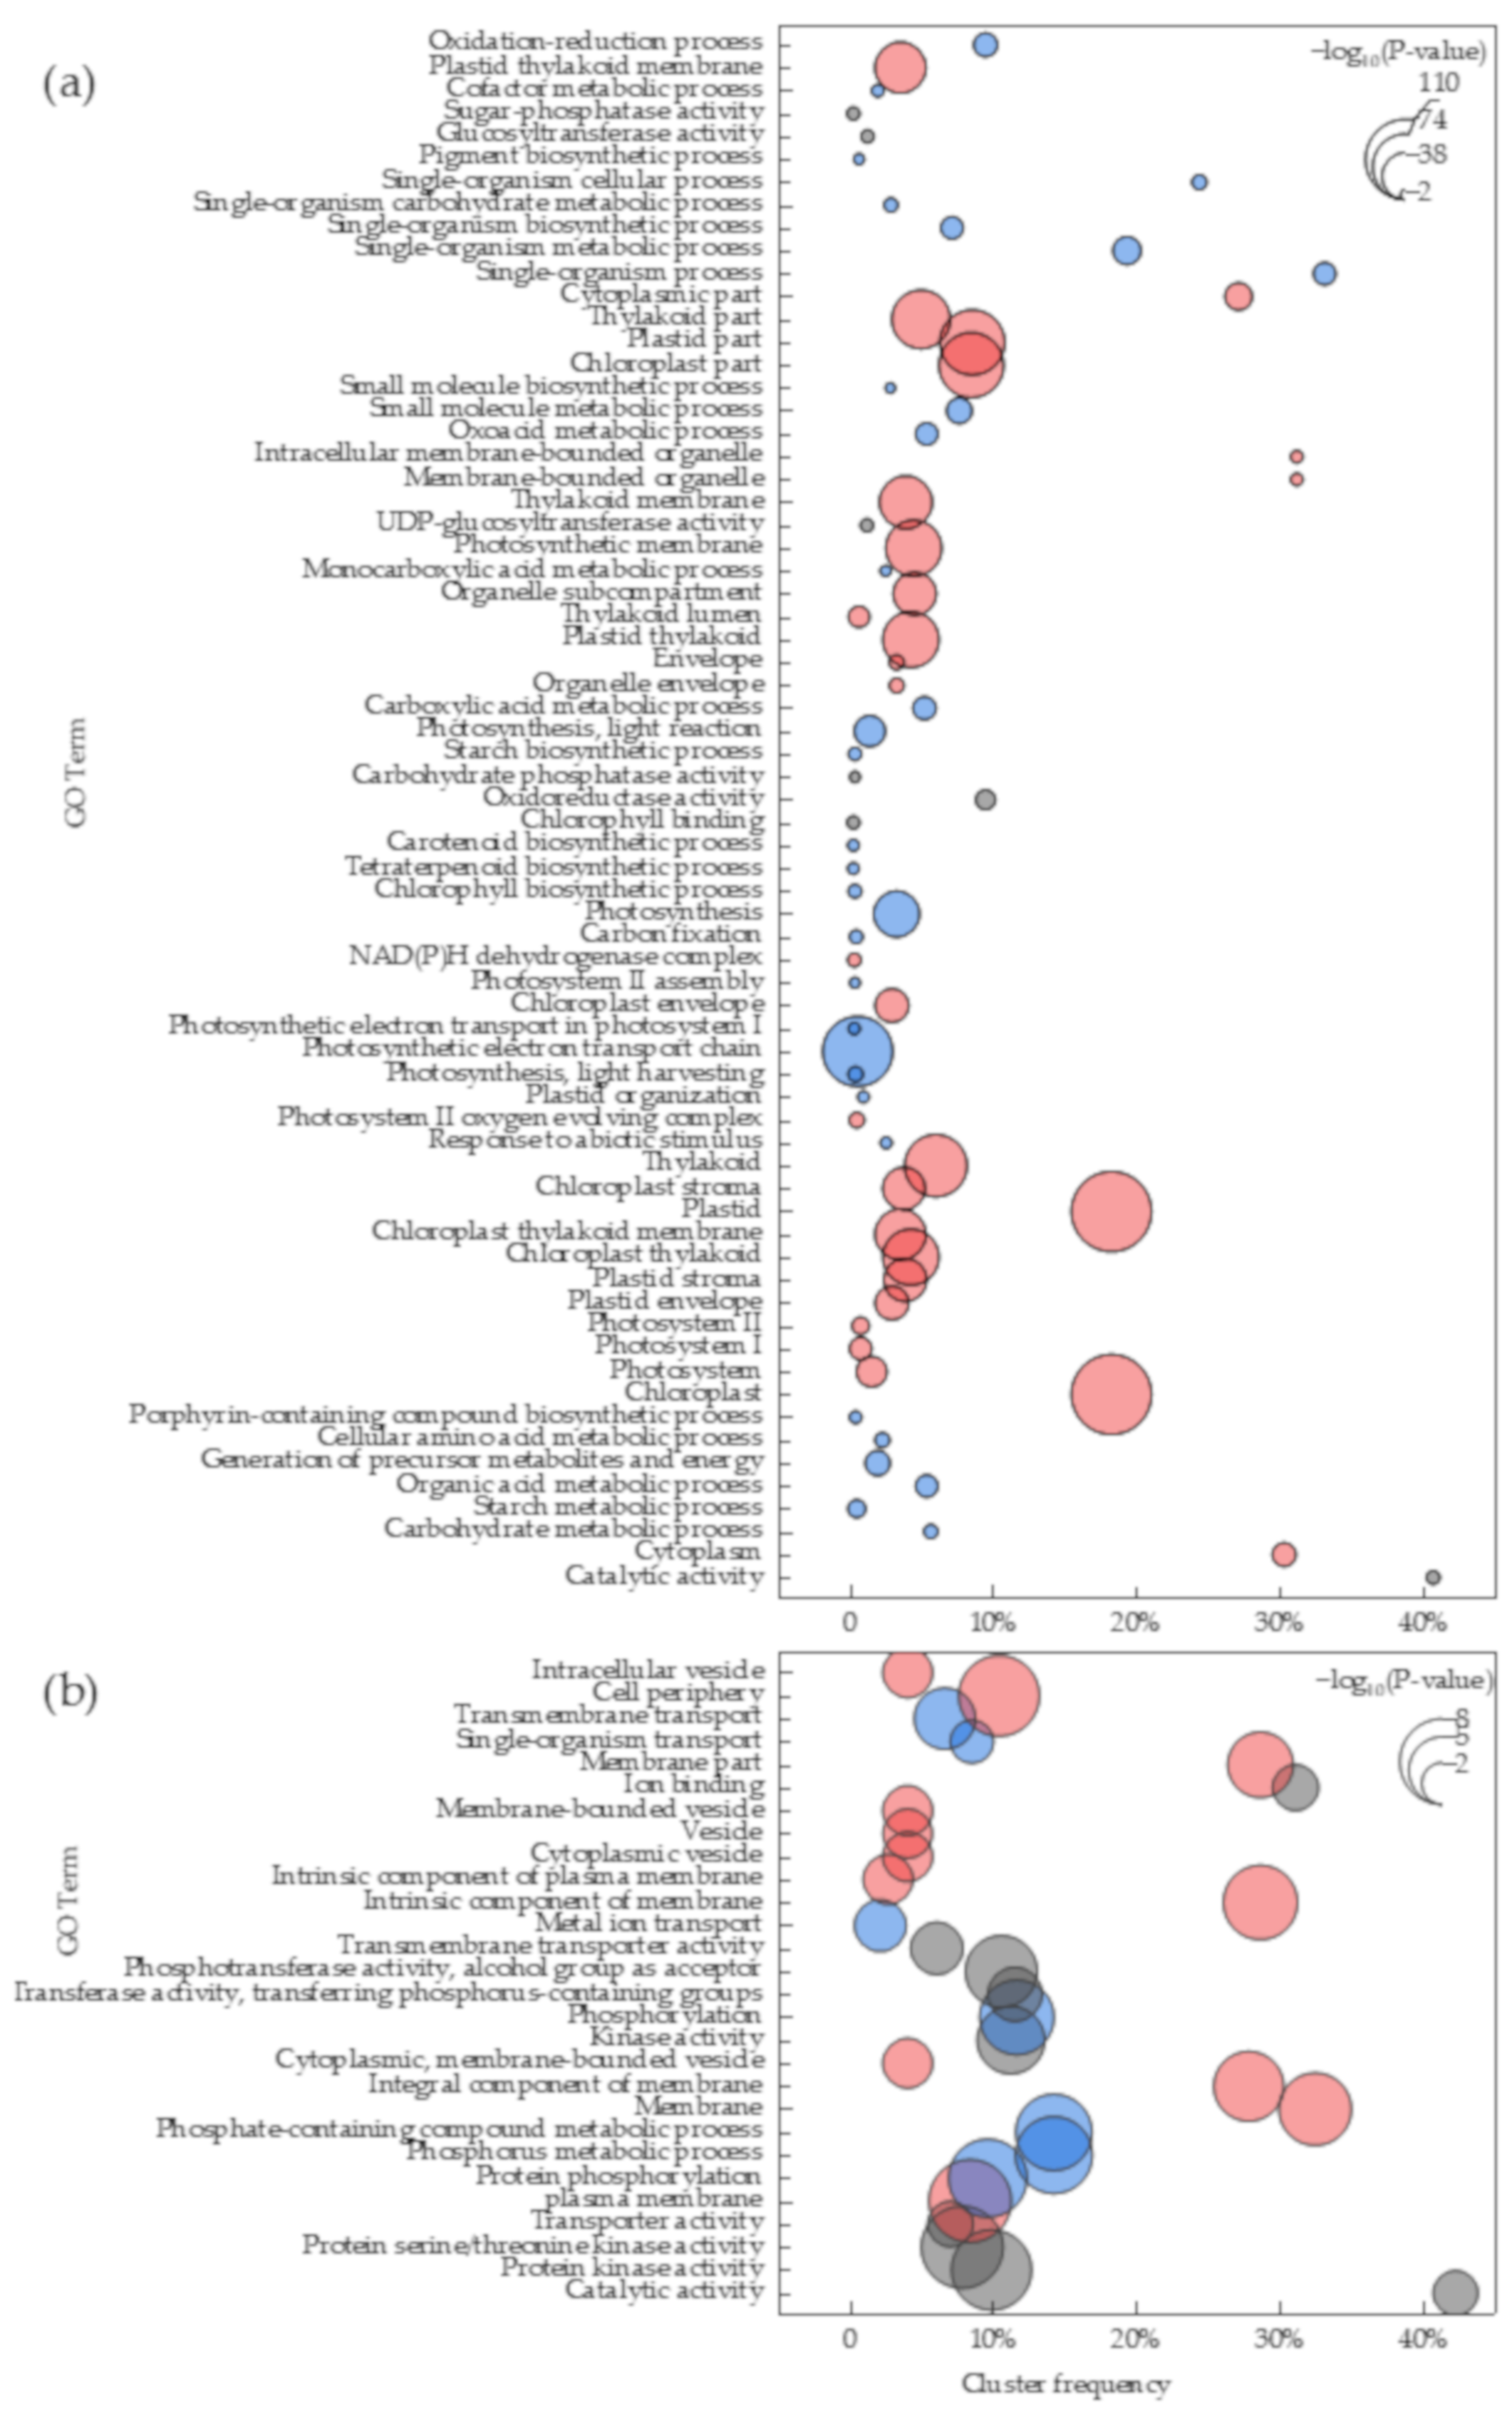
2.3. Gene Ontology (GO) Classification of DEGs

For the most salt-sensitive accession, 68 GO terms were significantly enriched (p < 0.01), of which 32, 29, and 7 terms were related to biological process, cellular component, and molecular function, respectively (Figure 1). The terms with the most significant change were related to the photoreaction stage in the cellular component, namely, the chloroplasts in the plastid and the photosynthetic and thylakoid membranes in the thylakoid. GO terms enriched in the biological process were related to photosynthesis and single-organism processes. The change in molecular function terms of the salt-sensitive accession was largely in catalytic activity.
For the most salt-tolerant accession, 28 terms were significantly enriched (p < 0.01), of which 7, 12, and 9 terms were related to biological process, cellular component, and molecular function, respectively (Figure 1). Changes in the biological process terms of the salt-tolerant accession were primarily in phosphorus metabolics and transmembrane transports (especially metal ions), which affect ion homeostasis. For cellular components, most of the changes in the GO terms were related to the intrinsic components (especially the integral component) of the cell membrane and plasma membrane. In addition, five terms associated with vesicles were significantly enriched, indicating that the salt-tolerant accession also changed the ion permeability. For molecular function terms, nine GO terms were enriched, mainly for “ion binding”, “protein kinase activity”, and “transporter activity”.

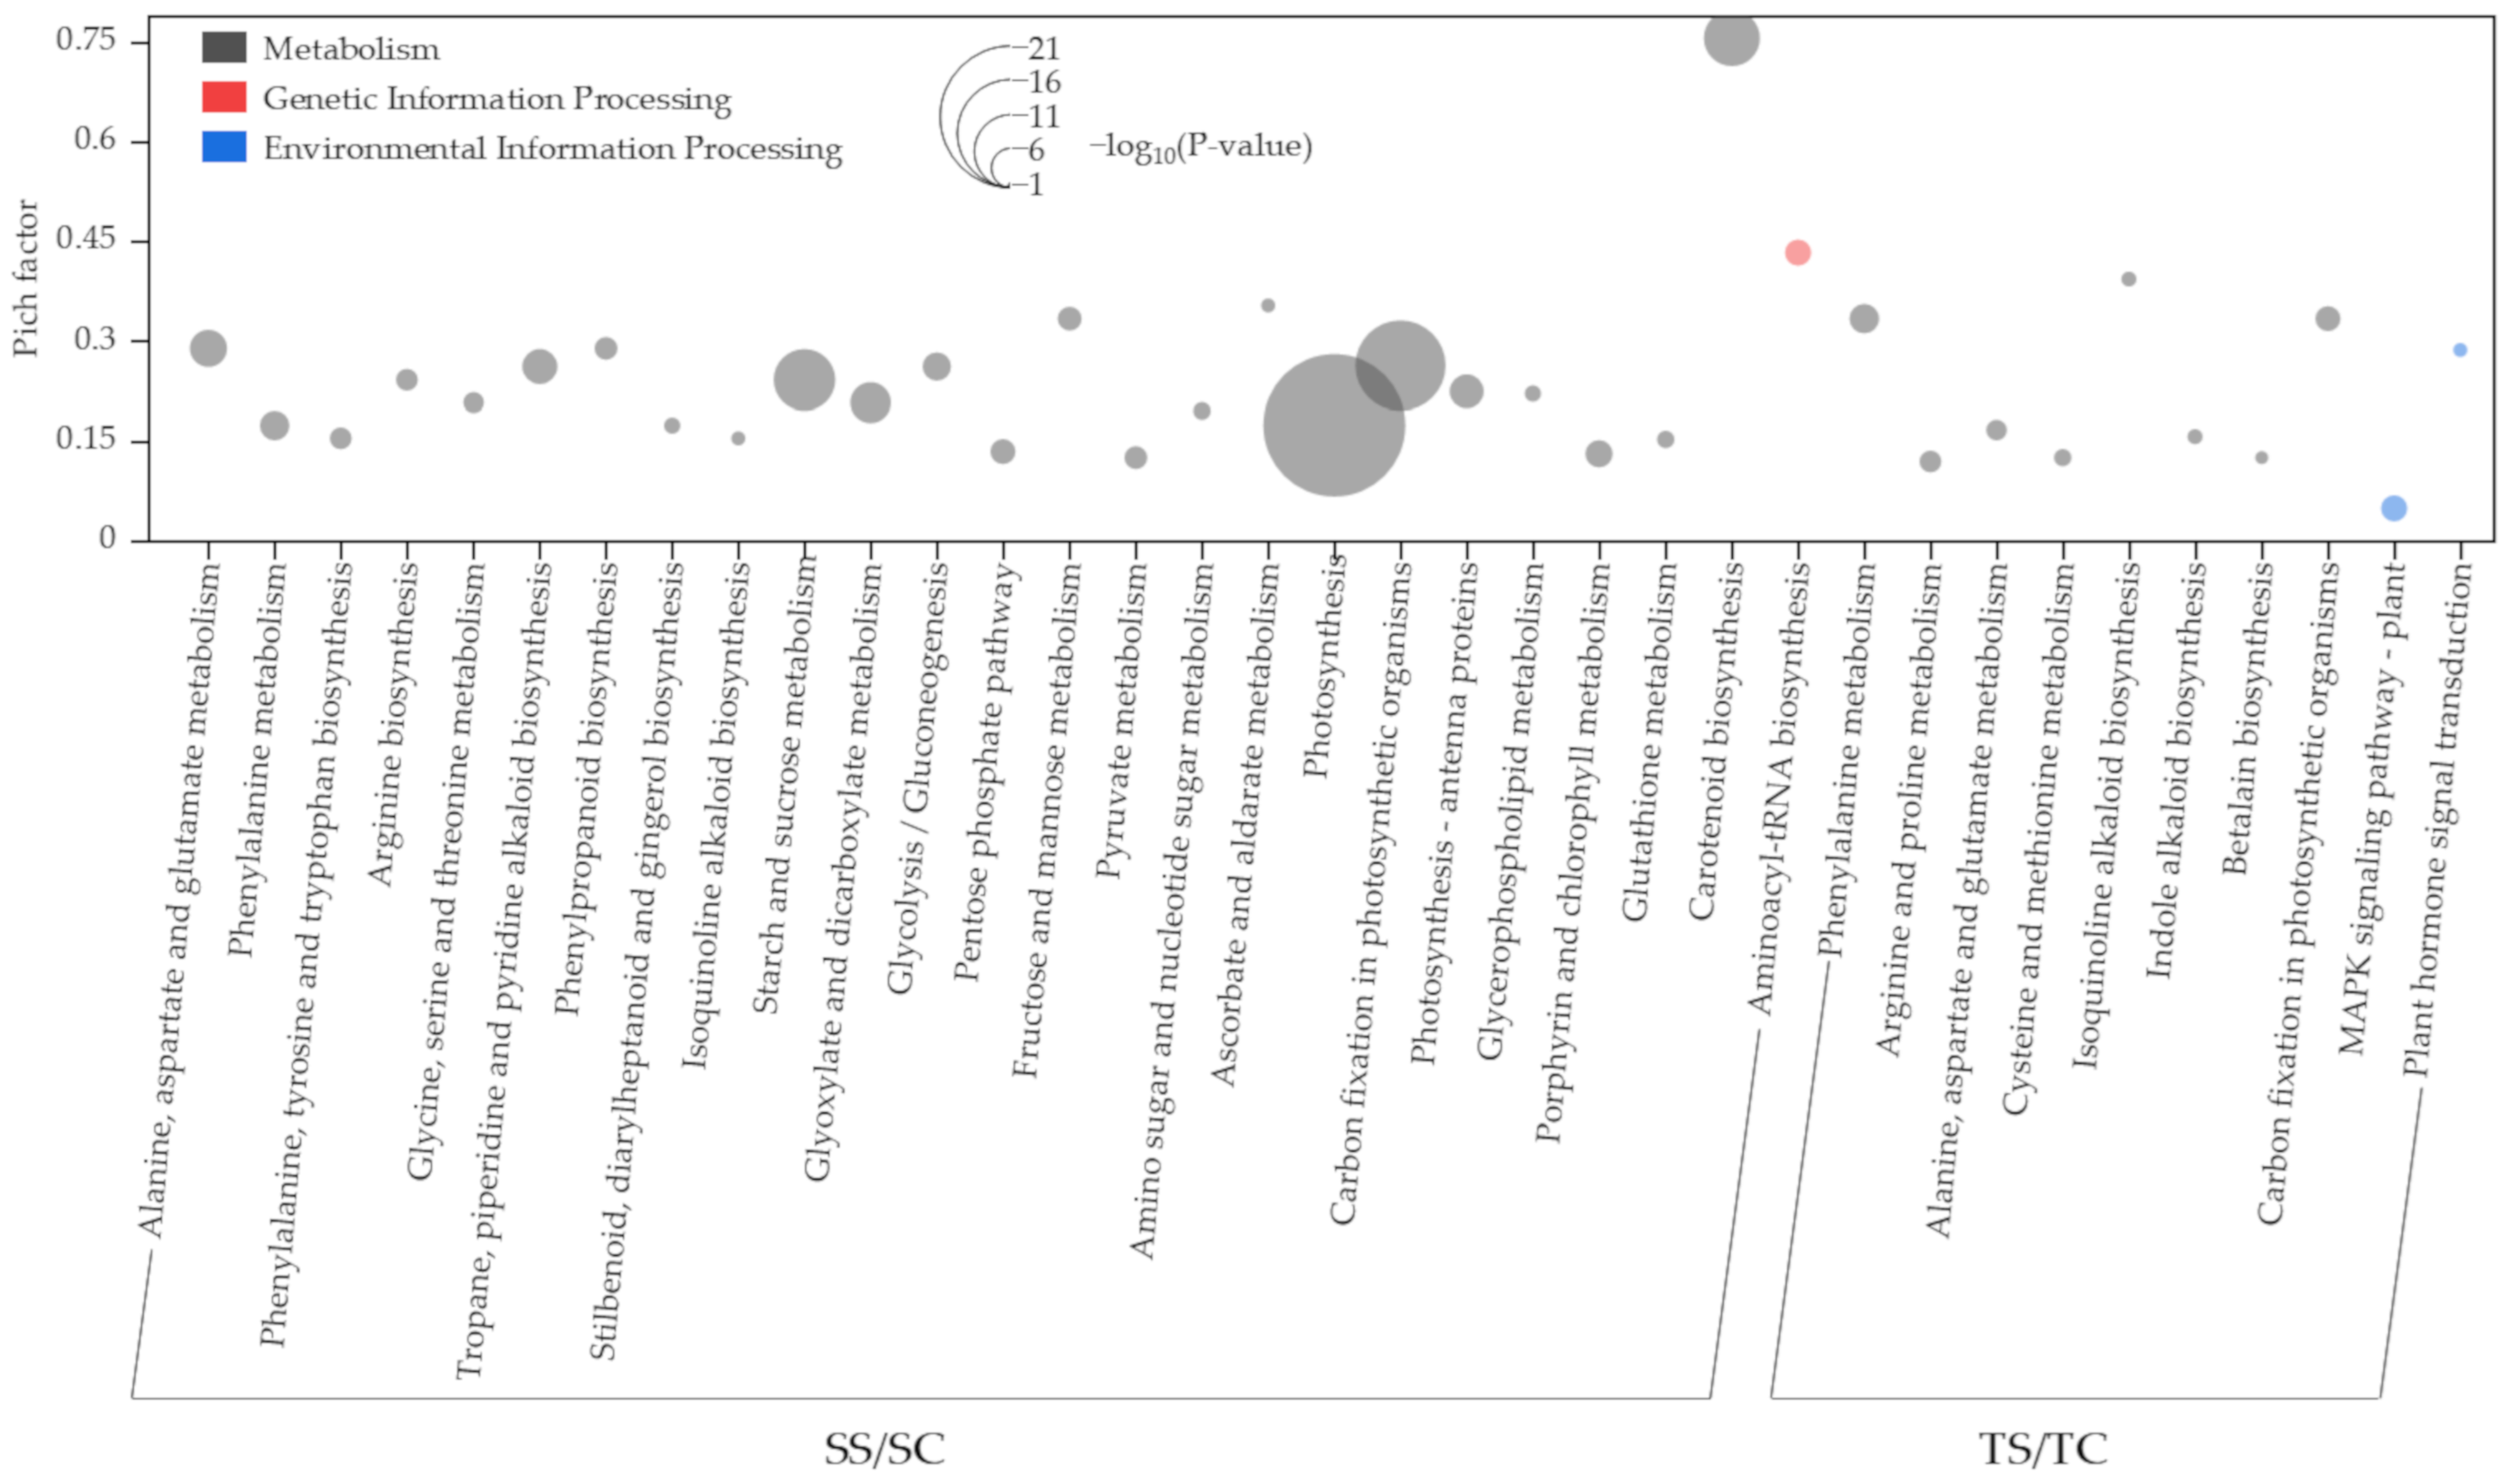
2.4. Functional Annotation of DEGs Using the Kyoto Encyclopedia of Genes and Genomes (KEGG) Database

To better understand the biological functions of DEGs, the Gene Ontology database of foxtail millet was used to enrich and analyze genomic transcriptional differences and annotate them. In SS/SC, DEGs of 111 altered pathways were annotated, among which 25 pathways (154 DEGs were down-regulated and 90 DEGs were up-regulated) were significantly enriched (p ≤ 0.01) (Figure 2, Table S3). Twenty-four significantly enriched pathways belonged to metabolism, and one pathway was annotated for genetic information processing. Similar to the GO results, the pathways with the most numbers and the highest change degree were related to photosynthesis.
In TS/TC processing, 105 altered pathways were annotated, among which 10 pathways (15 DEGs were down-regulated and 25 DEGs were up-regulated) were significantly enriched (p ≤ 0.01) (Figure 2, Table S3). For the enrichment pathway, except for two signal conversions related to environmental information processing, all pathways were related to metabolism. The highest degree of enrichment was related to amino acid metabolism, signal transduction, and photosynthesis.
Four KEGG pathways (sita00710, sita00250, sita00360, and sita00950) were significantly enriched in both salt-tolerant and salt-sensitive accessions (p ≤ 0.01) (Figure 2, Table S3). The degree of change in the salt-tolerant accession was higher than in the salt-sensitive accession in most KEGG pathways, with common enrichment pathways in both types of accessions. More importantly, “photosynthesis (sita00195)”, which was the greatest change pathway in the salt-sensitive accession, was not significantly changed in the salt-tolerant accession; “photosynthesis–antenna proteins”, which significantly changed in the salt-sensitive accession, were not detected in the salt-tolerant accession.

2.5. DEGs Related to Photosynthesis

Among the salt-sensitive accession, the photosynthesis pathway was the most affected. In the photosynthesis pathway, the DEGs were divided into five types based on function (Figure 3a, Table S4). For photosystem I, a large number of subunits, such as PsaD, PsaE, PsaF, PsaG, PsaH, PsaK, PsaL, PsaN, and PsaO, were significantly down-regulated only in the salt-sensitive accession (p ≤ 0.01). For photosystem II, the genes encoding oxygen-evolving enhancer proteins, such as PsbO, PsbP, and PsbQ, and other protein regulatory genes related to PS II function, such as PsbR, PsbS, PsbW, PsbY, Psb27, and Psb28, were significantly decreased in the salt-sensitive accession; however, only PsbY was significantly decreased in the salt-tolerant accession. In F-type ATPase, genes related to photosynthetic electron transport (PET) and cytochrome b6/f complexes, 2, 7, and 1 were down-regulated only in the salt-sensitive accession.
The carbon fixation in the photosynthetic pathway had the greatest change among the pathways enriched in the salt-sensitive and salt-tolerant accessions. This pathway can be divided into the Calvin–Benson cycle and C4–dicarboxylic acid cycle. Down-regulated DEGs related to FBPase, transketolase, glpX-SEBP, RPI, GAPDH, RPE, PRK, Rubisco, and PGK were unique in the Calvin–Benson cycle of the salt-sensitive accession (Figure 3b, Table S4). The same DEGs related to fructose-bisphosphate aldolase (FBA) were found in both accessions and the degree of change of common DEGs in the salt-sensitive accession was more significant than those in the salt-tolerant accession. In the C4–dicarboxylic acid cycle, DEGs related to MDH and TPI were detected in both accessions, and the differential expression value of DEGs related to MDH was very high. The down-regulated DEGs related to PEPC, PPDK, GGAT, MDH2, and NADP-MDH were identified only in the salt-sensitive accession.

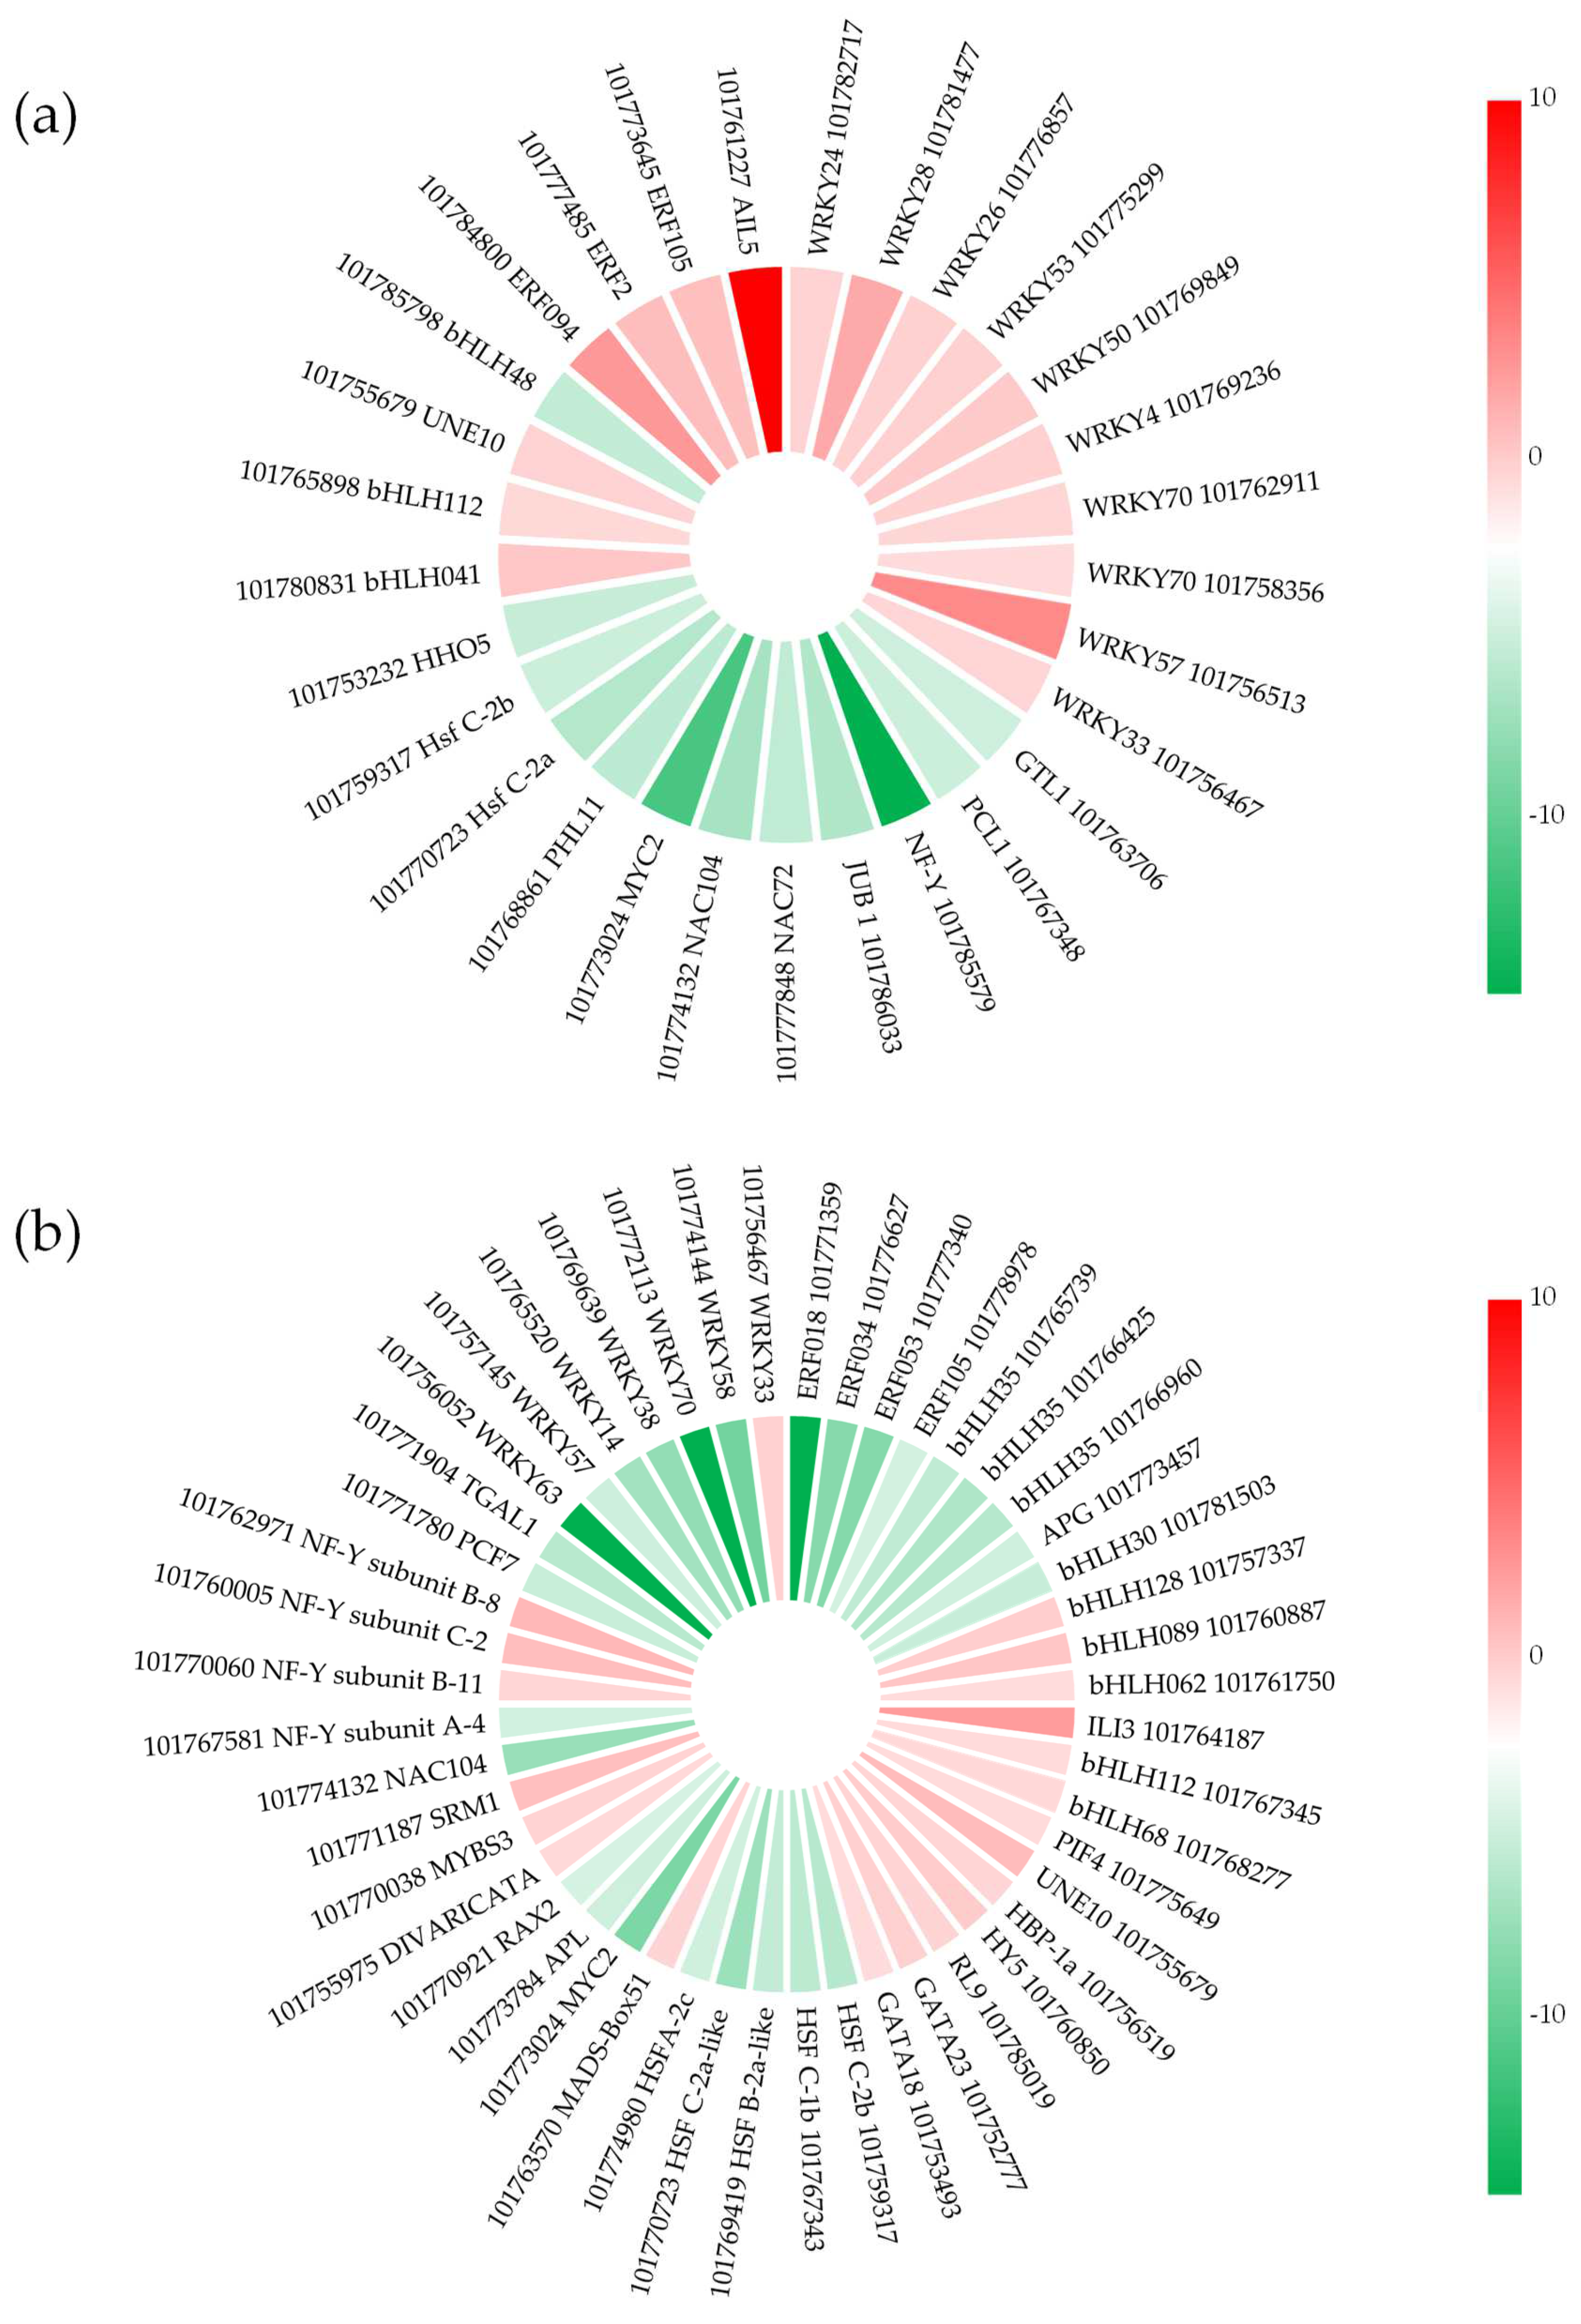
2.6. Transcription Factors (TFs) in Response to Salt Stress

Salt stress-induced genes are regulated by stress response mechanisms, some of which are regulated by transcription factors (TFs). In this study, 71 TFs were significantly enriched through the Plant TFDB database (Figure 4, Table S5). According to sequence characteristics, the differentially expressed TFs were classified into 15 TF families. Among them, the bHLH and WRKY TF families comprised the largest number of DEGs, followed by the AP2/ERF, MYB-MYC, HSF, and NF TF families. We found 13 families of differentially expressed TF genes in the salt-sensitive accession, of which 21 genes were down-regulated and 27 were up-regulated. In addition, 10 families of differentially expressed TF genes were detected in the salt-tolerant accession, of which 16 genes were down-regulated and 13 were up-regulated. There were six differentially expressed TFs in the two accessions. In the salt-sensitive accession, the response to salt stress was regulated by increasing the number of down-regulated genes of the AP2/REF, HSF, and WRKY families and up-regulated genes of the GATA family. However, in the salt-tolerant accession, a number of coding genes of the AP2-ERE and WRKY families were mainly down-regulated and that of the NAC family mainly up-regulated. In addition, a large number of DEGs of the bHLH and MYB-MYC families were found in the salt-sensitive accession.

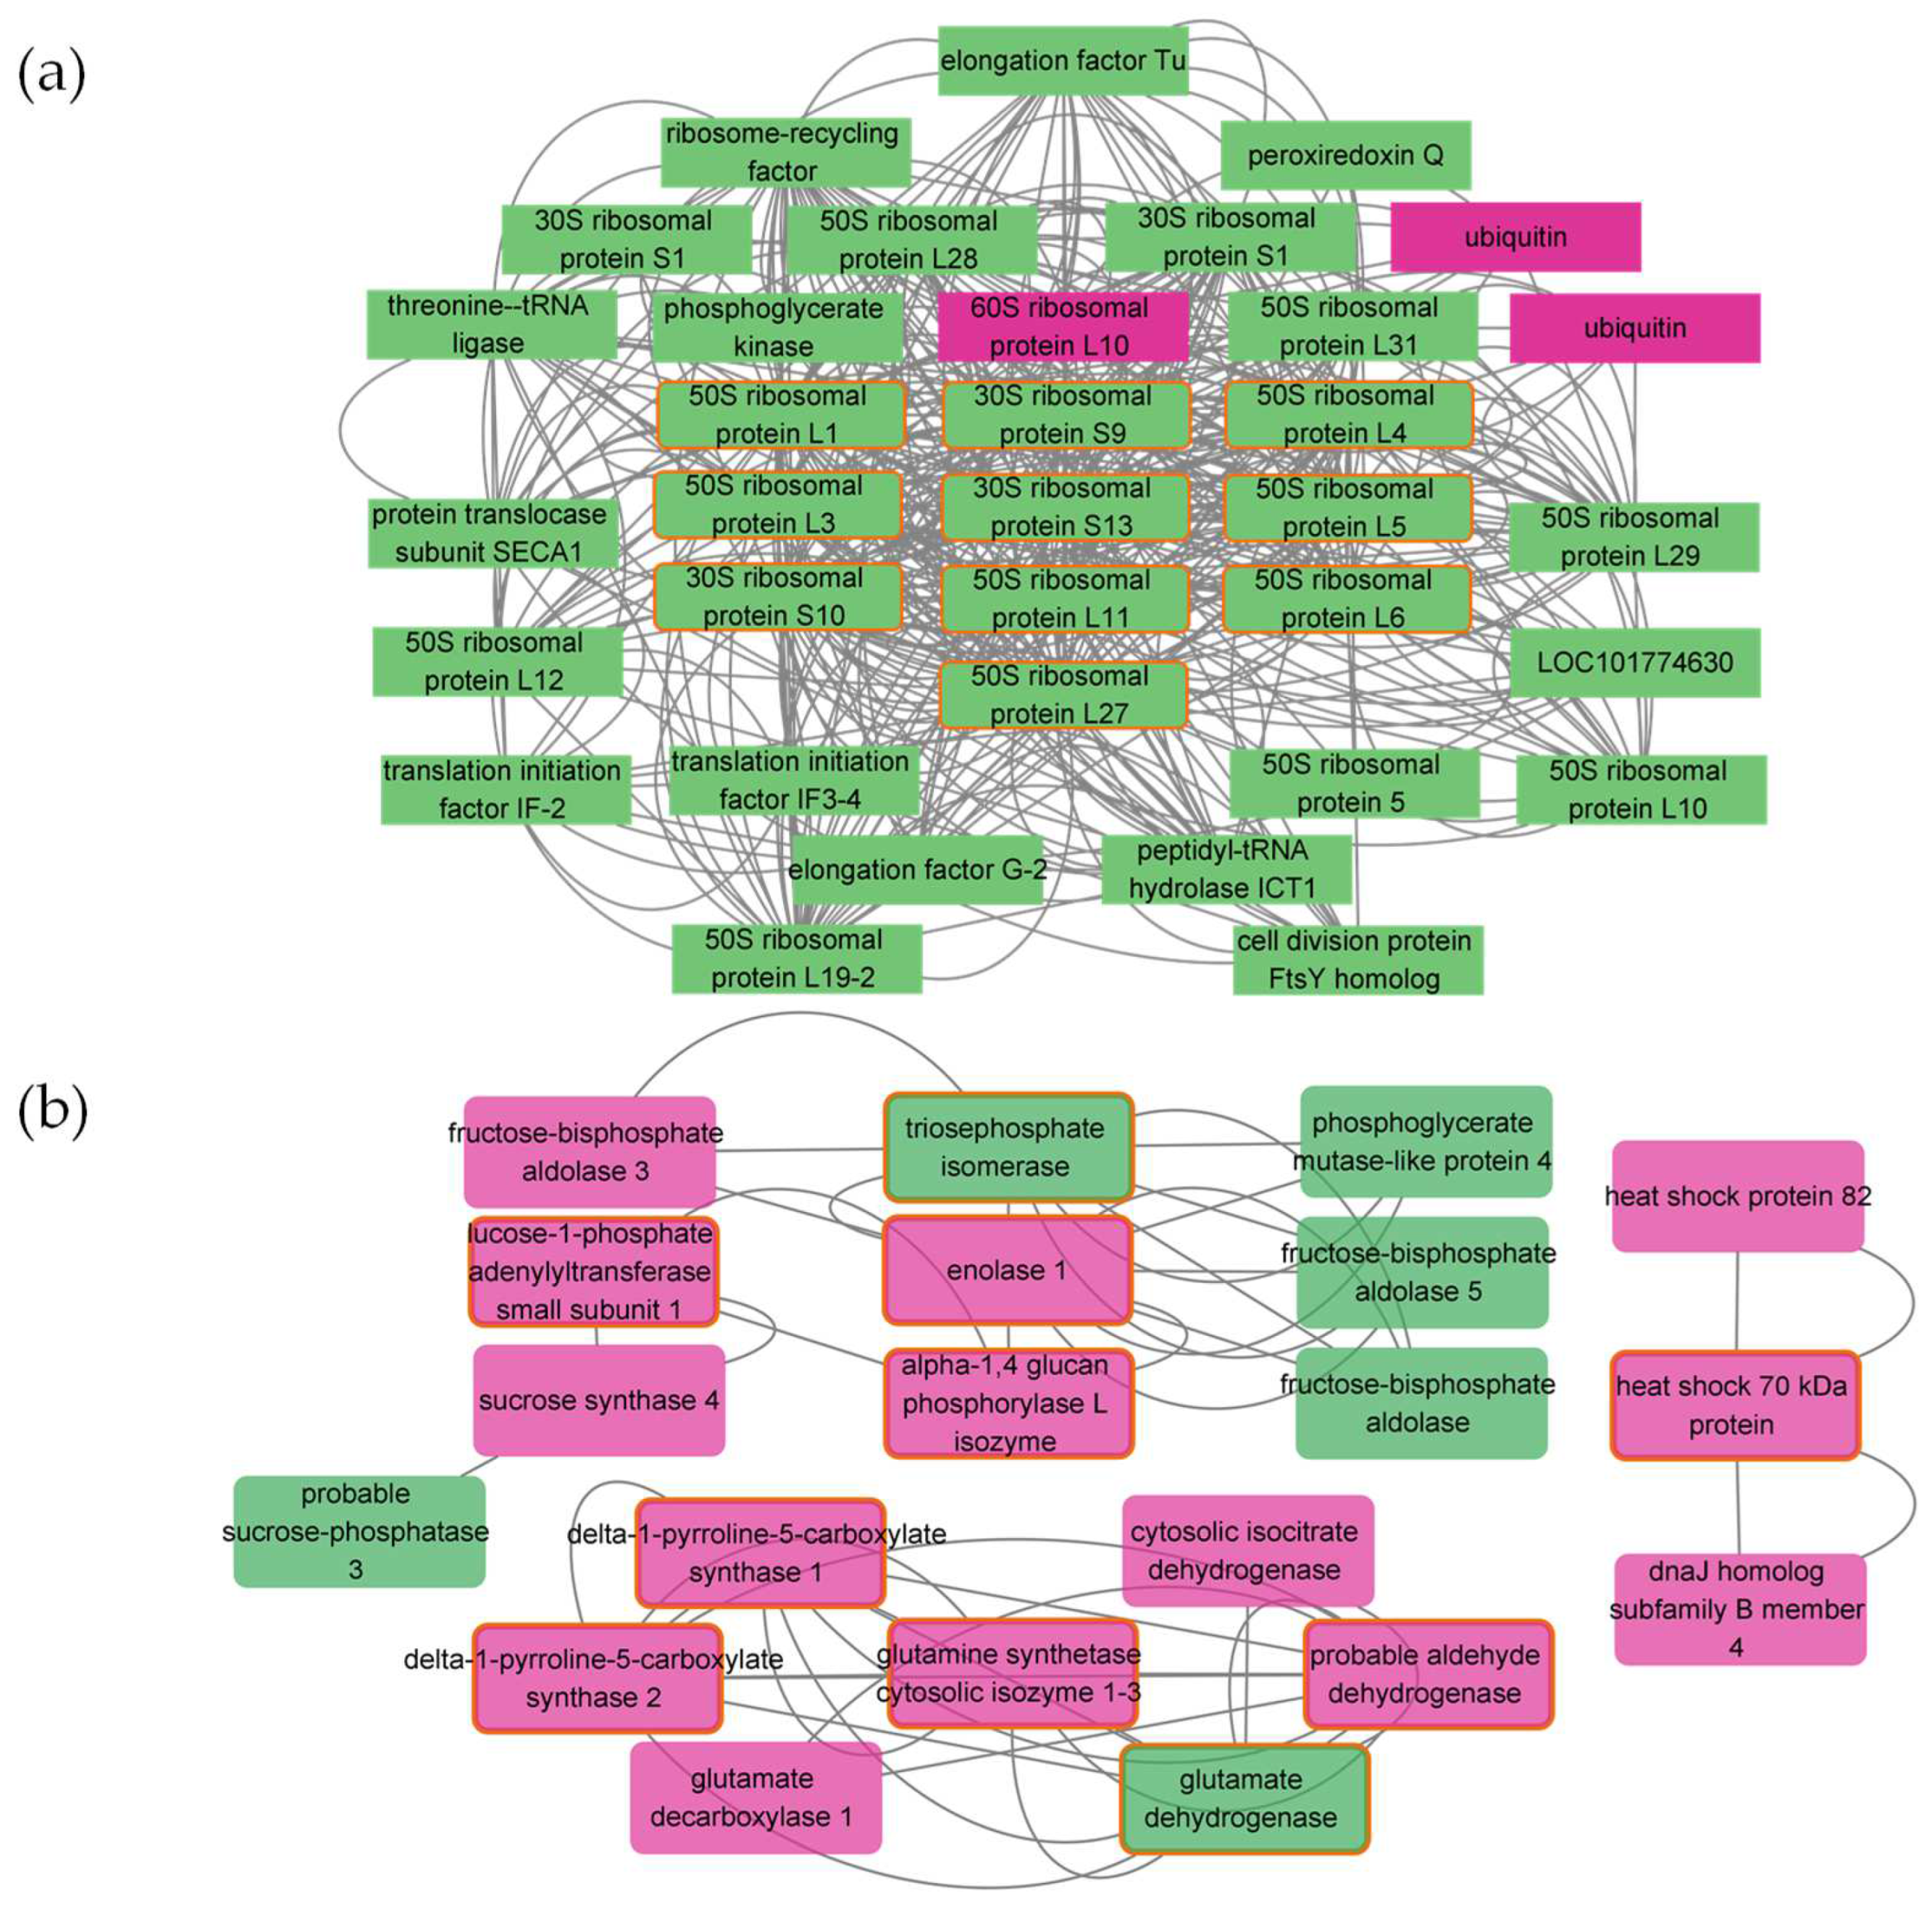
2.7. Protein–Protein Interaction Networks in Response to Salt Treatments

To identify master regulators of salt defense-related genes, the protein–protein interaction (PPI) network was utilized to screen key proteins related to salt defense in foxtail millet. Based on the STRING database, 2232 and 68 protein pairs were obtained in the comparison groups of the salt-sensitive (Figure 5a, Table 2) and salt-tolerant (Figure 5b, Table 2) accessions, respectively. For the salt-tolerant accession, a large number of nodes were concentrated on photosynthesis or related regulation networks. Hub genes were also characterized using the CytoHubba. For the salt-sensitive accession, all 10 hub genes were related to ribosomal proteins (Figure 5a, Table 2). For the salt-tolerant accession, the five highest-scoring hub genes were associated with the synthesis of proline and glutamate, but these genes were also enriched in the salt-sensitive accession (Figure 5b, Table 2). Four hub genes annotated to triosephosphate isomerase, enolase 1, alpha-1,4 glucan phosphorylase L isozyme, and glucose-1-phosphate adenylyltransferase small subunit 1 were found only in the salt-tolerant accession.

3. Discussion

Plant genetic resources are the basis of cultivar breeding. Different varieties of crops harbor various traits, accumulated due to natural and human factors [23,24]. The key to improving and protecting original varieties and breeding new ones is to identify optimal genetic resources [19,25]. Seed germination is the key period in establishing foxtail millet under salt stress due to water requirements for seed imbibition and germination [26]. Germination rate, germination potential, germination index, plumule length, and radicle length are the most basic indices of salt tolerance in different genetic resources [27,28,29]. The low mean values and large variation coefficients for RGR, RGP, RGI, RPL, and RRL indicate a significant inhibition of seed vigor and that extensive variations probably occurred in salt tolerance in foxtail millet accessions (Table S1). The lowest median plumule and radicle lengths also indicated that their growths were more sensitive to salt. Crops are susceptible to salt stress at the seedling stage because salt toxicity and osmotic stress prevent plant uptake of mineral elements and synthesis of organic matter [30]. Secondary salt-tolerance identification at the seedling stage for foxtail millet initially selected on the basis of the germination test can more accurately identify the salt tolerance of the crop (Table 1 and Table S2). The FM6 accession was the highest comprehensive rank in salt tolerance at the seedling stage, and its salt tolerance rank increased with increasing salt concentration. FM90, the lowest comprehensive rank, was susceptible to all concentrations of salt stress.
The molecular mechanism underlying the responses to salt stress could provide important clues for further study and in-depth characterization of salt-resistance candidate genes in crops [31]. Recently, the development of novel high-throughput sequencing has provided allowed salt-related genes in different accessions to be identified via de novo assembly or mapping, thereby elucidating the molecular mechanisms underlying plant responses to salt [30]. Recently, large amounts of genomic and transcriptomic data have been obtained for both model and non-model organisms, including rice [32], Kentucky bluegrass [33], and barley [34]. These studies provided deeper insights into the salt tolerance mechanism in crops and accelerated the breeding of a salt-tolerant line [34,35]. With the completion of the sequencing of the foxtail millet genome, the investigation of the transcriptome of foxtail millet has gradually increased. In the PEG stress test in foxtail millet’s germination stage [36], the categories related to phenylpropanoid biosynthesis, plant hormone signal transduction, and phenylalanine metabolism were highly enriched via effects on the phenylpropanoids-related pathway regulating allelochemicals for adaptation. In two transcriptome analyses of foxtail millet at the seedling stage with different drought tolerances [37], chlorophyll metabolism, reactive oxygen species system, abscisic acid metabolism changes, and organic solutes metabolism were some of the important biological pathways in response to drought stress. However, the transcriptome in response to salt in foxtail millet leaf is limited. Here, the most salt-tolerant foxtail millet accession, FM6, and the most salt-sensitive foxtail millet accession, FM90 (Table 1), were chosen for transcriptome sequencing to identify genes conferring salt-tolerance. The percentage of clean reads was above 99%. We mapped more than 90% of reads to foxtail millet genome annotations and, of the total mapped reads, 93% were uniquely mapped (Table S6) [38,39]. The DEGs’ number in the salt-tolerant accession was much lower than that in the salt-sensitive accession.
The DEGs were classified by functional annotation and enrichment analysis into biological process, molecular function, and cellular component. The degree of change of the DEGs located in the biological process and cell component was much higher in the salt-sensitive accession than in the salt-tolerant accession (Figure 1), indicating that the salt-sensitive accession was more affected by biological function and gene product sites or action sites. The photosynthetic capacity was the major process affected by salt stress in the salt-sensitive accession, and the most enriched terms of annotated DEGs in the salt-sensitive accession were localized to the cell and were related to plastids, chloroplasts, and thylakoids, suggesting that the function of these organelles in the salt-sensitive accession was disrupted under salt stress. These results were similar to those observed by Do Amaral et al. [40] in rice and were consistent with the lower leaf chlorophyll content and more intense leaf yellowing in the salt-sensitive millet accession compared with those in the salt-tolerant accession [41,42]. The phosphorus metabolism of the salt-tolerant accession and the terms of the membrane system were significantly enriched under salt stress, which may be attributed to the ability of the salt-tolerant accession to increase salt tolerance by improving the stability of the membrane system [43]. Similar to the GO functional enrichment, the number of enriched KEGG pathways and the number and fold change of DEGs with the KEGG pathways was higher in the salt-sensitive accession than in the salt-tolerant accession, particularly in relation to the photosynthetic term (Figure 3, Table S3). Previous transcriptome studies showed that the genes related to PS II oxygen-evolving enhancer protein function and subunit function in PS I decreased significantly under salt stress [44,45]. In our study, those genes were down-regulated in foxtail millet leaves under salt stress in the salt-sensitive accession (Figure 3), which indicated that this accession was stressed mainly by light absorption [46,47]. The decrease in light absorption capacity further led to decreased F-type ATPase and PET in the salt-sensitive accession [48,49]. Notably, a similar phenomenon was found in the drought-sensitive accession of pearl millet under drought [50], which may imply that the light absorption capacity of millet with poor stress resistance is the most sensitive. The decrease in light absorption capacity directly affected the carbon fixation of salt-sensitive foxtail millet accession [47,51]. We observed that the genes related to Calvin–Benson cycle enzymes and C4–dicarboxylic acid cycle enzymes were also significantly down-regulated in the salt-sensitive accession (Figure 3, Table S4).
TFs are essential upstream regulatory proteins of genes and play an important role in a plant’s response to abiotic stress [52]. Under more severe salt stress, more differentially expressed TFs are detected in the salt-sensitive accession [18,53]. Only six TFs were significantly different between the salt-sensitive and salt-tolerant accessions (Figure 4, Table S5). Among them, the TFs of the bHLH, WRKY, and MYB-MYC families retained a large number of DEGs and followed different patterns of differential expression in the two accessions, which was an important factor contributing to the difference in salt tolerance in foxtail millet. The WRKY family was widely involved in plant responses to stress and was the most abundantly expressed TF family in this study. Eight TFs found only in the salt-tolerant accession had been identified under salt stress in other crops: WRKY4 [54], WRKY24 [55], WRKY26 [56], WRKY28 [55], WRKY50 [57], WRKY53 [58], WRKY57 [59], and WRKY70 [55], and these may be critical in influencing salt tolerance in foxtail millet. AP2/ERF family TFs play a regulatory role in abiotic stress response and could affect growth and metabolism. In this study, four DEGs of the AP2/ERF TF family, AIL5, ERF2, ERF105, and ERF094, were up-regulated in the salt-tolerant accession, and four DEGs of the AP2/ERF family, ERF018, ERF034, ERF053 and ERF105, were down-regulated in the salt-sensitive accession. ERF2 is involved in phytohormone signal cascades [60] and has been identified as a salt-induced target of miRNAs in previous studies [61]. It is generally believed that ERF105 is a cold-regulated TF, but it has also been reported to play a role in plant salt stress, such as down-regulation in creeping bentgrass (Agrostis stolonifera) [62] and up-regulation in Arabidopsis thaliana. In this study, the completely different expression of ERF105 in the two germplasms suggests that ERF105 may be the key to the ability of salt-tolerant germplasms to cope with salt stress. AIL5 and ERF094 were found less frequently in other plants under salt stress, and the mechanism needs to be studied further in the future. In addition, although the TFs of the HSF family were related to plant heat tolerance, the high degree of enrichment showed that a part of the metabolic pathway in response to heat stress could also regulate the salt tolerance in foxtail millet. These results provide new insights into the salt tolerance mechanism of foxtail millet and will facilitate salt-tolerance breeding in future research.
Ribosomal proteins are important components of the ribosome and have a significant impact on its transcriptional efficiency and stability. In addition, they are involved in various important intracellular activities, such as DNA repair, apoptosis, and regulation of gene expression. In the salt-sensitive accession, all 10 hub genes were related to ribosomal proteins and all were down-regulated, which may cause stunted growth in foxtail millet plants (Figure 5a). The salt-tolerant accession was annotated with fewer proteins, and their protein–protein interactions were weak due to less stress. Among the hub genes in the salt-tolerant accession, the four genes expressed only in the salt-sensitive accession were associated with the catabolism and synthesis of sugars, suggesting that salt-tolerant foxtail millet accession can catabolize to produce more energy under salt stress (Figure 5b). The relationship between genes (101760718 and 101781167) related to triosephosphate isomerase and enolase 1 and salt stress has been reported by Chen et al. [63] and Nam et al. [64]. However, to our knowledge, the response of alpha-1,4 glucan phosphorylase L isozyme (101773221) and glucose-1-phosphate adenylyltransferase small subunit 1 (101755337) has not been reported and requires further study (Table 2).

4. Materials and Methods

4.1. Plant Materials and Growth Conditions

The salt tolerance test of 104 foxtail millet accessions of China (Table S7) was performed to screen for salt-tolerant and salt-sensitive foxtail millet accessions. Specifically, 20 foxtail millet seeds were sterilized with 75% ethanol and germinated in a sterile culture dish (10 × 10 × 2 cm) containing 50 mL Murashige and Skoog (MS) solid medium containing 0.17 mol·L−1 NaCl (0.17 mol·L−1 NaCl was used because the maximum coefficient of variation was found for 104 foxtail millet accessions at this concentration in the pre-experiment). All culture tests were conducted in triplicates. Germination was considered when either the plumule reached half the length of the seed or the radicle reached the length of the seed. Germination was recorded every 2 days and, after 8 days, the germination rate (GR), plumule length (PL), and radicle length (RL) were measured. The germination potential (GP) and germination index (GI) represent seed vigor. The GP was the germination rate on the 4th day. The GI was calculated as follows:
GI = GR t D t
where GRt is the GR on t day and Dt is the treatment days. GR, GP, GI, PL, and RL describe the seed germination process. To show seed changes under salt stress, relative GR (RGR), relative GP (RGP), relative GI (RGI), relative PL (RPL), and RL (RRL) were determined as the quotient of traits under salt stress versus salt-free conditions. The membership function method in fuzzy mathematics was used for the preliminary evaluation of the salt-tolerant and salt-sensitive accessions as it compensates for the bias caused by a single indicator. The membership function was calculated as follows:
X ij = X ij X jmin / X jmax X jmin
where Xij is the measured value of index j of category i; Xjmin and Xjmax are the maximum and minimum values of index j of category i, respectively; and X(ij) is the membership value of index j of category i.
The salt tolerance test of the foxtail millet at the seedling stage was conducted to screen the potentially most salt-tolerant and salt-sensitive accessions. Seeds were sterilized with 75% ethanol and cultured on the MS solid medium. After 8 days, 50 seedlings were transplanted into a plastic pot (diameter 30 cm, height 20 cm) with sterile sand (particle size ≤ 1 mm) and watered with 100 mL of 1/2 Hoagland nutrient daily. After 12 days, 100 mL of 1/2 Hoagland nutrient containing 0.13 mol·L−1, 0.17 mol·L−1, and 0.22 mol·L−1 NaCl was added daily. The foxtail millet seedlings were continuously watered with saline nutrient solution for 6 days. The relative biomass, relative growth rate, relative chlorophyll content, and relative K+/Na+ of the leaves were measured. The growth rate was calculated as the average increase in plant height per day. For biomass, 10 seedlings were randomly selected, washed with distilled water, and weighed using a one hundred thousandth scale. For the chlorophyll content, the supernatant of the fresh leaf samples soaked in dimethyl sulfoxide under dark condition for 3 days was measured using a spectrophotometer at 663 and 645 nm [14]. For Na+ and K+ contents of the leaves, 0.1 g dry powder of leaf samples (≤0.25 mm) was digested with a mixture of concentrated HNO3 and HClO4 (2:1 V:V) at 370 °C for 3 h, and the contents were then determined via flame photometer (AP1500, AoPu, Shanghai, China) [14,65]. The membership function method in fuzzy mathematics was used to evaluate the performance of different foxtail millet accessions under salt stress. Finally, the most promising salt-tolerant and salt-sensitive foxtail accessions were confirmed. All plant culture experiments were performed in an artificial growth chamber (Adaptis-A1000; CONVIRON, Winnipeg, Canada) at 30 ± 1 °C day/20 ± 1 °C night temperatures, with a 16/8 h (day/night) photoperiod and 500 μmol m−2 s−1 PPFD.

4.2. Treatments and Experimental Design

Based on the salt tolerance evaluation, the most salt-tolerant (Hong Gu 2000) and salt-sensitive (Pu Huang Yu) accessions were obtained from 104 foxtail millet accessions. According to the culture method of the salt tolerance test of foxtail millet seedling, the most salt-sensitive and salt-tolerant accessions were sampled after exposure to 0.17 mol·L−1 NaCl stress for 6 days and were labeled SS and TS, respectively. Leaf samples were also sampled from the salt-sensitive and salt-tolerant accessions treated with unsalted Hoagland nutrient solution and named SC and TC, respectively. There were three replicates for each treatment, and all leaves from 12 samples were individually frozen using liquid nitrogen and stored at −80 °C in preparation for RNA-Seq analysis.

4.3. RNA Isolation, cDNA Library Preparation, and Sequencing

The total RNA of foxtail millet leaves was extracted using the Trizol method (1 mL of Trizol reagent was added into 0.1 g of leaf sample) [66]. The concentrations and purity were measured using a NanoDrop 2000 spectrophotometer (Thermo Fisher Scientific, Wilmington, DE, USA). The integrity of RNA samples was determined using the Agilent Bioanalyzer 2100 System (Agilent Technologies, Palo Alto, CA, USA) and all the RNA Integrity Number values were above 8. mRNA with poly-A structure was enriched with oligo magnetic beads in the total RNA and then cut into 200–300 bp fragments. Using these RNA fragments as a template, we synthesized the first chain of cDNA with random hexamers and reverse transcriptase. This first chain cDNA was then used for the synthesis of the second chain cDNA. The library fragments were enriched using PCR, and the obtained 300–400 bp libraries were selected and tested with an Agilent 2100 Bioanalyzer (Santa Clara, California, United States). The RNA library was constructed using Illumina HiSeq™ 2000 (Illumina, San Diego, CA, USA) at the Shanghai Personal Biotechnology Co., Ltd., China (http://www.personalbio.cn/ (accessed on 18 December 2018)).

4.4. Bioinformatics Analysis

For the original raw off-machine data, Cutadapt was used to remove the adaptor of the 3′-end (the removed part contained a mismatch of at least 10 bp overlap with a known connector, an approximately 20% base mismatch) and the low-quality reads (QV < 20) [67]. Transcriptomic alignments were identified using Bowtie2 (University of Maryland, College Park, MD, USA) [68,69] and Tophat2 (Johns Hopkins University, Maryland, USA) [70,71] against the foxtail millet reference genome (GCF_000263155.2_Setaria_italica_v2.0_genomic.fa) (Table S6), which was downloaded from the Ensembl database [72]. The mapping criteria were as follows: sequencing reads should be uniquely matched to the genome while allowing up to two mismatches, without insertions or deletions. The HTSeq and union models were used to analyze the gene expression. DESeq (http://www.bioconductor.org/packages/release/bioc/html/DESeq.html (accessed on 18 December 2018)) was used to compare the read count value on each gene as the original gene expression amount, and then the fragments per kilobase of transcript per million mapped reads (FPKM) method was adopted to standardize the expression amount [73]. Genes with a |log2FoldChange| > 1 and significant difference at p < 0.01 were considered DEGs.
The DEGs were submitted for functional enrichment analyses of gene ontology (GO), Kyoto Encyclopedia of Genes and Genomes (KEGG) pathways, and transcription factor (TF) [74]. GOseq software (http://www.bioconductor.org/packages/release/bioc/html/goseq.html (accessed on 8 December 2018)) was used to perform GO analysis with the default parameters and p-value < 0.01 [75]. KEGG [76,77] enrichment analyses were performed using KOBAS software (version 3.0) (http://kobas.cbi.pku.edu.cn/download.php) with the default parameters and p-value < 0.01 [78]. GO terms and KEGG terms with corrected p-values less than 0.01 were considered significantly enriched. TF were DEGs with TF function annotated to the reference genome. STRING (http://www.string-db.org/ (accessed on 18 December 2018)) was applied to protein–protein interaction analysis of protein function, protein subcellular localization, and gene co-expression using Linum usitatissimum as the standard [18,79]. The PPI network was constructed according to the highest confidence level (0.900) in STRING [80,81]. Cytoscape (version: 3.9.1) [82,83] and Cytohubba [84] were used to calculate 10 DEGs as hub genes by maximal clique centrality (MCC) and display all DEGs associated with the hub gene, which were then annotated with NCBI blast.

5. Conclusions

Salt-tolerant (Hong Gu 2000) and salt-sensitive (Pu Huang Yu) accessions were identified among 104 foxtail millet accessions during the germination and seedling stages, using morpho-physiological indicators based on the membership function method in fuzzy mathematics. A large-scale transcriptome dataset in foxtail millet in response to salt stress was established. Through analyzing the differences in the transcriptome of foxtail millet leaves under 0.17 mol·L−1 NaCl stress, 2019 and 736 DEGs were obtained in the salt-sensitive and salt-tolerant accessions, respectively. Most differential genes in the salt-sensitive accession were concentrated in plastids, chloroplasts, and thylakoids, and the photoabsorption and carbon fixation capacities decreased significantly. The down-regulation of ribosomal protein-related genes inhibited the growth of salt-sensitive varieties. Salt-tolerant varieties alleviate salt stress by increasing glucose and ATP production. There were significant differences in the expression of transcription factors between the salt-tolerant and salt-sensitive accessions. Most of these TFs were concentrated in the BHLH, WRKY, AP2/ERF, and MYB-MYC families, which significantly affected the salt-tolerance of the two foxtail millet accessions. These findings provide novel insights into the molecular mechanism underlying foxtail millet’s response to salt stress.

Supplementary Materials

The following supporting information can be downloaded at: https://www.mdpi.com/article/10.3390/plants11141864/s1, Table S1. Salt tolerance identification of 104 foxtail millet accessions in germination stage under 0.13 mol L-1. Table S2. Comprehensive evaluation of salt tolerance of 18 foxtail millet accessions in seeding foxtail millet under different NaCl concentrations. The score and rank under different NaCl concentrations indicate the scores and rank at that concentration, while the total score and rank indicate the comprehensive scores and rank under all NaCl concentrations. Table S3. Enrichment analysis of KEGG between SS/SC and TS/TC. Table S4. DGEs associated with photosynthesis under salt stress. Table S5. DEGs related to transcription factor under salt stress. Table S6. Sequencing statistics of RNA libraries. Table S7. 104 foxtail millet accessions for testing in the study.

Author Contributions

Conceptualization, Y.L. and Y.Z.; methodology, W.H. and M.S.; software, H.P.; validation, Y.L. and Y.Z.; formal analysis, H.W. and Q.Y.; investigation, F.H. and J.F.; resources, W.H. and S.G.; data curation, F.H.; writing—original draft preparation, F.H.; writing—review and editing, Y.L. and Y.Z.; project administration, Y.L. and Y.Z.; funding acquisition, Y.L. and Y.Z. All authors have read and agreed to the published version of the manuscript.

Funding

This research was funded by the National Key Research and Development Program (2021YFD190090207) and Shandong Coarse Grain Industry Technology System (SDAIT-15-04).

Data Availability Statement

The datasets used in this study can be found in the NCBI SRA database under the accession number PRJNA805389.

Conflicts of Interest

The authors declare that the research was conducted in the absence of any commercial or financial relationships that could be construed as a potential conflict of interest.

References

  1. Liang, W.; Ma, X.; Wan, P.; Liu, L. Plant salt-tolerance mechanism: A review. Biochem. Biophys. Res. Commun. 2018, 495, 286–291. [Google Scholar] [CrossRef] [PubMed]
  2. Yang, Y.; Guo, Y. Elucidating the molecular mechanisms mediating plant salt-stress responses. New Phytol. 2018, 217, 523–539. [Google Scholar] [CrossRef] [PubMed] [Green Version]
  3. Eswaran, H.; Lal, R.; Reich, P.F. Land degradation: An overview. In Response to Land Degradation; CRC Press: Boca Raton, FL, USA, 2019; pp. 20–35. [Google Scholar]
  4. Zhou, J. Expression Profile of miRNA of Populus cathayana Rehd and Salix matsudana Koidz. under Salt Stress; Chinese Academy of Forestry: Beijing, China, 2010. [Google Scholar]
  5. Ma, Y.; Wang, X.P.; Zhang, S.F.; Shi, D.C.; Sheng, L.X. Effects of salt and alkali stress on growth, accumulation of oxalic acid, and activity of oxalic acid-metabolizing enzymes in kochia sieversiana. Biol. Plant. 2016, 60, 774–782. [Google Scholar] [CrossRef]
  6. Chen, Y.E.; Mao, J.J.; Sun, L.Q.; Huang, B.; Ding, C.B.; Gu, Y.; Liao, J.Q.; Hu, C.; Zhang, Z.W.; Yuan, S.; et al. Exogenous melatonin enhances salt stress tolerance in maize seedlings by improving antioxidant and photosynthetic capacity. Physiol. Plant. 2018, 164, 349–363. [Google Scholar] [CrossRef]
  7. Muchate, N.S.; Nikalje, G.C.; Rajurkar, N.S.; Suprasanna, P.; Nikam, T.D. Plant salt stress: Adaptive responses, tolerance mechanism and bioengineering for salt tolerance. Bot. Rev. 2016, 82, 371–406. [Google Scholar] [CrossRef]
  8. Austin, D.F. Foxtail millets (Setaria: Poaceae)—Abandoned food in two hemispheres. Econ. Bot. 2006, 60, 143–158. [Google Scholar] [CrossRef]
  9. Saleh, A.S.; Zhang, Q.; Chen, J.; Shen, Q. Millet grains: Nutritional quality, processing, and potential health benefits. Compr. Rev. Food Sci. Food Saf. 2013, 12, 281–295. [Google Scholar] [CrossRef]
  10. Sharma, N.; Niranjan, K. Foxtail millet: Properties, processing, health benefits, and uses. Food Rev. Int. 2018, 34, 329–363. [Google Scholar] [CrossRef]
  11. Yang, X.S.; Wang, L.L.; Zhou, X.R.; Shuang, S.M.; Zhu, Z.H.; Li, N.; Li, Y.; Liu, F.; Liu, S.C.; Lu, P.; et al. Determination of protein, fat, starch, and amino acids in foxtail millet [Setaria italica (L.) Beauv.] by Fourier transform near-infrared reflectance spectroscopy. Food Sci. Biotechnol. 2013, 22, 1495–1500. [Google Scholar] [CrossRef]
  12. Verma, S.; Srivastava, S.; Tiwari, N. Comparative study on nutritional and sensory quality of barnyard and foxtail millet food products with traditional rice products. J. Food Sci. Technol. 2015, 52, 5147–5155. [Google Scholar] [CrossRef] [Green Version]
  13. Zhang, A.; Liu, X.; Wang, G.; Wang, H.; Liu, J.; Zhao, W.; Zhang, Y. Crude fat content and fatty acid profile and their correlations in foxtail millet. Cereal Chem. 2015, 92, 455–459. [Google Scholar] [CrossRef]
  14. Han, F.; Sun, M.; He, W.; Cui, X.; Pan, H.; Wang, H.; Song, F.; Lou, Y.; Zhuge, Y. Ameliorating effects of exogenous Ca2+ on foxtail millet seedlings under salt stress. Funct. Plant Biol. 2019, 46, 407–416. [Google Scholar] [CrossRef] [PubMed]
  15. Sun, M.; Kang, X.; Wang, T.; Fan, L.; Wang, H.; Pan, H.; Yang, Q.; Liu, H.; Lou, Y.; Zhuge, Y. Genotypic diversity of quality traits in Chinese foxtail millet (Setaria italica L.) and the establishment of a quality evaluation system. Food Chem. 2021, 353, 129421. [Google Scholar] [CrossRef] [PubMed]
  16. Nahar, A.; Mannan, M.A.; Mamun, M.A.A.; Ghosh, T.K. Growth and yield performance of foxtail millets under salinity. Bangladesh Agron. J. 2018, 21, 51–59. [Google Scholar] [CrossRef]
  17. Krishnamurthy, L.; Upadhyaya, H.D.; Gowda, C.L.L.; Kashiwagi, J.; Purushothaman, R.; Singh, S.; Vadez, V. Large variation for salinity tolerance in the core collection of foxtail millet (Setaria italica (L.) P. Beauv.) germplasm. Crop Pasture Sci. 2014, 65, 353–361. [Google Scholar] [CrossRef] [Green Version]
  18. Du, X.; Wang, G.; Ji, J.; Shi, L.; Guan, C.; Jin, C. Comparative transcriptome analysis of transcription factors in different maize varieties under salt stress conditions. Plant Growth Regul. 2017, 81, 183–195. [Google Scholar] [CrossRef]
  19. Abdelrahman, M.; Jogaiah, S.; Burritt, D.J.; Tran, L.P. Legume genetic resources and transcriptome dynamics under abiotic stress conditions. Plant Cell Environ. 2018, 41, 1972–1983. [Google Scholar] [CrossRef]
  20. Rani, B.; Sharma, V.K. Transcriptome profiling: Methods and applications—A review. Agric. Rev. 2017, 38, 271–281. [Google Scholar] [CrossRef] [Green Version]
  21. Puranik, S.; Jha, S.; Srivastava, P.S.; Sreenivasulu, N.; Prasad, M. Comparative transcriptome analysis of contrasting foxtail millet cultivars in response to short-term salinity stress. J. Plant Physiol. 2011, 168, 280–287. [Google Scholar] [CrossRef]
  22. Pan, J.; Li, Z.; Dai, S.; Ding, H.; Wang, Q.; Li, X.; Ding, G.; Wang, P.; Guan, Y.; Liu, W. Integrative analyses of transcriptomics and metabolomics upon seed germination of foxtail millet in response to salinity. Sci. Rep. 2020, 10, 13660. [Google Scholar] [CrossRef]
  23. Brown, W.L. Genetic diversity and genetic vulnerability—An appraisal. Econ. Bot. 1983, 37, 4–12. [Google Scholar] [CrossRef]
  24. Lopes, M.S.; El-Basyoni, I.; Baenziger, P.S.; Singh, S.; Royo, C.; Ozbek, K.; Aktas, H.; Ozer, E.; Ozdemir, F.; Manickavelu, A.; et al. Exploiting genetic diversity from landraces in wheat breeding for adaptation to climate change. J. Exp. Bot. 2015, 66, 3477–3486. [Google Scholar] [CrossRef] [PubMed]
  25. Kole, C.; Muthamilarasan, M.; Henry, R.; Edwards, D.; Sharma, R.; Abberton, M.; Batley, J.; Bentley, A.; Blakeney, M.; Bryant, J.; et al. Application of genomics-assisted breeding for generation of climate resilient crops: Progress and prospects. Front. Plant Sci. 2015, 6, 563. [Google Scholar] [CrossRef] [PubMed] [Green Version]
  26. Kaya, M.D.; Okçu, G.; Atak, M.; Cıkılı, Y.; Kolsarıcı, Ö. Seed treatments to overcome salt and drought stress during germination in sunflower (Helianthus annuus L.). Eur. J. Agron. 2006, 24, 291–295. [Google Scholar] [CrossRef]
  27. Berhanu, A.T.; Berhane, G. The effect of salinity (NaCl) on germination and early seedling growth of Lathyrus sativus and Pisum sativum var. abyssinicum. Afr. J. Plant Sci. 2014, 8, 225–231. [Google Scholar] [CrossRef] [Green Version]
  28. Katembe, W.; Ungar, I.; Mitchell, J. Effect of salinity on germination and seedling growth of two Atriplex species (Chenopodiaceae). Ann. Bot. 1998, 82, 167–175. [Google Scholar] [CrossRef] [Green Version]
  29. Kibar, H.; Yücesan, B. Effects of storage durations at different temperatures on various physiological parameters of einkorn seed (Triticum monucocum L.) germination. J. Stored Prod. Res. 2021, 93, 101851. [Google Scholar] [CrossRef]
  30. Cui, J.; Ren, G.; Qiao, H.; Xiang, X.; Huang, L.; Chang, J. Comparative transcriptome analysis of seedling stage of two sorghum cultivars under salt stress. J. Plant Growth Regul. 2018, 37, 986–998. [Google Scholar] [CrossRef]
  31. Shinozaki, K.; Yamaguchi-Shinozaki, K.; Seki, M. Regulatory network of gene expression in the drought and cold stress responses. Curr. Opin. Plant Biol. 2003, 6, 410–417. [Google Scholar] [CrossRef]
  32. Formentin, E.; Sudiro, C.; Perin, G.; Riccadonna, S.; Barizza, E.; Baldoni, E.; Lavezzo, E.; Stevanato, P.; Sacchi, G.A.; Fontana, P.; et al. Transcriptome and cell physiological analyses in different rice cultivars provide new insights into adaptive and salinity stress responses. Front. Plant Sci. 2018, 9, 204. [Google Scholar] [CrossRef] [Green Version]
  33. Bushman, B.S.; Amundsen, K.L.; Warnke, S.E.; Robins, J.G.; Johnson, P.G. Transcriptome profiling of Kentucky bluegrass (Poa pratensis L.) accessions in response to salt stress. BMC Genom. 2016, 17, 48. [Google Scholar] [CrossRef] [PubMed] [Green Version]
  34. Ueda, A.; Kathiresan, A.; Bennett, J.; Takabe, T. Comparative transcriptome analyses of barley and rice under salt stress. Theor. Appl. Genet. 2006, 112, 1286–1294. [Google Scholar] [CrossRef] [PubMed]
  35. Seki, M.; Umezawa, T.; Kim, J.M.; Matsui, A.; To, T.K.; Shinozaki, K. Transcriptome analysis of plant drought and salt stress response. In Advances in Molecular Breeding toward Drought and Salt Tolerant Crops; Springer: Dordrecht, The Netherlands, 2006; pp. 261–283. [Google Scholar] [CrossRef]
  36. Yu, A.; Zhao, J.; Wang, Z.; Cheng, K.; Zhang, P.; Tian, G.; Liu, X.; Guo, E.; Du, Y.; Wang, Y. Transcriptome and metabolite analysis reveal the drought tolerance of foxtail millet significantly correlated with phenylpropanoids-related pathways during germination process under PEG stress. BMC Plant Biol. 2020, 20, 274. [Google Scholar] [CrossRef] [PubMed]
  37. Xu, B.Q.; Gao, X.L.; Gao, J.F.; Jing, L.I.; Pu, Y.; Feng, B.L. Transcriptome profiling using RNA-seq to provide insights into foxtail millet seedling tolerance to short-term water deficit stress induced by PEG-6000. J. Integr. Agric. 2019, 18, 2457–2471. [Google Scholar] [CrossRef]
  38. Han, M.L.; Yin, J.; Zhao, Y.H.; Sun, X.W.; Meng, J.X.; Zhou, J.; Shen, T.; Li, H.H.; Zhang, F. How the color fades from Malus halliana flowers: Transcriptome sequencing and DNA methylation analysis. Front. Plant Sci. 2020, 11, 576054. [Google Scholar] [CrossRef] [PubMed]
  39. Shankar, R.; Bhattacharjee, A.; Jain, M. Transcriptome analysis in different rice cultivars provides novel insights into desiccation and salinity stress responses. Sci. Rep. 2016, 6, 23719. [Google Scholar] [CrossRef] [Green Version]
  40. Do Amaral, M.N.; Arge, L.W.P.; Benitez, L.C.; Danielowski, R.; Silveira, S.F.D.S.; Farias Dda, R.; de Oliveira, A.C.; da Maia, L.C.; Braga, E.J. Comparative transcriptomics of rice plants under cold, iron, and salt stresses. Funct. Integr. Genom. 2016, 16, 567–579. [Google Scholar] [CrossRef]
  41. Garrido, Y.; Tudela, J.A.; Marín, A.; Mestre, T.; Martínez, V.; Gil, M.I. Physiological, phytochemical, and structural changes of multi-leaf lettuce caused by salt stress. J. Sci. Food Agric. 2014, 94, 1592–1599. [Google Scholar] [CrossRef]
  42. Tian, X.; He, M.; Wang, Z.; Zhang, J.; Song, Y.; He, Z.; Dong, Y. Application of nitric oxide and calcium nitrate enhances tolerance of wheat seedlings to salt stress. Plant Growth Regul. 2015, 77, 343–356. [Google Scholar] [CrossRef]
  43. Golldack, D.; Li, C.; Mohan, H.; Probst, N. Tolerance to drought and salt stress in plants: Unraveling the signaling networks. Front. Plant Sci. 2014, 5, 151. [Google Scholar] [CrossRef] [Green Version]
  44. Sui, N.; Yang, Z.; Liu, M.; Wang, B. Identification and transcriptomic profiling of genes involved in increasing sugar content during salt stress in sweet sorghum leaves. BMC Genom. 2015, 16, 534. [Google Scholar] [CrossRef] [PubMed] [Green Version]
  45. Wang, Y.; Wang, J.; Guo, D.; Zhang, H.; Che, Y.; Li, Y.; Tian, B.; Wang, Z.; Sun, G.; Zhang, H. Physiological and comparative transcriptome analysis of leaf response and physiological adaption to saline alkali stress across pH values in alfalfa (Medicago sativa). Plant Physiol. Biochem. 2021, 167, 140–152. [Google Scholar] [CrossRef] [PubMed]
  46. Duarte, B.; Santos, D.; Marques, J.C.; Caçador, I. Ecophysiological adaptations of two halophytes to salt stress: Photosynthesis, PS II photochemistry and anti-oxidant feedback--implications for resilience in climate change. Plant Physiol. Biochem. 2013, 67, 178–188. [Google Scholar] [CrossRef] [PubMed]
  47. Szyszka-Mroz, B.; Pittock, P.; Ivanov, A.G.; Lajoie, G.; Hüner, N.P. The Antarctic psychrophile Chlamydomonas sp. UWO 241 preferentially phosphorylates a photosystem I-cytochrome b6/f supercomplex. Plant Physiol. 2015, 169, 717–736. [Google Scholar] [CrossRef] [PubMed] [Green Version]
  48. Soontharapirakkul, K.; Promden, W.; Yamada, N.; Kageyama, H.; Incharoensakdi, A.; Iwamoto-Kihara, A.; Takabe, T. Halotolerant cyanobacterium Aphanothece halophytica contains an Na+-dependent F1F0-ATP synthase with a potential role in salt-stress tolerance. J. Biol. Chem. 2011, 286, 10169–10176. [Google Scholar] [CrossRef] [Green Version]
  49. Zhou, X.; Zhao, H.; Cao, K.; Hu, L.; Du, T.; Baluška, F.; Zou, Z. Beneficial roles of melatonin on redox regulation of photosynthetic electron transport and synthesis of D1 protein in tomato seedlings under salt stress. Front. Plant Sci. 2016, 7, 1823. [Google Scholar] [CrossRef] [PubMed] [Green Version]
  50. Dudhate, A.; Shinde, H.; Tsugama, D.; Liu, S.; Takano, T. Transcriptomic analysis reveals the differentially expressed genes and pathways involved in drought tolerance in pearl millet [Pennisetum glaucum (L.) R. Br]. PLoS ONE 2018, 13, e0195908. [Google Scholar] [CrossRef]
  51. Fan, P.; Feng, J.; Jiang, P.; Chen, X.; Bao, H.; Nie, L.; Jiang, D.; Lv, S.; Kuang, T.; Li, Y. Coordination of carbon fixation and nitrogen metabolism in Salicornia europaea under salinity: Comparative proteomic analysis on chloroplast proteins. Proteomics 2011, 11, 4346–4367. [Google Scholar] [CrossRef]
  52. Licausi, F.; Ohme-Takagi, M.; Perata, P. APETALA2/Ethylene Responsive Factor (AP2/ERF) transcription factors: Mediators of stress responses and developmental programs. New Phytol. 2013, 199, 639–649. [Google Scholar] [CrossRef]
  53. Shah, W.H.; Rasool, A.; Saleem, S.; Mushtaq, N.U.; Tahir, I.; Hakeem, K.R.; Rehman, R.U. Understanding the integrated pathways and mechanisms of transporters, protein kinases, and transcription factors in plants under salt stress. Int. J. Genom. 2021, 2021, 5578727. [Google Scholar] [CrossRef]
  54. Li, Q.; Qin, Y.; Hu, X.; Li, G.; Ding, H.; Xiong, X.; Wang, W. Transcriptome analysis uncovers the gene expression profile of salt-stressed potato (Solanum tuberosum L.). Sci. Rep. 2020, 10, 5411. [Google Scholar] [CrossRef] [PubMed]
  55. Zhou, Y.; Yang, P.; Cui, F.; Zhang, F.; Luo, X.; Xie, J. Transcriptome analysis of salt stress responsiveness in the seedlings of Dongxiang wild rice (Oryza rufipogon Griff.). PLoS ONE 2016, 11, e0146242. [Google Scholar] [CrossRef] [PubMed] [Green Version]
  56. Guo, M.; Liu, X.; Wang, J.; Jiang, Y.; Yu, J.; Gao, J. Transcriptome profiling revealed heat stress-responsive genes in Arabidopsis through integrated bioinformatics analysis. J. Plant Interact. 2022, 17, 85–95. [Google Scholar] [CrossRef]
  57. Azimian, J.; Hervan, E.M.; Azadi, A.; Bakhtiarizadeh, M.R.; Azizinezhad, R. Transcriptome analysis of a Triticum aestivum landrace (Roshan) in response to salt stress conditions. Plant Genet. Resour. 2021, 19, 261–274. [Google Scholar] [CrossRef]
  58. Chen, N.; Su, M.; Chi, X.; Zhang, Z.; Pan, L.; Chen, M.; Wang, T.; Wang, M.; Yang, Z.; Yu, S. Transcriptome analysis reveals salt-stress-regulated biological processes and key pathways in roots of peanut (Arachis hypogaea L.). Genes Genom. 2016, 38, 493–507. [Google Scholar] [CrossRef]
  59. Park, S.; Son, S.; Shin, M.; Fujii, N.; Hoshino, T.; Park, S. Transcriptome-wide mining, characterization, and development of microsatellite markers in Lychnis kiusiana (Caryophyllaceae). BMC Plant Biol. 2019, 19, 14. [Google Scholar] [CrossRef] [Green Version]
  60. Palatnik, J.F.; Wollmann, H.; Schommer, C.; Schwab, R.; Boisbouvier, J.; Rodriguez, R.; Warthmann, N.; Allen, E.; Dezulian, T.; Huson, D.; et al. Sequence and expression differences underlie functional specialization of Arabidopsis microRNAs miR159 and miR319. Dev. Cell 2007, 13, 115–125. [Google Scholar] [CrossRef] [Green Version]
  61. Ding, D.; Zhang, L.F.; Wang, H.; Liu, Z.J.; Zhang, Z.X.; Zheng, Y.L. Differential expression of miRNAs in response to salt stress in maize roots. Ann. Bot. 2009, 103, 29–38. [Google Scholar] [CrossRef] [Green Version]
  62. Sun, X.; Sun, C.; Li, Z.; Hu, Q.; Han, L.; Luo, H. AsHSP17, a creeping bentgrass small heat shock protein modulates plant photosynthesis and ABA-dependent and independent signalling to attenuate plant response to abiotic stress. Plant Cell Environ. 2016, 39, 1320–1337. [Google Scholar] [CrossRef] [Green Version]
  63. Chen, L.; Sun, H.; Kong, J.; Xu, H.; Yang, X. Integrated transcriptome and proteome analysis reveals complex regulatory mechanism of cotton in response to salt stress. J. Cotton Res. 2021, 4, 11. [Google Scholar] [CrossRef]
  64. Nam, M.H.; Huh, S.M.; Kim, K.M.; Park, W.W.; Seo, J.B.; Cho, K.; Kim, D.Y.; Kim, B.G.; Yoon, I.I. Comparative proteomic analysis of early salt stress-responsive proteins in roots of SnRK2 transgenic rice. Proteome Sci. 2012, 10, 25. [Google Scholar] [CrossRef] [PubMed] [Green Version]
  65. Trvedi, S.; Erdei, L. Effects of cadmium and lead on the accumulation of Ca2+ and K+ and on the influx and translocation of K+ in wheat of low and high K+ status. Physiol. Plant. 1994, 84, 94–100. [Google Scholar] [CrossRef]
  66. Yu, D.; Tang, H.; Zhang, Y.; Du, Z.; Yu, H.; Chen, Q. Comparison and improvement of different methods of RNA isolation from strawberry (Fragria × ananassa). J. Agric. Sci. 2012, 4, 625–637. [Google Scholar] [CrossRef]
  67. Martin, M. Cutadapt removes adapter sequences from high-throughput sequencing reads. EMBnet J. 2011, 17, 10–12. [Google Scholar] [CrossRef]
  68. Langmead, B.; Trapnell, C.; Pop, M.; Salzberg, S.L. Ultrafast and memory-efficient alignment of short DNA sequences to the human genome. Genome Biol. 2009, 10, R25. [Google Scholar] [CrossRef] [PubMed] [Green Version]
  69. Langmead, B.; Salzberg, S.L. Fast gapped-read alignment with Bowtie 2. Nat. Methods 2012, 9, 357–359. [Google Scholar] [CrossRef] [Green Version]
  70. Kim, D.; Pertea, G.; Trapnell, C.; Pimentel, H.; Kelley, R.; Salzberg, S.L. TopHat2: Accurate alignment of transcriptomes in the presence of insertions, deletions and gene fusions. Genome Biol. 2013, 14, R36. [Google Scholar] [CrossRef] [PubMed] [Green Version]
  71. Trapnell, C.; Pachter, L.; Salzberg, S. TopHat: Discovering splice junctions with RNA-Seq. Bioinformatics 2009, 25, 1105–1111. [Google Scholar] [CrossRef]
  72. Kersey, P.J.; Allen, J.E.; Allot, A.; Barba, M.; Boddu, S.; Bolt, B.J.; Carvalho-Silva, D.; Christensen, M.; Davis, P.; Grabmueller, C.; et al. Ensembl genomes 2018: An integrated omics infrastructure for non-vertebrate species. Nucleic Acids Res. 2018, 46, D802–D808. [Google Scholar] [CrossRef]
  73. Anders, S.; Huber, W. Differential expression analysis for sequence count data. Genome Biol. 2010, 11, R106. [Google Scholar] [CrossRef] [Green Version]
  74. Love, M.I.; Huber, W.; Anders, S. Moderated estimation of fold change and dispersion for RNA-seq data with DESeq2. Genome Bio. 2014, 15, 550. [Google Scholar] [CrossRef] [Green Version]
  75. Young, M.D.; Wakefield, M.J.; Smyth, G.K.; Oshlack, A. Gene ontology analysis for RNA-seq: Accounting for selection bias. Genome Biol. 2010, 11, R14–R26. [Google Scholar] [CrossRef] [PubMed] [Green Version]
  76. Kanehisa, M.; Araki, M.; Goto, S.; Hattori, M.; Hirakawa, M.; Itoh, M.; Katayama, T.; Kawashima, S.; Okuda, S.; Tokimatsu, T.; et al. KEGG for linking genomes to life and the environment. Nucleic Acids Res. 2008, 32, D480–D484. [Google Scholar] [CrossRef] [PubMed]
  77. Kanehisa, M.; Goto, S.; Kawashima, S.; Okuno, Y.; Hattori, M. The KEGG resource for deciphering the genome. Nucleic Acids Res. 2004, 32, D277–D280. [Google Scholar] [CrossRef] [PubMed] [Green Version]
  78. Bu, D.C.; Luo, H.T.; Huo, P.P.; Wang, Z.H.; Zhang, S.; He, Z.H.; Wu, Y.; Zhao, L.H.; Liu, J.J.; Guo, J.C.; et al. KOBAS-i: Intelligent prioritization and exploratory visualization of biological functions for gene enrichment analysis. Nucleic Acids Res. 2021, 49, W317–W325. [Google Scholar] [CrossRef]
  79. Zhang, S.C.; Li, M.J.; Guo, J.K.; Shi, Z.L.; Fu, X.Y.; Di, R.Y.; Li, Y.M. Comparative transcriptome analysis of Triticum aestivum in response to nitrogen stress. Russ. J. Plant Physiol. 2016, 63, 365–374. [Google Scholar] [CrossRef]
  80. Szklarczyk, D.; Gable, A.L.; Lyon, D.; Junge, A.; Wyder, S.; Huerta-Cepas, J.; Simonovic, M.; Doncheva, N.T.; Morris, J.H.; Bork, P.; et al. STRING v11: Protein-protein association networks with increased coverage, supporting functional discovery in genome-wide experimental datasets. Nucleic Acids Res. 2018, 47, D607–D613. [Google Scholar] [CrossRef] [Green Version]
  81. Jensen, L.J.; Kuhn, M.; Stark, M.; Chaffron, S.; Creevey, C.; Muller, J.; Doerks, T.; Julien, P.; Roth, A.; Simonovic, M.; et al. STRING 8—A global view on proteins and their functional interactions in 630 organisms. Nucleic Acids Res. 2009, 37, D412–D416. [Google Scholar] [CrossRef]
  82. Ni, L.; Wang, Z.; Guo, J.; Pei, X.; Liu, L.; Li, H.; Yuan, H.; Gu, C. Full-Length transcriptome sequencing and comparative transcriptome analysis to evaluate drought and salt stress in Iris lactea var. chinensis. Genes 2021, 12, 434. [Google Scholar] [CrossRef]
  83. Szklarczyk, D.; Franceschini, A.; Wyder, S.; Forslund, K.; Heller, D.; Huerta-Cepas, J.; Simonovic, M.; Roth, A.; Santos, A.; Tsafou, K.P.; et al. STRING v10: Protein–protein interaction networks, integrated over the tree of life. Nucleic Acids Res. 2015, 43, D447–D452. [Google Scholar] [CrossRef]
  84. Kohl, M.; Wiese, S.; Warscheid, B. Cytoscape: Software for visualization and analysis of biological networks. Methods Mol. Biol. 2011, 696, 291–303. [Google Scholar] [CrossRef] [PubMed]
Figure 1. Enrichment analysis of GO between SS/SC (a) and TS/TC (b). The red, blue, and gray colors represent cellular component, biological process, and molecular function, respectively. Cluster frequency is the proportion of DEGs annotated to a term to the total DEGs annotated to GO database.
Plants 11 01864 g001
Figure 2. Enrichment analysis of KEGG.
Plants 11 01864 g002
Figure 3. Differentially expressed genes in photosynthesis pathway (sita00195) (a) and carbon fixation in photosynthetic pathway (sita00710) (b) in salt-sensitive and salt-tolerant accessions. The green and red colors represent down- and up-regulated genes, respectively.
Plants 11 01864 g003
Figure 4. Differential expression of transcription factor salt-sensitive (a) and salt-tolerant (b) accessions. Color key indicates the log2FoldChange.
Plants 11 01864 g004
Figure 5. Protein–protein interaction network of Hub genes in salt-sensitive (a) and salt-tolerant (b) accessions. The green and red colors represent down- and up-regulated genes, respectively. All interactions had the highest confidence (0.900) to minimize false functional links.
Plants 11 01864 g005
Table 1. Comprehensive evaluation of salt tolerance of 18 foxtail millet accessions in seeding foxtail millet under different NaCl concentrations. The score and rank under different NaCl concentrations indicate the scores and rank at that concentration, while the total score and rank indicate the comprehensive scores and rank under all NaCl concentrations.
Code0.13 Mol·L−10.17 Mol·L−10.22 Mol·L−1Total ScoreTotal Rank
ScoreRankScoreRankScoreRank
FM63.6333.3123.18110.121
FM73.4942.7442.5058.744
FM313.3852.1152.6248.125
FM963.8513.4112.75310.022
FM733.6922.9532.8929.533
FM150.76130.28170.43121.4816
FM271.8970.6690.56113.117
FM410.50170.41150.41151.3317
FM480.53160.57100.6771.7713
FM490.79110.50110.6081.8811
FM621.1980.8660.7192.778
FM660.56150.40130.9561.9110
FM720.77120.41140.45171.6215
FM782.0960.7770.42163.276
FM861.0890.48120.48132.039
FM890.90100.38160.48101.7614
FM900.47180.26180.14180.8718
FM1020.74140.6780.45141.8712
Table 2. Hub gene information by maximal clique centrality method.
TreatmentRankGene SymbolGene DescriptionScore
SS/SC1LOC10177363230S ribosomal protein S96.28 × 109
2LOC101762479S ribosomal protein L36.28 × 109
3LOC10175754250S ribosomal protein L16.28 × 109
4LOC10176176030S ribosomal protein S10 X26.28 × 109
5LOC10177825750S ribosomal protein L46.28 × 109
6LOC10177109450S ribosomal protein L56.28 × 109
7LOC10177769330S ribosomal protein S136.28 × 109
8LOC10178014250S ribosomal protein L116.28 × 109
9LOC10178027650S ribosomal protein L66.28 × 109
10LOC10177637950S ribosomal protein L276.28 × 109
TS/TC1LOC101770922probable aldehyde dehydrogenase25
1LOC101778373glutamate dehydrogenase25
3LOC101754854glutamine synthetase cytosolic isozyme 1-324
3LOC101775420delta-1-pyrroline-5-carboxylate synthase 224
3LOC101765114delta-1-pyrroline-5-carboxylate synthase 124
6LOC101781167enolase 1, chloroplastic9
7LOC101760718triosephosphate isomerase, cytosolic8
8LOC101755337glucose-1-phosphate adenylyltransferase small subunit 1, chloroplastic/amyloplastic2
8LOC101773221alpha-1,4 glucan phosphorylase L isozyme, chloroplastic/amyloplastic2
8LOC101756252heat shock 70 kDa protein2
Publisher’s Note: MDPI stays neutral with regard to jurisdictional claims in published maps and institutional affiliations.

