Article

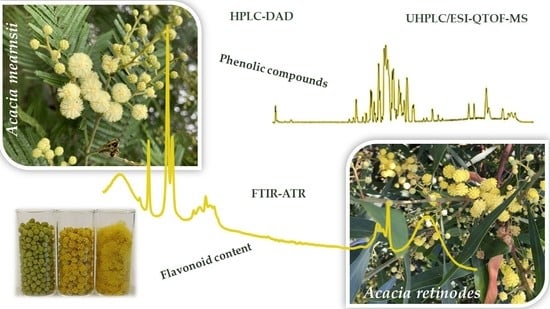
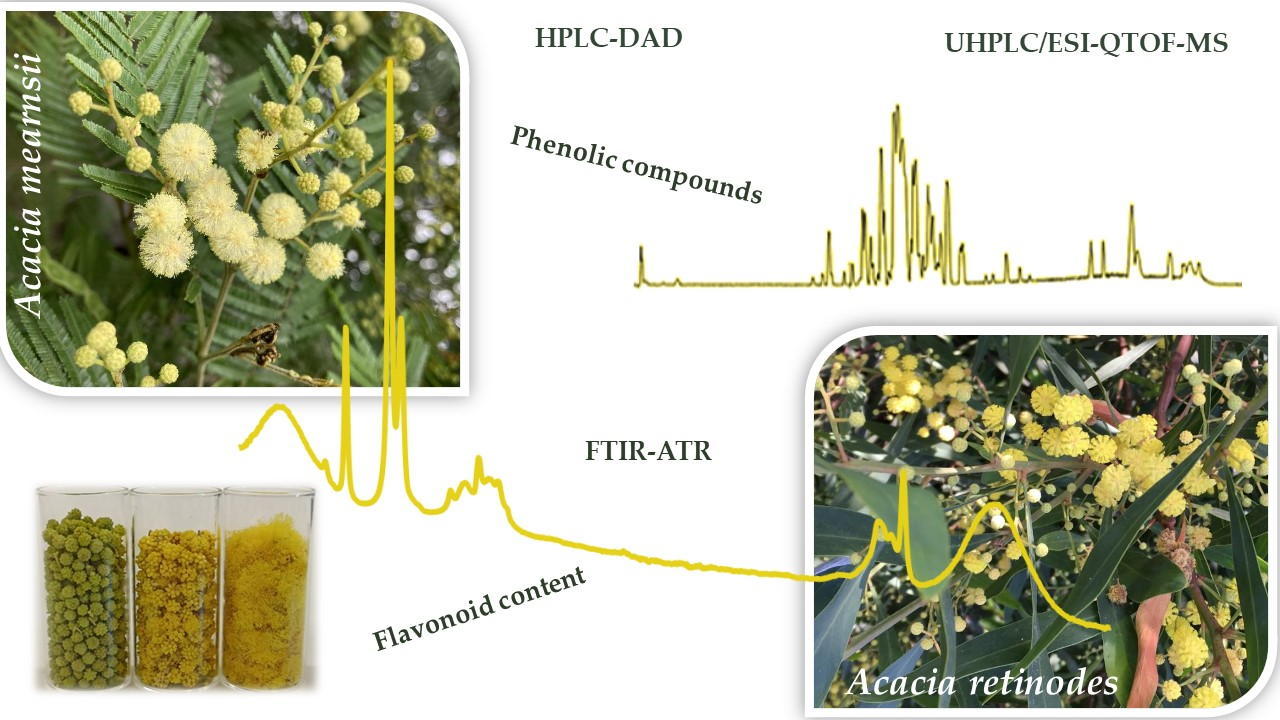
Characterisation of the Phenolic Profile of Acacia retinodes and Acacia mearnsii Flowers’ Extracts

1
Centro de Biotecnologia de Plantas da Beira Interior, 6001-909 Castelo Branco, Portugal
2
Centro de Estudos Florestais (CEF), Instituto Superior de Agronomia, Universidade de Lisboa, 1349-017 Lisboa, Portugal
3
Centro de Investigação em Ciências da Saúde (CICS-UBI), Universidade da Beira Interior, 6200-506 Covilhã, Portugal
4
Laboratório de Fármaco-Toxicologia—UBIMedical, Universidade da Beira Interior, 6200-506 Covilhã, Portugal
5
Instituto Politécnico de Castelo Branco, 6001-909 Castelo Branco, Portugal
6
Centro Ecologia Aplicada “Prof. Baeta Neves” (CEABN), Instituto Superior de Agronomia, Universidade de Lisboa, 1349-017 Lisboa, Portugal
7
(CEMBIO) Centro de Metabolómica y Bioanálisis, Facultad de Farmacia, Universidad San Pablo CEU, CEU Universities, Campus Monteprincipe, Boadilla del Monte, 28660 Madrid, Spain
*
Author to whom correspondence should be addressed.
Plants 2022, 11(11), 1442; https://doi.org/10.3390/plants11111442
Submission received: 3 May 2022 / Revised: 21 May 2022 / Accepted: 24 May 2022 / Published: 28 May 2022

Abstract

:
Acacia spp. is an invasive species that is widespread throughout the Portuguese territory. Thus, it is pertinent to better understand this species in order to find different applications that will value its use. To evaluate the phenolic profile in Acacia flowers, ethanolic extracts obtained through an energized guided dispersive extraction were analysed, focusing on two species, Acacia retinodes and Acacia mearnsii, at two flowering stages. The phytochemical profile of each extract was determined by ultra-high performance liquid chromatography coupled with quadrupole time-of-flight mass spectrometry and high-performance liquid chromatography coupled with diode array detector. The FTIR-ATR technique was used to distinguish the different samples’ compositions. The results showed the presence of high concentrations of phenolic compounds (>300 mg GAE/g extract), among which are flavonoids (>136 mg QE/g extract), for all combinations of species/flowering stages. The phytochemical profile showed a complex composition with 21 compounds identified and quantified (the predominant ones being epicatechin, rutin, vanillin, and catechol). Both species and flowering stages presented significant variations regarding the presence and quantity of phenols and flavonoids, so much so that a principal component analysis performed with FTIR-ATR spectra data of the extracts was able to discriminate between species and flowering stages.

Graphical Abstract

1. Introduction

Natural compounds obtained from plants offer research opportunities due to their significant pharmacological and toxicological properties [1]. They are often considered as potential new drugs against drug-resistant pathogens [2] and for treating diseases.
A variety of medicinal species belonging to the genus Acacia suggest the potential presence of bioactive metabolites. The most characteristic in this genus are flavonoids and tannins compounds [3]. The literature that is focused on plant extracts indicates that these species are rich in phytochemical compounds such as polyphenols, flavonoids, saponins, alkaloids, among others. The accumulations are made in different tissues/organs (leaves, barks, flowers, seeds, wood, and twigs) and have wide applications as antioxidants, antimicrobials, pharmaceuticals, and biopesticides [4,5,6,7,8].
Acacia flowers play a crucial role in colonisation ability. They limit the growth of other species due to allelopathic interference caused by the decomposition of this plant material in the soil, altering its characteristics to decrease other species’ viability and, therefore, increasing its unopposed proliferation. This effect is longstanding as the soil toxicity percolates for a long time [9,10]. Flower extracts are already exploited in hydrogels for personal care products, cosmetics, pharmaceuticals, and perfumes based on their anti-radical and anti-proliferative potential [11].
The species selected for this study are Acacia mearnsii De Wild. and Acacia retinodes Schltdl., belonging to the Fabaceae Lindl. family, Caesalpinioideae subfamily, Acacieae tribe, and Acacia genus [12,13,14,15]. A. mearnsii is commonly known as “Acacia-Negra” or Black Wattle [13], a native from southeastern Australia and introduced in Africa, the Caribbean, east Asia, Europe, Sri Lanka, North America, New Zealand, South America, and southeast Asia [16,17]. It is considered a rapidly growing tree species of economic importance in Japan as well as an important commercial forestry species in South Africa, mainly due to the abundance of tannin in its bark and for pulp in the pulp and paper industry [11]. Traditionally, its bark extract has been used in the leather tanning industry. Moreover, current research on the composition and biological activity of the bark extract has suggested applications in health and medicine [18].
A. retinodes is endemic to south Australia, yet has been introduced to Africa, Europe, Macronesia, North America, the Pacific and Indian Ocean Islands, the Indian subcontinent, and southeast to west Asia [16,17], known as Wirilda, Swamp Wattle, or Silver Wattle [13]. According to O’Leary (2007) [19], A. retinodes bark was mentioned, in 1848, for its use in tanning, with its exuded gums becoming an early export commercial business and with natives eating it due to its nutritious characteristics. Acacia barks have been the focus of some studies regarding their extractives’ contents and bioactive components [11,20], with a significant fraction being attributed to tannins and related compounds. On the other hand, little work has been conducted on Acacia. Correia et al. [11] reported that Acacia spp. flowers are economically important due to their application in the cosmetic and perfume industries. However, there is a lack of information regarding the flower’s potential, as raw material, to derive renewable phenolic compounds from such a widely distributed species. More research on these materials can complement other end-uses, already associated with different plant parts of these species, intending on total biomass utilisation in a zero-waste philosophy.
New emerging technologies used for the extraction of bioactive compounds are gaining attention at both industrial and scientific research scales [21,22] when compared to conventional extraction procedures such as solid–liquid extraction [23] or Soxhlet extraction [24]. These new technologies can save time, energy, and specific resources, reducing the carbon footprint in extraction processes [24]. In this context, Energized Dispersive Guided Extraction (EDGE), an automated extraction system, can be considered an innovative procedure. This simple and efficient method translates into high extract yields by combining heat, pressure, and solvents to quickly and efficiently extract samples. This methodology has been used to extract Oregon List pesticides from cannabis edibles (candy, French fries, chocolate, cookies, and granola) and cannabis flowers and to compare the efficiency of extraction of phenolic compounds present in Acacia flowers using EDGE procedure and the Soxhlet apparatus (classical method) [25]. The extraction by EDGE showed a more efficient extraction and a faster, cleaner, and safer controlled methodology, which is in line with the time and resource savings and increased extraction yields compared to other conventional techniques. One of the novelties of this work lies in the extraction method for the recovery of phenolic compounds and flavonoids from flowers.
Phenolic compounds are the most promising secondary metabolites found in plants due to their potential as natural antioxidants that can be used in the food and pharmaceutical industries.
The present study aims to evaluate the phenolic compounds present on ethanolic extracts of A. mearnsii and A. retinodes flowers in two flowering stages, using high-performance liquid chromatography (HPLC) coupled to a diode array detector (DAD) and ultra-high-pressure liquid chromatography accurate-mass quadrupole time-of-flight mass spectrometry with electrospray ionization (UHPLC/ESI-QTOF-MS). Fourier-transform infrared spectroscopy—attenuated total reflection (FTIR-ATR) was used to distinguish between species and flowering stages.
Despite all ethnobotanical knowledge about this species, little is known about these species’ chemistry and bioactive compounds, namely A. mearnsii, due to the difficulty of Acacia species identification apart from their taxonomic relationship [26]. Therefore, the data gathered with this study will allow further research and potential application of these species’ flowers regarding value-added products.

2. Results and Discussion

2.1. Determination of Total Phenolic and Flavonoids Content

Phenolic compounds are among the main secondary metabolites of plants, and it is possible to find some of them in all plants [27]. These compounds have beneficial properties in the food industry and have medicinal applications as preservatives, antioxidants, anti-inflammatories, and anti-carcinogens, among others [28,29,30]. Total phenolics were determined using the Folin–Ciocalteu colorimetric method (Table 1).
The amount of TPC in flowers from the two flowering stages ranged, on average, between 300 and 350 mg GAE/mL for both A. mearnsii and A. retinodes.
The ANOVA results (Table 1) show a difference in total phenolic contents between the two species, where this difference accounted for 49.1% of the total variance for TPC. While, for A. retinodes, phenolic content increases as the flowering stage progresses, the opposite was observed for A. mearnsii, although with a less significant variation. In the species A. retinodes, the total phenolic content is higher in the late flowering stage (LF). However, in both species, no significant differences were observed between flowering stage. Flavonoids have beneficial biological activities, namely anti-inflammatory, antimicrobial, antioxidant, cytotoxic, and antitumour [31]. In this study, flavonoids were determined by the aluminium chloride colorimetric method (Table 1).
Concerning TFC, the flowers of the A. mearnsii species presented a significantly higher value in relation to the other species analysed, and this difference represented 46.8% of the total variation observed. In this case, the state of maturity was also highly significant (25.9% of the total variance), with the late flowers possessing a higher amount of TFC, independently of species.
These results are similar to those obtained by A. dealbata [31], but in this case, the early flowering stage presents higher TPC and TFC than the late stage.
The TPC and TFC obtained in this study are in agreement with those observed for A. podalyriifolia flowers [32] but are lower than those observed for A. confusa [33].

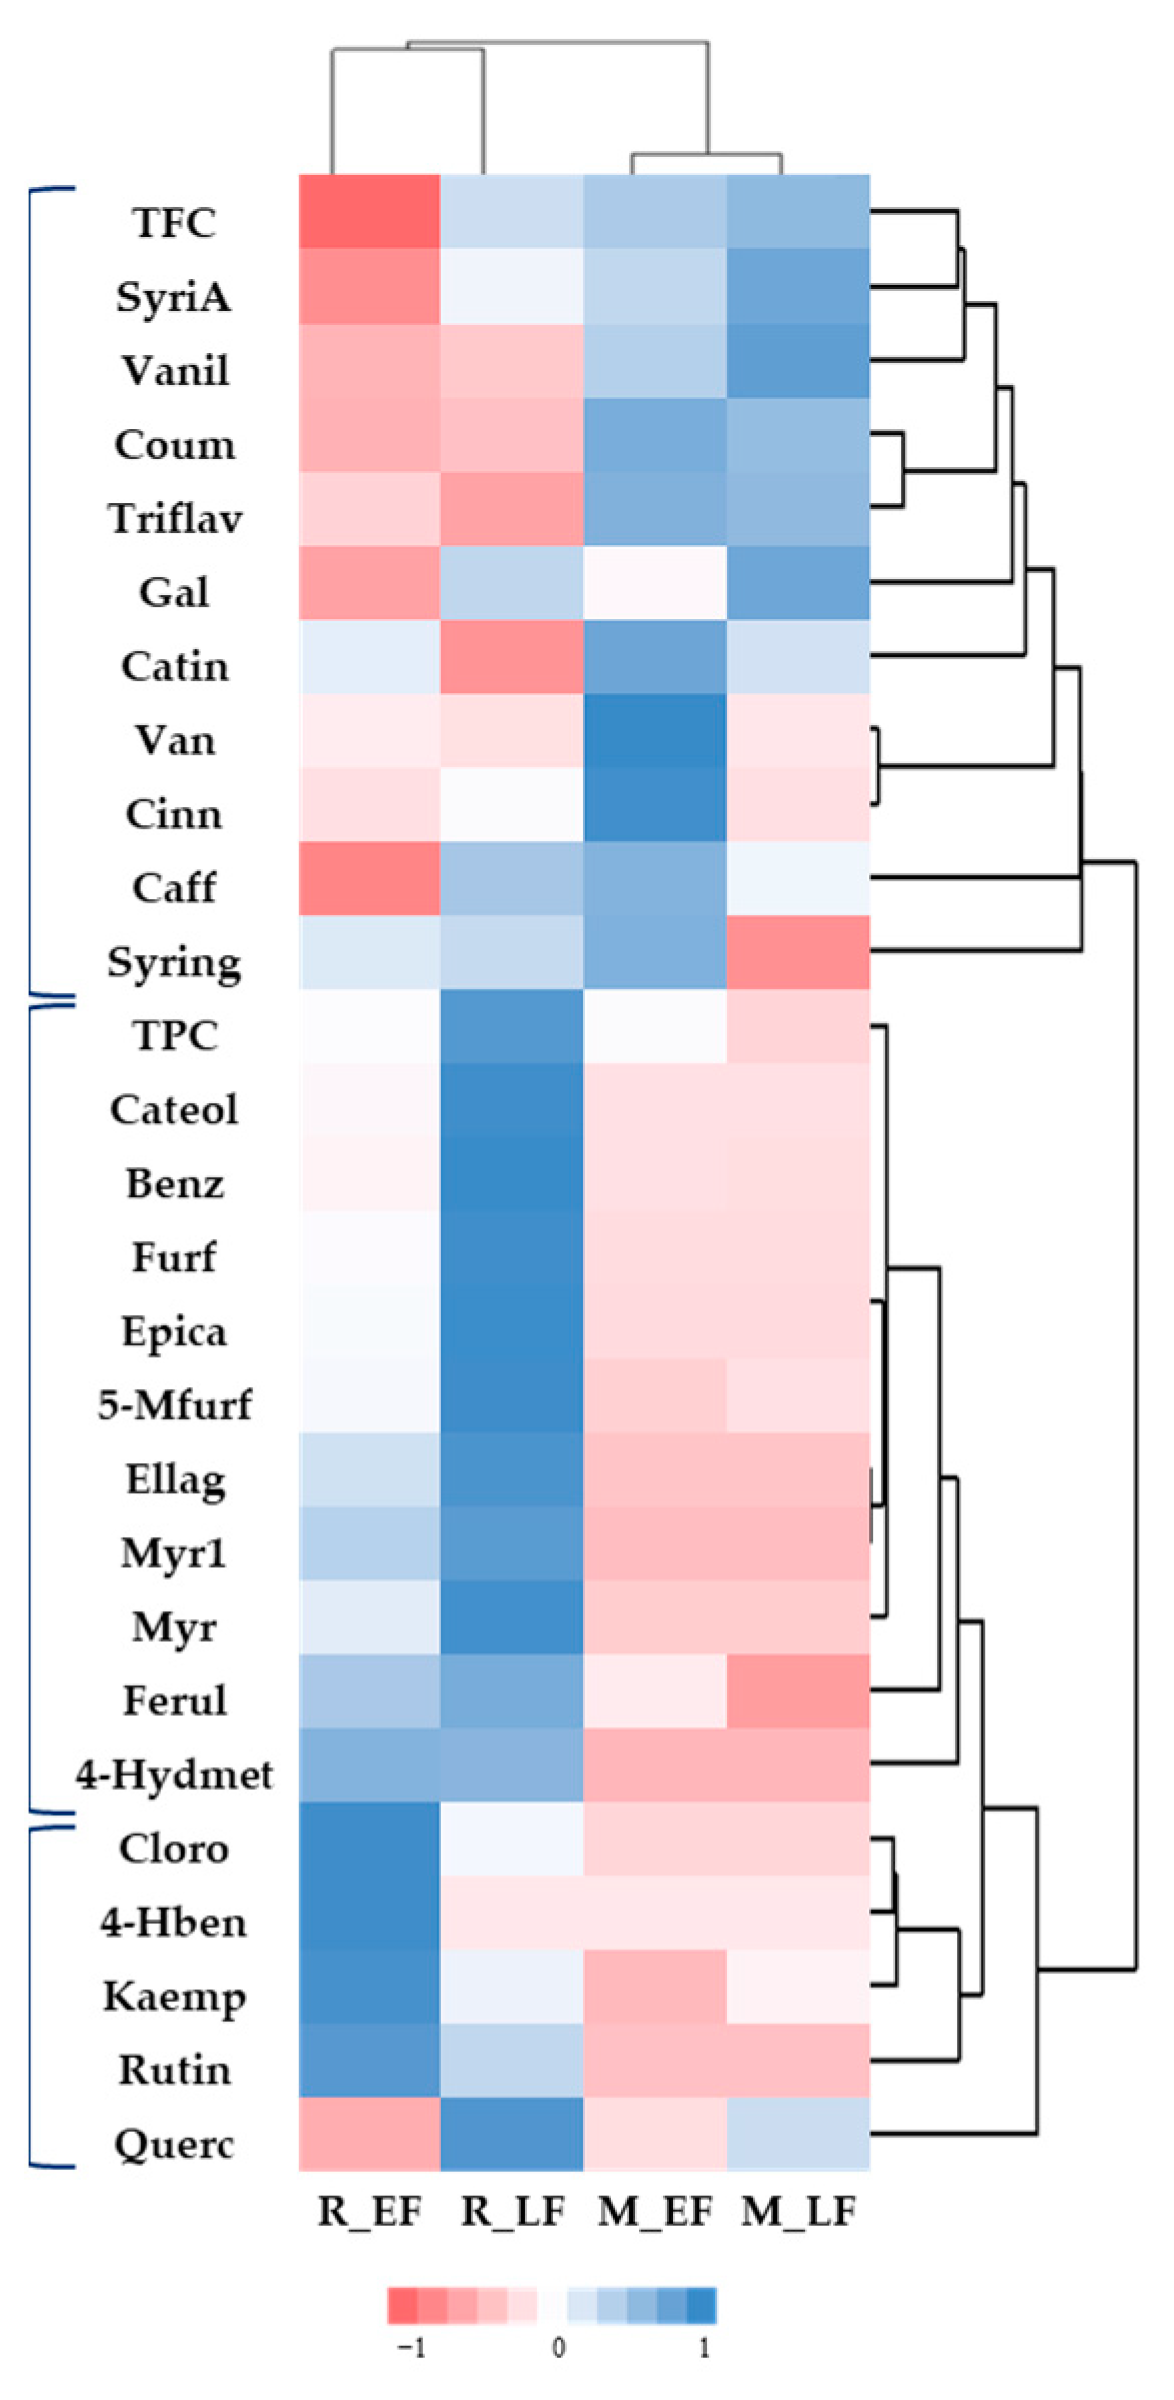
2.2. Targeted and Untargeted Phytochemical Study

The samples were analysed by ultra-high performance liquid chromatography (UHPLC) coupled to a QTOF-MS detector in order to identify the compounds and complement phytochemical characterization. The chromatographic analysis was performed using optimized conditions, providing a satisfactory separation in less than 25 min [34].
Analysis of phenolic compounds is reported in positive and negative ionization modes, but the latter mode was found more sensitive for the analysis of most compounds.
(i) Targeted analysis: Twenty-nine compounds were unambiguously identified and characterised by comparison of retention times and accurate mass spectra with those of authentic standards. A phytochemical library of 48 standard solutions (freshly prepared) was used to identify the metabolites in methanol extracts [35], and two groups of compounds were mainly present: hydroxybenzoic acids and flavonoids (Table 2).
The samples were then analysed by a high-performance liquid chromatography-diode array detector (HPLC/DAD) to identify the other compounds and further complement the initial detection and phytochemical characterisation. Our group has some experience concerning the quantification of phenolic compounds [36,37,38,39]. Thus, compound identification was carried out by comparing their retention times with those obtained from analytical standards. The concentration of the identified compounds was estimated by comparing their peak areas in the chromatograms of plant extracts with calibration curves constructed using the corresponding standard solutions (Supplementary Material: Table S1. Data validation). The results are shown in Table 3. It was in the species A. retinodes that it was possible to quantify most of the compounds, 20 of them, while in the species A. mearnsii, it was only possible to quantify gallic acid, vanillin, syringaldehyde, caffeic acid, p-coumaric acid, trans-cinnamic acid, 5-methylfurfural, (+) catechin, quercetin, and 4′,5,7-trihydroxyflavanone. The remaining compounds were not detected or were below the limit of quantification.
The results presented in Table 4 report the effects of species and flowering stages for all analysed compounds. The percentage of the variance of each factor analysed (species and flowering stages) was calculated based on the two-way ANOVA results.
Regarding Table 4, the concentration of gallic acid, syringaldehyde, and caffeic acid is not affected by species or flowering stages. Vanillin, p-coumaric acid, trans-cinnamic acid, 4′,5,7-trihydroxyflavanone, 5-methyfurfural, quercetin, 4′,5,7-trihydroxyflavanone, catechol, and (-)-epicatechin are highly influenced by the species. Comparing the compounds that appear in both species, it is possible to conclude that A. mearnsii is richer in the analysed compounds, with a significantly higher amount of vanillin, p-coumaric acid, trans-cinnamic acid, 4′,5,7-trihydroxyflavanone, catechol, and (-)-epicatechin, where quercetin and 5-methyfurfural are present in a significantly higher amount in A. retinodes (Table 3). Gallic acid, syringaldehyde, and caffeic acid do not show significant differences between species.
Furfural, 4-hydroxybenzoic acid, chlorogenic acid, 4-hydroxybenzaldehyde, myricitrin, rutin, kaempferol, and myricetin are presented only in the A. retinodes species (Table 3), and the differences between early flower and late flower are highly significant (Table 4). Furfural, 4-hydroxybenzoic acid, myricitrin, myricetin, and rutin present as significantly higher on LF than in EF.
Only chlorogenic acid and kaempferol are present in a significantly higher amount in EF.
The compounds (+)-catechin and coniferaldehyde appear only in A. mearnsii but do not show significant differences between LF and EF (Table 3 and Table 4).
For the remaining compounds whose quantification was not performed by HPLC-DAD due to the absence of analytical standards, the concentration of the identified compounds by UHPLC/ESI-QTOF-MS was estimated by comparing their peak areas in the chromatograms from the plant extracts with those of the corresponding standard solutions freshly prepared and analysed by duplicate in the same batch as the samples (Supplementary Material Table S2). These results are presented in Table 5.
(ii) Untargeted study: Finally, UHPLC-ESI-QTOF-MS/MS facilitates the characterization of known and unknown compounds on the basis of their molecular formula, exact mass measurements, and MS/MS fragmentations. Thus, the most abundant signal was analysed in both species (Supplementary Material: Figures S1 and S2). The compounds were tentatively identified by matching the accurate masses (±5 ppm error) of the detected molecular ions and their MS/MS patterns (Table 6). These patterns were obtained from those compounds previously reported in the literature and after comparison against open-acess databases such as FOODB (http://foodb.ca, accessed on 2 February 2022) [40] and by using the on-line tool CEU Mass Mediator (http://ceumass.eps.uspceu.es/mediator, accessed on 2 February 2022) [41].
A global analysis was performed using a heat map to visualise hierarchical clustering that ordered similar groups to understand the behaviour of the different analysed compounds as a whole concerning each species and in the different flowering states to understand coherent patterns among them.
A heat map is a graphical representation of data where the individual values contained in a matrix are represented as colours [42].
The heat map (Figure 1) was generated from the content of compounds identified in each species and flowering stage. The blue colours represent a positive correlation between analyte levels and species, while the pink colours depict a negative correlation.
Heat maps clustered the two Acacia species into two groups according to the abundance and presence of the different compounds. Total phenolic compounds, gallic acid, caffeic acid, (+)-catechin, p-coumaric acid, 4′,5,7-trihydroxyflavanone, trans-cinnamic acid, vanillin, and syringaldehyde are more abundant in A. mearnsii, with some differences between EL and LF. A. retinodes presents a higher amount of the other compounds. Some of them appear only in this species, as aforementioned.
Regarding the cluster where A. retinodes have a higher amount, it was also possible to identify two sub-clusters related to the differences between early flowers and late ones.

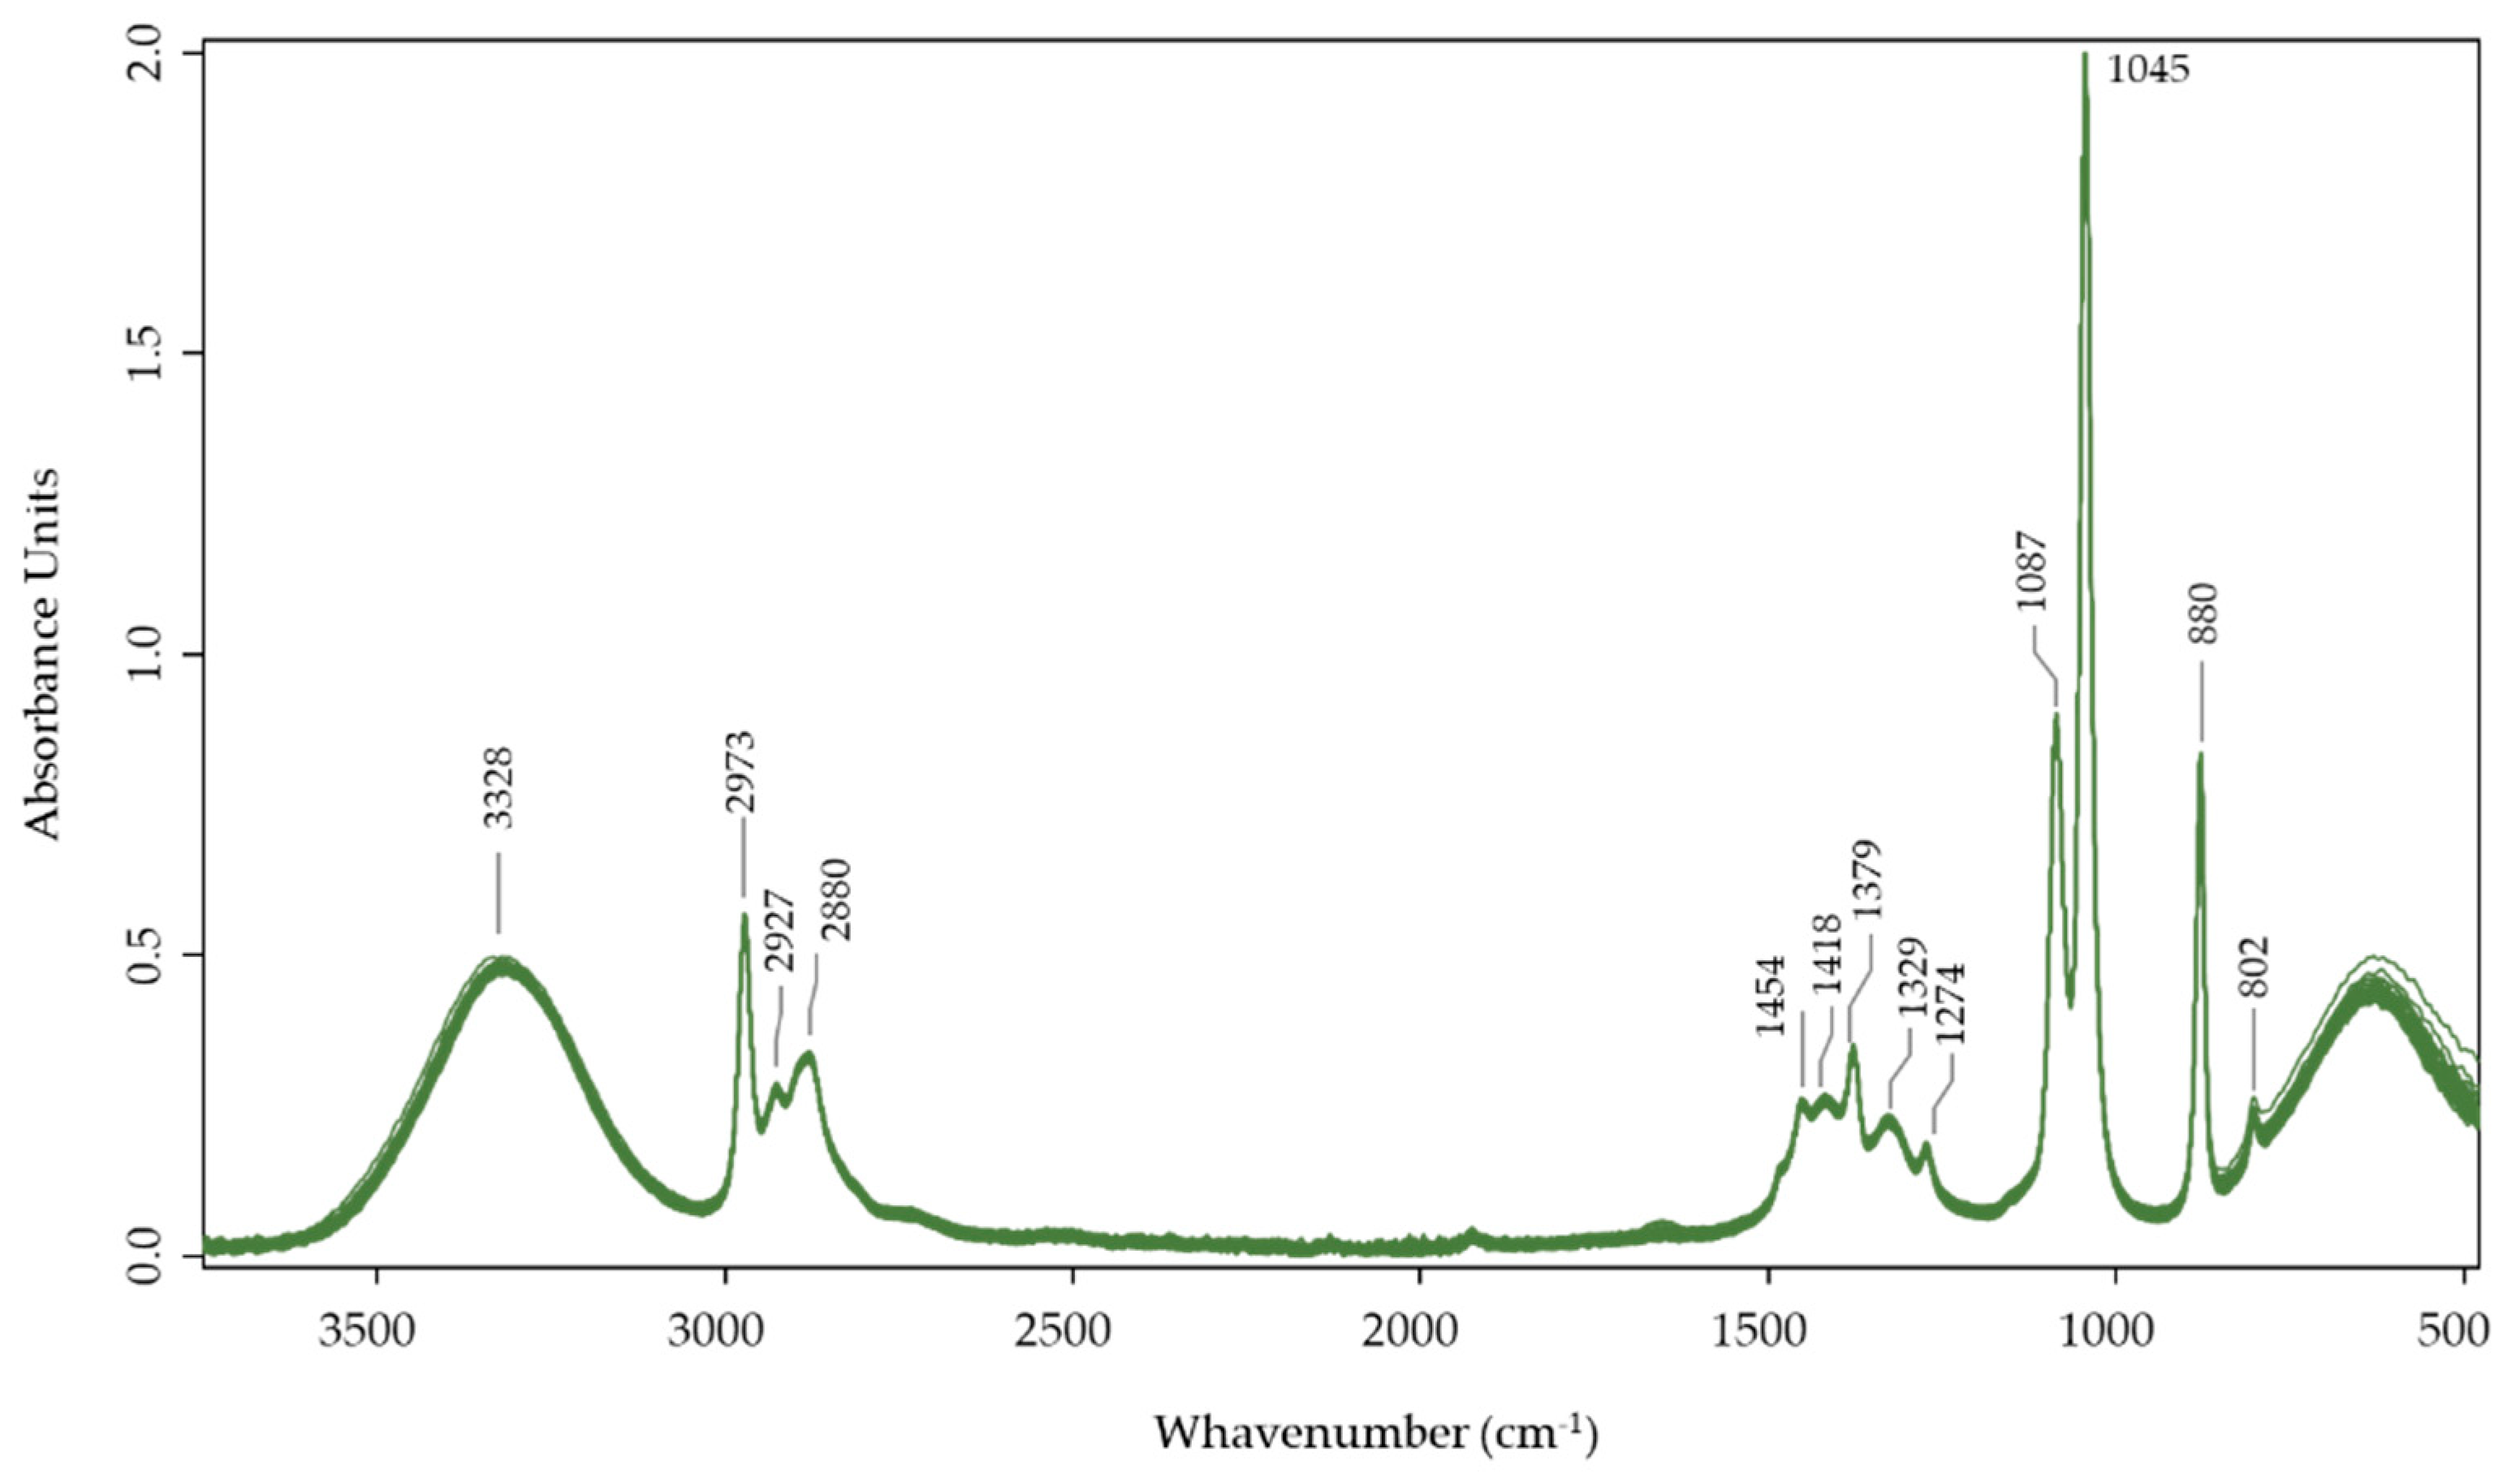
2.3. FTIR-ATR Spectral Analysis

The spectra obtained with the ethanolic flowers’ extract (Figure 2) display the strong influence of the compounds in this matrix. These results are similar to those obtained for rosemary [43], Cucurbitaceae [44], and medicinal plant extracts [45].
The intense band at 3328 cm−1 was assigned by the stretching vibrations of -OH groups more highly influenced by water content in the samples. Still, a lower strength could also affect some alcohols, phenols, or peroxides.
The bands at 2973 cm−1, 2927 cm−1, and 2880 cm−1 are characteristics of C-H stretching vibrations mainly to -CH3 and -CH2 as well as aromatic groups present in some plant extracts and the ethanol present in the matrix. These peaks can also be related to the diterpene three-ring structure [44].
The band at 1454 cm−1, corresponding to the combination of bending vibration of -CH2 and the vibration of the COO– group in the flavanol and organic acids [46] and also related to -CH3 in acetyl groups and at 1418 cm−1, can be assigned by -CH2 and -OCH3 groups. The peak found at 1379 cm−1, and 1329 cm−1 can be related to C-H’s symmetric deformation vibrations in methoxy groups and phenolic hydroxyls [47].
The peak at 1274 cm−1 could be related to asymmetric stretching vibrations of the C-O-C linkages in phenolic ethers (C-O stretch) and esters of phenolic hydroxyls [43].
The strong bands at 1087 cm−1 and 1045 cm−1 are related to the primary alcohol, C-O stretch, and the secondary alcohol [48].
At 880 and 802 cm−1, it is possible to find the peaks associated with the C-C skeletal vibration and out-of-plane bending vibrations associated with some aromatic ring (aryl) group frequencies [48].
Figure 3 shows the PCA plot of the FTIR-ATR spectra obtained with all the samples. This non-supervised multivariate statistical analysis reveals that this technique is able to discriminate between flower raw materials based on their differences, among which their phenolic and flavonoid profile of the Acacia’s species and flowering stages have their impact. Similar results were found, but with FT-RAMAN, in a previous work [49]. The two first components can justify 84% of the variation being the first component capable of distinguishing between the two species.

3. Materials and Methods

3.1. Plant Material

The flowers of A. retinodes and A. mearnsii were harvested during two flowering stages (early flower—EF; and late flower—LF). They were collected in March 2021 in the Lisbon region (A. retinodes at 38.747067; −9.274577 and A. mearnsii at 38.713910, −9.192827). The flowers were freeze-dried and kept at −80 °C until extraction. Figure 4 shows an example of the different flowering stages.

3.2. Chemicals and Reagents

Purified water was obtained using the Milli-Qplus185 system (Millipore, Billerica, MA, USA). LC–MS grade solvents and formic acid (MS quality) from Fisher Chemical were used (Waltham, MA, USA). Standards of chlorogenic acid (5-O-caffeoylquinic acid), epicatechin, kaempferol, myricitrin, myricetin, cyanidin-3-O-glucoside, and quercetin-3-O-glucoside were obtained from Extrasynthesis Phytochemicals (Genay Cedex, France), and catechol and 4-Hydroxybenzoic acid were obtained from Alfa Aesar (Kandel, Germany). The remaining standards (all >99.5%) and reagents were obtained from Sigma-Aldrich (St. Louis, MO, USA). Standard stock solutions were prepared in methanol (10 mg/L) and also diluted with methanol to obtain working standard solutions.

3.3. Extraction Conditions

According to the procedure previously described, the energized dispersive guided extraction (EDGE) equipment was used for extraction [25].
The flower samples were ground in a hammer mill with a 1 mm mesh in the first step. After that, 1 g of powder sample underwent three successive extraction cycles using 20 mL of ethanol for 10 min at 40 °C in each cycle. The crude material of each sample was weighed directly into a Q-Cup containing a sandwich of tree Q-Discs composed of one fibreglass filter surrounded by two cellulose filters.
All extractions were performed in duplicate, and all subsequent measurements and analyses were performed in triplicate.

3.4. Determination of Total Phenolic and Flavonoid Contents

Total phenolic content (TPC) was determined by the Folin–Ciocalteu colorimetric method [50], using gallic acid as a standard. The ethanolic solution of each extract or standard (50 µL) was mixed with 450 µL of distilled water. Then, 2.5 mL of Folin–Ciocalteu reagent (0.2 N) was added, leaving the mixtures for 5 min before adding 2 mL of aqueous Na2CO3 (75 g/L). The reaction mixtures were incubated for 90 min at 30 °C. Total phenols were determined by colourimetry at 765 nm.
The calibration curve was prepared using gallic acid standard solutions with concentrations between 0.016 and 3.2 mg/L (y = 0.2249 x; R2 = 0.9973). TPC was expressed as gallic acid equivalents (mg GAE/g extract).
The total flavonoids content (TFC) was determined by the aluminium chloride colorimetric method according to Luís et al. [51].
Each ethanolic solution of the extracts (500 μL) was mixed with methanol (1.5 mL), 10% aluminium chloride (0.1 mL), 1 M potassium acetate (0.1 mL), and distilled water (2.8 mL). This solution was left in the dark at room temperature for 30 min, and the absorbance of the reaction mixture was measured at 415 nm using a spectrophotometer. The calibration curve was performed by preparing eight quercetin solutions at concentrations between 2.5 and 12.5 mg/L in methanol (y = 0.0557 x; R2 = 0.9925). TFC was expressed as quercetin equivalents (mg QE/g extract).

3.5. UHPLC/ESI-QTOF-MS Analysis

The secondary metabolites present in the flower samples were identified using a methodology previously developed at the Center of Metabolomics and Bioanalysis (CEMBIO) by UHPLC/ESI-QTOF-MS [34]. Briefly, 500 μL of methanol was added to an extract obtained from lyophilized flowers (1 g). The mixture was vortexed for 2 min, sonicated for 15 min, and centrifuged at 10,000× g for 10 min at 4 °C. The supernatant was transferred to a Chromacol vial (Thermo Fisher Scientific, Madrid, Spain) for LC/MS analysis. The procedure was performed in duplicate. The samples were analysed on a 1290 Infinity series UHPLC system equipped with an electrospray ionization source (ESI) with Jet Stream technology coupled to a 6545 iFunnel QTOF/MS system (Agilent Technologies, Waldbronn, Germany).
The separation was performed in a RP column Zorbax Eclipse XDB-C18 (4.6 × 50 mm, 1.8 µm) (Agilent Technologies) maintained at 40 °C. The flow rate was 0.5 mL/min with a mobile phase consisting of solvent A: 0.1% formic acid in water and solvent B: methanol. The elution was carried out in gradient mode and included 2% B (0–6 min), 2–50% B (6–10 min), 50–95% B (11–18 min), and 95% B for 2 min (18–20 min) and was returned to starting conditions 2% B in one minute (20–21 min) to finally keep the re-equilibration, with a total analysis time of 25 min. The injection volume was 2 μL. The detector was operated in full scan mode (m/z 50 to 1500) at a scan rate of 1 scan/s in positive and negative ESI mode. MS/MS information was acquired in the automatic mode (Auto MS-MS scan mode at 30 eV of collision energy).
Accurate mass measurement was assured through an automated calibrator delivery system that continuously introduced a reference solution containing masses of m/z 121.0509 (protonated purine) and m/z 922.0098 (protonated HP-921) in positive ESI mode, whereas m/z 119.0363 (abstracted proton purine) and m/z 966.0007 (formate adduct of HP-921) were in negative ESI mode. The capillary voltage was ± 4000 V for negative and positive ionization mode. The source temperature was 225 °C. The nebulizer and gas flow rate were 35 psig and 11 L/min, respectively, with a fragmentor voltage to 75 V and a radiofrequency voltage in the octopole (OCT RF Vpp) of 750 V.
The MassHunter Workstation Software LC/MS Data Acquisition Version B.07.00 (Agilent Technologies) was used for control and data acquisition. LC-QTOF-MS data processing was performed in MassHunter Qualitative Analysis (Agilent Technologies) Software version B.08.00.

3.6. HPLC Analysis

A high-performance liquid chromatography (HPLC) system with a binary pump coupled to a diode array detector (DAD) from Agilent Technologies (Soquimica, Lisboa, Portugal) was used to analyse the phenolic compounds. The dried samples were dissolved in 500 µL of absolute ethanol and then filtered (0.22 µm) before being transferred to the autosampler for injection into the HPLC-DAD system.
Compounds except rutin and myricitrin were separated with a YMC-Triart PFP column (5 μm, 4.6 × 150 mm i.d.), with pre-column maintained at 35 °C. A gradient mode phase system consisting of eluent A: acetonitrile and eluent B: 0.1% trifluoroacetic acid in water was used. Separation was achieved with a linear gradient program as follows: 10% A (0–3 min), 10–15% A (3–15 min), 15% A (15–20 min), 15–18% A (20–25 min), 18–30% A (25–40 min), 30–50% A (40–45 min), 50–100% A (45–50 min), after which it returned to the initial conditions, 10% A (50–55 min). The flow rate was 1 mL/min−1. The temperature of the sampler was set at 4 °C, and the injection volume was 50 µL. The analytes were detected between 255 and 360 nm.
Concerning the separation of rutin and myricitrin, the mobile phase was composed of (A) 0% acetonitrile and (B) 100% orthophosphoric acid. Separation was achieved with a linear gradient program, as follows: 0% A (0 to 2 min), 9% A (2 to 14 min), 13% A (14 to 22 min), 33% A (22 to 38 min), 43% A (38 to 44 min), kept to 43% A (44 to 55 min), after which it returned to the initial conditions, 0% A (55 to 65 min). The flow rate was 0.8 mL/min−1. The temperature of the column and sampler were set at 24 °C and 4 °C, respectively, and the injection volume was 50 µL. The analytes were detected between 255 and 360 nm.

3.7. FTIR-ATR Spectral Analysis

Spectra were acquired by the FTIR-ATR (Fourier transform infrared spectroscopic) method with a Bruker spectrometer (Alpha, Bruker Optics GmbH, Ettlingen, Germany) using a diamond crystal. Four spectra per sample were obtained with 16 scans per spectrum, with a spectral resolution of 4 cm−1 in the range 4000 to 450 cm−1. The background was performed after scanning a sequence of eight samples.

3.8. Statistical Analysis

An analysis of variance (ANOVA) was conducted to estimate how the mean of the quantitative variable changes according to the levels of the categorical variables. Based on the results of the ANOVA, an estimate of the percentage of variances of each was made. The LSD test was applied to determine whether individual means differed. A heat map was also performed, representing values for the main variable of interest across two axis variables as a cluster effect. For ANOVA and heat map software, STATISTICA 7 (StatSoft. Inc. United States, USA) was used; for spectral data analysis and principal component analysis (PCA) OPUS®, version: 7.5.18 (Bruker Optics, Ettlingen, Germany) and UnscramblerX 10.5 (CAMO, Oslo, Norway) were used.

4. Conclusions

The present work shows that A. mearnsii and A. retinodes could be good sources of phenolic compounds, with extracts of the two species presenting significantly different compositions.
It is possible to conclude that gallic acid, syringaldehyde, and caffeic acid appear in the same quantity in A. retinodes and A. mearnsii in both flowering stages. Some compounds, namely furfural, 4-Hydroxybenzoic acid, chlorogenic acid, 4-hydroxybenzaldehyde, myricitrin, rutin, kaempferol, and myricetin, appear only in A. retinodes while (+)-catechin and coniferaldehyde were only quantifiable in A. mearnsii flowers. For the compounds present only in A. retinodes, almost all presented statistical differences between flowering stages. Compounds common to both species, such as vanillin, p-coumaric acid, trans-cinnamic acid, 5-methyfurfural, quercetin, 4′,5,7-trihydroxyflavanone, catechol, and (-)-epicatechin, were generically found in higher concentrations in A. mearnsii flowers. The compounds 5-methyfurfural, quercetin, catechol, and (-)-epicatechin showed significant variability regarding flowering stage. The phenolic compounds present in the Acacia flowers might be interesting, with the potential to harvest them at preliminary flowering stages being another tool to improve the control and dissemination of these invasive alien species.
It was possible to identify the potentiality of FTIR-ATR to distinguish between the different flower extracts, given their chemical composition.
The information regarding the flowers of these species is scarce, so we believe that more studies are needed to assess their potential application and value-added products.

Supplementary Materials

The following supporting information can be downloaded at: https://www.mdpi.com/article/10.3390/plants11111442/s1, Table S1. Data validation (analysis by HPLC/DAD). Table S2. Data validation (analysis by UHPLC/ESI-QTOF-MS). Figure S1. Representative Base Peak Chromatogram (BPC) profile (negative and positive ion mode) from the extract of A. maernsii. The m/z values for the most abundant compounds are given. Figure S2. Representative Base Peak Chromatogram (BPC) profile (negative and positive ion mode) from the extract of A. retinodes. The m/z values for the most abundant compounds are given.

Author Contributions

Conceptualization, S.I.P., O.A. and E.G.; methodology, S.I.P., O.A., E.G. and A.G. (Antonia García); validation, S.I.P., O.A. and E.G.; formal analysis, S.I.P., T.R., A.G. (Ana Gradillas) and V.A.-H.; resources, O.A., E.G. and J.G.; writing—original draft preparation, S.I.P., O.A., E.G., D.N. and C.B.; writing—review and editing, S.I.P., D.N., A.G. (Antonia García), E.G., J.G. and O.A.; supervision, O.A. and E.G.; funding acquisition, O.A., E.G. and J.G.; All authors have read and agreed to the published version of the manuscript.

Funding

This research was funded by project PCIF/GVB/0145/2018 (Acacia4fireprev).

Institutional Review Board Statement

Not applicable.

Informed Consent Statement

Not applicable.

Data Availability Statement

Not applicable.

Acknowledgments

This work is also funded by National Funds through the FCT—Foundation for Science and Technology under the Projects UIDB/00239/2020 (CEF), UIDB/50027/2020 (CEABN), UIDB/00709/2020, and UIDP/00709/2020 (CICS-UBI) and by Comunidad de Madrid (Ref. S2017/BMD3684 MOIR-2).

Conflicts of Interest

The authors declare no conflict of interest.

References

  1. Khoddami, A.; Wilkes, M.A.; Roberts, T.H. Techniques for Analysis of Plant Phenolic Compounds. Molecules 2013, 18, 2328–2375. [Google Scholar] [CrossRef] [PubMed]
  2. Rempe, C.S.; Burris, K.P.; Lenaghan, S.C.; Stewart, C.N., Jr. The Potential of Systems Biology to Discover Antibacterial Mechanisms of Plant Phenolics. Front. Microbiol. 2017, 8, 422. [Google Scholar] [CrossRef] [PubMed] [Green Version]
  3. Seigler, D. Phytochemistry of Acacia—Sensu lato. Biochem. Syst. Ecol. 2003, 31, 845–873. [Google Scholar] [CrossRef]
  4. Dai, J.; Mumper, R.J. Plant Phenolics: Extraction, Analysis and Their Antioxidant and Anticancer Properties. Molecules 2010, 15, 7313–7352. [Google Scholar] [CrossRef]
  5. El-Hefny, M.; Ashmawy, N.A.; Salem, M.Z.M.; Salem, A.Z.M. Antibacterial activities of the phytochemicals-characterized extracts of Callistemon viminalis, Eucalyptus camaldulensis and Conyza dioscoridis against the growth of some phytopathogenic bacteria. Microb. Pathog. 2017, 113, 348–356. [Google Scholar] [CrossRef]
  6. Ashmawy, N.A.; Salem, M.Z.M.; EL-Hefny, M.; Abd El-Kareem, M.S.M.; El-Shanhorey, N.A.; Mohamed, A.A.; Salem, A.Z.M. Antibacterial activity of the bioactive compounds identified in three woody plants against some pathogenic bacteria. Microb. Pathog. 2018, 121, 331–340. [Google Scholar] [CrossRef]
  7. Salem, M.Z.M.; El-Hefny, M.; Ali, H.M.; Elansary, H.O.; Nasser, R.A.; El-Settawy, A.A.A.; El Shanhorey, N.; Ashmawy, N.A.; Salem, A.Z.M. Antibacterial activity of extracted bioactive molecules of Schinus terebinthifolius ripened fruits against some pathogenic bacteria. Microb. Pathog. 2018, 120, 119–127. [Google Scholar] [CrossRef]
  8. Neiva, D.M.; Luís, Â.; Gominho, J.; Domingues, F.; Duarte, A.P.; Pereira, H. Bark residues valorization potential regarding antioxidant and antimicrobial extracts. Wood Sci. Technol. 2020, 54, 559–585. [Google Scholar] [CrossRef]
  9. Souza-Alonso, P.; González, L.; Cavaleiro, C. Ambient has become strained. Identification of Acacia dealbata Link volatiles interfering with germination and early growth of native species. J. Chem. Ecol. 2014, 40, 1051–1061. [Google Scholar] [CrossRef]
  10. Souto, X.C.; Bolaño, J.C.; González, L.; Reigosa, M.J. Allelopathic Effects of Tree Species on Some Soil Microbial Populations and Herbaceous Plants. Biol. Plant. 2001, 44, 269–275. [Google Scholar] [CrossRef]
  11. Correia, R.; Quintela, J.C.; Duarte, M.P.; Gonçalves, M. Insights for the valorization of biomass from portuguese invasive Acacia spp. in a biorefinery perspective. Forests 2020, 11, 1342. [Google Scholar] [CrossRef]
  12. WFO The World Flora Online. Available online: http://www.worldfloraonline.org/taxon/wfo-0000203882 (accessed on 19 January 2022).
  13. Roskov, Y.R.; Bisby, F.A.; Zarucchi, J.L.; Schrire, B.D.; White, R.J. International Legume Database and Information Service (ILDIS). Available online: https://ildis.org/cgi-bin/Araneus.pl?version~10.01&LegumeWeb&tno~313&genus~Acacia&species~mearnsii (accessed on 25 January 2022).
  14. Stevens, P.F. Angiosperm Phylogeny Website, Version 14. Available online: http://www.mobot.org/MOBOT/research/APweb/ (accessed on 25 January 2022).
  15. Missouri Botanical Garden Tropics, Botanical Information System. Available online: http://www.tropicos.org/Name/13037485 (accessed on 25 January 2022).
  16. POWO Plants of the World Online. Available online: http://www.plantsoftheworldonline.org/ (accessed on 19 January 2022).
  17. Western Australian Herbarium; Species Gallery, Acacia mearnsii De Wild., Pl. Bequaert. 3: 61 (1925). Available online: http://worldwidewattle.com/speciesgallery/species-intro.php?id=17958 (accessed on 25 January 2022).
  18. Xiong, J.; Grace, M.H.; Esposito, D.; Komarnytsky, S.; Wang, F.; Lila, M.A. Polyphenols isolated from Acacia mearnsii bark with anti-inflammatory and carbolytic enzyme inhibitory activities. Chin. J. Nat. Med. 2017, 15, 816–824. [Google Scholar] [CrossRef]
  19. O’Leary, M.C. Review of Acacia retinodes and closely related species, A. uncifolia and A. provincialis (Leguminosae: Mimosoideae: Sect. Phyllodineae). J. Adel. Bot. Gard. 2007, 21, 95–109. [Google Scholar]
  20. Ogawa, S.; Yazaki, Y. Tannins from Acacia mearnsii De Wild. Bark: Tannin Determination and Biological Activities. Molecules 2018, 23, 837. [Google Scholar] [CrossRef] [PubMed] [Green Version]
  21. Llompart, M.; Celeiro, M.; Dagnac, T. Microwave-assisted extraction of pharmaceuticals, personal care products and industrial contaminants in the environment. TrAC-Trends Anal. Chem. 2019, 116, 136–150. [Google Scholar] [CrossRef]
  22. Flórez-Fernández, N.; Torres, M.D.; González-Muñoz, M.J.; Domínguez, H. Potential of intensification techniques for the extraction and depolymerization of fucoidan. Algal Res. 2018, 30, 128–148. [Google Scholar] [CrossRef]
  23. Milena, V.; Tatjana, M.; Gökhan, Z.; Ivana, B.; Aleksandra, C.; Mohammad, M.F.; Marija, R. Advantages of contemporary extraction techniques for the extraction of bioactive constituents from black elderberry (Sambucus nigra L.) flowers. Ind. Crops Prod. 2019, 136, 93–101. [Google Scholar] [CrossRef]
  24. Sinan, K.I.; Saftić, L.; Peršurić, Ž.; Pavelić, S.K.; Etienne, O.K.; Picot-Allain, M.C.N.; Mahomoodally, M.F.; Zengin, G. A comparative study of the chemical composition, biological and multivariate analysis of Crotalaria retusa L. stem barks, fruits, and flowers obtained via different extraction protocols. South African J. Bot. 2020, 128, 101–108. [Google Scholar] [CrossRef]
  25. Pedro, S.I.; Gallardo, E.; Rosado, T.; Simão, A.A.; Gominho, J.A.O. Extraction of phenolic compounds from Acacia flower by Energized Dispersive Guided Extraction. In Proceedings of the ST 2021: 5th International Caparica Christmas Conference on Sample Treatment, Caparica, Portugal, 15–18 November 2021; Capelo-Martinez, J.L., Ed.; PROTEOMASS Scientific Society: Caparica, Portugal, 2021; p. 92. [Google Scholar]
  26. Olajuyigbe, O.O.; Afolayan, A.J. Phytochemical assessment and antioxidant activities of alcoholic and aqueous extracts of Acacia mearnsii de wild. Int. J. Pharmacol. 2011, 7, 856–861. [Google Scholar] [CrossRef] [Green Version]
  27. Rababah, T.M.; Ereifej, K.I.; Esoh, R.B.; Al-U’Datt, M.H.; Alrababah, M.A.; Yang, W. Antioxidant activities, total phenolics and HPLC analyses of the phenolic compounds of extracts from common Mediterranean plants. Nat. Prod. Res. 2011, 25, 596–605. [Google Scholar] [CrossRef]
  28. Ferretti, G.; Bacchetti, T.; Belleggia, A.; Neri, D. Cherry antioxidants: From farm to table. Molecules 2010, 15, 6993–7005. [Google Scholar] [CrossRef] [PubMed]
  29. Haminiuk, C.W.I.; Maciel, G.M.; Plata-Oviedo, M.S.V.; Peralta, R.M. Phenolic compounds in fruits-an overview. Int. J. Food Sci. Technol. 2012, 47, 2023–2044. [Google Scholar] [CrossRef]
  30. Stasiuk, M.; Kozubek, A. Biological activity of phenolic lipids. Cell. Mol. Life Sci. 2010, 67, 841–860. [Google Scholar] [CrossRef] [PubMed]
  31. Cushnie, T.P.T.; Lamb, A.J. Antimicrobial activity of flavonoids. Int. J. Antimicrob. Agents 2005, 26, 343–356. [Google Scholar] [CrossRef] [PubMed]
  32. De Andrade, C.A.; Costa, C.K.; Bora, K.; Miguel, M.D.; Miguel, O.G.; Kerber, V.A. Determinação do conteúdo fenólico e avaliação da atividade antioxidante de Acacia podalyriifolia A. Cunn. ex G. Don, Leguminosae-mimosoideae. Rev. Bras. de Farm. 2007, 17, 231–235. [Google Scholar] [CrossRef]
  33. Wu, J.-H.; Tung, Y.-T.; Wang, S.-Y.; Shyur, L.-F.; Kuo, Y.-H.; Chang, S.-T. Phenolic Antioxidants from the Heartwood of Acacia confusa. J. Agric. Food Chem. 2005, 53, 5917–5921. [Google Scholar] [CrossRef] [PubMed]
  34. Simão, A.Y.; Gonçalves, J.; Gradillas, A.; García, A.; Restolho, J.; Fernández, N.; Rodilla, J.M.; Barroso, M.; Duarte, A.P.; Cristóvão, A.C.; et al. Evaluation of the Cytotoxicity of Ayahuasca Beverages. Molecules 2020, 25, 5594. [Google Scholar] [CrossRef] [PubMed]
  35. Gonçalves, J.; Luís, Â.; Gradillas, A.; García, A.; Restolho, J.; Fernández, N.; Domingues, F.; Gallardo, E.; Duarte, A.P. Ayahuasca beverages: Phytochemical analysis and biological properties. Antibiotics 2020, 9, 731. [Google Scholar] [CrossRef] [PubMed]
  36. Santos, E.S.; Luís, Â.; Gonçalves, J.; Rosado, T.; Pereira, L.; Gallardo, E.; Duarte, A.P. Julbernardia paniculata and Pterocarpus angolensis: From ethnobotanical surveys to phytochemical characterization and bioactivities evaluation. Molecules 2020, 25, 1828. [Google Scholar] [CrossRef] [PubMed]
  37. Gonçalves, J.; Ramos, R.; Rosado, T.; Gallardo, E.; Duarte, A.P. Development and validation of a HPLC–DAD method for quantification of phenolic compounds in different sweet cherry cultivars. SN Appl. Sci. 2019, 1, 954. [Google Scholar] [CrossRef] [Green Version]
  38. Caramelo, D.; Pedro, S.I.; Marques, H.; Simão, A.Y.; Rosado, T.; Barroca, C.; Gominho, J.; Anjos, O.; Gallardo, E. Insights into the bioactivities and chemical analysis of Ailanthus Altissima (Mill.) swingle. Appl. Sci. 2021, 11, 11331. [Google Scholar] [CrossRef]
  39. Gonçalves, J.; Ramos, R.; Luís, Â.; Rocha, S.; Rosado, T.; Gallardo, E.; Duarte, A.P. Assessment of the Bioaccessibility and Bioavailability of the Phenolic Compounds of Prunus avium L. by in Vitro Digestion and Cell Model. ACS Omega 2019, 4, 7605–7613. [Google Scholar] [CrossRef] [Green Version]
  40. FooDB. Available online: www.foodb.ca (accessed on 2 February 2022).
  41. CEU Mass Mediator. Available online: http://ceumass.eps.uspceu.es/mediator (accessed on 2 February 2022).
  42. Toddenroth, D.; Ganslandt, T.; Castellanos, I.; Prokosch, H.U.; Bürkle, T. Employing heat maps to mine associations in structured routine care data. Artif. Intell. Med. 2014, 60, 79–88. [Google Scholar] [CrossRef] [PubMed]
  43. Agatonovic-Kustrin, S.; Balyklova, K.S.; Gegechkori, V.; Morton, D.W. HPTLC and ATR/FTIR Characterization of Antioxidants in Different Rosemary Extracts. Molecules 2021, 26, 6064. [Google Scholar] [CrossRef]
  44. Kukula-Koch, W.; Grzybek, M.; Strachecka, A.; Jaworska, A.; Ludwiczuk, A. ATR-FTIR-based fingerprinting of some Cucurbitaceae extracts: A preliminary study. Acta Soc. Bot. Pol. 2018, 87, 1–6. [Google Scholar] [CrossRef]
  45. Wulandari, L.; Retnaningtyas, Y.; Nuri; Lukman, H. Analysis of Flavonoid in Medicinal Plant Extract Using Infrared Spectroscopy and Chemometrics. J. Anal. Methods Chem. 2016, 2016, 4696803. [Google Scholar] [CrossRef] [Green Version]
  46. Paradkar, M.M.; Sakhamuri, S.; Irudayaraj, J. Comparison of FTIR, FT-Raman, and NIR Spectroscopy in a Maple Syrup Adulteration Study. J. Food Sci. 2002, 67, 2009–2015. [Google Scholar] [CrossRef]
  47. Izzo, F.C.; Zendri, E.; Bernardi, A.; Balliana, E.; Sgobbi, M. The study of pitch via gas chromatography–mass spectrometry and Fourier-transformed infrared spectroscopy: The case of the Roman amphoras from Monte Poro, Calabria (Italy). J. Archaeol. Sci. 2013, 40, 595–600. [Google Scholar] [CrossRef] [Green Version]
  48. Coates, J. Interpretation of Infrared Spectra, a Practical Approach. Encycl. Anal. Chem. 2000, 10815–10837. [Google Scholar] [CrossRef]
  49. Paula, V.; Pedro, S.I.; Campos, M.G.; Delgado, T.; Estevinho, L.M.; Anjos, O. Special Bioactivities of Phenolics from Acacia dealbata L. with Potential for Dementia, Diabetes and Antimicrobial Treatments. Appl. Sci. 2022, 12, 1022. [Google Scholar] [CrossRef]
  50. Luís, Â.; Sousa, S.; Duarte, A.P.; Pereira, L.; Domingues, F. Phytochemical characterization, and evaluation of rheological and antioxidant properties of commercially available juices of berries. J. Berry Res. 2018, 8, 11–23. [Google Scholar] [CrossRef]
  51. Luís, Â.; Domingues, F.; Duarte, A.P. Bioactive compounds, RP-HPLC analysis of phenolics, and antioxidant activity of some Portuguese shrub species extracts. Nat. Prod. Commun. 2011, 6, 1863–1872. [Google Scholar] [CrossRef] [PubMed] [Green Version]
Figure 1. Heat maps plotting clusters of contents of phenol compounds, TPC and TFC analysed by HPLC of the A. retinodes and A. mearnsii flowers with different flowering stages. TFC—Total phenolic compounds; Vanil—Vanillin; Coum—p-Coumaric acid; Triflav—4′,5,7-Trihydroxyflavanone; Gal—Gallic acid; Catin—(+)-Catechin; Cinn—trans-Cinnamic acid; Caff—Caffeic acid; Syring—Syringaldehyde; TPC—Total flavonoid content; Catol—Catechol; Benz—Hydroxybenzoic acid; Furf—Furfural; Epica—(-)-Epicatechin; 5-Mfurf—5-Methylfurfural; Myrci—Myricitrin; Myr—Myricetin; Conif—coniferaldehyde; Cloro—Chlorogenic; 4-Hben—4-Hydroxybenzaldehyde; Kaemp—Kaempherol; Rutin—Rutin; Querc—Quercetin; R_EF—A. retinodes early flower; R_LF—A. retinodes late flower; M_EF—A. mearnsii early flower; M_LF—A. mearnsii late flower.
Plants 11 01442 g001
Figure 2. FTIR-ATR spectrum for all Acacia flower samples.
Plants 11 01442 g002
Figure 3. Score plot of the first two principal components of the PCA performed with FTIR-ATR spectra of Acacia flower samples using the first derivative Savitzky–Golay spectra transform with 17 smoothing points. M_LF—A. mearnsii late flower; M_EF—A. mearnsii early flower; R_LF—A. retinodes late flower; R_EF—A. retinodes early flower.
Plants 11 01442 g003
Figure 4. Examples of different flowering stages used in this study.
Plants 11 01442 g004
Table 1. Total phenolic compounds and flavonoids content (TPC and TFC) (mean ± standard deviation) of A. retinodes and A. mearnsii flowers extracts with different flowering stages.
FSTPC (mg
GAE/g Extract)
TFC (mg
QE/g Extract)
A. retinodesEF311.24 ± 23.36 b136.47 ± 1.27 a
LF350.50 ± 13.79 b287.91 ± 14.28 b
A. mearnsiiEF310.55 ± 12.76 b317.97 ± 1.89 c
LF300.03 ± 2.36 a342.73 ± 4.32 d
Species (S)49.1 ***46.8 ***
Flowering stages (FS)n.s.25.9 ***
SxFSn.s.26.6 ***
Residual50.90.7
FS—flowering stages; EF—early flower; LF—late flower; TPC – total phenolic compounds; TFC—flavonoids content; n.s. for p > 0.05, *** p < 0.001; GAE—gallic acid equivalents; QE—quercetin equivalents. Means within the same column followed by different letters are significantly different (p < 0.05) according to the LSD Test.
Table 2. Detected compounds in A. retinodes and A. mearnsii flowers by UHPLC/ESI-QTOF-MS.
CompoundtR (min)m/z Experimental
Polyphenols Analysed in Negative Ionization Mode
Phenolic acids
Hydroxybenzoic acids
Gallic acid 3.0169.0142
Protocatechuic acid6.4153.0193
4-Hydroxybenzoic acid8.3137.0244
Gentisic acid8.3153.0193
Salicylic acid11.5137.0244
Hydroxy cinnamic acids
5-O-Chlorogenic acid8.9353.0878
Caffeic acid9.3179.0350
p-Coumaric acid10.4163.0400
Hydroxycoumarins
Aesculetin9.1177.0193
Flavonoids
Dihydrochalcones
Phlorizin11.3435.1296
Flavanones
Naringenin (aglycone)12.5271.0612
Flavones
Chrysin (aglycone)15.1253.0506
Flavonols
(+)-Catechin8.5289.0717
Quercetin-3-O-rhaminoside9.2447.0933
(-)-Epicatechin9.5289.0717
Quercetin-3-O-galactoside11.0463.0882
Quercetin-3-O-glucoside11.0463.0882
Quercetin-3-O-rutinoside11.0609.1461
Kaempferol 3-O-glucoside11.5447.0933
Kaempferol 3-O-rutinoside11.5593.1512
Quercetin (aglycone)12.0301.0354
Luteolin (aglycone)12.7285.0404
Kaempferol (aglycone)13.3285.0404
Other polyphenols
Catechol6.8109.0295
Polyphenols analysed in positive ionization mode
Anthocyanines
Delphinidin 3-O-rutinoside *9.1610.1539
Cyanidin-3-O-glucoside9.4449.1084
Delphinidin (aglycone)11.1304.0578
Peonidin 3-O-glucoside 18.4463.1240
* analyzed in ESI (-) mode; tR—retention time.
Table 3. The concentration of phenolic compounds (µg/g) in the ethanol extracts from A. retinodes and A. mearnsii flowers by HPLC-DAD using analytical standards and calibration curves (mean ± standard deviation).
CompoundtR (min)λmax (nm)A. retinodesA. mearnsii
EFLFEFLF
Simple phenolics
Catechol5.72804.53 ± 0.23 c6.20 ± 0.21 d2.50 ± 0.08 a3.64 ± 0.10 b
Hydroxybenzoic acids
Gallic acid3.12801.45 ± 0.15 a4.38 ± 1.27 a5.88 ± 3.35 a6.07 ± 1.06 a
4-Hydroxybenzoic acid9.82554.86 ± 0.63 a7.51 ± 0.38 b <LOQ ▪<LOQ ▪
Hydroxybenzoic aldehydes
4-Hydroxybenzaldehyde12.62804.80 ± 0.07 a7.50 ± 0.42 b<LOQ ▪▪<LOQ ▪▪
Vanillin 16.62807.55 ± 0.52 a31.8 ± 4.24 a194.93 ± 10.52 b310.71 ± 65.68 c
Syringaldehyde20.93221.51 ± 0.55 ab1.76 ± 0.70 ab2.45 ± 0.83 b0.36 ± 0.25 a
Hydroxycinnamic acids
Chlorogenic acid10.028065.84 ± 3.15 b12.16 ± 2.35 a<LOQ ▪▪<LOQ ▪▪
Caffeic acid12.93227.59 ± 1.16 b5.84 ± 0.89 ab6.92 ± 2.46 ab3.40 ± 0.34 a
p-Coumaric acid19.82910.74 ± 0.02 a1.45 ± 0.21 a11.94 ± 2.30 b10.35 ± 1.05 b
trans-Cinnamic acid33.52800.68 ± 0.06 a1.66 ± 0.09 a9.65 ± 3.30 b16.17 ± 3.91 b
Hydroxycinnamic aldehydes
Coniferaldehyde29.23220.44 ± 0.01 a0.43 ± 0.05 a<LOQ ▪▪<LOQ ▪▪
Furans
Furfural5.72.630.48 ± 0.03 a3.68 ± 0.99 b<LOQ ▪▪▪<LOQ ▪▪▪
5-Methylfurfural11.625542.99 ± 6.29 b219.71 ± 20.14 c1.71 ± 1.14 a15.09 ± 2.01 ab
Flavonoids
Flavanols
(+)-Catechin9.0280<LOQ ▪▪▪<LOQ ▪▪▪0.26 ± 0.12 a0.15 ± 0.01 a
(-)-Epicatechin10.62809.43 ± 0.82 c14.38 ± 0.70 d3.05 ± 0.08 a7.07 ± 0.43 b
Flavonols
Rutin31.92550.70 ± 0.04 a 4.31 ± 0.72 b<LOQ ▪▪<LOQ ▪▪
Myricitrin33.426339.49 ± 3.54 a70.39 ± 3.54 b<LOQ ▪▪<LOQ ▪▪
Myricetin34.53602.63 ± 0.10 a8.71 ± 0.09 b<LOQ ▪▪<LOQ ▪▪
Quercetin41.03601.11 ± 0.02 a5.54 ± 0.11 c0.94 ± 0.08 a2.78 ± 0.19 b
Kaempferol45.33607.62 ± 1.23 b2.32 ± 1.32 a<LOQ ▪▪<LOQ ▪▪
Flavones
4′,5,7-Trihydroxyflavanone43.52802.35 ± 0.20 a1.53 ± 0.42 a5.92 ± 0.98 b5.59 ± 0.53 b
tR—retention time; λmax—maximum wavelength; EF—Early flower; LF—late flower; LOQ—Limit of quantification. LOQ ▪ (4-Hydroxybenzoic acid) 3.13 µg/mL; LOQ ▪▪ (4-Hydroxybenzaldehyde; caffeic acid; chlorogenic acid; coniferaldehyde; kaempferol; myricetin; quercetin; myricitrin; rutin) 0.78 µg/mL; LOQ ▪▪▪ (furfural; (+)-catechin) 1.56 µg/mL; Means within the same row followed by different letters are significantly different (p < 0.05) according to the LSD Test.
Table 4. Variance percentages were obtained in a two-way ANOVA performed for all analysed compounds concerning Acacia flowers from two species and two flowering stages.
CompoundSpecie
(S)
Flowering Stages (FS)S × FSResidual
Appear in booth Acacia species
Gallic acidn.s.n.s.n.s.--
Vanillin89.1 ***7.2 *n.s.3.7
Syringaldehyden.s.n.s.n.s.--
Caffeic acidn.s.n.s.n.s.--
p-Coumaric acid96.9 ***n.s.n.s.0.6
trans-Cinnamic acid91.1 **n.s.n.s.8.9
5-Methyfurfural40.2 ***24.0 ***35.3 ***0.6
Quercetin14.0 ***64.2 ***21.6 ***0.2
4′,5,7-Trihydroxyflavanone95.2 ***n.s.n.s.4.8
Catechol71.9 ***27.0 ***1.0 ***0.1
(-)-Epicatechin69.8 ***29.6 ***0.3 ***0.2
Appear only in A. retinodes
Furfural 90.9 * 9.1
4-Hydroxybenzoic acid 99.9 *** 0.1
Chlorogenic acid 99.5 ** 0.5
4-Hydroxybenzaldehyde 97.5 * 2.5
Myricitrin 97.0 * 3.0
Rutin 100 *** 0.0
Kaempferol n.s. --
Myricetin 100 *** 0.0
Appear only in A. mearnsii
(+)-Catechin n.s. --
Coniferaldehyde n.s. --
n.s. for p > 0.05; * 0.01 < p < 0.05; ** 0.001 < p < 0.01; *** p < 0.001.
Table 5. Estimated concentration of phenolic compounds (µg/g) in the ethanol extracts from A. retinodes and A. mearnsii flowers by UHPLC/ESI-QTOF-MS (mean ± standard deviation).
CompoundA. retinodesA. mearnsii
EFLFEFLF
Analysed in Negative Ionization Mode
Aesculetin2.48 × 10−2 ± 3.36 × 10−40.014 ± 0.2 × 10−20.097 ± 0.2 × 10−30.014 ± 0.1 × 10⁻³
Chrysin (aglycone)7.65 × 10⁻⁵ ± 8.06 × 10−61.15 × 10−4 ± 1.02 × 10⁻⁵ 1.04 × 10⁻⁴ ± 1.61 × 10⁻⁶ 1.28 × 10⁻⁴ ± 8.90 × 10⁻⁷
Delphinidin 3-O-rutinoside 1.25 ± 0.102.46 ± 0.050.42 ± 0.0021.87 ± 0.03
Gentisic acid0.31 ± 0.3 × 10⁻² 0.32 ± 0.1 × 10⁻² 0.50 ± 0.020.50 ± 0.02
kaempferol (aglycone)11.18 ± 0.5132.93 ± 0.342.40 ± 0.011.94 ± 0.09
kaempferol 3-O-glucoside0.80 ± 0.021.47 ± 0.029.63 ± 0.489.43 ± 0.18
Luteolin (aglycone)0.95 ± 0.021.19 ± 0.0010.55 ± 0.020.52 ± 0.01
Naringenin (aglycone)0.72 ± 0.020.63 ± 0.041.14 ± 0.021.16 ± 0.03
Nicotiflorin0.03 ± 0.1 × 10⁻² 0.04 ± 0.3 × 10⁻² 0.01 ± 0.1 × 10⁻³ 0.52 × 10⁻² ± 0.7 × 10⁻²
Phlorizin49.70 ± 4.6556.09 ± 1.5137.43 ± 16.2840.98 ± 21.49
Protocatechuic acid0.02 ± 0.1 × 10⁻² 0.45 ± 0.020.06 ± 0.21 × 10⁻³ 0.04 ± 2.2 × 10⁻³
salicyclic acid0.05 ± 0.2 × 10⁻² 0.08 ± 0.2 × 10⁻² 0.45 x 10⁻²± 0.1 × 10⁻³ 0.04 ± 0.2 × 10⁻²
Quercetin (aglycone)2.08 ± 0.3211.59 ± 0.640.70 ± 0.0031.55 ± 0.01
Quercetin-3-O-glucoside + Quercetin-3-O-galactoside (sum of isomers)0.75 ± 0.024.21 ± 0.011.96 ± 0.013.59 ± 0.04
Quercetin-3-O-rhaminoside0.79 ± 0.0010.83 ± 0.1117.60 ± 0.7221.82 ± 0.62
Analysed in positive ionization mode
Chrysantheminndnd12.56 ± 1.3614.42 ± 0.29
Peonidin 3-O-glucoside 0.37 ± 0.010.83 ± 0.0020.49 ± 0.140.90 ± 0.09
Delphinidin 2.96 ± 0.0211.46 ± 0.174.68 ± 0.019.44 ± 0.44
EF—Early flower; LF—late flower; nd—not detected.
Table 6. Mass spectrum data and peak assignments for the most abundant compounds identified from the A. mearnsii and A. retinodes extracts, with annotation level MS/MS.
A. mearnsii Extracts
Monoisotopic MassAreatR (min)[M−H][M+H]+Tentative Annotation Annotation Level
(m/z) (m/z)
Hydroxycinnamic acid glycosides
326.22823.38 × 106 9.1325.0935327.1358p-coumaroyl hexoseMS/MS
356.24982.28 × 106 9.3355.104357.1155feruloyl hexoseMS/MS
Flavanones O-glycosides
434.38283.26 × 107 10.2/10.9/11.5/11.9433.115435.0927naringenin O-hexose isomersMS/MS
Flavonol O-glycosides
448.29443.11 × 106 11.6447.0943449.1090quercetin O-hexosideMS1
A. retinodes extracts
Monoisotopic massAreatR (min)[M−H][M+H]+Tentative annotationAnnotation level
(m/z)(m/z)
Hydroxycinnamic acid glycosides
326.22823.38 × 106 9.1325.0935327.1358p-coumaroyl hexoseMS/MS
356.24982.28 × 106 9.3355.104357.1155feruloyl hexoseMS/MS
Flavanones O-glycosides
434.38284.94 × 106 11.1/11.3/11.5433.115435.0927naringenin O-hexose isomersMS/MS
Flavonol O-glycosides
788.20219.94 × 105 9.7787.1949789.2089quercetin O-triglucosideMS1
642.14451.27 × 106 9.8641.1372643.1517myricetin O-dihexoside isomerMS1
626.14833.92 × 106 10.1/10.3625.1423627.1571quercetin O-dihexoside isomerMS1
480.09042.29 × 106 10.5479.0839481.0982myricetin O-hexoside isomerMS1
450.07982.50 × 106 10.8449.0703451.0879myricetin O-hexoside isomerMS1
464.09622.05 × 106 10.9/11.1463.0861465.1034quercetin O-hexoside isomerMS1
448.29443.11 × 106 11.6447.0943449.1090quercetin O-hexoside isomerMS1
318.03786.74 × 106 12.4317.0305319.0454myricetin (aglycone)MS/MS
302.04311.47 × 106 12.5301.0358303.0502quercetin (aglycone)MS/MS
Jasmonic acids
388.17421.39 × 1069.8387.17389.1811-hydroxyjasmonic acid glucosideMS1
Publisher’s Note: MDPI stays neutral with regard to jurisdictional claims in published maps and institutional affiliations.

