
Phylogeny and Expression Atlas of the NITRATE TRANSPORTER 1/PEPTIDE TRANSPORTER FAMILY in Agave
by
 , and
, and
Shibei Tan
1, 
Yanqiong Liang
1,
Yanlei Huang
2,
Jingen Xi
1,
Xing Huang
1,*,
Xiaohan Yang
3,* and
Kexian Yi
1,4,5,* 1
Environment and Plant Protection Institute, Chinese Academy of Tropical Agricultural Sciences, Haikou 571101, China
2
College of Plant Science and Technology, Huazhong Agricultural University, Wuhan 430070, China
3
Biosciences Division, Oak Ridge National Laboratory, Oak Ridge, TN 37831, USA
4
Key Laboratory of Integrated Pest Management on Tropical Crops, Ministry of Agriculture and Rural Affairs, Haikou 571101, China
5
Hainan Key Laboratory for Monitoring and Control of Tropical Agricultural Pests, Haikou 571101, China
*
Authors to whom correspondence should be addressed.
Plants 2022, 11(11), 1434; https://doi.org/10.3390/plants11111434
Submission received: 30 April 2022
/
Revised: 24 May 2022
/
Accepted: 26 May 2022
/
Published: 27 May 2022
(This article belongs to the Special Issue Germplasm Resources and Breeding of Agave)
Abstract
:Agave species are widely cultivated crassulacean acid metabolism (CAM) plants for alcoholic beverages, food and fiber production. Among these, the Agave hybrid H11648 ((A. amaniensis × A. angustifolia) × A. amaniensis) is the main cultivar for sisal fiber in the tropical areas of Brazil, China, and African countries. The plants of Agave hybrid H11648 have a long life cycle and large leaves, which require a huge amount of nitrogen nutrient. However, the molecular basis of nitrogen transport and allocation has not been well understood in agave. In this study, we identified 19 NITRATE TRANSPORTER 1/PEPTIDE TRANSPORTER FAMILY(NPF) genes (called AhNPFs) with full-length coding sequences in Agave hybrid H11648. Our analysis of gene expression in various types of tissues revealed the tissue-specific expression pattern of AhNPFs. We further examined their expression patterns at different leaf developmental stages, under abiotic/biotic stresses and nutrient deficiency. The results reveal several candidate regulators in the agave NPF family, including AhNPF4.3/5.2/7.1. We first characterized the NPF genes in agave based on published leaf transcriptome datasets and emphasized their potential functions. The study will benefit future studies related to nitrogen nutrient in agave.
1. Introduction
Nitrate is one of the major nitrogen resources for plant growth and development [1]. As one of the most important nitrate transporters, NITRATE TRANSPORTER 1/PEPTIDE TRANSPORTER FAMILY (NPF) has been well functionally characterized well in arabidopsis (Arabidopsis thaliana L.) [2]. The arabidopsis genome contains 53 NPF genes, which are clustered into eight clades. Among these, AtNPF1.1 (NRT1.12) and AtNPF1.2 (NRT1.11) mediate nitrate allocation to young leaves [3]. AtNPF2.3 contributes to nitrate translocation to shoots under salt stress [4]. AtNPF2.7 regulates nitrate efflux in roots under acidic conditions [5]. AtNPF2.9 (NRT1.9) plays important roles in the phloem loading of nitrate in roots [6]. AtNPF2.12 (NRT1.6) modulates nitrate transport to the embryo [7]. The phloem-expressed AtNPF2.13 (NRT1.7) is responsible for source-to-sink remobilization of nitrate [8]. AtNPF3.1 modulates nitrite accumulation in leaves [9]. AtNPF4.6 (NRT1.2/AIT1) controls nitrite uptake in roots [10]. AtNPF5.5 affects nitrogen accumulation in the embryo [11]. AtNPF5.11, together with AtNPF5.12 and AtNPF5.16, is involved in vacuolar nitrate efflux and reallocation [12]. AtNPF6.2 (NRT1.4) alters leaf development by nitrate storage in the petiole [13]. AtNPF6.3 (NRT1.1) regulates lateral root growth by nitrate-regulated auxin transport [14]. AtNPF7.2 (NRT1.8) functions in nitrate removal from the xylem sap [15]. AtNPF7.3 (NRT1.5) is related to root-to-shoot nitrate transport [16]. AtNPF8.1 (PTR1) and AtNPF8.2 (PTR5) transport dipeptides in root and pollen [17]. Additionally, several AtNPFs have the functions of transporting plant hormones, including auxin, abscisic acid and gibberellin [18]. In contrast, there are 93 NPF genes in the rice (Oryza sativa L.) genome with 7 of them having functions related to nitrate transport and allocation, including OsNPF2.2 (OsPTR2), OsNPF2.4, OsNPF6.5 (OsNRT1.3/NRT1.1B), OsNPF7.2, OsNPF7.3 (OsPTR6), OsNPF8.9 (OsNRT1) and OsNPF8.20 (OsPTR9) [2].
Agave species, which perform crassulacean acid metabolism (CAM) photosynthesis, are widely used for the production of alcoholic beverages, food and fiber [19]. Agave plants have great potential for producing bioenergy in arid and semi-arid regions, with a large nitrogen demand during the life cycle [20,21]. However, the molecular basis of nitrogen transport and allocation has not been well studied in agave [22]. In China, the most widely cultivated Agave species is Agave hybrid H11648 ((A. amaniensis × A. angustifolia) × A. amaniensis), with a main purpose of sisal fiber production [23]. It is of great importance to reveal the mechanism of nitrogen transport and allocation in the leaf, which is both a vegetative and harvestable organ. It is very challenging to sequence and assemble the large agave genomes [24]. Agave hybrid H11648 has been proved to have a high tolerance to heavy metals such as copper (Cu) and lead (Pb) [23]. Additionally, there are two main abiotic/biotic stresses during agave cultivation, including chill and zebra disease caused by Phytophthora nicotianae Breda [19]. Based on the published leaf transcriptome data of Agave H11648, we identified NPF genes in this agave species [25]. We also examined the expression profiles of AhNPFs at different leaf developmental stages, under abiotic/biotic stresses, and after nutrient deficiency treatments. Our findings will provide a guideline for characterizing the candidate functions of AhNPFs in leaf development and multi stress responses [26,27].
2. Results
2.1. Identification and Subcellular Localization of Agave NPF Genes
All arabidopsis and rice NPF genes were selected as query to search against asparagus (Asparagus officinalis L.) genome and agave transcriptome datasets [25,28,29]. Asparagus was selected as a reference due to its close phylogenetic relationship with Agave species [28]. As a result, 53 and 19 NPF genes were identified in asparagus and agave, respectively (Table 1, Table S1). In agave, the lengths of the coding sequences ranged from 1377-2400 bp, with predicted proteins of 458-799 aa. The molecular weights were from 50,193.55 to 89,795.73 and theoretical isoelectric points (pI) were from 5.77 to 9.29. All the agave NPF genes were predicted to be localized at the plasma membrane (Table 1). Additionally, these proteins contained at least six transmembrane helices at the N- or C-termini (Figure S1).
2.2. Phylogenetic Analysis of Agave NPF Genes
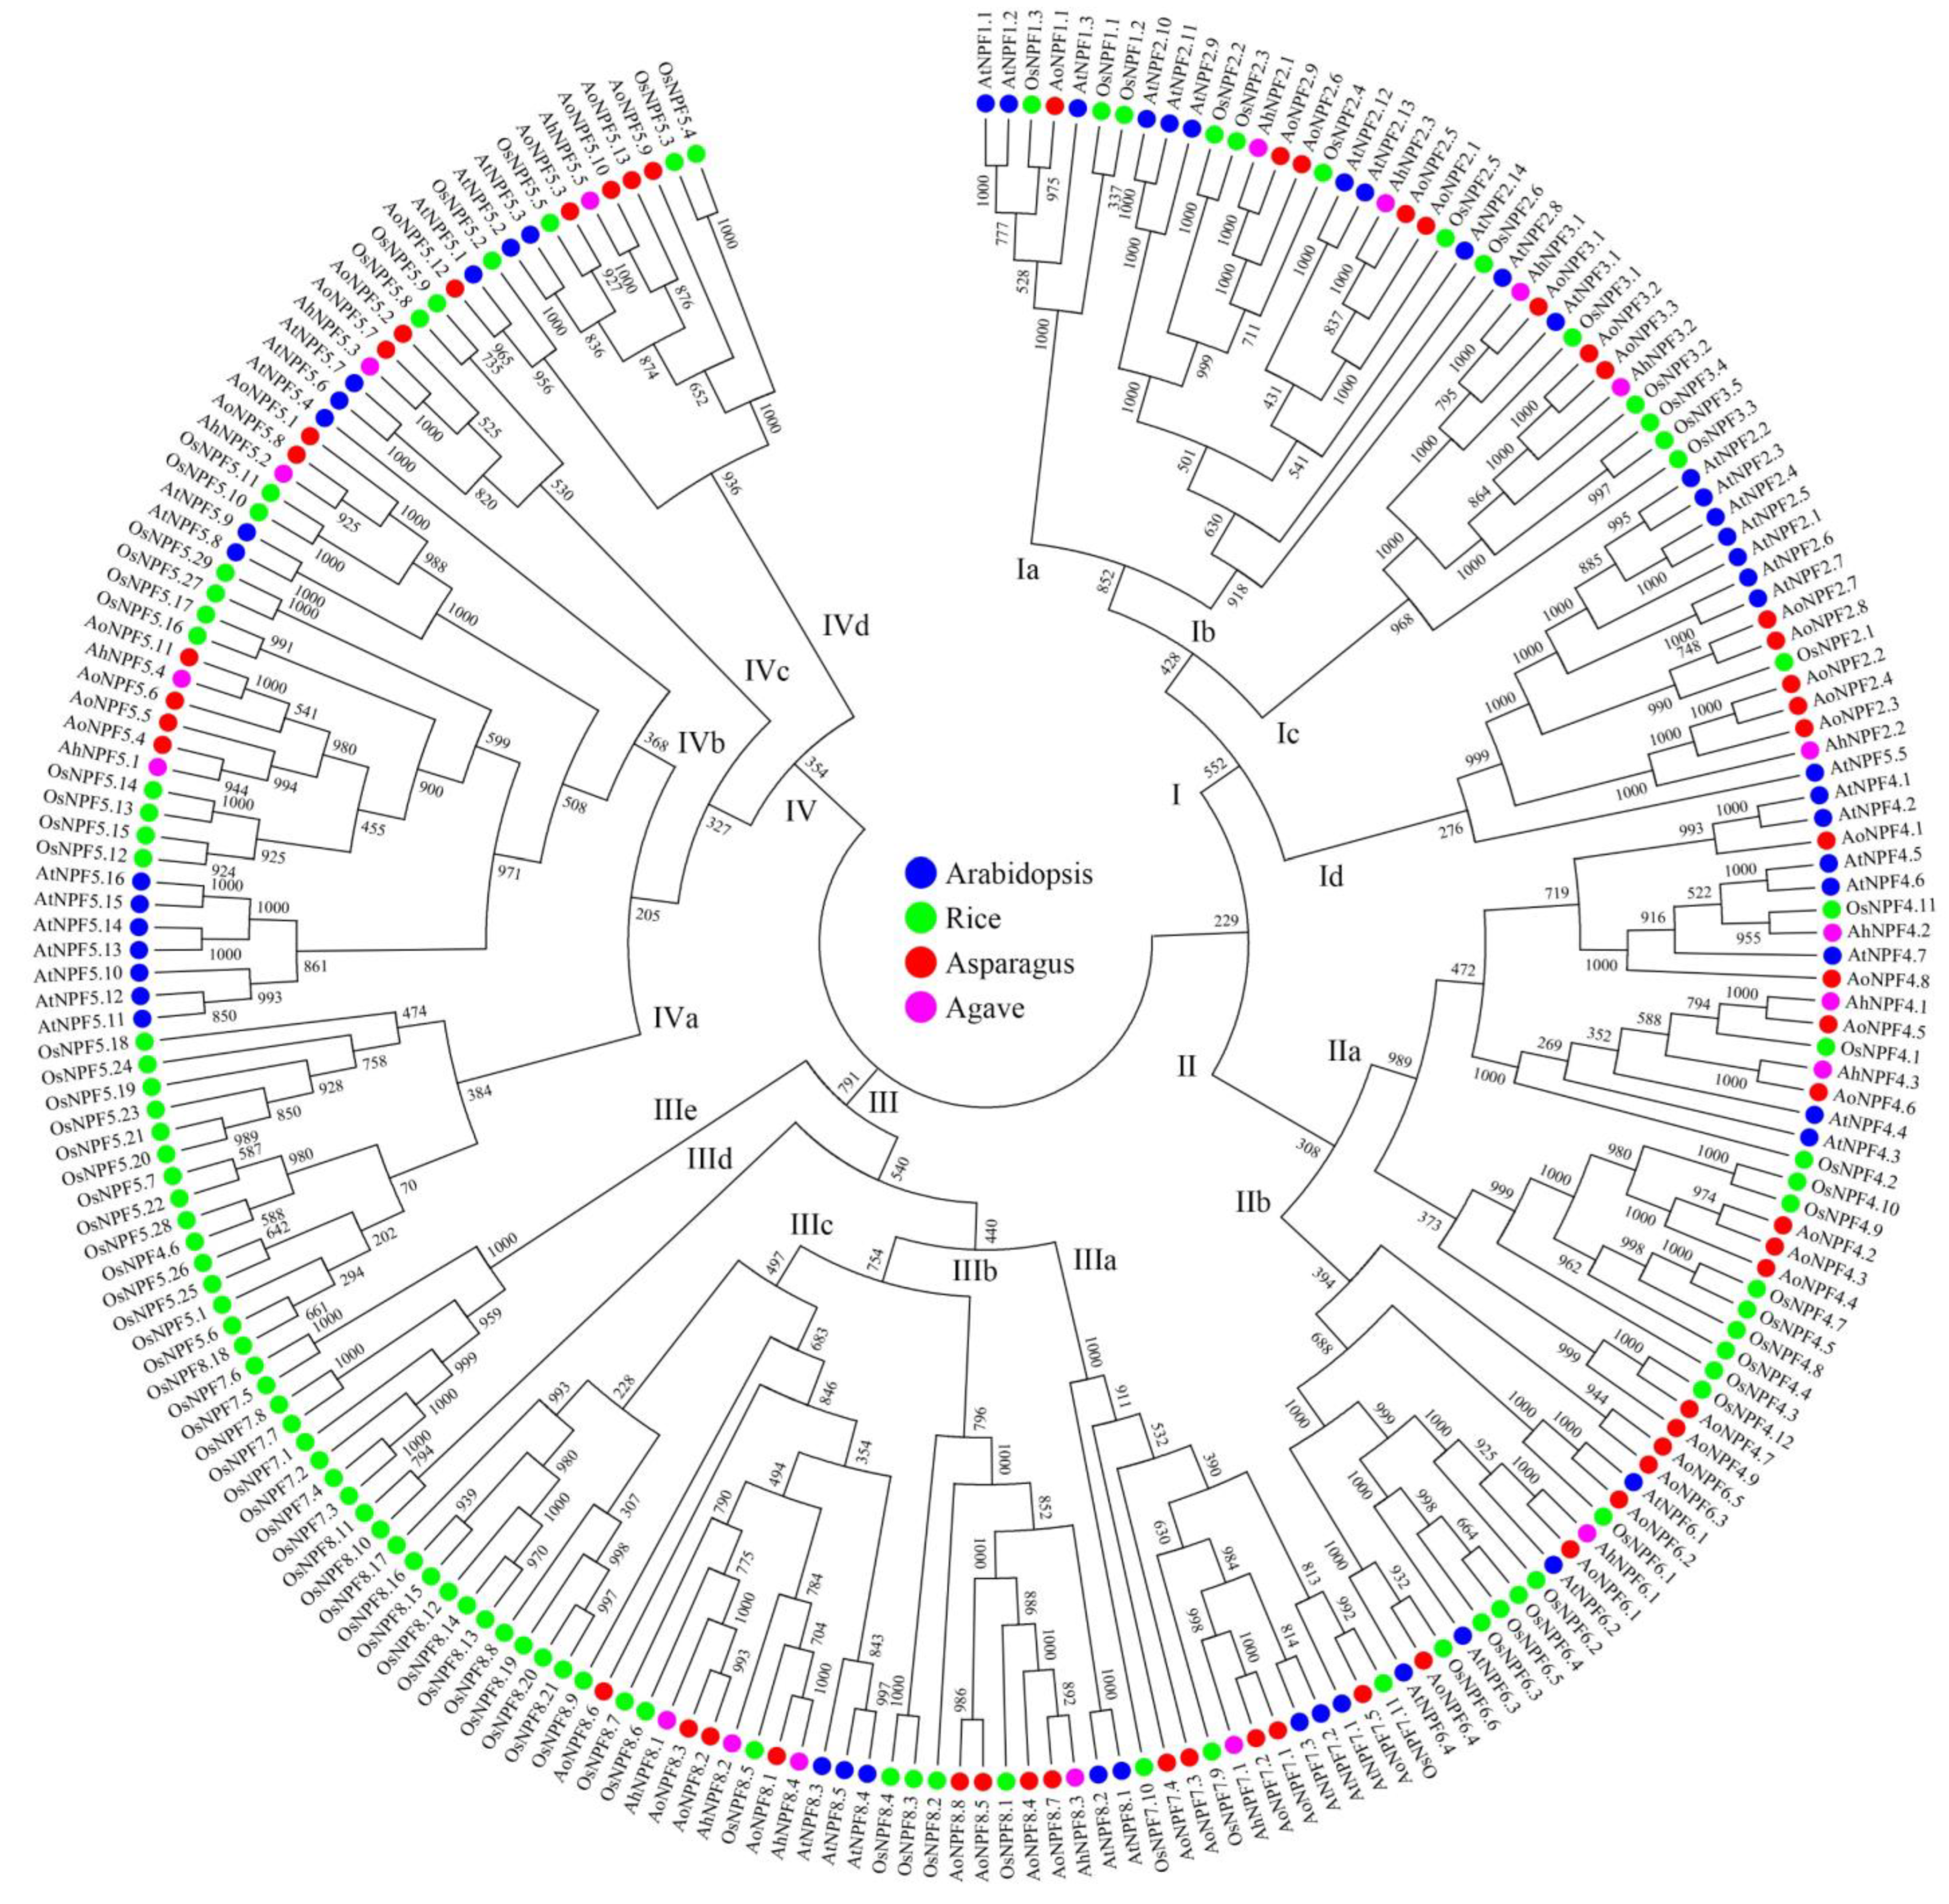
The NPF protein sequences of arabidopsis (53), rice (93), asparagus (53) and agave (19) were selected for phylogenetic analysis. These proteins were clustered into four groups (Figure 1). Group I was further divided into four subgroups, including one NPF1 subgroup, one NPF3 subgroup and two NPF2 subgroups. Group II was divided into two subgroups, containing NPF4 and NPF6 proteins, respectively. There were five subgroups in group III, including one NPF7 subgroup and four NPF8 groups. All NPF5 proteins were clustered into group IV except AtNPF5.5. There were also four subgroups containing only rice NPF proteins, including subgroups IIIb, IIIc, IIId and IVa.
2.3. Expression Profiles of AhNPFs in Different Agave Tissues
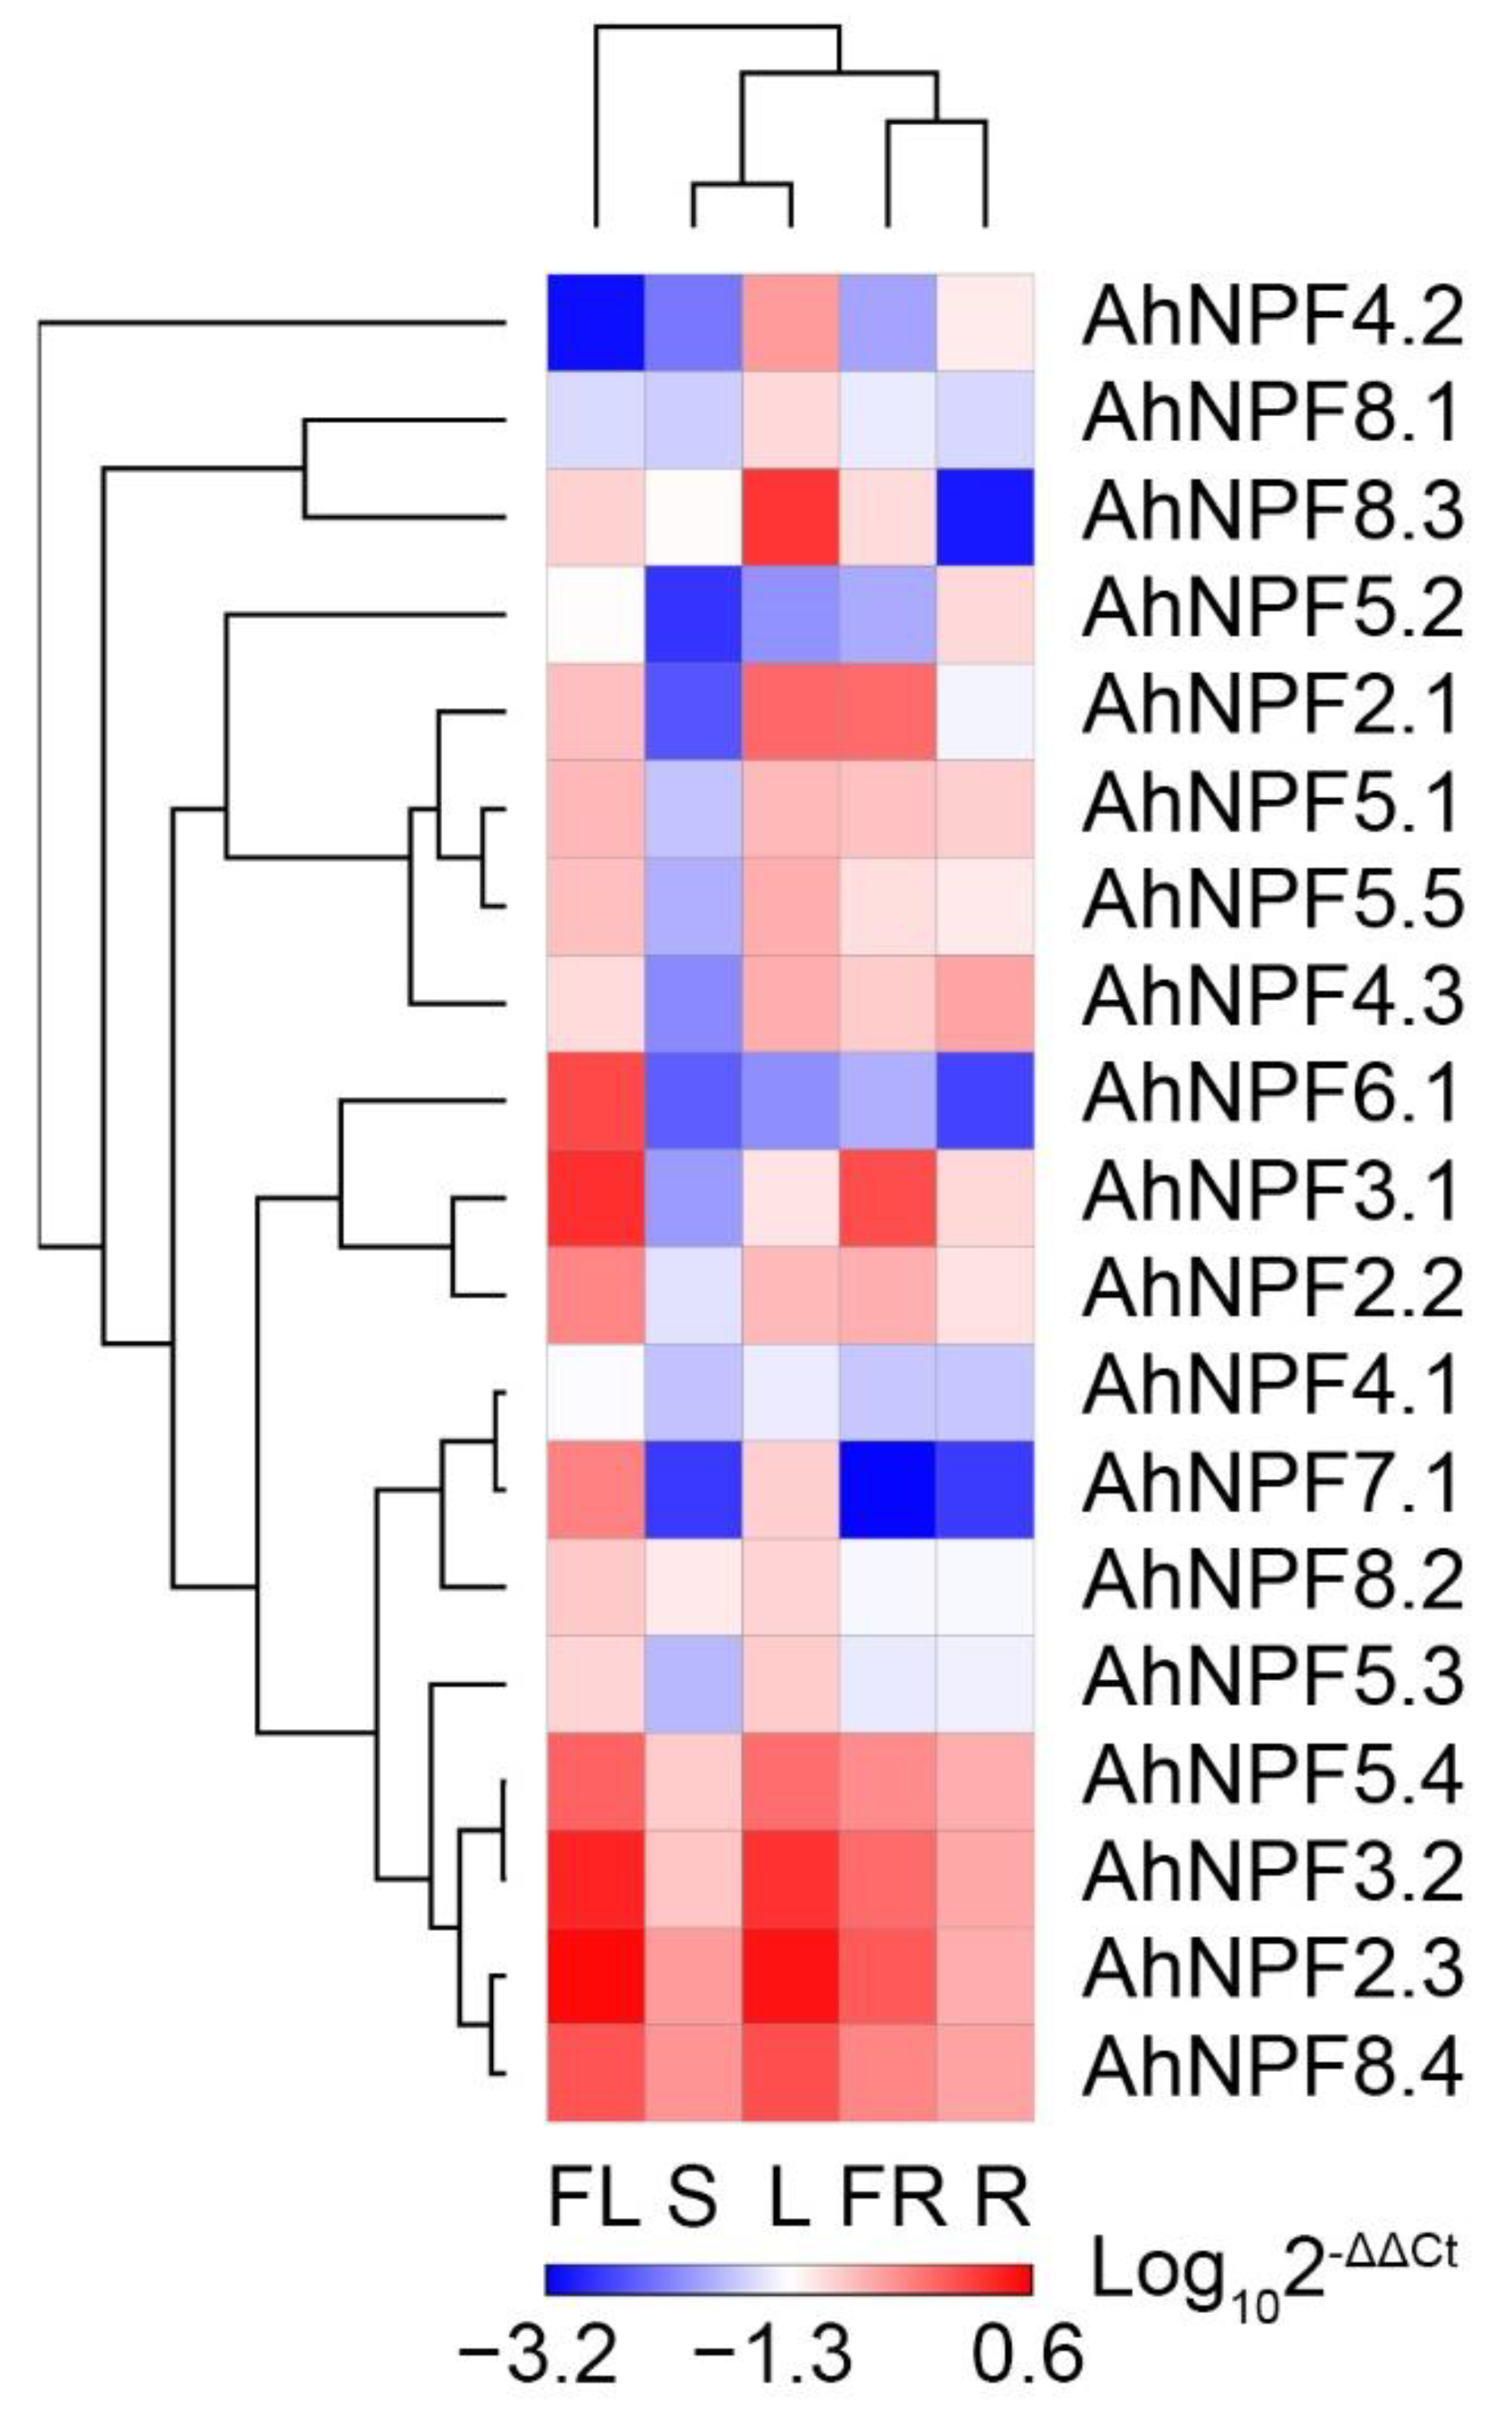
The expression of NPF genes was examined in five agave tissues, including the flower, shoot, leaf, fruit and root (Figure 2). Most AhNPFs showed high expression in at least one tissues (Figure 3). There were eight AhNPFs showing high expression in flower and leaf tissues, including AhNPF2.3/3.2/4.1/5.3/5.4/7.1/8.2/8.4. We found that AhNPF2.2/6.1, AhNPF4.2/5.5/8.1/8.3 and AhNPF5.2 were highly expressed in the flower, leaf and root, respectively. Also, we found high expression of AhNPF2.1 in the leaf/fruit and AhNPF3.1 in the flower/fruit. AhNPF4.3 and AhNPF5.1 showed high expression in most tissues except the shoot.
2.4. Expression Profiles of AhNPFs during Leaf Development
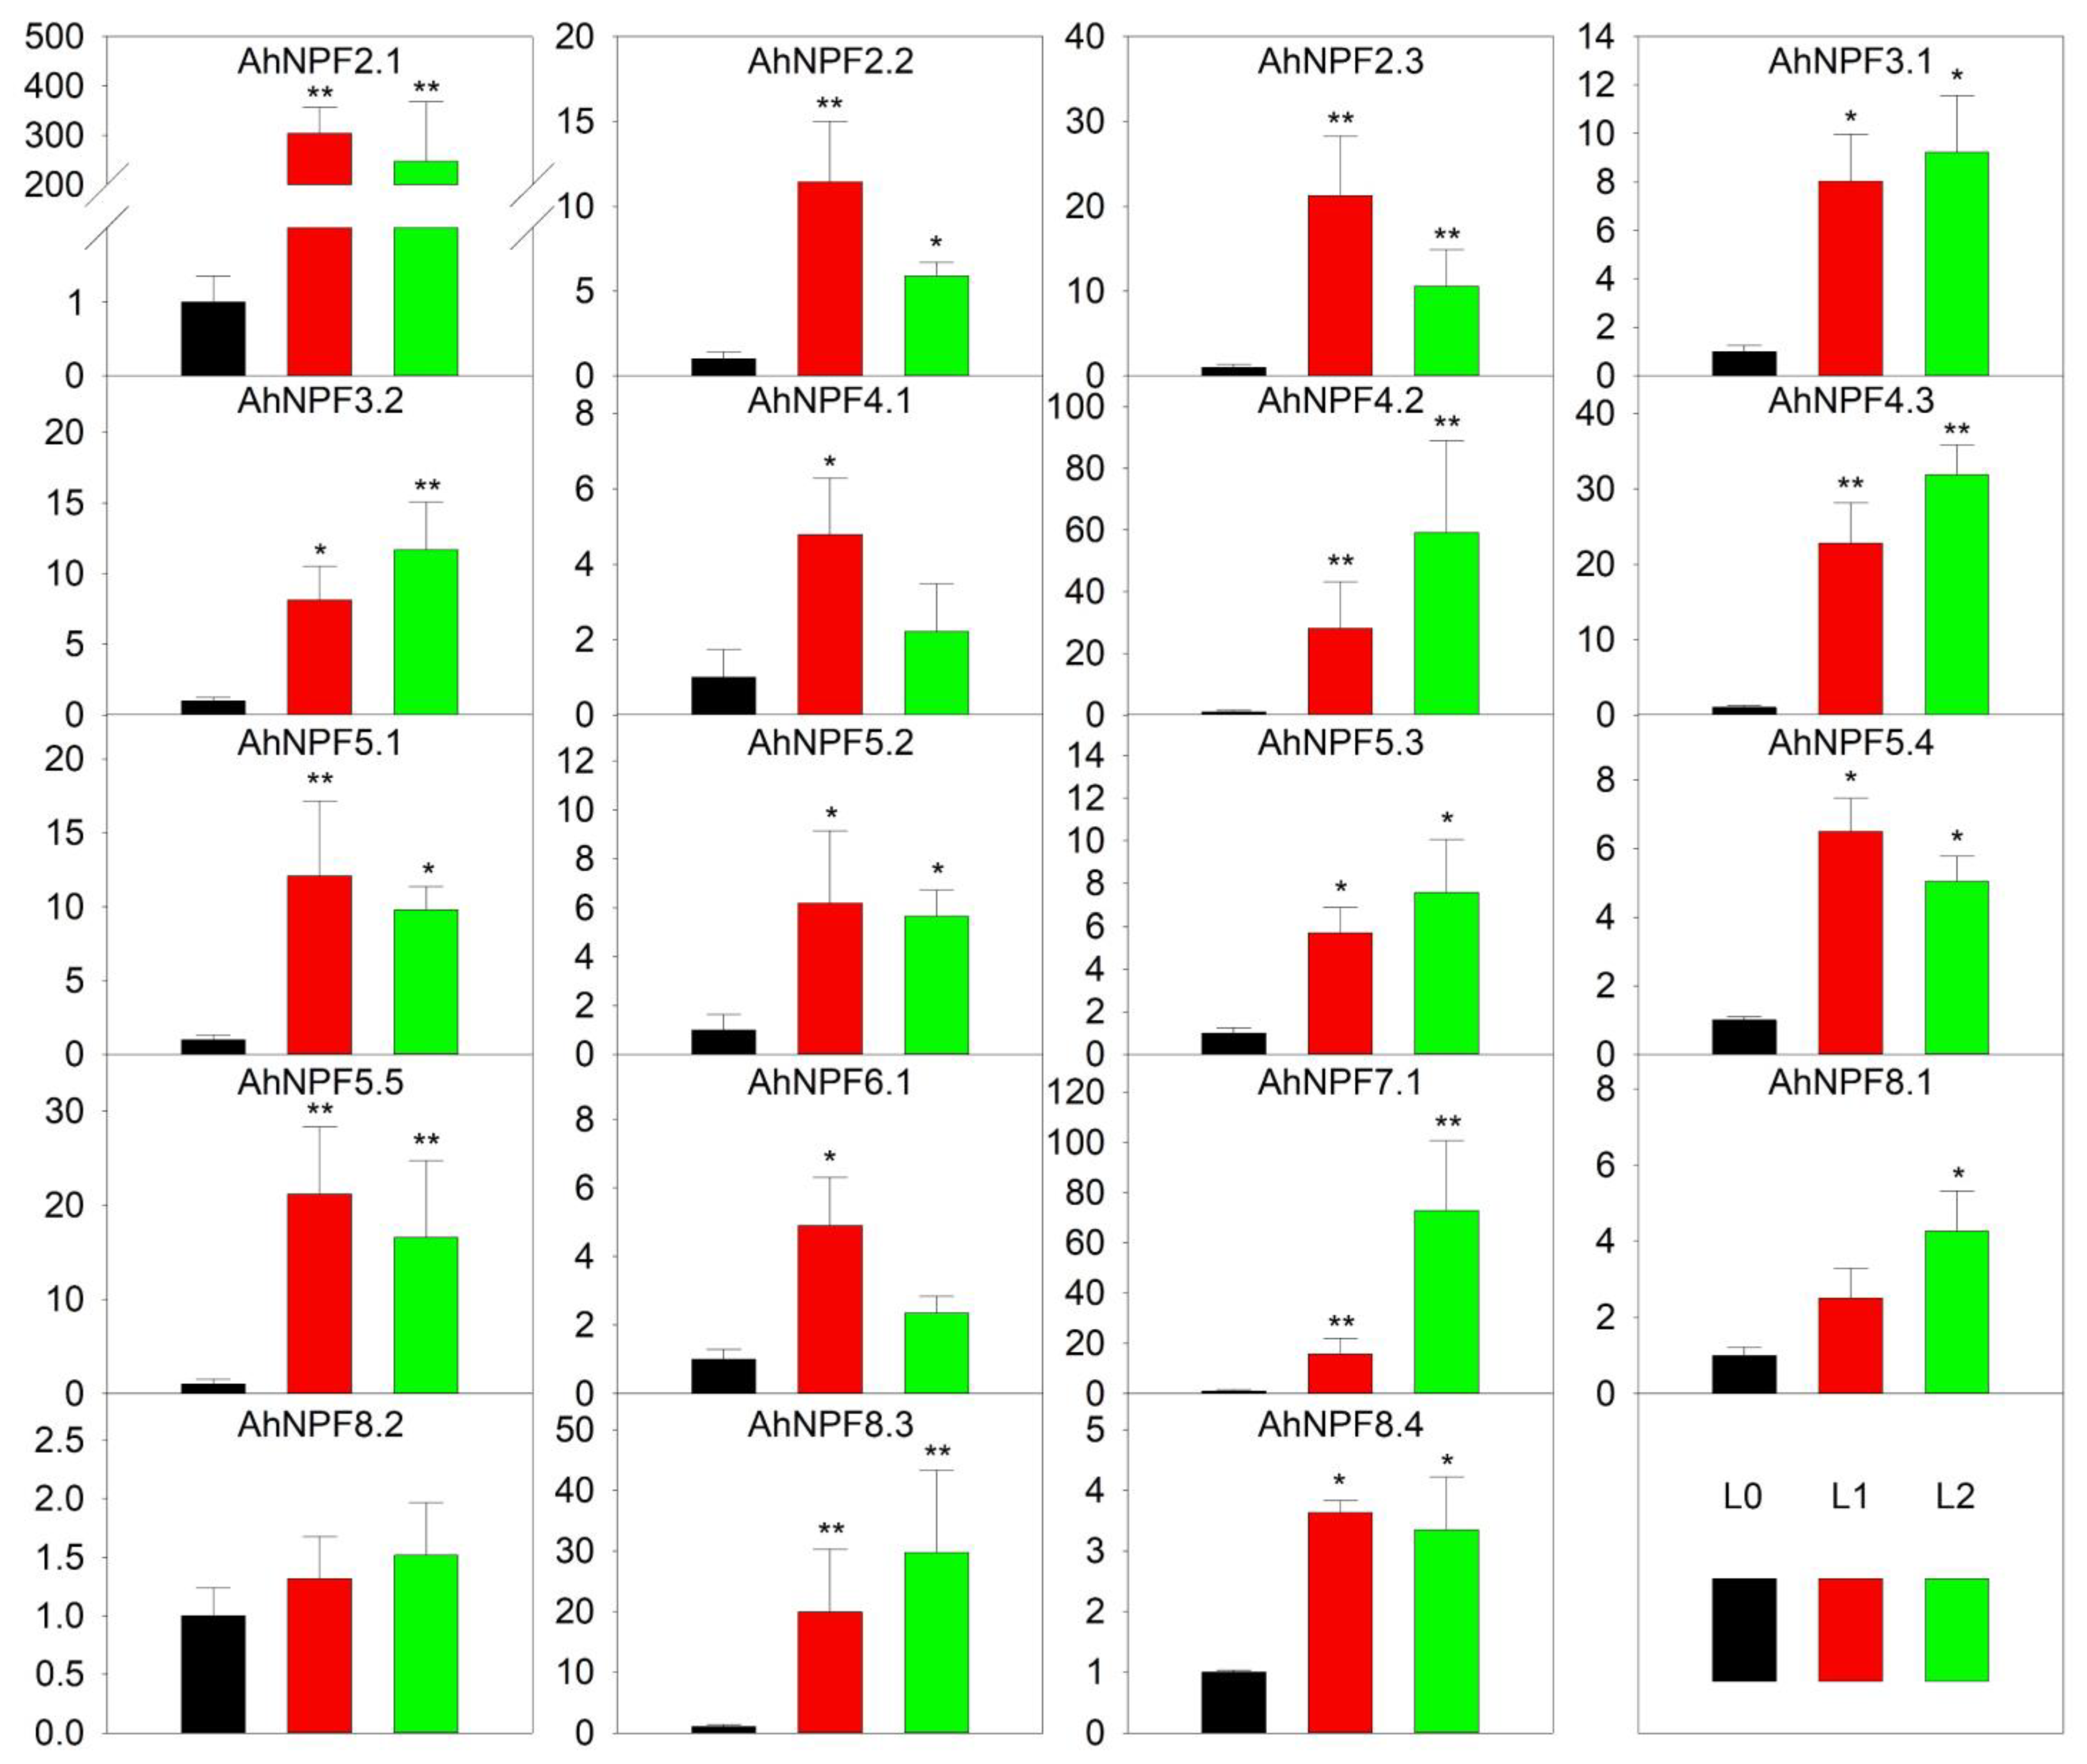
We have also examined the expression patterns of AhNPFs at different developmental stages of the agave leaf (Figure 2). The results revealed that most AhNPFs were significantly up-regulated at least in the unexpanded (L1) or expanded (L2) leaf except AhNPF8.2, when compared with the shoot stage (L0) (Figure 4). Among these, there were eight and nine AhNPFs with expression levels increased by more than 3- and 10-fold at the L1 stage, respectively. The expressions of 16 AhNPFs were increased more than 3-fold and eight were over 10-fold when comparing L2 with L0. Additionally, only the AhNPF7.1 changed expression levels more than 3-fold when comparing L2 with L1.
2.5. Expression Profiles of AhNPFs under Abiotic/Biotic Stresses
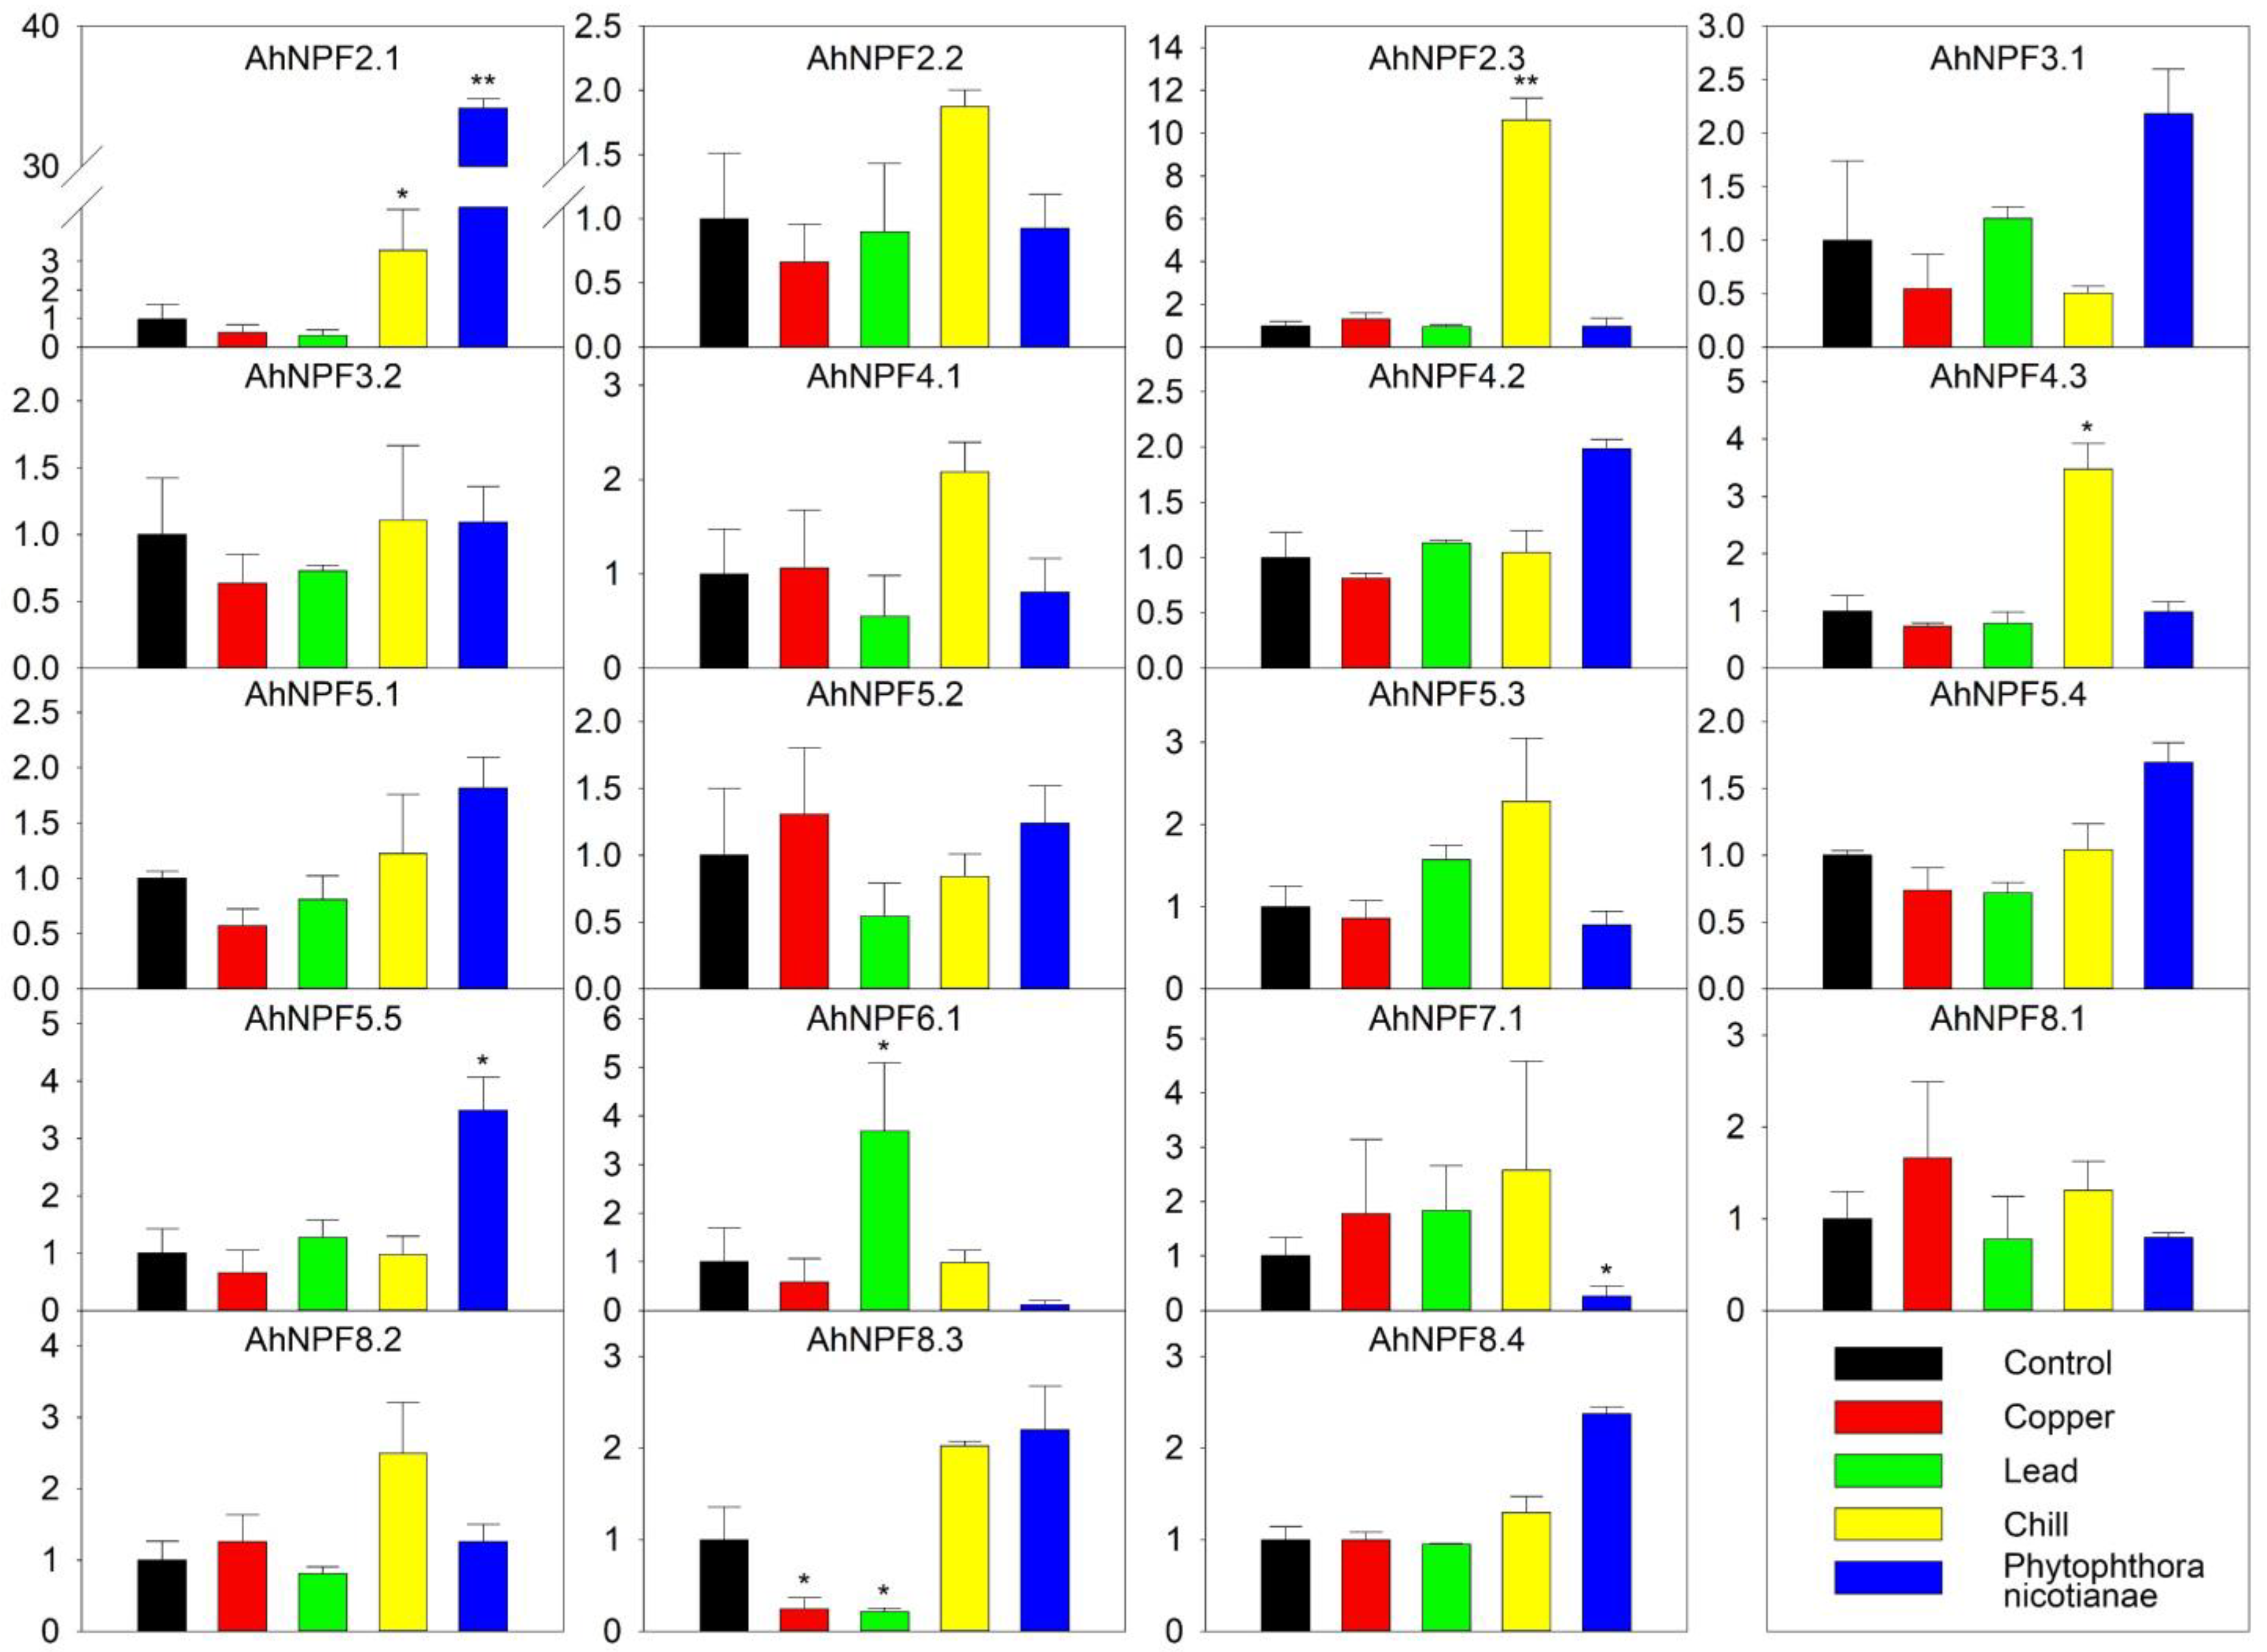
We also evaluated the expression of AhNPFs in response to five abiotic/biotic stress treatments, including treatments of copper salt, lead salt, chill and Phytophthora nicotianae Breda inoculation (Figure 5). As a result, 12 AhNPFs showed moderate expressions under different stresses. AhNPF8.3 was the only gene with a changed expression level over 3-fold under copper stress. The expression of AhNPF6.1 and AhNPF8.3 were increased and decreased over 3-fold under lead stress, respectively. There were three AhNPFs up-regulated over 3-fold under chill stress, including AhNPF2.1/2.3/4.3. Additionally, AhNPF2.1/AhNPF8.2 and AhNPF7.1 were up- and down-regulated over 3-fold under the biotic stress, respectively.
2.6. Expression Profiles of AhNPFs under Nutrient Deficiency
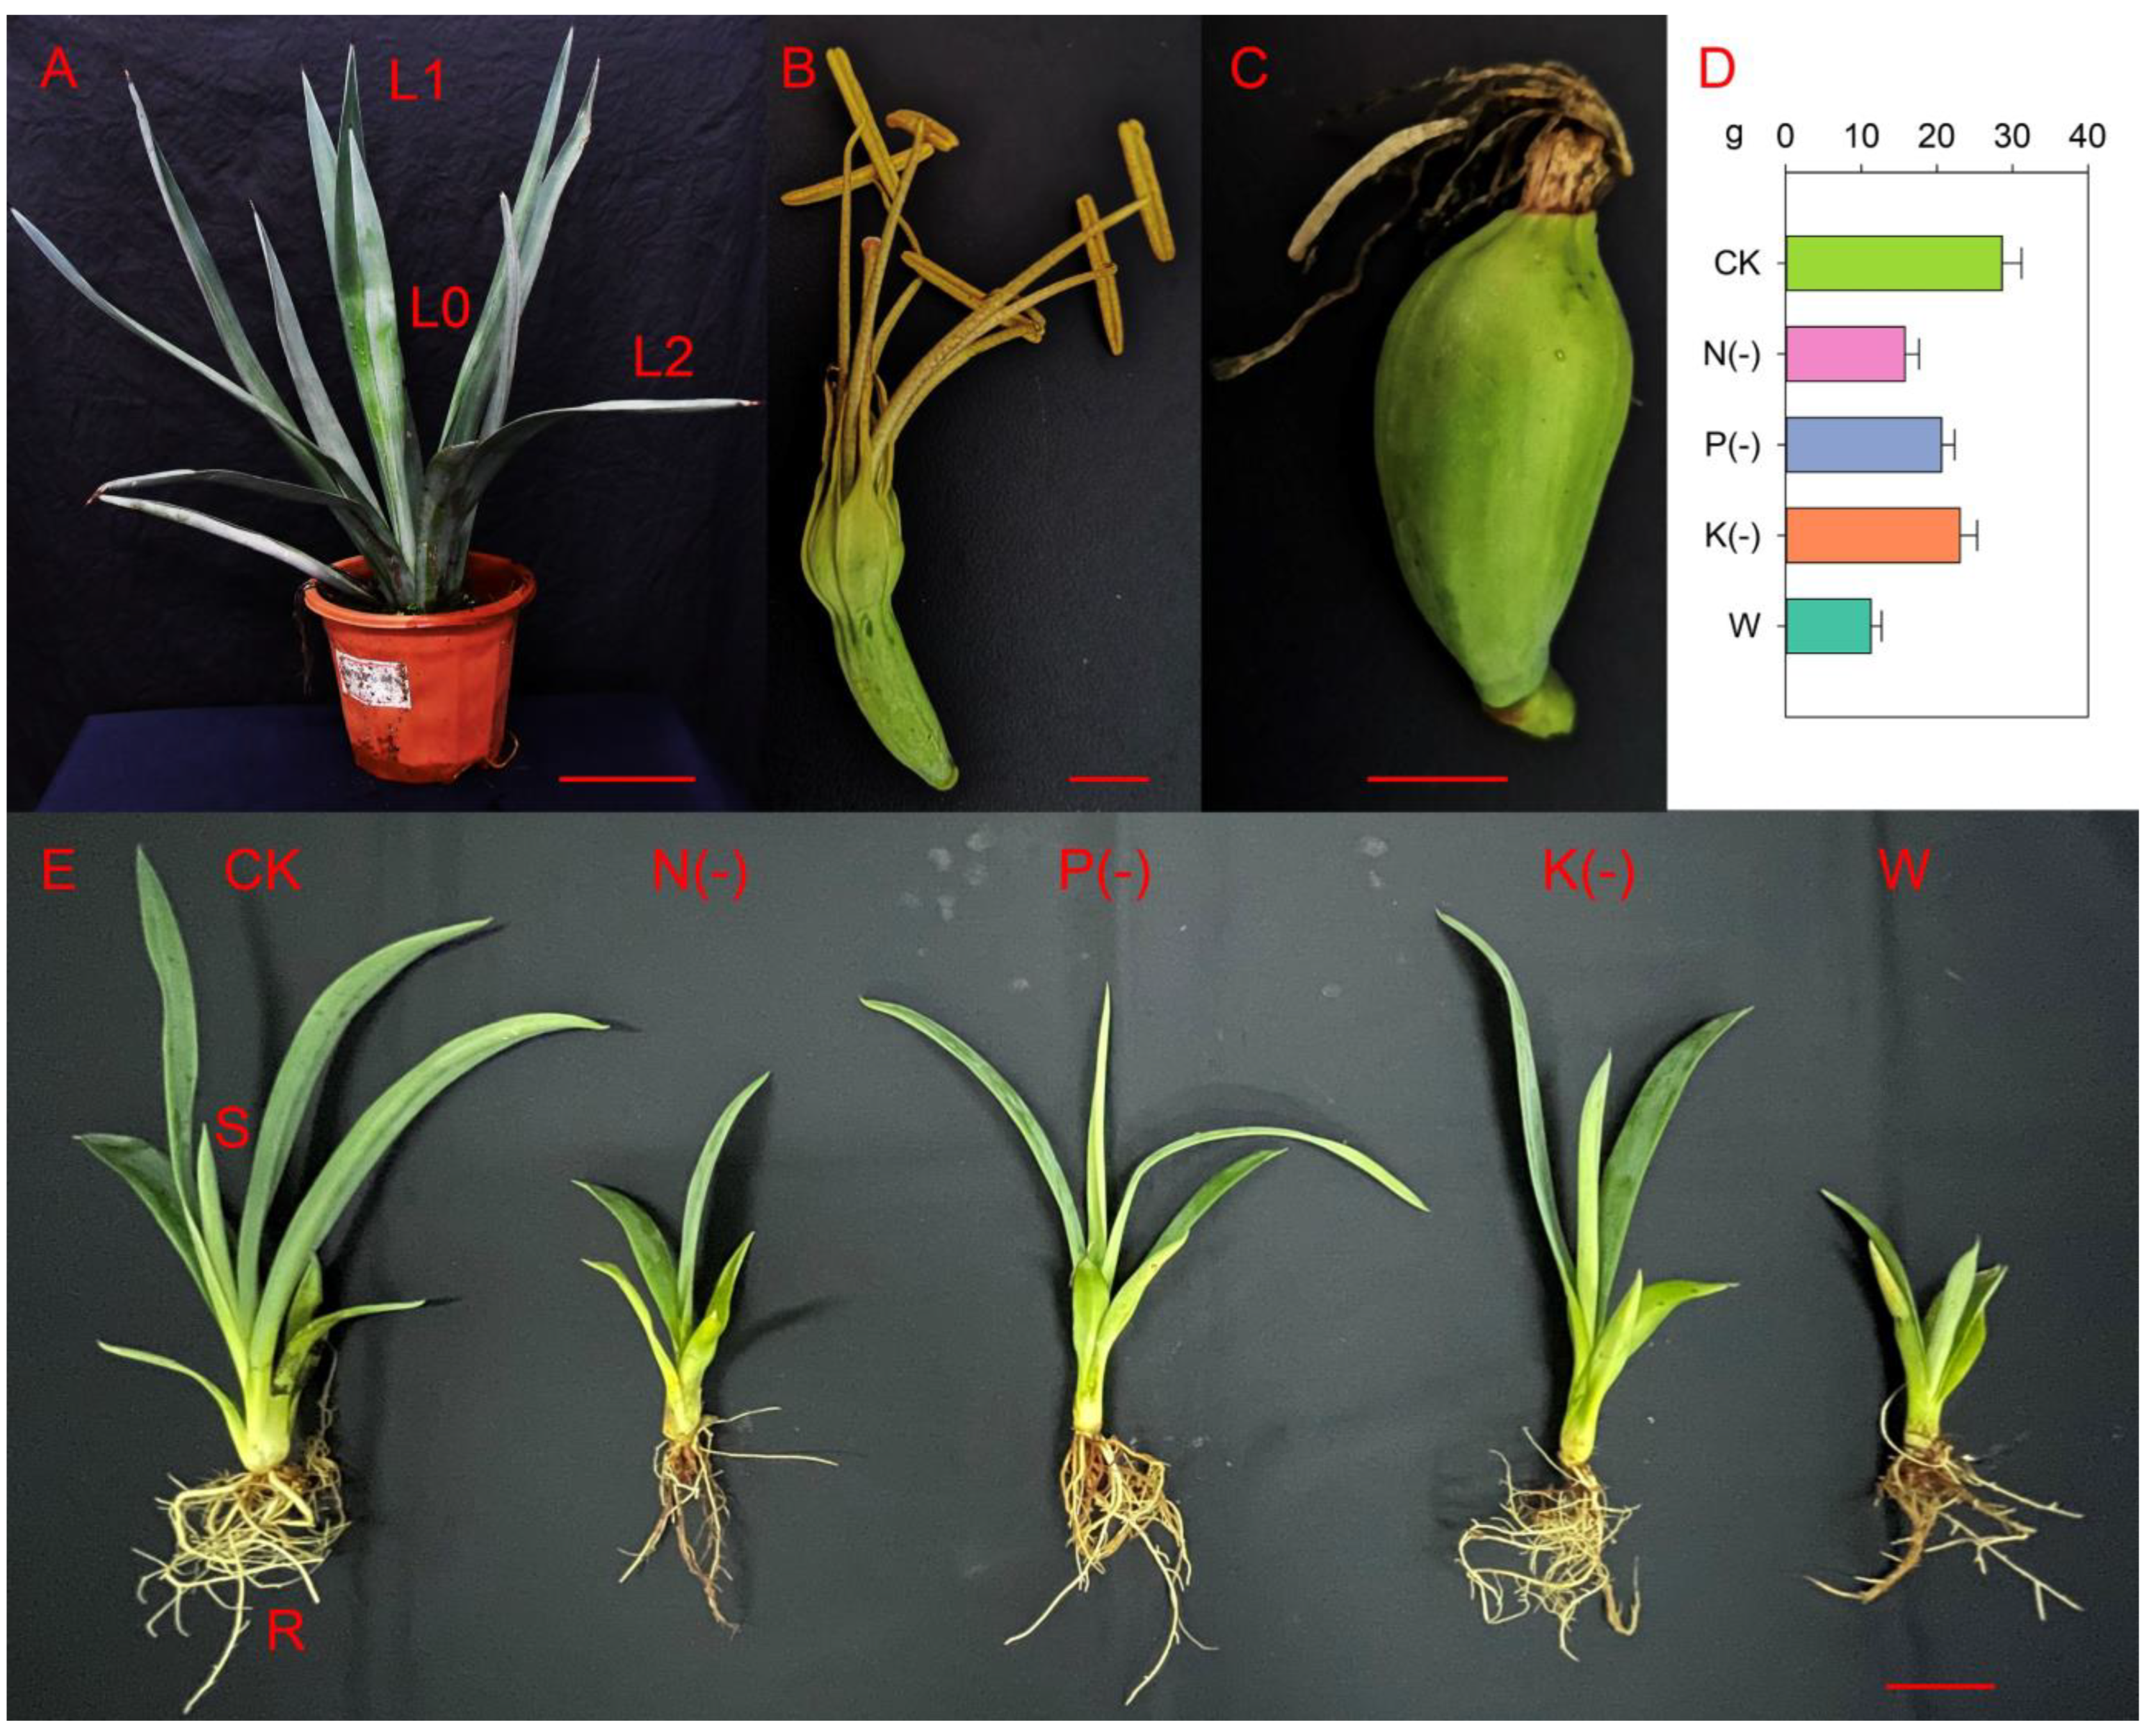
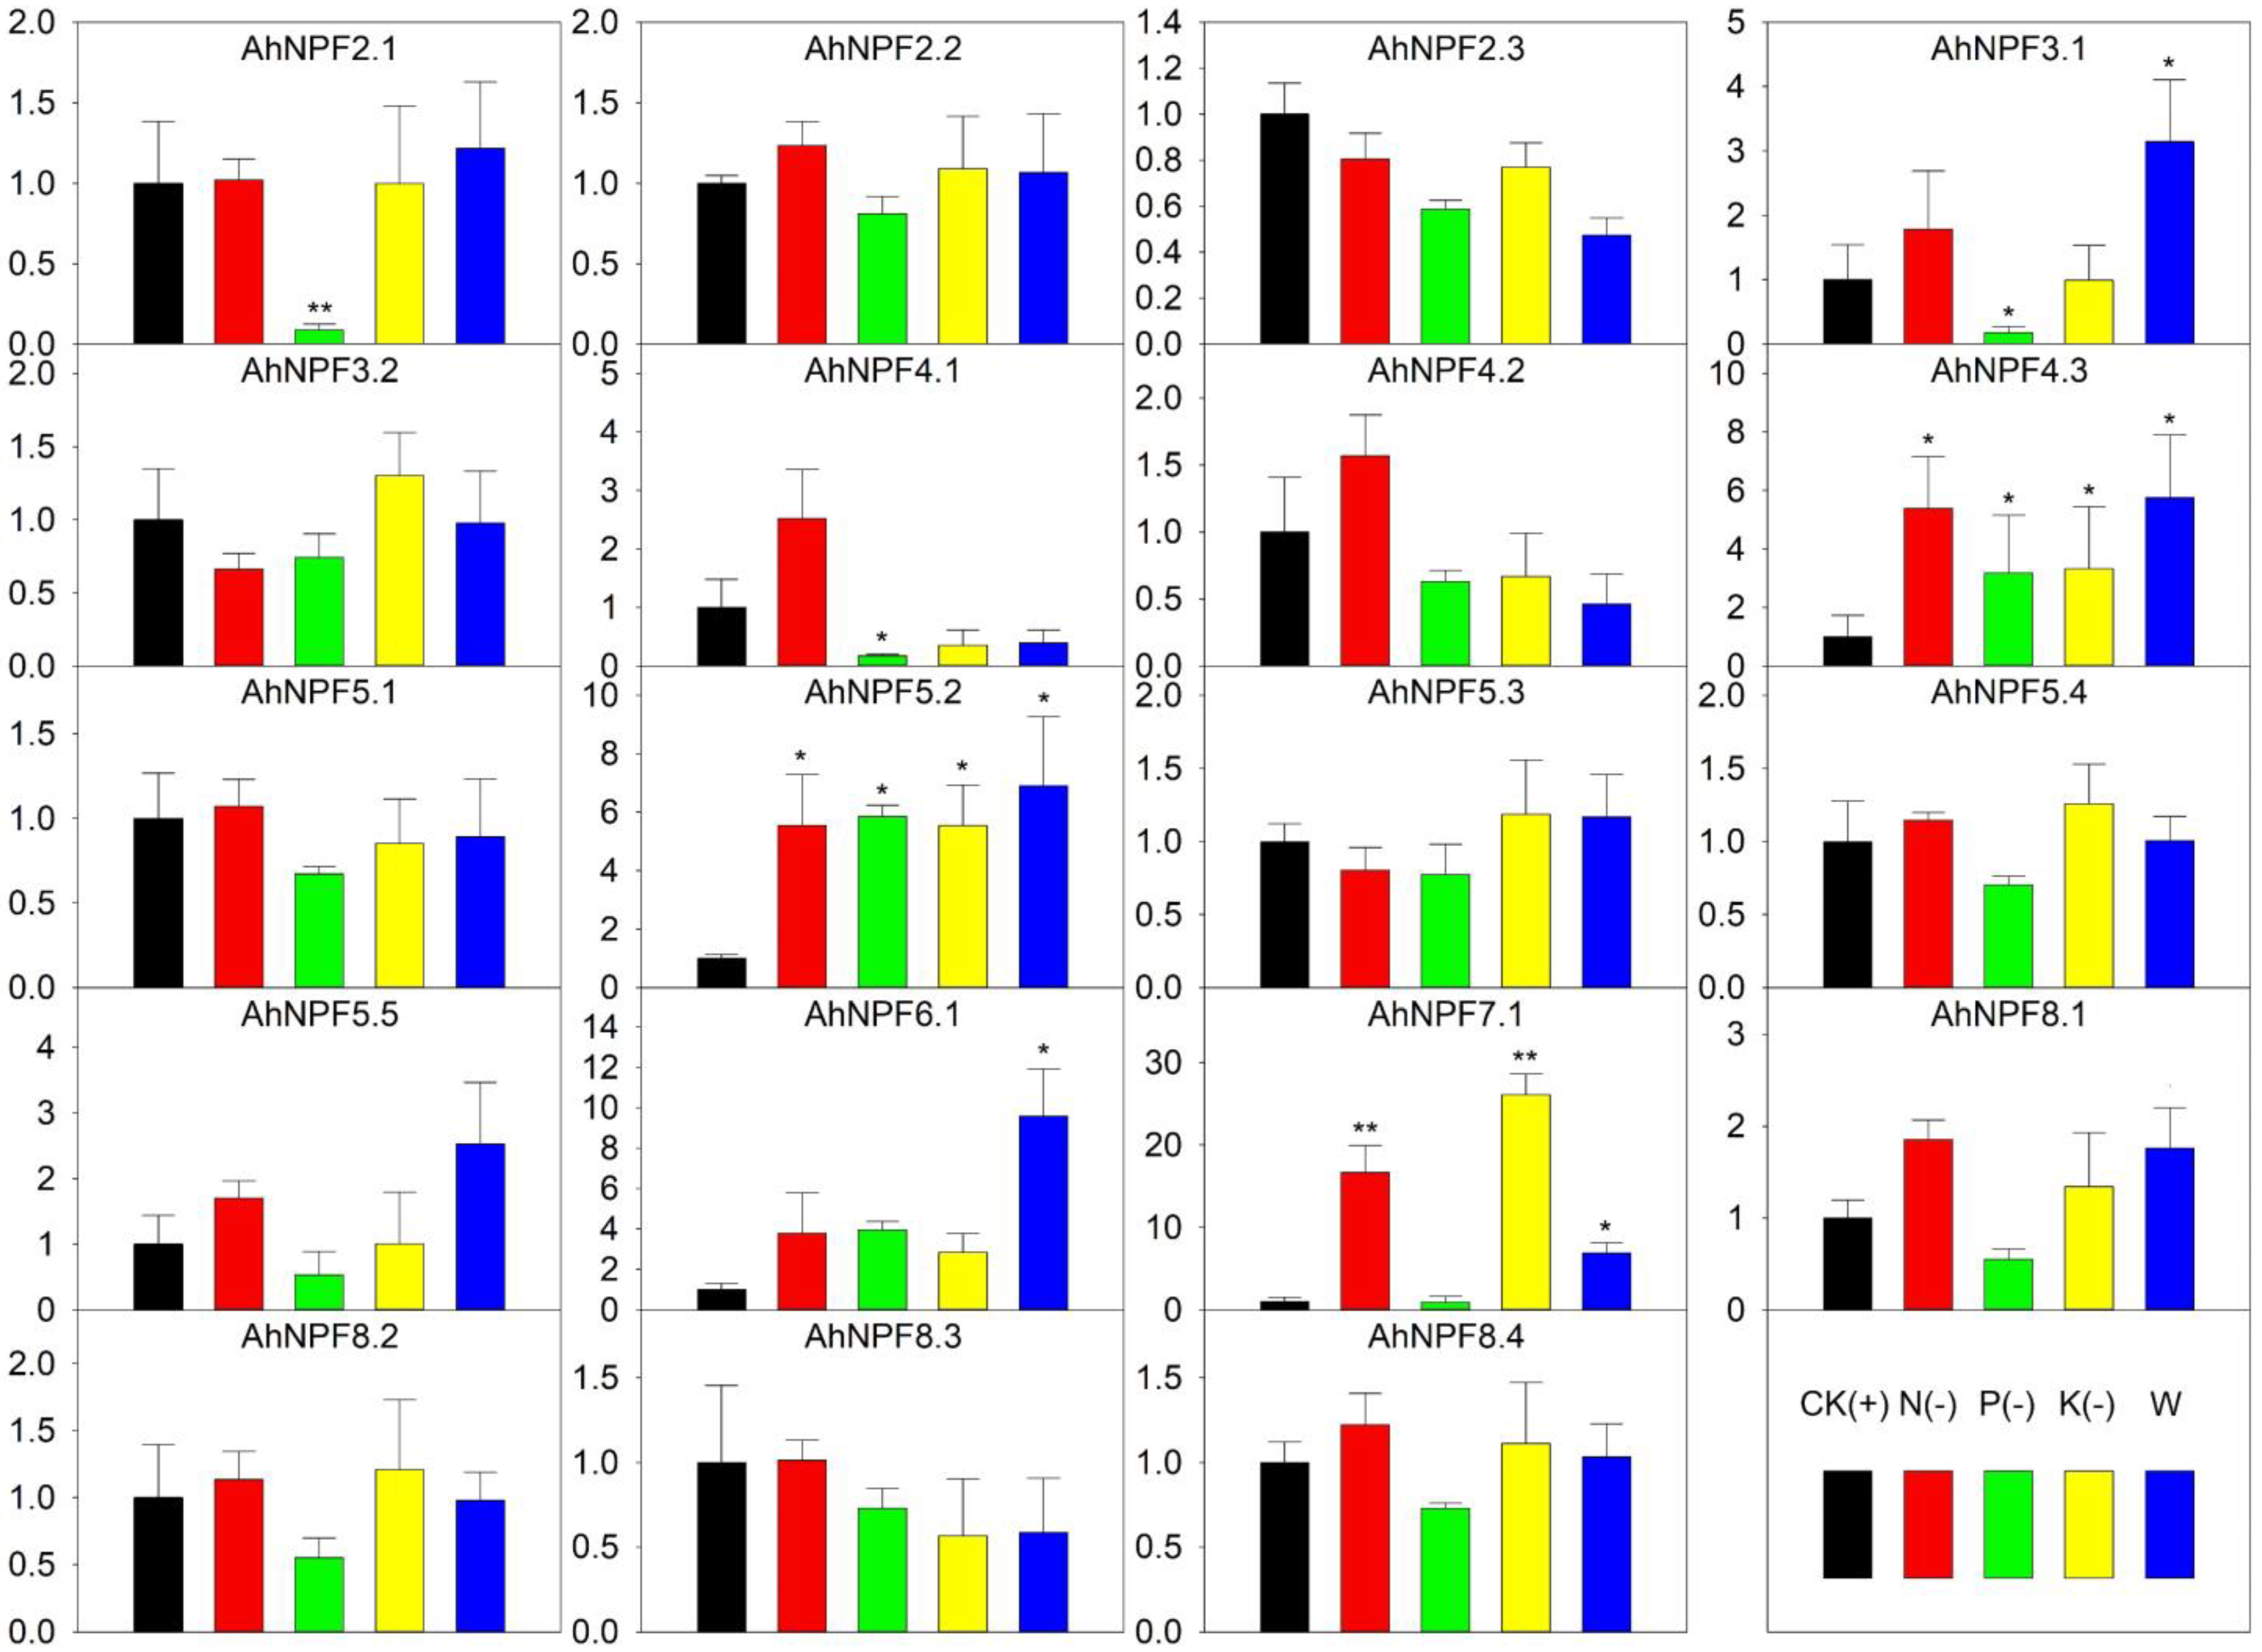
We further carried out nutrient deficiency treatments to evaluate the expression patterns of AhNPFs. The full Hoagland nutrient solution was selected as control (CK). Hoagland nutrient solutions without nitrogen (N-), phosphorus (P-), potassium (K-) and water (W) were set as treatments. The biomass and growth were significantly restricted by the four treatments (Figure 2). The result indicated that 12 AhNPFs were less sensitive to nutrient deficiency (Figure 6). AhNPF4.3 and AhNPF5.2 increased their expressions over 3-fold under N-, P-, K- and W. AhNPF7.1 was up-regulated over 3-fold under N-, K- and W. The expressions of three AhNPFs (AhNPF2.1/3.1/4.1) decreased over 3-fold under P-. Additionally, there were another two AhNPFs (AhNPF3.1/6.1) that showed up-regulated expressions over 3-fold in W.
3. Discussion
3.1. Identification of Agave NPF Genes
In the present study, we have successfully identified 19 NPF genes according to a previous transcriptome dataset, which was a relatively small number compared with asparagus and other species (Table 2). This might be caused by tissue-specific expression because the leaf was the only tissue used for transcriptome assembly in the previous study [25]. It is possible that more agave NPF genes will be identified based on the agave genome sequence which is not available yet. The other agave NPF genes might have an extremely low expression in the leaf, which made it hard to assemble the full-length transcript sequence from Illumina sequencing data [31]. The PacBio SMRT (single molecule real-time) sequencing technology is very powerful for detecting genes with low expressions [32]. There was a similar expression pattern of NPF genes in maize (Zea mays L.) and more than a half of 79 NPF genes showed no expressions in the leaf [29,33]. Most agave NPF genes in this study did not show obvious specific expression in single tissues (Figure 3). Most AhNPFs showed relatively high expressions in no less than two tissues. This might be related to the widely spread transport system of nitrogen, which is important for all of the growth and development processes in plants [2]. There are other factors that might affect gene function and expression, such as nucleotide sequence changes by chromosome recombination [34]. The large amount of 60 chromosomes in A. H11648 has significantly improved the frequency of chromosome recombination compared with the 10 chromosomes in asparagus [24,28]. Insertion or deletion in the promoter and coding region may be introduced, which would directly alter the function and expression of genes [35,36]. The species-specific expansion of NPF genes also exists in subgroup IIIe and IVa in rice (Figure 1). Further studies are still needed to reveal the evolution patterns of NPF genes in plants.
3.2. Regulation of Agave NPF Genes Associated with Leaf Development, Abiotic/Biotic Stresses and Nutrient Deficiency
We examined the expression patterns of AhNPFs in different tissues, during the process of leaf development and under abiotic/biotic stresses and nutrient deficiency. The results indicate their diverse functions in the growth and development of agave. Each AhNPF gene was dominantly expressed in one or more agave tissues, which indicates their tissue-specific expression patterns. Additionally, the relatively high expression patterns of AhNPF2.3/3.2/5.4/8.4 reveal their importance in the basic nitrogen transport system in agave tissues [2]. Most Agave NPF genes were significantly up-regulated during leaf development, which is consistent with the expression pattern of their orthologous genes in maize [33]. The tiny young shoot is much smaller than the large leaf and its total demand of nitrogen is also much less than the leaf [37]. Additionally, more than half of the NPF genes (47) showed no or extremely low expression levels in the shoot and leaf tissues of maize, which also provided a possible reason for the relatively small amount of NPF genes identified in the agave leaf transcriptome [33]. The expression analysis has also revealed the numbers of candidate AhNPFs under copper, lead, chill and fungus stress. There are one, two, three and three AhNPFs significantly up- or down-regulated under the four stresses, respectively (Figure 5). The results indicate that AhNPFs had different responsesto abiotic/biotic stresses. This might be caused by different sensing and regulating networks upstream of various antioxidant enzymes, which are commonly produced to scavenge reactive oxygen species triggered by stresses in plants [38]. The transport and allocation of nitrate is necessary for the synthesis of these enzymes [26]. Moreover, the expression analysis also indicated the candidate nitrate transporters in agave, including AhNPF4.3/5.2/7.1 (Figure 6). Interestingly, they are also involved in P and K responses. Besides, AhNPF2.1/3.1/4.1 are only involved in the P response and do not have obvious responses to N and K. We infer the existence of crosstalk among the three nutrients, which was also reported in Brassica napus [27,39]. However, more evidence is still needed to reveal the interactions among N, P and K nutrients, which will contribute to the rational application of fertilizers in agave.
4. Materials and Methods
4.1. Sequence Retrieval and Phylogenetic Analysis
The NPF proteins of arabidopsis (53) and rice (93) were selected as the query for homologous sequence identification by the TBlastn method [29,40]. The transcriptome of Agave. hybrid H11648 was selected for sequence retrieval and asparagus was selected as a closely related reference [25,28]. The ORF-FINDER software was used to identify agave NPF genes with full coding sequences, which were further selected for subcellular localization prediction using the CELLO software [41,42]. The protein sequences of arabidopsis, rice, asparagus and agave were selected for phylogenetic analysis. The phylogenetic tree was constructed with the neighbor-joining method and bootstrap values tested for 1000 trials by the MEGA 5.0 software [43].
4.2. Plant Materials and RNA Extraction
The samples of the leaf, flower and fruit were collected from a flowering plant of Agave hybrid H11648at the germplasm garden of Guangxi Subtropical Crops Research Institute (22.90° N, 108.33° E). Fruit samples were collected one month after flowering. The other tissue samples were collected at the Environment and Plant Protection Institute, Chinese Academy of Tropical Agricultural Sciences (19.99° N, 110.33° E). Shoot and root samples were collected from seedlings after one month of being cultured in Hoagland nutrient solution [44]. The samples of leaf development, abiotic and biotic stresses were collected according to a previous study [23]. The details were as follows. The shoot, unexpanded leaf and fully expanded leaf were separately collected as different developmental stages from 2-year-old plants. The stress treatments were carried out with agave seedlings planted in pots. The leaf samples were collected at 2 weeks after watering with solutions of CuSO4 (1 g/Kg) and Pb(NO3)2 (1.3 g/Kg), and 5 days after the inoculation of Phytophthora nicotianae Breda. The potted seedlings were placed in an incubator at 6 °C as chill treatment and sampled at 24 h. Untreated leaves were also sampled as control. The agave seedlings were cultured in water for rooting and then utilized for nutrient deficiency treatments after one week. The full Hoagland nutrient solution was selected as control [44]. The solutions without N, P and K nutrients were selected as treatments [45]. Water was selected as a nutrient-free treatment. The leaves were sampled after the seedlings were cultured for 6 months. Each sample or treatment was repeated three times as biological replicates. All the samples were ground into powder after immediate freezing in liquid nitrogen. Total RNA was extracted with the Tiangen RNA prep Pure Plant Kit (Tiangen Biomart, Beijing, China) and stored at −80 °C.
4.3. Analysis of Gene Expression Using Quantitative Reverse Transcription PCR (qRT-PCR)
The total RNA was reverse transcribed into cDNA for qRT-PCR analysis by the GoScript Reverse Transcription System (Promega, Madison, WI, USA). Each qRT-PCR reaction solution was mixed to a final volume of 20 μL, including 10 μL of TransStart Tip Green qPCR Supermix (Transgen Biotech, Beijing, China), 0.4 μL of Passive Reference Dye (50×) (Transgen Biotech, Beijing, China), 1 μL of cDNA template, 0.5 μL of 2 gene-specific primers (10 μM) and 7.6 μL ddH2O. The QuantStudio 6 Flex Real-Time PCR System (Thermo Fisher Scientific, Waltham, MA, USA) was used for qRT-PCR reaction with a program including 94 °C for 30 s, 40 cycles of 94 °C for 5 s and 60 °C for 30 s, and a final dissociation stage. The reaction was carried out in each sample 3 times as the technical repeat. Gene specific primers of AhNPFs were designed by the Primer 3 software (Table 2) [46]. The protein phosphatase 2A (PP2A) gene was used as the endogenous control [23]. We selected the ΔΔCt method to calculate relative expression levels, as reported in a previous study [47].
5. Conclusions
In this study, we identified 19 NPF genes on the leaf transcriptome of Agave hybrid H11648. Our analysis of gene expression in various types of tissues revealed the tissue-specific expression pattern of AhNPFs. We further examined their expression patterns at different leaf developmental stages, under abiotic/biotic stresses and nutrient deficiency. The results reveal several candidate regulators in the agave NPF family, including AhNPF4.3/5.2/7.1. Our results provide a guideline to reveal the complex genetic dissection of the agave NPF family, which will benefit future studies related to the mechanism of nitrate nutrients in agave.
Supplementary Materials
The following supporting information can be downloaded at: https://www.mdpi.com/article/10.3390/plants11111434/s1, Figure S1: Transmembrane topology analysis of agave NPF proteins.; Table S1: The NPF gene family in asparagus.
Author Contributions
Conceptualization, X.H., X.Y. and K.Y.; formal analysis, S.T., Y.L. and X.H.; investigation, S.T., Y.L. and Y.H.; resources, J.X.; writing—original draft preparation, S.T. and X.H.; writing—review and editing, X.Y. and K.Y.; supervision, K.Y.; funding acquisition, J.X., X.H. and K.Y. All authors have read and agreed to the published version of the manuscript.
Funding
This research was funded by Hainan Provincial Natural Science Foundation of China (322QN367, 322MS112, 320RC698), National Natural Science Foundation of China (32001598), China Agriculture Research System of MOF and MARA (CARS-16), Central Public-interest Scientific Institution Basal Research Fund for Chinese Academy of Tropical Agricultural Sciences (1630042022005) and the innovation platform for Academicians of Hainan Province.
Institutional Review Board Statement
Not applicable.
Informed Consent Statement
Not applicable.
Data Availability Statement
All data are contained within the article or Supplementary Materials.
Acknowledgments
We would like to thank Bo Wang from Genoseq Technology Co. Ltd. (Wuhan 430072, China) for his help with data analysis.
Conflicts of Interest
The authors declare no conflict of interest.
References
- Crawford, N.M. Nitrate: Nutrient and signal for plant growth. Plant Cell 1995, 7, 859–868. [Google Scholar]
- Wang, Y.Y.; Cheng, Y.H.; Chen, K.E.; Tsay, Y.F. Nitrate Transport, Signaling, and Use Efficiency. Annu. Rev. Plant Biol. 2018, 69, 85–122. [Google Scholar] [CrossRef]
- Hsu, P.K.; Tsay, Y.F. Two phloem nitrate transporters, NRT1.11 and NRT1.12, are important for redistributing xylem-borne nitrate to enhance plant growth. Plant Physiol. 2013, 163, 844–856. [Google Scholar] [CrossRef] [Green Version]
- Taochy, C.; Gaillard, I.; Ipotesi, E.; Oomen, R.; Leonhardt, N.; Zimmermann, S.; Peltier, J.B.; Szponarski, W.; Simonneau, T.; Sentenac, H.; et al. The Arabidopsis root stele transporter NPF2.3 contributes to nitrate translocation to shoots under salt stress. Plant J. 2015, 83, 466–479. [Google Scholar] [CrossRef]
- Segonzac, C.; Boyer, J.C.; Ipotesi, E.; Szponarski, W.; Tillard, P.; Touraine, B.; Sommerer, N.; Rossignol, M.; Gibrat, R. Nitrate efflux at the root plasma membrane: Identification of an Arabidopsis excretion transporter. Plant Cell 2007, 19, 3760–3777. [Google Scholar] [CrossRef] [Green Version]
- Wang, Y.Y.; Tsay, Y.F. Arabidopsis nitrate transporter NRT1.9 is important in phloem nitrate transport. Plant Cell 2011, 23, 1945–1957. [Google Scholar] [CrossRef] [Green Version]
- Almagro, A.; Lin, S.H.; Tsay, Y.F. Characterization of the Arabidopsis nitrate transporter NRT1.6 reveals a role of nitrate in early embryo development. Plant Cell 2008, 20, 3289–3299. [Google Scholar] [CrossRef] [Green Version]
- Fan, S.; Lin, C.; Hsu, P.; Lin, S.; Tsay, Y. The Arabidopsis nitrate transporter NRT1.7, expressed in phloem, is responsible for source-to-sink remobilization of nitrate. Plant Cell 2009, 21, 2750–2761. [Google Scholar] [CrossRef] [Green Version]
- Pike, S.; Gao, F.; Kim, M.J.; Kim, S.H.; Schachtman, D.P.; Gassmann, W. Members of the NPF3 transporter subfamily encode pathogen-inducible nitrate/nitrite transporters in grapevine and Arabidopsis. Plant Cell Physiol. 2014, 55, 162–170. [Google Scholar] [CrossRef] [Green Version]
- Kanno, Y.; Kamiya, Y.; Seo, M. Nitrate does not compete with abscisic acid as a substrate of AtNPF4.6/NRT1.2/AIT1 in Arabidopsis. Plant Signal. Behav. 2013, 8, e26624. [Google Scholar] [CrossRef] [Green Version]
- L’eran, S.; Garg, B.; Boursiac, Y.; Corratg’e-Faillie, C.; Brachet, C.; Tillard, P.; Gojon, A.; Lacombe, B. AtNPF5.5, a nitrate transporter affecting nitrogen accumulation in Arabidopsis embryo. Sci. Rep. 2015, 5, 7962. [Google Scholar] [CrossRef] [Green Version]
- He, Y.N.; Peng, J.S.; Cai, Y.; Liu, D.F.; Guan, Y.; Yi, H.Y.; Gong, J.M. Tonoplast-localized nitrate uptake transporters involved in vacuolar nitrate efflux and reallocation in Arabidopsis. Sci. Rep. 2017, 7, 6417. [Google Scholar] [CrossRef]
- Chiu, C.C.; Lin, C.S.; Hsia, A.P.; Su, R.C.; Lin, H.L.; Tsay, Y.F. Mutation of a nitrate transporter, AtNRT1:4, results in a reduced petiole nitrate content and altered leaf development. Plant Cell Physiol. 2004, 45, 1139–1148. [Google Scholar] [CrossRef]
- Krouk, G.; Lacombe, B.; Bielach, A.; Perrine-Walker, F.; Malinska, K.; Mounier, E.; Hoyerova, K.; Tillard, P.; Leon, S.; Ljung, K.; et al. Nitrate-regulated auxin transport by NRT1.1 defines a mechanism for nutrient sensing in plants. Dev. Cell 2010, 18, 927–937. [Google Scholar] [CrossRef]
- Li, J.Y.; Fu, Y.L.; Pike, S.M.; Bao, J.; Tian, W.; Zhang, Y.; Chen, C.Z.; Zhang, Y.; Li, H.M.; Huang, J.; et al. The Arabidopsis nitrate transporter NRT1.8 functions in nitrate removal from the xylem sap and mediates cadmium tolerance. Plant Cell 2010, 22, 1633–1646. [Google Scholar] [CrossRef] [Green Version]
- Lin, S.H.; Kuo, H.F.; Canivenc, G.; Lin, C.S.; Lepetit, M.; Hsu, P.K.; Tillard, P.; Lin, H.L.; Wang, Y.Y.; Tsai, C.B.; et al. Mutation of the Arabidopsis NRT1.5 nitrate transporter causes defective root-to-shoot nitrate transport. Plant Cell 2008, 20, 2514–2528. [Google Scholar] [CrossRef] [Green Version]
- Komarova, N.Y.; Thor, K.; Gubler, A.; Meier, S.; Dietrich, D.; Weichert, A.; Grotemeyer, M.S.; Tegeder, M.; Rentsch, D. AtPTR1 and AtPTR5 transport dipeptides in planta. Plant Physiol. 2008, 148, 856–869. [Google Scholar] [CrossRef]
- Chiba, Y.; Shimizu, T.; Miyakawa, S.; Kanno, Y.; Koshiba, T.; Kamiya, Y.; Seo, M. Identification of Arabidopsis thaliana NRT1/PTR FAMILY (NPF) proteins capable of transporting plant hormones. J. Plant Res. 2015, 128, 679–686. [Google Scholar] [CrossRef]
- Huang, X.; Wang, B.; Xi, J.; Zhang, Y.; He, C.; Zheng, J.; Gao, J.; Chen, H.; Zhang, S.; Wu, W.; et al. Transcriptome comparison reveals distinct selection patterns in domesticated and wild Agave species, the important CAM plants. Int. J. Genom. 2018, 2018, 5716518. [Google Scholar] [CrossRef] [Green Version]
- Beltran-Garcia, M.J.; White, J.F., Jr.; Prado, F.M.; Prieto, K.R.; Yamaguchi, L.F.; Torres, M.S.; Kato, M.J.; Medeiros, M.H.; Di Mascio, P. Nitrogen acquisition in Agave tequilana from degradation of endophytic bacteria. Sci. Rep. 2014, 4, 6938. [Google Scholar] [CrossRef]
- Yang, X.; Cushman, J.C.; Borland, A.M.; Edwards, E.J.; Wullschleger, S.D.; Tuskan, G.A.; Owen, N.A.; Griffiths, H.; Smith, J.A.; De Paoli, H.C.; et al. A roadmap for research on crassulacean acid metabolism (CAM) to enhance sustainable food and bioenergy production in a hotter, drier world. New Phytol. 2015, 207, 491–504. [Google Scholar] [CrossRef]
- Nava-Cruz, N.Y.; Medina-Morales, M.A.; Martinez, J.L.; Rodriguez, R.; Aguilar, C.N. Agave biotechnology: An overview. Crit. Rev. Biotechnol. 2015, 35, 546–559. [Google Scholar] [CrossRef]
- Deng, G.; Huang, X.; Xie, L.; Tan, S.; Gbokie, T., Jr.; Bao, Y.; Xie, Z.; Yi, K. Identification and Expression of SAUR Genes in the CAM Plant Agave. Genes 2019, 10, 555. [Google Scholar] [CrossRef] [Green Version]
- Robert, M.L.; Lim, K.Y.; Hanson, L.; Sanchez-Teyer, F.; Bennett, M.D.; Leitch, A.R.; Leitch, I.J. Wild and agronomically important Agave species (Asparagaceae) show proportional increases in chromosome number, genome size, and genetic markers with increasing ploidy. Bot. J. Linn. Soc. 2010, 158, 215–222. [Google Scholar] [CrossRef] [Green Version]
- Huang, X.; Xiao, M.; Xi, J.; He, C.; Zheng, J.; Chen, H.; Gao, J.; Zhang, S.; Wu, W.; Liang, Y.; et al. De novo transcriptome assembly of Agave H11648 by Illumina sequencing and identification of cellulose synthase genes in Agave species. Genes 2019, 10, 103. [Google Scholar] [CrossRef] [Green Version]
- Zhang, G.B.; Meng, S.; Gong, J.M. The Expected and Unexpected Roles of Nitrate Transporters in Plant Abiotic Stress Resistance and Their Regulation. Int. J. Mol. Sci. 2018, 19, 3535. [Google Scholar] [CrossRef] [Green Version]
- Zhang, H.; Li, S.; Shi, M.; Wang, S.; Shi, L.; Xu, F.; Ding, G. Genome-Wide Systematic Characterization of the NPF Family Genes and Their Transcriptional Responses to Multiple Nutrient Stresses in Allotetraploid Rapeseed. Int. J. Mol. Sci. 2020, 21, 5947. [Google Scholar] [CrossRef]
- Harkess, A.; Zhou, J.; Xu, C.; Bowers, J.E.; Van der Hulst, R.; Ayyampalayam, S.; Mercati, F.; Riccardi, P.; McKain, M.R.; Kakrana, A.; et al. The asparagus genome sheds light on the origin and evolution of a young Y chromosome. Nat. Commun. 2017, 8, 1279. [Google Scholar] [CrossRef]
- Wen, J.; Li, P.F.; Ran, F.; Guo, P.C.; Zhu, J.T.; Yang, J.; Zhang, L.L.; Chen, P.; Li, J.N.; Du, H. Genome-wide characterization, expression analyses, and functional prediction of the NPF family in Brassica napus. BMC Genom. 2020, 21, 871. [Google Scholar] [CrossRef]
- Zolfaghari, F.; Khosravi, H.; Shahriyari, A.; Jabbari, M.; Abolhasani, A. Hierarchical cluster analysis to identify the homogeneous desertification management units. PLoS ONE 2019, 14, e0226355. [Google Scholar] [CrossRef]
- Schuster, S.C. Next-generation sequencing transforms today’s biology. Nat. Methods 2008, 5, 16–18. [Google Scholar] [CrossRef]
- Mahmoud, M.; Zywicki, M.; Twardowski, T.; Karlowski, W.M. Efficiency of PacBio long read correction by 2nd generation Illumina sequencing. Genom. 2019, 111, 43–49. [Google Scholar] [CrossRef]
- Wang, P.; Kelly, S.; Fouracre, J.P.; Langdale, J.A. Genome-wide transcript analysis of early maize leaf development reveals gene cohorts associated with the differentiation of C4 Kranz anatomy. Plant J. 2013, 75, 656–670. [Google Scholar] [CrossRef]
- Hunter, N. Meiotic Recombination: The Essence of Heredity. Cold Spring Harb. Perspect. Biol. 2015, 7, a016618. [Google Scholar] [CrossRef] [Green Version]
- Zhao, B.; Cao, J.F.; Hu, G.J.; Chen, Z.W.; Wang, L.Y.; Shangguan, X.X.; Wang, L.J.; Mao, Y.B.; Zhang, T.Z.; Wendel, J.F.; et al. Core cis-element variation confers subgenome-biased expression of a transcription factor that functions in cotton fiber elongation. New Phytol. 2018, 218, 1061–1075. [Google Scholar] [CrossRef] [Green Version]
- Liu, D.; Hu, R.; Palla, K.J.; Tuskan, G.A.; Yang, X. Advances and perspectives on the use of CRISPR/Cas9 systems in plant genomics research. Curr. Opin. Plant Biol. 2016, 30, 70–77. [Google Scholar] [CrossRef] [Green Version]
- Xu, G.; Takahashi, H. Improving nitrogen use efficiency: From cells to plant systems. J. Exp. Bot. 2020, 71, 4359–4364. [Google Scholar] [CrossRef]
- Zhu, J.K. Abiotic Stress Signaling and Responses in Plants. Cell 2016, 167, 313–324. [Google Scholar] [CrossRef] [Green Version]
- Nath, M.; Tuteja, N. NPKS uptake, sensing, and signaling and miRNAs in plant nutrient stress. Protoplasma 2016, 253, 767–786. [Google Scholar] [CrossRef]
- Altschul, S.F.; Gish, W.; Miller, W.; Myers, E.W.; Lipman, D.J. Basic local alignment search tool. J. Mol. Biol. 1990, 215, 403–410. [Google Scholar] [CrossRef]
- Rombel, I.T.; Sykes, K.F.; Rayner, S.; Johnston, S.A. ORF-FINDER: A vector for high-throughput gene identification. Gene 2002, 282, 33–41. [Google Scholar] [CrossRef]
- Yu, C.S.; Chen, Y.C.; Lu, C.H.; Hwang, J.K. Prediction of protein subcellular localization. Proteins 2006, 64, 643–651. [Google Scholar] [CrossRef]
- Tamura, K.; Peterson, D.; Peterson, N.; Stecher, G.; Nei, M.; Kumar, S. MEGA5: Molecular evolutionary genetics analysis using maximum likelihood, evolutionary distance, and maximum parsimony methods. Mol. Biol. Evol. 2011, 28, 2731–2739. [Google Scholar] [CrossRef] [Green Version]
- Hoagland, D.R.; Arnon, D.S. The water culture method for growing plants without soil. Calif. Agric. Exp. Stn. Circ. 1950, 347, 32. [Google Scholar]
- Deng, G.; Liu, L.J.; Zhong, X.Y.; Lao, C.Y.; Wang, H.Y.; Wang, B.; Zhu, C.; Shah, F.; Peng, D.X. Comparative proteome analysis of the response of ramie under N, P and K deficiency. Planta 2014, 239, 1175–1186. [Google Scholar] [CrossRef]
- Untergasser, A.; Cutcutache, I.; Koressaar, T.; Ye, J.; Faircloth, B.C.; Remm, M.; Rozen, S.G. Primer3—New capabilities and interfaces. Nucleic Acids Res. 2012, 40, e115. [Google Scholar] [CrossRef] [Green Version]
- Livak, K.J.; Schmittgen, T.D. Analysis of relative gene expression data using real-time quantitative PCR and the 2(-Delta Delta C(T)) Method. Methods 2001, 25, 402–408. [Google Scholar] [CrossRef]
Figure 1.
Phylogenetic analysis of NPF family. The protein names of arabidopsis, rice, asparagus and agave are labeled in blue, green, red and pink, respectively.
Figure 1.
Phylogenetic analysis of NPF family. The protein names of arabidopsis, rice, asparagus and agave are labeled in blue, green, red and pink, respectively.

Figure 2.
Photographs of agave plants (A, bar = 10 cm), flower (B, bar = 1 cm), fruit (C, bar = 1 cm), nutrient deficiency-induced biomass (D) and morphological features (E, bar = 5 cm) of agave seedlings. L0, L1 and L2 represent shoot, unexpanded leaf and expanded leaf in potted agave plants, respectively. CK, N(-), P(-), K(-) and W in D and E represent that the agave seedlings were cultured with full-, nitrogen free-, phosphorus free-, potassium free-Hoagland nutrient solutions and water, respectively. Shoot (S) and root (R) of agave seedlings are shown in (E).

Figure 3.
Expression pattern of agave NPF genes in different tissues by qRT-PCR. FL, S, L, FR and R represent flower, shoot, leaf, fruit and root, respectively. The genes and tissues were clustered by hierarchical clustering method [30].
Figure 3.
Expression pattern of agave NPF genes in different tissues by qRT-PCR. FL, S, L, FR and R represent flower, shoot, leaf, fruit and root, respectively. The genes and tissues were clustered by hierarchical clustering method [30].

Figure 4.
Expression pattern of agave NPF genes at leaf developmental stages by qRT-PCR. Y-axis represents relative expression level. L0, L1 and L2 of x-axis represent shoot, unexpanded leaf and expanded leaf, respectively. The error bar represents the standard error. * and ** represent that expression level was increased or decreased by more than 3-fold and 10-fold compared with L0, respectively. The expression values of L0 stages were normalized as 1.

Figure 5.
Expression pattern of agave NPF genes under abiotic/biotic stresses by qRT-PCR. Y-axis represents relative expression level. The labels of x-axis represent control, CuSO4 treatment, Pb(NO3)2 treatment, chill treatment and Phytophthora nicotianae Breda inoculation, respectively. The error bar represents the standard error. * and ** represent that expression level was increased or decreased by more than 3-fold and 10-fold compared with control, respectively. The expression values of control were normalized as 1.

Figure 6.
Expression pattern of agave NPF genes under nutrient deficiency by qRT-PCR. Y-axis represents relative expression level. CK, N(-), P(-), K(-) and W of x-axis represent that the agave seedlings were cultured with full-, nitrogen free-, phosphorus free-, potassium free-Hoagland nutrient solutions and water, respectively. The error bar represents the standard error. * and ** represent that expression level was increased or decreased by more than 3-fold and 10-fold compared with CK, respectively. The expression values of control were normalized as 1.


Table 1.
Gene ID, accession, coding sequence length, molecular weight, theoretical isoelectric point (pI) and subcellular localization of agave NPFs.
Table 1.
Gene ID, accession, coding sequence length, molecular weight, theoretical isoelectric point (pI) and subcellular localization of agave NPFs.
| ID | Accession | Coding Sequence (bp) | Predicted Protein (aa) | Molecular Weight | pI | Subcellular Localization |
|---|---|---|---|---|---|---|
| AhNPF2.1 | DN41135_c0_g1_i1 | 1767 | 588 | 65,558.83 | 8.91 | PlasmaMembrane (4.946) |
| AhNPF2.2 | DN48816_c0_g1_i2 | 2400 | 799 | 89,795.73 | 9.29 | PlasmaMembrane (3.655) |
| AhNPF2.3 | DN50815_c0_g2_i3 | 1866 | 621 | 68,836.88 | 8.57 | PlasmaMembrane (4.952) |
| AhNPF3.1 | DN41985_c0_g1_i1 | 1797 | 598 | 66,083.81 | 8.58 | PlasmaMembrane (4.828) |
| AhNPF3.2 | DN49643_c0_g1_i2 | 1788 | 595 | 65,163.86 | 9.11 | PlasmaMembrane (4.727) |
| AhNPF4.1 | DN35785_c0_g1_i1 | 1761 | 586 | 64,956.66 | 8.90 | PlasmaMembrane (4.906) |
| AhNPF4.2 | DN44495_c0_g1_i3 | 1743 | 580 | 63,224.67 | 8.98 | PlasmaMembrane (4.860) |
| AhNPF4.3 | DN46864_c0_g1_i1 | 1782 | 593 | 66,186.76 | 8.21 | PlasmaMembrane (4.872) |
| AhNPF5.1 | DN41592_c0_g1_i2 | 1668 | 555 | 61,626.22 | 5.80 | PlasmaMembrane (4.911) |
| AhNPF5.2 | DN44315_c0_g1_i1 | 1611 | 536 | 59,762.91 | 6.47 | PlasmaMembrane (4.969) |
| AhNPF5.3 | DN46789_c0_g1_i1 | 1602 | 533 | 59,330.15 | 8.77 | PlasmaMembrane (4.937) |
| AhNPF5.4 | DN47034_c0_g2_i1 | 1734 | 577 | 63,963.40 | 8.70 | PlasmaMembrane (4.971) |
| AhNPF5.5 | DN48393_c3_g3_i2 | 1761 | 586 | 65,431.38 | 9.05 | PlasmaMembrane (4.836) |
| AhNPF6.1 | DN42911_c0_g2_i1 | 1737 | 578 | 62,801.28 | 9.00 | PlasmaMembrane (4.919) |
| AhNPF7.1 | DN45587_c0_g2_i1 | 1854 | 617 | 68,530.90 | 5.77 | PlasmaMembrane (4.917) |
| AhNPF8.1 | DN41583_c0_g1_i1 | 1377 | 458 | 50,193.55 | 6.82 | PlasmaMembrane (4.782) |
| AhNPF8.2 | DN43232_c0_g2_i2 | 1773 | 590 | 65,292.70 | 5.87 | PlasmaMembrane (4.876) |
| AhNPF8.3 | DN50692_c0_g1_i8 | 1701 | 566 | 62,878.70 | 7.09 | PlasmaMembrane (4.754) |
| AhNPF8.4 | DN51386_c0_g1_i1 | 1758 | 585 | 64,615.74 | 6.18 | PlasmaMembrane (4.838) |
Table 2.
Primers used for qRT-PCR analysis.
| ID | Forward Primer | Reverse Primer | Product Size (bp) |
|---|---|---|---|
| AhNPF2.1 | GCGCAGACCAATTCAATCCT | CGTGCCGATGAAGAAGAAGG | 206 |
| AhNPF2.2 | TCTCCTTCTTCCAAGCCCTG | AGCTCACCTGATAGACACCG | 160 |
| AhNPF2.3 | GCTTCCAAATTCCTCCTGCC | CACAATCATGGACAGAGCCG | 182 |
| AhNPF3.1 | CCTCGTTGCTGGATTCATCG | CTCCCCGCTGATATCACCAT | 240 |
| AhNPF3.2 | TGCTCTAATCGCCGACTCAT | ACCAATGCAAGTCAGGAGGA | 208 |
| AhNPF4.1 | ATCTGCCCGTCAAACTCTGA | CTTGCTCAACCTGTGTCACC | 181 |
| AhNPF4.2 | TCATCCCTGAAGCCTCCATC | GTGTCTTCGTCGAACTGCTC | 173 |
| AhNPF4.3 | TGGTGGAGAGCAAGAGAAGG | ACCCGAATGAGTACGAGCAA | 201 |
| AhNPF5.1 | ATCCTCCATTTTGCCAAGCG | GACCAGAACCGAGACCATCA | 223 |
| AhNPF5.2 | TGGCTGGTGTGGAGAGATTT | CAAGTCCCGCAACATAGAGC | 222 |
| AhNPF5.3 | ACCAACACCTGCGACAAATC | CTCCACTACAGAGGCCACAA | 199 |
| AhNPF5.4 | ATTGCGAGCGAGACCAAAAG | TCTCAGCAACCTCAACACCT | 187 |
| AhNPF5.5 | AGATAACGTGGGGTGGACTG | AGCTCCTTGGGGTCATTAGG | 195 |
| AhNPF6.1 | CAATTCGACGACAAGGACCC | AGGACCATCGATATGCAGCA | 170 |
| AhNPF7.1 | ACCTGGGCTCTCTCTTTTCC | TTGACCGTCCATTTCCTCGA | 214 |
| AhNPF8.1 | ATCAAACGCCTCCAGATTGC | CGTCGTCACAAGAGCAAGAG | 204 |
| AhNPF8.2 | GCAAGATAACTGCGGATGGG | AGAGAACTGTCAAGAGGGGC | 195 |
| AhNPF8.3 | GCATAATCTTCGCCACGGTT | CTCATGTCCGGTGAACTTGC | 200 |
| AhNPF8.4 | CCGCAGTCTACAGCCAAATC | AAGCCTCTCTCTTTGCCAGT | 193 |
| PP2A | CCTCCTCCTCCTTCGGTTTG | GCCATGAATGTCACCGCAGA | 235 |
Publisher’s Note: MDPI stays neutral with regard to jurisdictional claims in published maps and institutional affiliations. |
© 2022 by the authors. Licensee MDPI, Basel, Switzerland. This article is an open access article distributed under the terms and conditions of the Creative Commons Attribution (CC BY) license (https://creativecommons.org/licenses/by/4.0/).
Share and Cite
MDPI and ACS Style
Tan, S.; Liang, Y.; Huang, Y.; Xi, J.; Huang, X.; Yang, X.; Yi, K. Phylogeny and Expression Atlas of the NITRATE TRANSPORTER 1/PEPTIDE TRANSPORTER FAMILY in Agave. Plants 2022, 11, 1434. https://doi.org/10.3390/plants11111434
AMA Style
Tan S, Liang Y, Huang Y, Xi J, Huang X, Yang X, Yi K. Phylogeny and Expression Atlas of the NITRATE TRANSPORTER 1/PEPTIDE TRANSPORTER FAMILY in Agave. Plants. 2022; 11(11):1434. https://doi.org/10.3390/plants11111434
Chicago/Turabian StyleTan, Shibei, Yanqiong Liang, Yanlei Huang, Jingen Xi, Xing Huang, Xiaohan Yang, and Kexian Yi. 2022. "Phylogeny and Expression Atlas of the NITRATE TRANSPORTER 1/PEPTIDE TRANSPORTER FAMILY in Agave" Plants 11, no. 11: 1434. https://doi.org/10.3390/plants11111434
Note that from the first issue of 2016, this journal uses article numbers instead of page numbers. See further details here.