Article

Roles for the RNA-Binding Protein Caper in Reproductive Output in Drosophila melanogaster

Department of Biology, University of Colorado Colorado Springs, 1420 Austin Bluffs Parkway, Colorado Springs, CO 80918, USA
*
Author to whom correspondence should be addressed.
J. Dev. Biol. 2023, 11(1), 2; https://doi.org/10.3390/jdb11010002
Submission received: 22 July 2022 / Revised: 15 December 2022 / Accepted: 20 December 2022 / Published: 23 December 2022
(This article belongs to the Special Issue Feature Papers in Journal of Developmental Biology II)

Abstract

:
RNA binding proteins (RBPs) play a fundamental role in the post-transcriptional regulation of gene expression within the germline and nervous system. This is underscored by the prevalence of mutations within RBP-encoding genes being implicated in infertility and neurological disease. We previously described roles for the highly conserved RBP Caper in neurite morphogenesis in the Drosophila larval peripheral system and in locomotor behavior. However, caper function has not been investigated outside the nervous system, although it is widely expressed in many different tissue types during embryogenesis. Here, we describe novel roles for Caper in fertility and mating behavior. We find that Caper is expressed in ovarian follicles throughout oogenesis but is dispensable for proper patterning of the egg chamber. Additionally, reduced caper function, through either a genetic lesion or RNA interference-mediated knockdown of caper in the female germline, results in females laying significantly fewer eggs than their control counterparts. Moreover, this phenotype is exacerbated with age. caper dysfunction also results in partial embryonic and larval lethality. Given that caper is highly conserved across metazoa, these findings may also be relevant to vertebrates.

Graphical Abstract

1. Introduction

Post-transcriptional gene regulation is central to the development of both the germline and nervous system [1,2]. RNA binding proteins (RBPs) facilitate various aspects of post-transcriptional gene regulation including alternative splicing, polyadenylation of mRNAs, nuclear export, RNA localization and translational control. RBPs were extensively studied for their roles in Drosophila oogenesis and embryonic axis determination. In oogenesis, proper localization and the timing of translation of numerous mRNAs, such as nanos (nos), bicoid (bcd), oskar (osk) and gurken (grk), are critical to ensuring appropriate oocyte development [3,4,5,6,7,8]. Indeed, these maternal mRNAs were found to be regulated by myriad RBPs, including Syncrip, Bruno, Staufen, Squid and many others [3,9,10,11]. Similarly, many mRNAs are post-transcriptionally regulated during embryogenesis. The importance of the regulation of localization and translation of these mRNAs is underscored by the fact that their aberrant expression results in abnormalities in polarity and embryonic patterning [12,13,14,15,16]. For instance, when nos is inappropriately localized to the anterior of the embryo, an abdomen develops in place of anterior structures [12].
RBPs also have well established roles in neurogenesis. For example, using an RNA interference screen for roles of RBPs in dendrite morphogenesis, we previously found that at least 88 RBPs regulate dendrite formation in Drosophila sensory neurons. Furthermore, a subset of these have conserved roles for sensory dendrite development in C. elegans [17,18,19,20]. Additionally, many mRNAs, such as nos, are also localized to Class IV da neuron dendrites, and their inappropriate localization or translation results in dendritic patterning defects [21,22,23]. Similar to Nos, myriad RBPs are known to play roles in both the germline and the nervous system. For example, the gene Fmr1 encodes the Fragile X Messenger Ribonucleoprotein (FMRP) whose dysfunction is causative for Fragile X Syndrome, which is characterized by many different aberrant neuronal phenotypes including intellectual disability [2]. However, FMRP dysfunction is also implicated in primary ovarian insufficiency and germline tumor formation in humans [24]. Similarly, the RBP Pumilio (Pum), which was originally identified for its role in Drosophila oogenesis, was also implicated in development and function of the nervous system [25,26,27,28]. Indeed, mutations in human pum orthologs are associated with primary ovarian insufficiency, as well as adult-onset ataxia and seizures [24,29].
We previously identified the highly conserved RBP-encoding gene caper for a role in dendrite and axon morphogenesis of sensory and motor neurons, respectively, in Drosophila. Furthermore, while Caper is broadly expressed throughout embryogenesis, including within the germline, nothing is known about Caper function during oogenesis [30,31]. Importantly, caper is highly conserved across metazoa, from yeast to C. elegans and humans [32]. Drosophila caper has two human orthologs, RBM39 and RBM23. RBM39 is expressed in the human ovary and within the ovaries and testes of mice [33,34]. Furthermore, it is ubiquitously expressed in zebrafish during embryogenesis [35]. Here we show that Caper is expressed during Drosophila oogenesis and affects viability at multiple developmental stages. Additionally, we find that caper plays a role in fecundity, as caper-deficient animals develop smaller ovaries and have reduced reproductive output, as compared to controls.

2. Materials and Methods

2.1. Fly Lines

The caperCC01391 hypomorphic allele utilized in our experiments, referred to here as caper−/−, was previously described by Olesnicky et al. [30]. The following stocks were obtained from the Bloomington Stock Center: y1 sc* v1 sev21; P{TRiP.HMC03924}attP40; UAScaperRNAiHMC03924 [36]; {w[+mC]=Act5C-GAL4}y[1] w[*]; P17bFO1/TM6B, Tb[1]; UAScaperRNAi GLC01382 y1 sc* v1 sev21; P{TRiP.GLC01382}attP2/TM3, Sb1; P{w[+mC]=UAS-Dcr-2.D}1, w[1118]; P{w[+mC]=GAL4-nos.NGT}40.
Flies for experiments utilizing RNAi lines were maintained at 25 °C with a 12-h light/dark cycle. Experiments utilizing genetic mutations were performed at room temperature unless otherwise stated. Since the caperCC01391 hypomorphic mutant allele was created in a yw background, yw served as the control [30,37]. For all RNA interference experiments, Gal4 drivers were outcrossed to yw, and the progeny heterozygous for the Gal4 driver served as controls.

2.2. Immunoblotting

Ovaries were dissected on ice from 5 day old yw and caper−/− females. Lysates were prepared using 20 ovaries and lysing them in 100 ul of lysis buffer (Urea buffer: 0.125 M Tris-HCl pH 6.8, 4% SDS, 20% glycerol, 5 M urea, 0.1 M DTT, 0.01% bromophenol blue). The lysates were produced using a FisherBrand® motorized tissue grinder and RNAse-free disposable pellet pestles. The grinder was used to homogenize the tissue for 30 s, which was then boiled at 100 °C for 5 min. Lysates were centrifuged at 14,000 rpm for 20 min at 4 °C to remove cellular debris. Lysates were then boiled at 100 °C for an additional 5 min and fractionated in Bio-Rad 4–15% Mini-PROTEAN® TGXTM precast gels and transferred to ThermoScientific PVDF membranes by electroblotting at 30 mA overnight at 4 °C. The membranes were then cut between the 50 kDa and 70 kDa marker to detect α-Tubulin (~50 kDa) and Caper (~75–80 kDa). The following primary antibodies were used to incubate for 2 h at room temperature: anti-α-Tubulin 1:25,000 (Sigma-Aldrich T9026) or rabbit anti-Caper1 1:15,000 (GenScript). The following secondary antibodies were used to incubate for an hour at room temperature: peroxidase conjugated to goat anti-mouse IgG, Fc fragment specific (Jackson ImmunoResearch 115-035-008) at a 1:30,000 dilution or peroxidase conjugated to goat anti-rabbit (Abcam ab6721) at a 1:20,000. All antibodies were diluted in 1X TBS, 0.1% Tween 20 and 5% bovine serum albumin (VWR International). Membranes were visualized by chemiluminescence using the Azure Biosystems Radiance Q chemiluminescent substrate with Azure Biosystems C400 imager. Quantification of blots was performed using FIJI (Fiji Is Just ImageJ) Gel analysis tools. The ratio of the detection for Caper compared to the detection of α-Tubulin was used as a form of normalization to account for differences in loading.

2.3. Immunofluorescence

Ovaries were dissected on ice from 3–5 day old females in PBS and, subsequently, fixed in 4% paraformaldehyde in PBS for 20 min at room temperature. Ovaries were incubated in Image-iT FX Signal Enhancer (Invitrogen, Waltham, MA, USA) for 30 min at room temperature in the dark and subsequently blocked for 1 h in 5% normal goat serum (NGS) in PBS. Caper 3 antibody [31] was incubated overnight at 4 degrees Celsius at a concentration of 1:250 in 5% NGS in PBS. Alexa flour 546 (Invitrogen) was incubated overnight at 4 degrees Celsius at 1:500.

2.4. Fecundity Assay

caper−/− and yw virgin females were collected on the day of eclosion and set up in four crosses: caper−/− females with caper−/− males, caper−/− females with yw males, yw females with caper−/− males, and yw females with yw males. In total, 25 vials were set up for each cross, with 5 flies of each sex placed in each vial. Flies were transferred daily into new vials, at which point the vials containing the previous day’s eggs were briefly frozen at −20 °C to arrest development. Eggs were then counted and average output per female was calculated for each vial. The remaining number of living males and females in a vial was recorded, and a vial was removed from the daily averages if all of either sex within it had died. The experiment was terminated when one of the four cross combinations no longer had any vials remaining. Results were verified using the RNAi line UAScaperRNAi GLC01382 driven by P{w[+mC]=UAS-Dcr-2.D}1, w[1118]; P{w[+mC]=GAL4-nos.NGT}40. The driver was also outcrossed to yw to serve as a control.

2.5. Determining Fertilization and Embryonic Lethality

The same four crosses with caper−/− and yw described above were used for these experiments. For embryo analysis experiments, 50 parent flies of each sex were placed in embryo collection cages. Flies were permitted to lay for about 12 h on apple juice collection plates with a 50:50 mixture of yeast and water, at which point the plates were removed and set aside to age for another 12 h. A 50% bleach solution was then added dropwise to embryos for two minutes to dechorionate them, after which they were fixed for 20 min in a 1:4 solution of 4% paraformaldehyde:heptane. Embryos were then devitellinized with methanol, stained with the nuclear marker DAPI, and scored with a fluorescence microscope to determine the stage in which they arrested development. Given that embryos were allowed to develop from 12–24 h, embryos that failed to develop to at least stage 14 were presumed dead.

2.6. Larval and Pupal Lethality Assay

Larvae were collected at the third instar stage, separated by sex, and plated on apple juice plates with a 50:50 mixture of yeast and water available for additional nutrition. Larvae were scored for lethality daily and plates were sprayed with deionized water as needed to avoid desiccation. The remaining larvae were subsequently allowed to pupate and were assessed for lethality at the pupal stage in the same manner.

2.7. Mating Assay

Mating experiments were performed as described in [38], with some modifications due to the difference in Drosophila species. Virgin females and males for each genotype tested were collected and allowed to age to four days to ensure full reproductive maturity [39]. 15 each of caper−/− and yw males and females were then placed into the mating chamber, which was an 8″ × 1″ dish that had 4 holes through which an aspirator could extract flies. This experimental setup was utilized 10 times to achieve an adequate sample size. When flies were seen mating, they were observed for 30 s to ensure true copulation, at which point they were extracted via aspirator. When only half of the flies remained in a given chamber, or two hours had passed, the experiment was stopped.
For the caper knockdown experiment, the experimental setup was altered so that 30 females of the UAScaperRNAiGLC01382 driven by nanosGal4, as described above, were placed in a chamber with 15 caper−/− and 15 yw males. Then, 30 females of the driver outcrossed to yw were placed in a separate, similar chamber with the same number of males as a control due to these females being indistinguishable from the RNAi knockdown females by eye color. Four such chambers were set up for each of these two female genotypes, and arenas were observed for a full two hours. As before, mating pairs were observed for copulation and then removed. Because differences in mating number for each female genotype, rather than mate choice, was the primary focus of this experiment, these assays were not ceased early if half of the flies had mated.

2.8. Ovary Size Analysis

Ovaries were dissected on ice for yw, caper−/−, UAScaperRNAiGLC01382 driven by nanosGal4, and nanosGal4 ctl females at day 3, day 5× and day 14 post-eclosion. Dissected ovaries were immediately placed on a slide and imaged using Brightfield setting at 5 magnification using Leica DM4-B microscope. Ovary measurements were taken in FIJI by drawing a perimeter around the ovary and using the measure tool to calculate the area.

2.9. Statistical Analyses

Fecundity data were analyzed using a generalized linear mixed model (GLMM) with a negative binomial error distribution (NB1 parameterization) using the R package ‘glmmTMB’ [40]. The full factorial model included female line, male line and day as factors. Replicate was treated as a random effect to account for repeated measurements from the same set of flies over time. Model fit was assessed using diagnostic plots generated by the R package ‘DHARMa’ [41]. An anova table was generated from model results using the R package ‘car’ [42]. Mortality at different developmental stages was analyzed using GLMs with a binomial error distribution and logit link function. However, the experiment comparing larval survival of caper−/− and controls was analyzed using Fisher’s exacts tests because the fact that no female control larvae died hindered estimation of the glm model due to quasi-complete separation. The glm model for embryo mortality included cross as a factor, while larval and pupal mortality analyses included both cross and sex as factors as well as the interaction between these variables. Anova tables were generated from model results using the R package ‘car’ [42]. Post hoc comparisons were analyzed with the R package ‘emmeans’ using Tukey’s adjustment [43]. Male and female mating frequency was analyzed by GLMM with a binomial error distribution and logit link function using the R package ‘lme4’ [44]. Replicate was treated as a random variable.
Ovary size data was analyzed with a full factorial linear mixed effects model using the R package ‘lme4’ [44]. The model included factors for genotype and day and their interaction. Fly id was treated as a random effect since both ovaries were measured for each fly. Anova tables were generated from model results using the R package ‘car’ [42]. Post hoc comparisons were analyzed with the R package ‘emmeans’ using Tukey’s adjustment [43].

3. Results

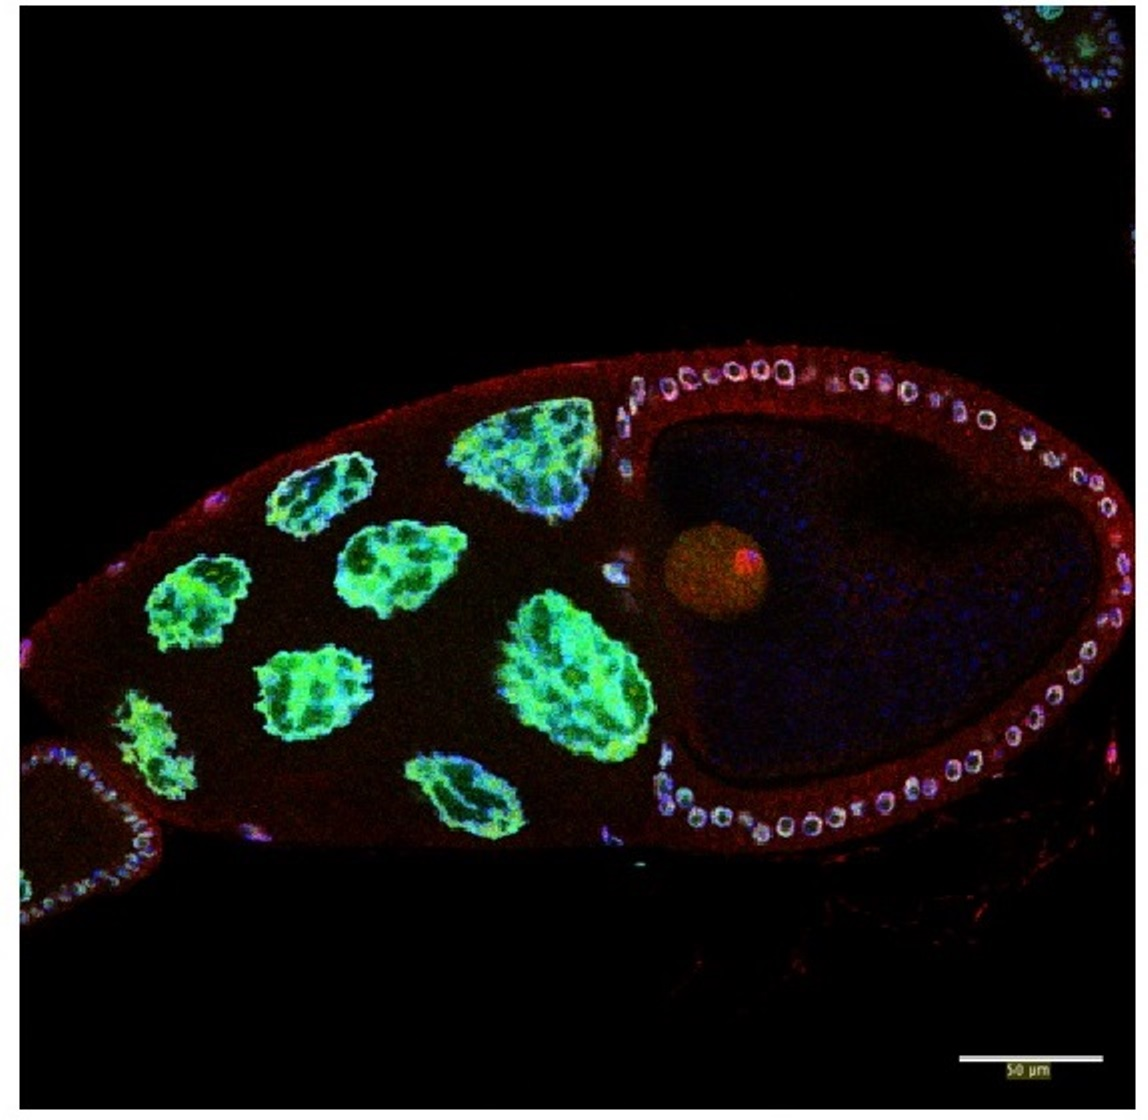
3.1. Caper Is Expressed during All Stages of Oogenesis

We previously showed that Caper is widely expressed during embryogenesis, including within the nervous system and within pole cells [30]. To determine whether Caper is also expressed during oogenesis, we performed anti-Caper immunofluorescence on ovarioles derived from yw females. We find that Caper protein is expressed throughout all stages of oogenesis including within the germarium. Caper is detected within the nuclei of the cells of the germarium, as is expected for a splicing factor. Throughout stages 1–4 of oogenesis, Caper protein is detected within the nuclei of nurse cells and follicle cells. In stage five and six egg chambers, in addition to expression within nurse cell and follicle cell nuclei, we detect Caper protein within the cytoplasm of the oocyte and within the oocyte nucleus. Furthermore, Caper can be detected in large puncta in the cytoplasm of nurse cells. In stage seven ovarioles and beyond, Caper protein becomes predominantly localized to the oocyte nucleus and is only weakly detected within the oocyte cytoplasm. However, Caper expression remains strong within the nuclei of follicle and nurse cells (Figure 1).
To verify these results, we utilized our hypomorphic caper mutant allele, which was generated using a protein trap that results in the fusion of GFP to the Caper protein, and can be used to visualize Caper protein expression [30,37]. Consistent with the expression pattern in yw ovarioles stained with an anti-Caper antibody, Caper::GFP is detected in the nuclei of the germarium and within the nuclei of nurse cells and follicle cells throughout oogenesis. While Caper::GFP is also detected within the nucleus of the oocyte, we do not see enrichment of Caper::GFP within the cytoplasm of the oocyte (Figure 1). Since the protein trap results in the inclusion of a GFP encoding exon at the beginning of the Caper protein, it remains possible that the insertion of GFP into the Caper protein disrupts the cytoplasmic localization of Caper. Furthermore, immunoblotting for Caper in ovaries dissected from caper−/− and yw females five days post-eclosion shows that there is not a significant difference in the expression level of Caper in the ovaries between the two genotypes (caper−/− Caper/alpha-Tubulin ratio = 0.744, yw Caper/alpha-Tubulin ratio = 0.828; t-Test, t-value = 0.72, P = 0.5114; Figure S1). This suggests that the mechanism of dysfunction in the caper−/− lines is not the result of differential expression but rather due to the insertion of the GFP coding sequence within the caper open reading frame, which likely interferes with protein function. Indeed, while Caper was previously implicated as a splicing factor and would, therefore, be expected to localize to the nucleus, we have shown that Caper also colocalizes with FMRP in the cytoplasm of neurons [31]. Furthermore, two caper orthologs, RBM39/Caperα and RBM23/Caperβ are present in the human genome and show both nuclear and cytoplasmic expression [45,46]. SR proteins, which play roles in the regulation of spliceosome assembly and splice site selection, are known to shuttle between the nucleus and cytoplasm. This shuttling is likely regulated by the phosphorylation of SR proteins. Given that Caper is an SR-like protein, it is possible that its subcellular localization may also be regulated by phosphorylation states. Furthermore, it has been shown using the parasitic nematode Ascaris lumbricoides, that SR proteins are hyperphosphorylated and remain within the cytoplasm until the maternal to zygotic transition of embryogenesis. However, upon the initiation of zygotic transcription, SR proteins become partially dephosphorylated and translocate into the nucleus [47].

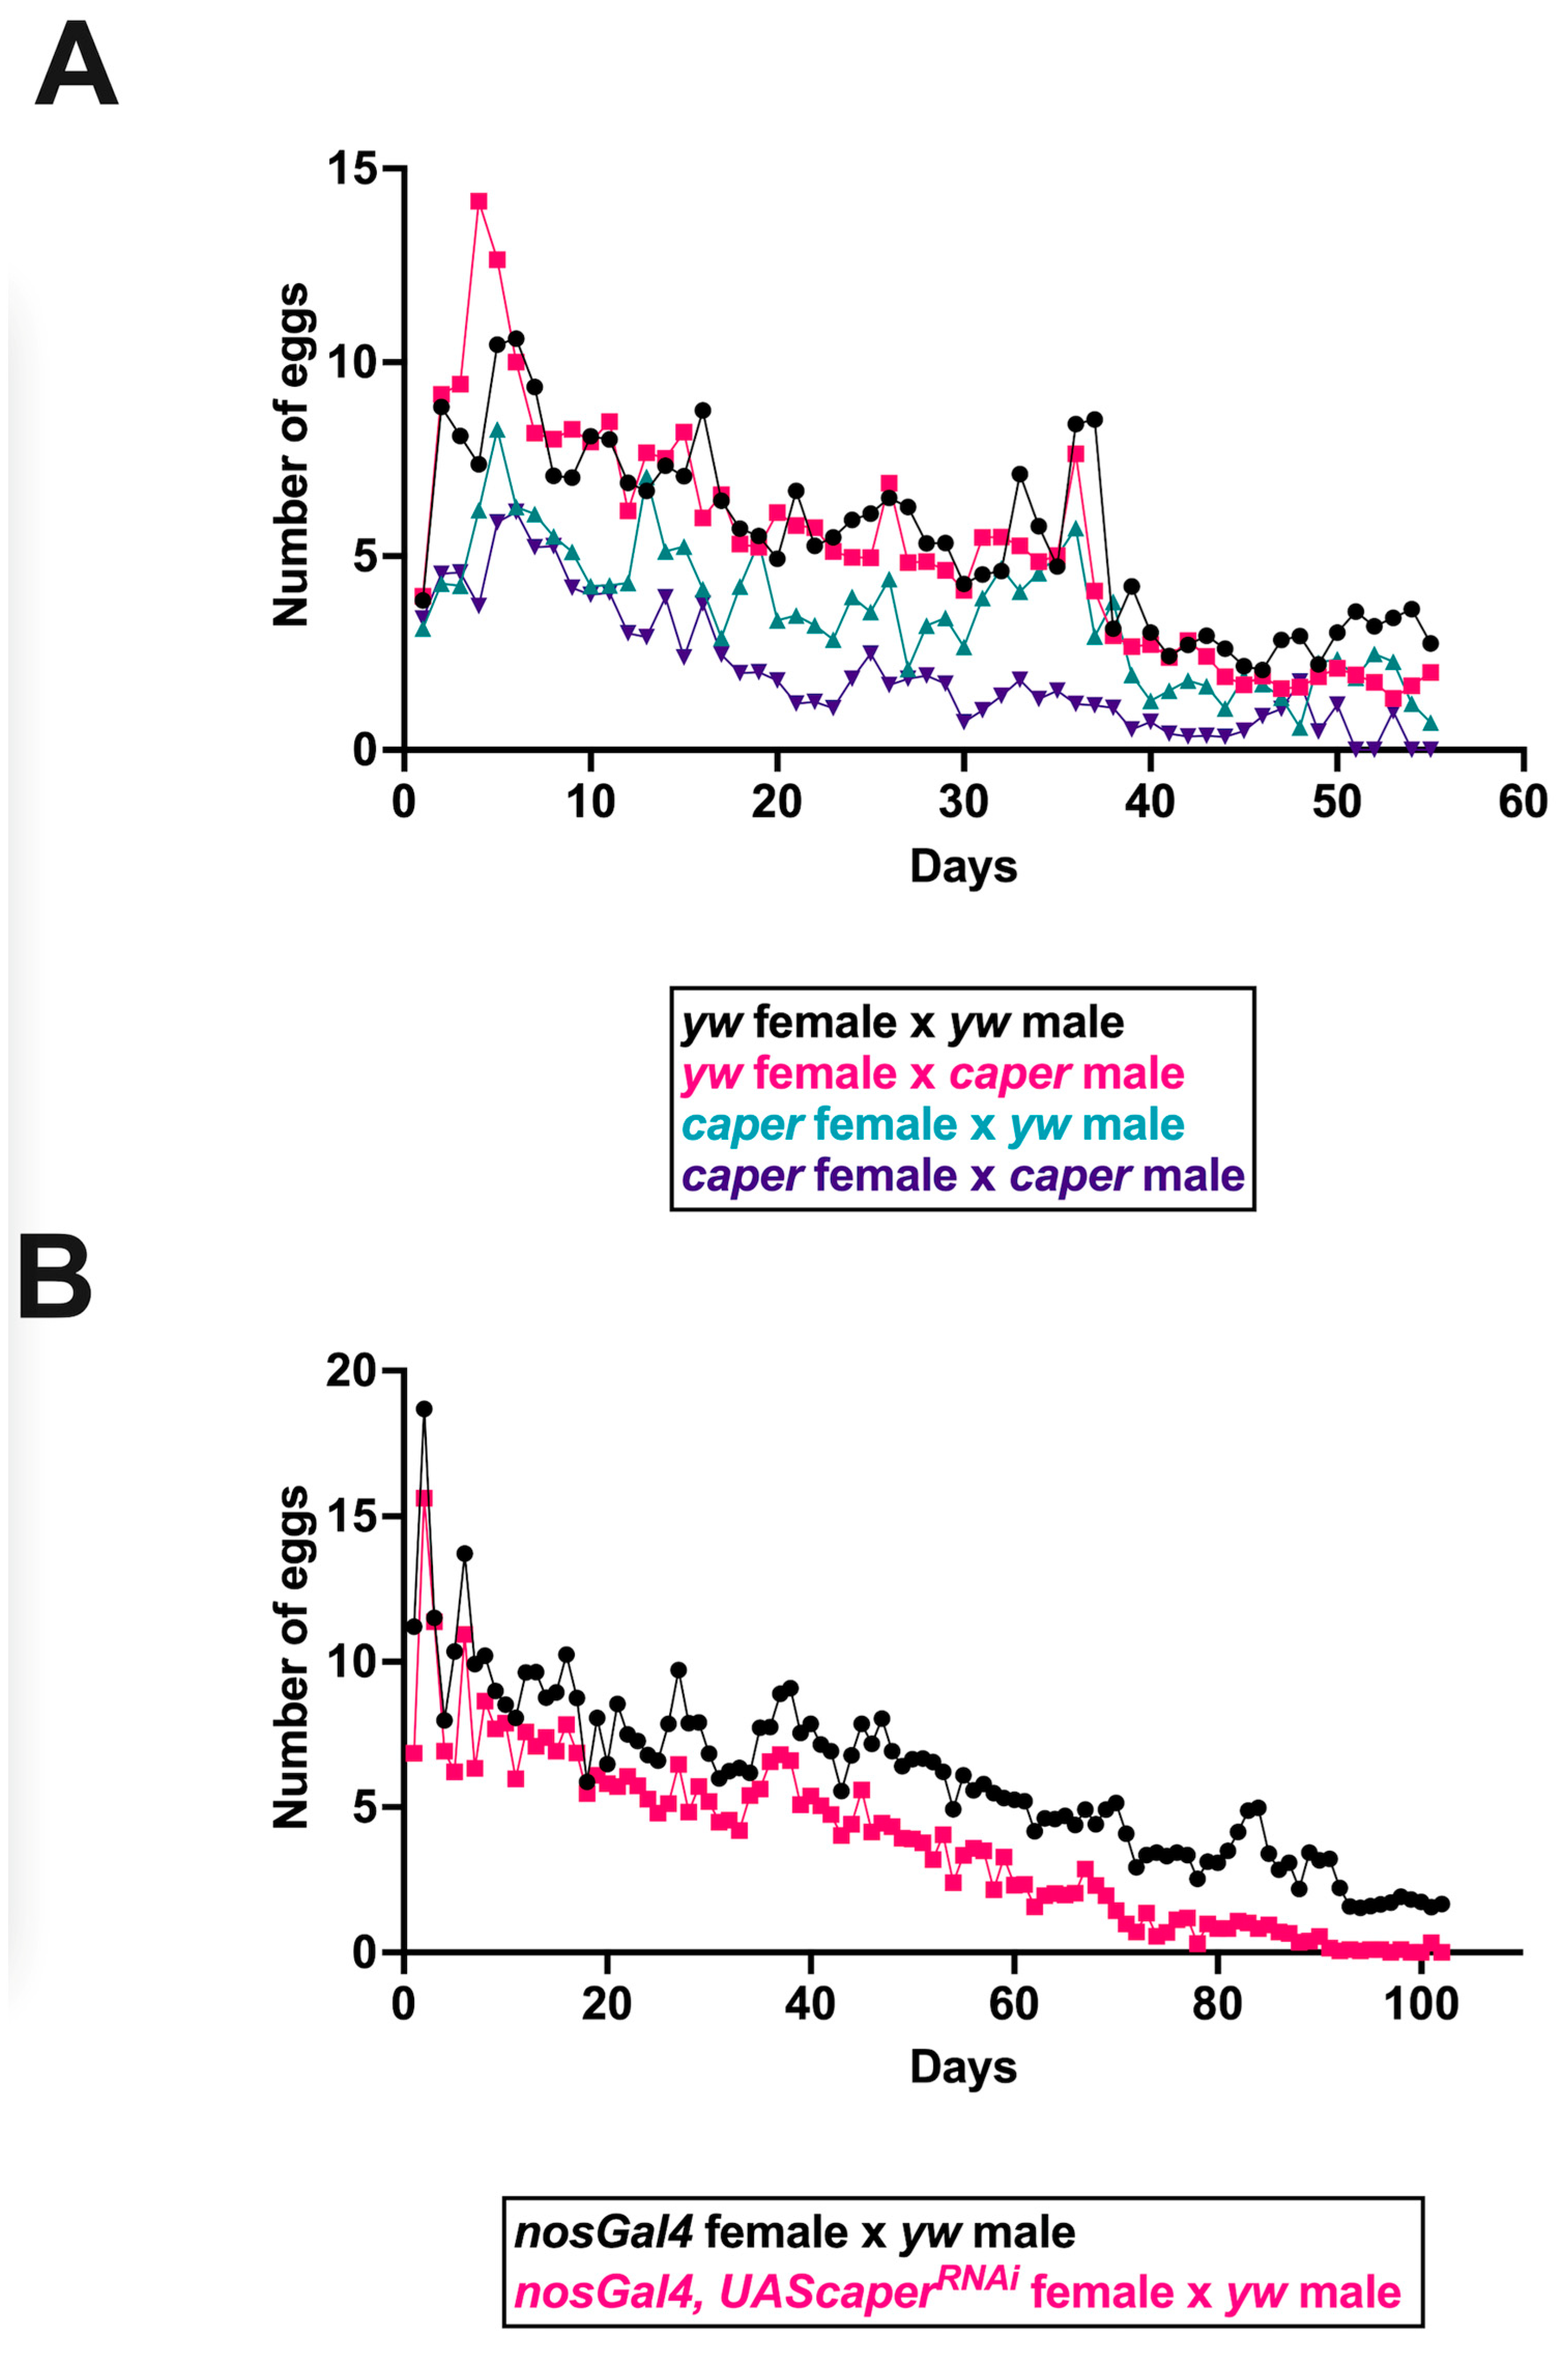
3.2. Caper Dysfunction Results in Lowered Reproductive Output for Females

A previous large scale RNA interference screen for germline stem cell maintenance identified caper as important for germline development and germ cell survival. caper knockdown was shown to severely reduce the germline in Drosophila females [48]. We, therefore, compared ovariole morphology and the reproductive output of caper−/− females and controls. We did not detect aberrant ovariole patterning at any stages in caper−/− females as compared to controls (Figure 1). We have previously shown that caper dysfunction results in several aging phenotypes [31]. Since a decline in reproductive output is also often associated with aging, we investigated whether reproductive output over the lifespan was affected by caper dysfunction. We set up crosses between all combinations of caper−/− and yw control males and females and then measured the number of eggs laid daily over the lifespan of females. In each of the four genotypic pairings, 25 vials of 5 females each were scored, and females were permitted to continuously mate with males throughout their lifespans. This analysis revealed a significant female x male x day interaction (GLMM: χ2 = 35.4, p = 2.70 × 10⁻⁹; Figure 2). Crosses between caper−/− females and caper−/− males had the lowest reproductive output, and the rate of decline with age was more rapid compared to the other three crosses (Figure 2). The cross between caper−/− females and control males also showed an overall reduction in reproductive output relative to crosses involving control females, although the rate of decline with age was similar (Figure 2). Overall, these results indicate that caper dysfunction results in reduced female fecundity regardless of the genotype of the male mating partner. Moreover, there appears to be a synergistic interaction between mutant males and females where reproductive output is further reduced in this cross and declines more rapidly with age.
To confirm these results, caper was knocked down using RNA interference (RNAi) driven by the germline specific nanosGal4 driver. nanosGal4+/−; UAScaperRNAi+/− females and nanosGal4+/− control females were mated to yw males, and their reproductive output was recorded over the course of their lifespan. As above, all 125 females utilized for each genotype were provided males to continuously mate with for the duration of the experiment. Similar to caper hypomorphic mutant females, caper knockdown in the female germline resulted in lower reproductive output compared to controls, and this phenotype was exacerbated by age (GLMM: genotype × day interaction, χ2 = 240.0, p = 2.20 × 10⁻¹⁶; Figure 2).

3.3. Caper Dysfunction Results in Partial Embryonic and Larval Lethality

To determine whether caper dysfunction might also affect fertilization or embryonic viability, caper−/− embryos, caper+/− embryos (derived from caper−/− and yw females mated to yw and caper−/− males, respectively) were collected, aged 12–24 h and stained with DAPI to determine if eggs were successfully fertilized and the age at which development was arrested. While we did not detect unfertilized eggs in any of the crosses, significantly more embryos from caper−/− males and females failed to complete embryonic development when compared to yw control and caper+/− embryos (GLM, χ2 = 50.7, p = 5.62 × 10⁻¹¹: Figure 3). In particular, we find that caper−/− embryos die significantly more than yw embryos (caper−/− n = 696, 7.47% dead; yw n = 759, 1.71% dead; Tukey’s test: z-ratio = −4.9, p = 6.58 × 10⁻⁶) and caper +/− embryos derived from caper mutant females outcrossed to yw males (n = 793, 3.53% dead; Tukey’s test: z-ratio = −3.3, p = 0.0055) or yw females outcrossed to caper mutant males (Tukey’s test: z-ratio = −5.4, p = 3.45 × 10⁻⁷). Furthermore, significantly more caper+/− embryos derived from caper mutant females outcrossed to yw males died than embryos derived from yw females outcrossed to caper mutant males (n = 834, 1.20% dead; Tukey’s test: z-ratio = −3.0, p = 0.016). Additionally, we found that the majority of embryos died before stage 11, with most caper−/− embryos dying between the embryonic development stages four and seven based on the embryonic stages described by Campos-Ortega and Hartenstein [49]. This is of particular interest since these stages correspond to the maternal to zygotic transition (MTZ) when splicing factors begin to remove introns from zygotically expressed genes and are known to change their subcellular localization from the cytoplasm to the nucleus [47,50,51]. We conclude that caper is dispensable for fertilization but is partially required for embryonic viability.
Significantly more caper+/− embryos derived from caper mutant females outcrossed to yw males died than embryos derived from yw females outcrossed to caper mutant males, which suggests a maternal effect for caper. Nonetheless, the rate of lethality was not different from yw embryos in either of these reciprocal crosses. We, therefore, examined embryonic lethality in embryos derived from nanosGal4+/−; UAScaperRNAi+/− females and nanosGal4+/- control females mated to yw males to better determine if maternal caper function is required for embryonic viability. We find that embryos derived from nanosGal4+/- control females die 1.6% of the time, whereas embryos derived from females with caper knocked down specifically within the germline die 5% of the time (n = 540 for controls and n = 517 for embryos derived from nanosGal4+/−; UAScaperRNAi+/− females (GLM: χ2 = 9.7, p = 0.0019; Figure 3). These results confirm that caper maternal function is partly required for embryonic viability.
In some instances, if dysfunction in a gene causes increased lethality at one developmental stage, this effect can also be observed in other stages, as in the cases of the genes RACK1 and amontillado [52,53]. To determine if the partial lethality observed in caper−/− and caper knockdown embryos was present in any subsequent developmental stages, caper−/− and yw larvae and pupae were examined and scored for viability in a sex-specific manner. No difference was observed in the survival of either sex at the pupal stage (GLM: genotype × sex, χ2 = 2.7, p = 0.1007; genotype, χ2 = 0.1, p = 0.7262; Table 1); however, fewer caper−/− female larvae survived to reach pupariation than their control counterparts (Fisher’s exact test: p = 0.0006). There was no difference in survival of males through the larval stages (Fisher’s exact test: p = 0.2782; Table 1). These results suggest that caper is necessary for female survival at the larval stages. However, knockdown of caper driven by ActinGal4 does not result in a significant difference in viability at the larval (GLM: genotype × sex, χ2 = 2.9, p = 0.0905; genotype, χ2 = 1.6, p = 0.2035) or pupal stages (GLM: genotype × sex, χ2 = 0.2, p = 0.6390; genotype, χ2 = 1.8, p = 0.1825).

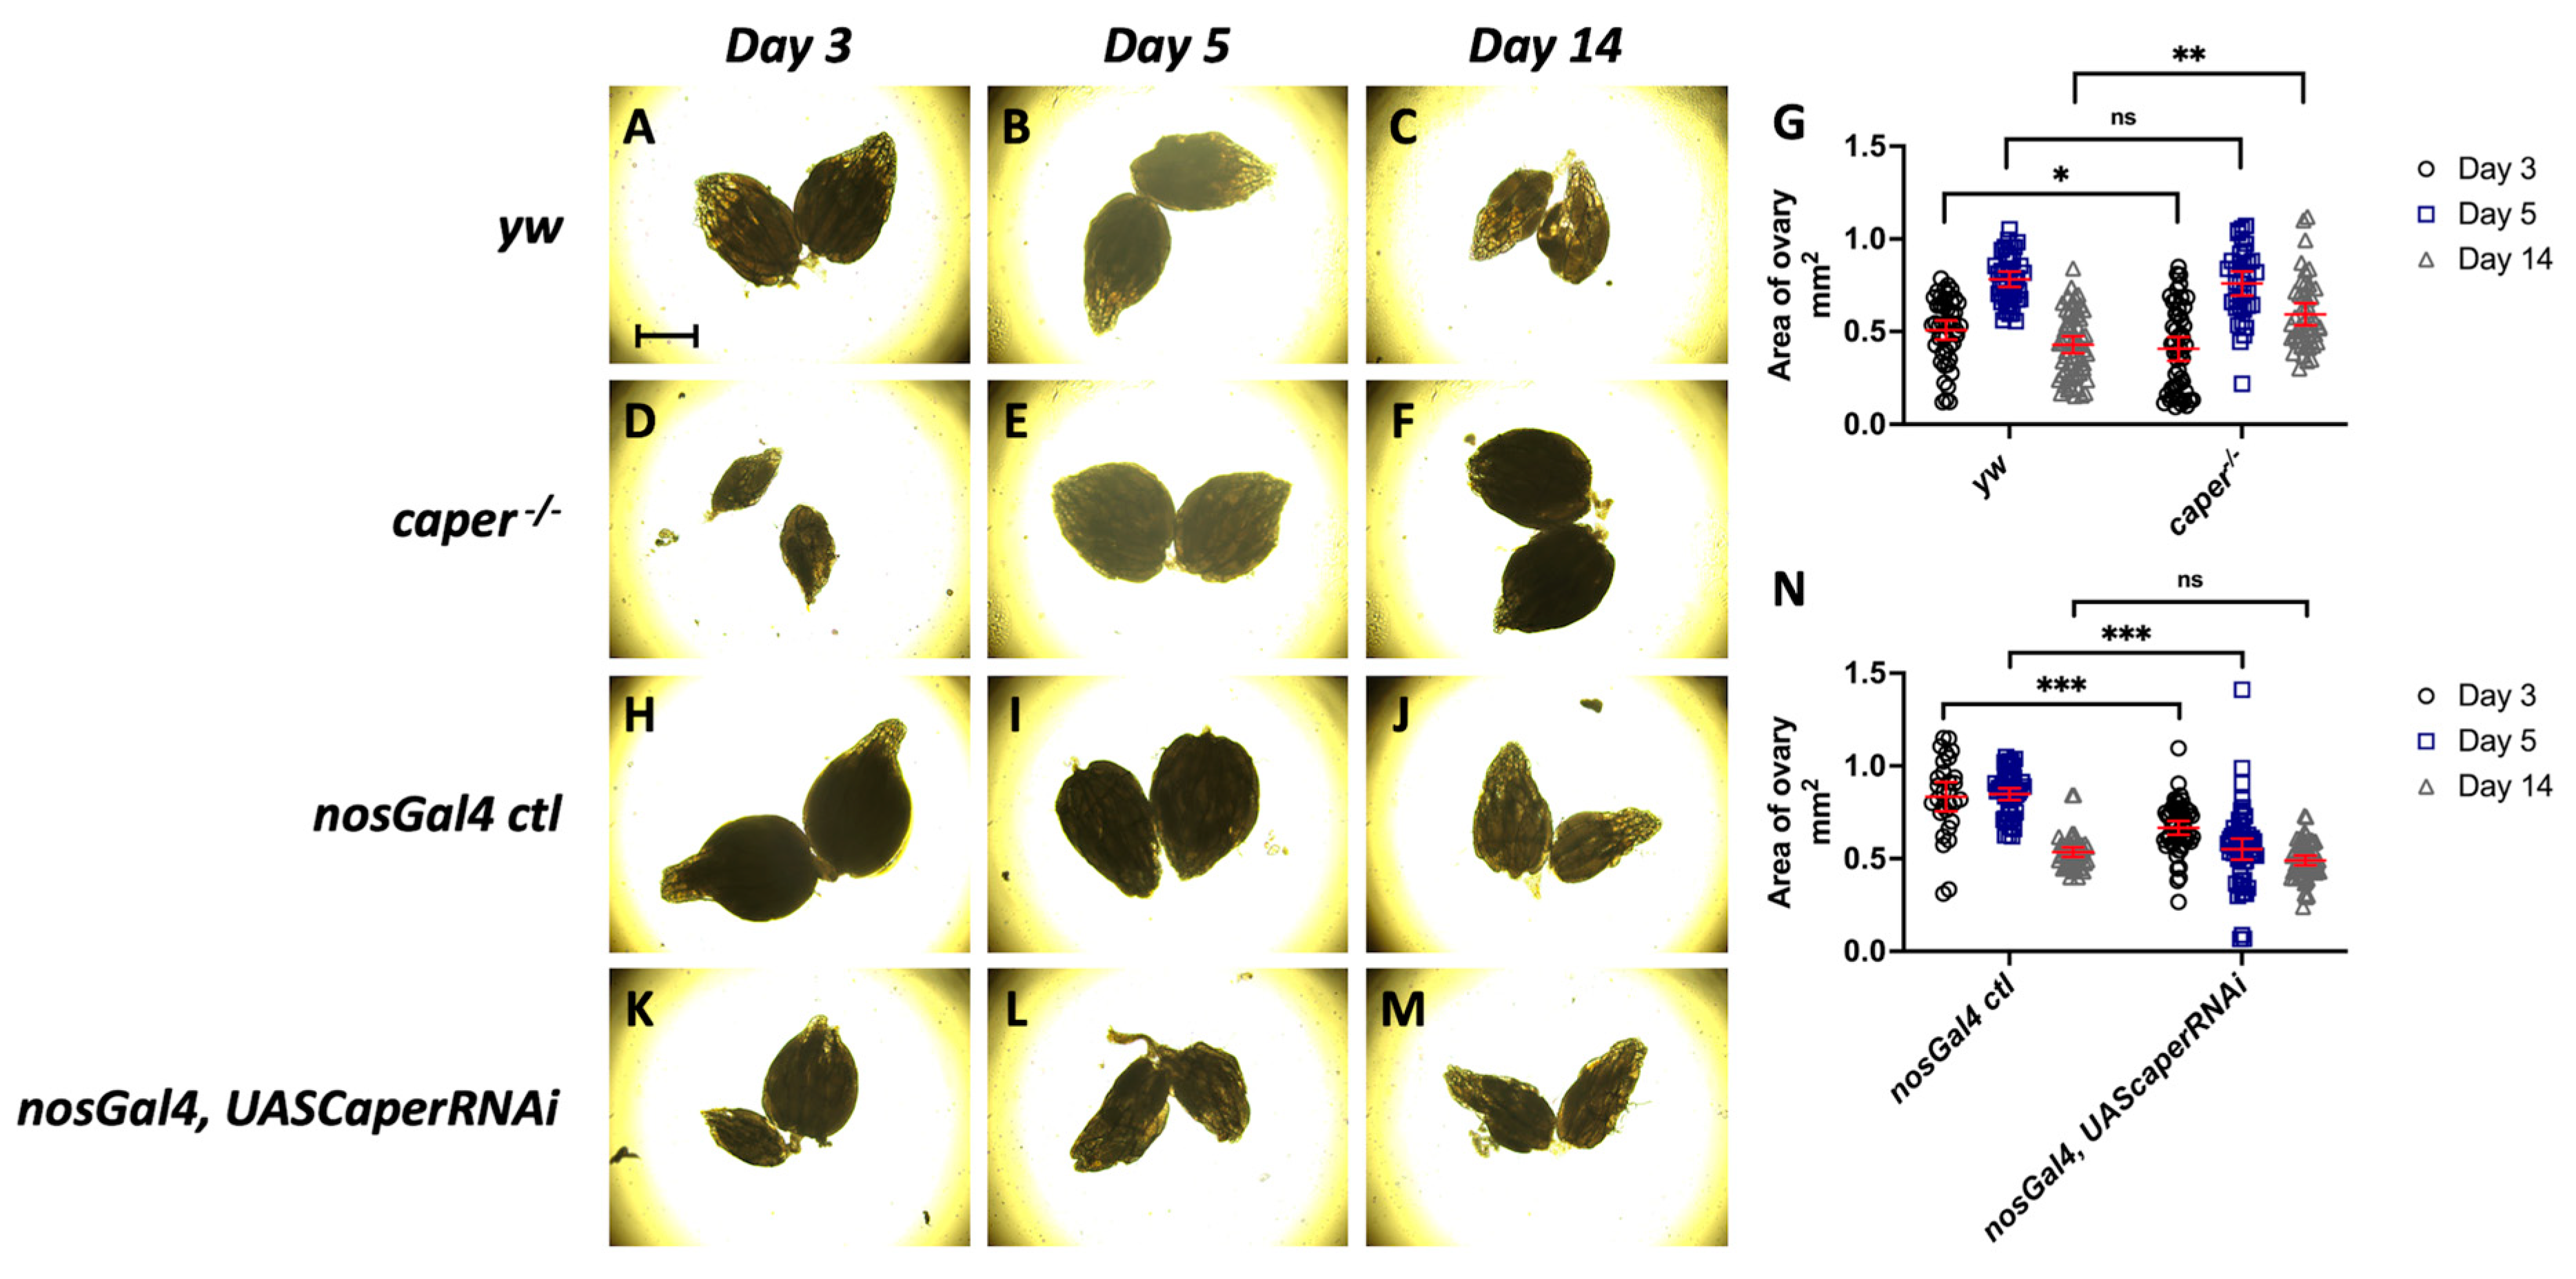
3.4. Caper Dysfunction Results in a Developmental Delay in Oogenesis

To determine if the lower reproductive output of females with caper dysfunction is a result of decreased size in ovaries, we measured the area of ovaries dissected from females at 3, 5 and 14 days post-eclosion. Comparison for the size of ovaries between caper−/− and yw revealed a genotype by day interaction (LMM, χ2 = 14.3, p = 0.0008). A genotype by day interaction was also observed when comparing ovary sizes between nosGal4, UASCaperRNAiGLC01382 and nosGal4 ctl females (LMM, χ2 = 49.9, p = 1.48 × 10⁻¹¹). Interestingly, at day 3 post-eclosion the ovaries are on average smaller in caper−/− females than yw females (caper−/− n = 50, average = 0.406 mm2, yw n = 46, average = 0.508 mm2, Tukey’s test: t-ratio = −2.1, p = 0.0352; Figure 4). However, at day 5 post-eclosion there is not a significant difference between the size of the ovaries (caper−/− n = 36, average = 0.759 mm2, yw n = 40, average = 0.782 mm2, Tukey’s test: t-ratio = −0.4, p = 0.6697; Figure 4). Finally, at day 14 post-eclosion the ovaries from caper−/− are on average larger than ovaries from yw (caper−/− n = 44, average = 0.593 mm2, yw n = 68, average = 0.451 mm2, Tukey’s test: t-ratio = 3.1, p = 0.0020; Figure 4). The progression from being smaller at day 3 to larger at day 14 could be an indication of developmental delay in the caper−/− ovaries. However, caper-deficient females consistently have lower reproductive output throughout adult stages, with the phenotype being exacerbated with age (Figure 2). Therefore, ovary size may not be the driving factor in the decreased reproductive output observed in aging flies.
When comparing ovary size from females with nosGal4 driven UASCaperRNAiGLC01382 to those from the nosGal4 ctl females, at day 3 the ovaries are on average smaller in the nosGal4, UASCaperRNAiGLC01382 females compared to the nosGal4 ctl females (nosGal4, UASCaperRNAiGLC01382 n = 54, average = 0.666 mm2, nosGal4 ctl n = 30, average = 0.835 mm2, Tukey’s test: t-ratio = −4.2, p = 4.92 × 10⁻⁵; Figure 4). The ovaries remain on average smaller in nosGal4:UASCaperRNAiGLC01382 at day 5 (nosGal4:UASCaperRNAiGLC01382 n = 56, average = 0.552 mm2, nosGal4 ctl n = 50, average = 0.848 mm2, Tukey’s test: t-ratio = −8.6, p = 1.19 × 10⁻¹⁴; Figure 4). However, on day 14 there is not a significant difference between the size of the ovaries (nosGal4:UASCaperRNAiGLC01382 n = 48, average = 0.536 mm2, nosGal4 ctl n = 58, average = 0.491 mm2, Tukey’s test: t-ratio = 1.3, p = 0.1964; Figure 4). The smaller size of ovaries seen in the nosGal4, UASCaperRNAiGLC01382 females at days 3 and 5 further supports a developmental delay of oogenesis. However, as previously mentioned, reproductive output in knockdown flies is also exacerbated with age (Figure 2). This again suggests that ovary size may not be the driving factor in reduced reproductive output. We have previously shown that caper knockdown generally produces stronger phenotypes than the caper hypomorphic allele [31], thus it is not surprising that we see smaller ovaries at both day 3 and day 5 in knockdown animals.

3.5. Reproductive Output of Caper−/−, but Not Caper Knockdown, Females May Be Impacted by Reduced Matings

Given that mating itself stimulates production of germline stem cells in females [54,55] and decreased mating receptivity could also result in the production of fewer embryos, we next sought to determine if reduced mating factored into the decreased fecundity of caper−/− females. To this end, ten chambers containing 15 virgin female and 15 male caper−/− or yw animals were monitored for two hours for mating. Actively mating animals were removed immediately and scored. Indeed, we found that caper−/− females mated significantly less than yw females (GLMM: χ2 = 10.5, p = 0.0012; Table 2). Additionally, significantly more caper−/− males were selected as mating partners than yw males (GLMM: χ2 = 70.9, p = 3.83 × 10⁻¹⁷). While this may be expected given the established mating defects of both yellow and white mutant males [56,57,58], our results show that caper−/− males do not experience decreased courtship behavior compared to yw controls. Thus, lowered reproductive output in crosses including caper−/− males may not be attributable to reduced mating initiation by males.
Mating receptivity was next examined in nanosGal4+/−; UAScaperRNAi+/− and nanosGal4+/- control females to attempt to separate mating behavior from fecundity, since knockdown of caper in the female germline should not induce courtship behavioral deficits. Though these females were only mated to yw control males in the reproductive output assay described above, caper−/− males were provided in the arenas as well to better assess receptivity in general, as we had established that they were preferred by females over yw controls. Once again, we observed a similar preference for the caper−/− males, as they were selected significantly over the yw males (GLMM: χ2 = 48.3, p = 3.67 × 10⁻¹²); Table 2. However, there was no significant difference between the number of matings for caper knockdown females or controls (GLMM: χ2 = 1.0, p = 0.3266; Table 2). Thus, while caper−/− female reproductive output may be impacted by a reduction in number of matings over their lifespan, reduced fecundity in caper knockdown females is likely not the result of fewer matings occurring.

4. Conclusions

RNA regulation is integral to the development of the germline and nervous system. Here, we show that the highly conserved RBP Caper is expressed within the female germline throughout all stages of oogenesis. Furthermore, while Caper function is dispensable for oocyte patterning, Caper dysfunction results in decreased reproductive output in Drosophila females. Moreover, this phenotype is exacerbated with age. A role for caper in germline development may be conserved. For example, in C. elegans when the ortholog of caper, rbm-39 is knocked down in a daf-2 mutant background, there is a significant shortening of the animal’s lifespan compared to daf-2 single mutants [59]. Additionally, rbm-39 knockdown in a lin-35 mutant background results in sterility, pointing to a role for rbm-39 within the C. elegans germline [60]. Given that human and mouse RBM39 orthologs are also expressed within the female germline, it is likely that caper plays a conserved role within the germline.

Supplementary Materials

The following supporting information can be downloaded at: https://www.mdpi.com/article/10.3390/jdb11010002/s1, Figure S1: Expression of Caper protein is equivalent between caper −/− and yw ovaries collected from females five days post-eclosion. Three biological replicates of anti-Caper immunoblotting of ovaries collected from caper −/− and yw ovaries. The first row is the expression of Caper protein and the second row is the expression of alpha-Tubulin, which was used as a loading control. These images show that there is no significant difference in the expression of Caper between the caper −/− and yw genotypes (caper −/− Caper/alpha-Tubulin ratio = 0.744, yw Caper/alpha-Tubulin ratio = 0.828; t-Test, t-value = 0.72, P = 0.5114). This demonstrates that the nature of dysfunction of the caper −/− is not a result of difference in protein expression.

Author Contributions

Conceptualization, E.C.O.; methodology, E.C.O. and J.M.B.; Experiments performed by M.B.T., M.K.S. and E.J.T.; statistical analyses, J.M.B. and M.B.T.; writing—original draft preparation, E.C.O. and E.J.T.; writing—review and editing, E.C.O., M.B.T. and J.M.B.; supervision, E.C.O.; funding acquisition, E.C.O. and J.M.B. All authors have read and agreed to the published version of the manuscript.

Funding

This research was funded by the National Institutes of Health grant number 5R03AG067071 to E.C.O. and J.M.B.

Institutional Review Board Statement

Not applicable.

Informed Consent Statement

Not applicable.

Data Availability Statement

Not applicable.

Acknowledgments

We thank Brent Wallace for his support in administrative and technical support of this work.

Conflicts of Interest

The authors declare no conflict of interest.

References

  1. Ameku, T.; Niwa, R. Mating-induced increase in germline stem cells via the neuroendocrine system in female Drosophila. PloS Genet. 2016, 12, e1006123. [Google Scholar] [CrossRef] [PubMed] [Green Version]
  2. Antonacci, S.; Forand, D.; Wolf, M.; Tyus, C.; Barney, J.; Kellogg, L.; Simon, M.A.; Kerr, G.; Wells, K.L.; Younes, S.; et al. Conserved RNA-binding proteins required for dendrite morphogenesis in Caenorhabditis elegans sensory neurons. G3: Genes Genomes Genet. 2015, 5, 639–653. [Google Scholar] [CrossRef] [PubMed] [Green Version]
  3. Bates, D.; Mächler, M.; Bolker, B.; Walker, S. Fitting linear mixed-effects models using lme4. J. Stat. Softw. 2015, 67, 1–48. [Google Scholar] [CrossRef]
  4. Becalska, A.N.; Gavis, E.R. Lighting up mRNA localization in Drosophila oogenesis. Development 2009, 136, 2493–2503. [Google Scholar] [CrossRef] [PubMed] [Green Version]
  5. Brechbiel, J.L.; Gavis, E.R. Spatial regulation of nanos is required for its function in dendrite morphogenesis. Curr. Biol. 2008, 18, 745–750. [Google Scholar] [CrossRef] [Green Version]
  6. Brooks, M.E.; Kristensen, K.; van Benthem, K.J.; Magnusson, A.; Berg, C.W.; Nielsen, A.; Skaug, H.J.; Maechler, M.; Bolker, B.M. glmmTMB Balances Speed and Flexibility Among Packages for Zero-inflated Generalized Linear Mixed Modeling. R J. 2017, 9, 378–400. [Google Scholar] [CrossRef] [Green Version]
  7. Buszczak, M.; Paterno, S.; Lighthouse, D.; Bachman, J.; Planck, J.; Owen, S.; Skora, A.D.; Nystul, T.G.; Ohlstein, B.; Allen, A.; et al. The carnegie protein trap library: A versatile tool for Drosophila developmental studies. Genetics 2007, 175, 1505–1531. [Google Scholar] [CrossRef] [Green Version]
  8. Campos-Ortega, J.A.; Hartenstein, V. The Embryonic Development of Drosophila melanogaster, 1st ed.; Springer: Berlin/Heidelberg, Germany, 1985. [Google Scholar]
  9. Castagnetti, S.; Hentze, M.W.; Ephrussi, A.; Gebauer, F. Control of oskar mRNA translation by Bruno in a novel cell-free system from Drosophila ovaries. Development 2000, 127, 1063–1068. [Google Scholar] [CrossRef] [PubMed]
  10. Ceron, J.; Rual, J.F.; Chandra, A.; Dupuy, D.; Vidal, M.; van den Heuvel, S. Large-scale RNAi screens identify novel genes that interact with the C. elegans retinoblastoma pathway as well as splicing-related components with synMuv B activity. BMC Dev. Biol. 2007, 7, 30. [Google Scholar] [CrossRef] [Green Version]
  11. Christou-Kent, M.; Dhellemmes, M.; Lambert, E.; Ray, P.F.; Arnoult, C. Diversity of RNA-binding proteins modulating post-transcriptional regulation of protein expression in the maturing mammalian oocyte. Cells 2020, 9, 662. [Google Scholar] [CrossRef]
  12. Dowhan, D.H.; Hong, E.P.; Auboeuf, D.; Dennis, A.P.; Wilson, M.M.; Berget, S.M.; O’Malley, B.W. Steroid hormone receptor coactivation and alternative RNA splicing by U2AF65-related proteins CAPERα and CAPERβ. Mol. Cell 2005, 17, 429–439. [Google Scholar] [CrossRef] [PubMed]
  13. Driever, W.; Nüsslein-Volhard, C. The bicoid protein determines position in the Drosophila embryo in a concentration-dependent manner. Cell 1988, 54, 95–104. [Google Scholar] [CrossRef] [PubMed]
  14. Filardo, P.; Ephrussi, A. Bruno regulates gurken during Drosophila oogenesis. Mech. Dev. 2003, 120, 289–297. [Google Scholar] [CrossRef] [PubMed]
  15. Fox, J.; Weisberg, S. An R Companion to Applied Regression, 3rd ed.; Sage: Thousand Oaks, CA, USA, 2019. [Google Scholar]
  16. Gavis, E.R.; Lehmann, R. Localization of nanos RNA controls embryonic polarity. Cell 1992, 71, 301–313. [Google Scholar] [CrossRef]
  17. Gennarino, V.A.; Palmer, E.E.; McDonell, L.M.; Wang, L.; Adamski, C.J.; Koire, A.; See, L.; Chen, C.-A.; Schaaf, C.P.; Rosenfeld, J.A.; et al. A mild PUM1 mutation is associated with adult-onset ataxia, whereas haploinsufficiency causes developmental delay and seizures. Cell 2018, 172, 924–936. [Google Scholar] [CrossRef] [Green Version]
  18. González-Reyes, A.; Elliott, H.; St Johnston, D. Polarization of both major body axes in Drosophila by gurken-torpedo signalling. Nature 1995, 375, 654–658. [Google Scholar] [CrossRef]
  19. Hartig, F. DHARMa: Residual Diagnostics for Hierarchical (Multi-Level/Mixed) Regression Models. R package version 0.1.5. 2017. Available online: http://cran.nexr.com/web/packages/DHARMa/vignettes/DHARMa.html (accessed on 20 May 2022).
  20. Herndon, L.A.; Wolfner, M.F. A Drosophila seminal fluid protein, Acp26Aa, stimulates egg laying in females for 1 day after mating. Proc. Natl. Acad. Sci. USA 1995, 92, 10114–10118. [Google Scholar] [CrossRef] [Green Version]
  21. Kadrmas, J.L.; Smith, M.A.; Pronovost, S.M.; Beckerle, M.C. Characterization of RACK1 function in Drosophila development. Dev. Dyn. 2007, 236, 2207–2215. [Google Scholar] [CrossRef]
  22. Kanke, M.; Jambor, H.; Reich, J.; Marches, B.; Gstir, R.; Ryu, Y.H.; Ephrussi, A.; Macdonald, P.M. oskar RNA plays multiple noncoding roles to support oogenesis and maintain integrity of the germline/soma distinction. Rna 2015, 21, 1096–1109. [Google Scholar] [CrossRef] [Green Version]
  23. Kato, Y.; Nakamura, A. Roles of cytoplasmic RNP granules in intracellular RNA localization and translational control in the drosophila oocyte. Dev. Growth Differ. 2012, 54, 19–31. [Google Scholar] [CrossRef]
  24. Kugler, J.M.; Lasko, P. Localization, anchoring and translational control of oskar, gurken, bicoid and nanos mRNA during Drosophila oogenesis. Fly 2009, 3, 15–28. [Google Scholar] [CrossRef] [PubMed] [Green Version]
  25. Kwasnieski, J.C.; Orr-Weaver, T.L.; Bartel, D.P. Early genome activation in Drosophila is extensive with an initial tendency for aborted transcripts and retained introns. Genome Res. 2019, 29, 1188–1197. [Google Scholar] [CrossRef] [PubMed] [Green Version]
  26. Lehmann, R.; Nüsslein-Volhard, C. Abdominal segmentation, pole cell formation, and embryonic polarity require the localized activity of oskar, a maternal gene in drosophila. Cell 1986, 47, 141–152. [Google Scholar] [CrossRef] [PubMed]
  27. Lenth, R.V. Tukey’s test: Estimated Marginal Means, aka Least-Squares Means. R Package version 1.6.0. 2021. Available online: https://CRAN.R-project.org/package=Tukey’stest (accessed on 20 May 2022).
  28. Lin, W.H.; Giachello, C.N.; Baines, R.A. Seizure control through genetic and pharmacological manipulation of Pumilio in Drosophila: A key component of neuronal homeostasis. Dis. Model. Mech. 2017, 10, 141–150. [Google Scholar] [PubMed] [Green Version]
  29. Massey, J.H.; Chung, D.; Siwanowicz, I.; Stern, D.L.; Wittkopp, P.J. The yellow gene influences Drosophila male mating success through sex comb melanization. eLife 2019, 8, e49388. [Google Scholar] [CrossRef]
  30. McDermott, S.M.; Meignin, C.; Rappsilber, J.; Davis, I. Drosophila Syncrip binds the gurken mRNA localisation signal and regulates localised transcripts during axis specification. Biol. Open 2012, 1, 488–497. [Google Scholar] [CrossRef] [Green Version]
  31. McGirr, J.A.; Johnson, L.M.; Kelly, W.; Markow, T.A.; Bono, J.M. Reproductive isolation among drosophila arizonae from geographically isolated regions of north america. Evol. Biol. 2017, 44, 82–90. [Google Scholar]
  32. Misra, M.; Edmund, H.; Ennis, D.; Schlueter, M.A.; Marot, J.E.; Tambasco, J.; Barlow, I.; Sigurbjornsdottir, S.; Mathew, R.; Vallés, A.M.; et al. A genome-wide screen for dendritically localized RNAs identifies genes required for dendrite morphogenesis. G3 Genes Genomes Genet. 2016, 6, 2397–2405. [Google Scholar] [CrossRef] [Green Version]
  33. Neelamraju, Y.; Hashemikhabir, S.; Janga, S.C. The human RBPome: From genes and proteins to human disease. J. Proteom. 2015, 127, 61–70. [Google Scholar] [CrossRef] [Green Version]
  34. Neuman-Silberberg, F.S.; Schupbach, T. Dorsoventral axis formation in Drosophila depends on the correct dosage of the gene gurken. Development 1994, 120, 2457–2463. [Google Scholar] [CrossRef]
  35. Ni, J.-Q.; Zhou, R.; Czech, B.; Liu, L.-P.; Holderbaum, L.; Yang-Zhou, D.; Shim, H.-S.; Tao, R.; Handler, D.; Karpowicz, P.; et al. A genome-scale shRNA resource for transgenic RNAi in Drosophila. Nat. Methods 2011, 8, 405–407. [Google Scholar] [CrossRef] [PubMed]
  36. Olesnicky, E.C.; Bhogal, B.; Gavis, E.R. Combinatorial use of translational co-factors for cell type-specific regulation during neuronal morphogenesis in Drosophila. Dev. Biol. 2012, 365, 208–218. [Google Scholar] [CrossRef] [PubMed] [Green Version]
  37. Olesnicky, E.C.; Bono, J.M.; Bell, L.; Schachtner, L.T.; Lybecker, M.C. The RNA-binding protein caper is required for sensory neuron development in Drosophila melanogaster. Dev. Dyn. 2017, 246, 610–624. [Google Scholar] [CrossRef] [PubMed] [Green Version]
  38. Olesnicky, E.C.; Killian, D.J.; Garcia, E.; Morton, M.C.; Rathjen, A.R.; Sola, I.E.; Gavis, E.R. Extensive use of RNA-binding proteins in Drosophila sensory neuron dendrite morphogenesis. G3 Genes Genomes Genet. 2014, 4, 297–306. [Google Scholar]
  39. Olesnicky, E.C.; Killian, D.J. The cytoplasmic polyadenylation element binding protein (CPEB), Orb, is important for dendrite development and neuron fate specification in Drosophila melanogaster. Gene 2020, 738, 144473. [Google Scholar] [CrossRef]
  40. Olesnicky, E.C.; Wright, E.G. Drosophila as a model for assessing the function of RNA-binding proteins during neurogenesis and neurological disease. J. Dev. Biol. 2018, 6, 21. [Google Scholar] [CrossRef] [Green Version]
  41. Papasaikas, P.; Rao, A.; Huggins, P.; Valcarcel, J.; Lopez, A.J. Reconstruction of composite regulator-target splicing networks from high-throughput transcriptome data. BMC Genom. 2015, 16, S7. [Google Scholar] [CrossRef] [Green Version]
  42. Qin, X.; Ahn, S.; Speed, T.P.; Rubin, G.M. Global analyses of mRNA translational control during early drosophila embryogenesis. Genome Biol. 2007, 8, R63. [Google Scholar] [CrossRef] [Green Version]
  43. Rayburn, L.Y.; Gooding, H.C.; Choksi, S.P.; Maloney, D.; Kidd III, A.R.; Siekhaus, D.E.; Bender, M. Amontillado, the Drosophila homolog of the prohormone processing protease PC2, is required during embryogenesis and early larval development. Genetics 2003, 163, 227–237. [Google Scholar] [CrossRef]
  44. Ruhmann, H.; Wensing, K.U.; Neuhalfen, N.; Specker, J.; Fricke, C. Early reproductive success in Drosophila males is dependent on maturity of the accessory gland. Behav. Ecol. 2016, 27, 1859–1868. [Google Scholar]
  45. Samuelson, A.V.; Klimczak, R.R.; Thompson, D.B.; Carr, C.E.; Ruvkun, G. Identification of caenorhabditis elegans genes regulating longevity using enhanced RNAi-sensitive strains. Cold Spring Harb. Symp. Quant. Biol. 2007, 72, 489–497. [Google Scholar] [CrossRef] [PubMed] [Green Version]
  46. Sanford, J.R.; Bruzik, J.P. Regulation of SR protein localization during development. Proc. Natl. Acad. Sci. USA 2001, 98, 10184–10189. [Google Scholar] [CrossRef] [Green Version]
  47. Smith, C.M.; Hayamizu, T.F.; Finger, J.H.; Bello, S.M.; McCright, I.J.; Xu, J.; Baldarelli, R.M.; Beal, J.S.; Campbell, J.W.; Corbani, L.E.; et al. The mouse Gene Expression Database (GXD): 2019 update. Nucleic Acids Res. 2019, 47, D774–D779. [Google Scholar] [CrossRef] [PubMed]
  48. Spendier, K.; Olesnicky, E.C.; Forand, D.; Wolf, M.; Killian, D.J. CPB-3 and CGH-1 localize to motile particles within dendrites in C. elegans PVD sensory neurons. BMC Res. Notes 2021, 14, 311. [Google Scholar] [CrossRef]
  49. Sturtevant, A.H. Experiments on sex recognition and the problem of sexual selection in Drosophila. J. Anim. Behav. 1915, 5, 351–366. [Google Scholar] [CrossRef] [Green Version]
  50. Thisse, B.; Thisse, C. Fast Release Clones: A High Throughput Expression Analysis. ZFIN Direct Data Submission. 2004. Available online: http://zfin.org (accessed on 1 June 2022).
  51. Thul, P.J.; Åkesson, L.; Wiking, M.; Mahdessian, D.; Geladaki, A.; Ait Blal, H.; Alm, T.; Asplund, A.; Björk, L.; Breckels, L.M.; et al. A subcellular map of the human proteome. Science 2017, 356, 315–320. [Google Scholar] [CrossRef]
  52. Thul, P.J.; Lindskog, C. The human protein atlas: A spatial map of the human proteome. Protein Sci. 2018, 27, 233–244. [Google Scholar] [CrossRef] [Green Version]
  53. Titus, M.B.; Wright, E.G.; Bono, J.M.; Poliakon, A.K.; Goldstein, B.R.; Super, M.K.; Young, L.A.; Manaj, M.; Litchford, M.; Reist, N.E.; et al. The conserved alternative splicing factor caper regulates neuromuscular phenotypes during development and aging. Dev. Biol. 2021, 473, 15–32. [Google Scholar] [CrossRef]
  54. Vessey, J.P.; Schoderboeck, L.; Gingl, E.; Luzi, E.; Riefler, J.; Di Leva, F.; Karra, D.; Thomas, S.; Kiebler, M.A.; Macchi, P. Mammalian Pumilio 2 regulates dendrite morphogenesis and synaptic function. Proc. Natl. Acad. Sci. USA 2010, 107, 3222–3227. [Google Scholar] [CrossRef] [Green Version]
  55. Wang, C.; Dickinson, L.K.; Lehmann, R. Genetics of nanos localization in Drosophila. Dev. Dyn. 1994, 199, 103–115. [Google Scholar] [CrossRef]
  56. Wessels, H.H.; Imami, K.; Baltz, A.G.; Kolinski, M.; Beldovskaya, A.; Selbach, M.; Small, S.; Ohler, U.; Landthaler, M. The mRNA-bound proteome of the early fly embryo. Genome Res. 2016, 26, 1000–1009. [Google Scholar] [CrossRef] [PubMed] [Green Version]
  57. Xiao, C.; Qiu, S.; Robertson, R.M. The white gene controls copulation success in Drosophila melanogaster. Sci. Rep. 2017, 7, 7712. [Google Scholar] [CrossRef] [PubMed]
  58. Xu, X.; Brechbiel, J.L.; Gavis, E.R. Dynein-dependent transport of nanos RNA in Drosophila sensory neurons requires Rumpelstiltskin and the germ plasm organizer Oskar. J. Neurosci. 2013, 33, 14791–14800. [Google Scholar] [CrossRef] [PubMed]
  59. Yan, D.; Neumüller, R.A.; Buckner, M.; Ayers, K.; Li, H.; Hu, Y.; Yang-Zhou, D.; Pan, L.; Wang, X.; Kelley, C.; et al. A regulatory network of Drosophila germline stem cell self-renewal. Dev. Cell 2014, 28, 459–473. [Google Scholar] [CrossRef] [Green Version]
  60. Ye, B.; Petritsch, C.; Clark, I.E.; Gavis, E.R.; Jan, L.Y.; Jan, Y.N. Nanos and Pumilio are essential for dendrite morphogenesis in Drosophila peripheral neurons. Curr. Biol. 2004, 14, 314–321. [Google Scholar] [CrossRef]
Figure 1. Caper is expressed throughout the female germline. Single z-plane confocal slices indicate that caper−/− ovarioles (AH) show normal patterning as compared to yw ovarioles (IK). Nuclei are marked with DAPI in blue (A,E,I). The Caper:GFP fusion protein (B,F) is shown in green and marks nurse cell nuclei, the oocyte nucleus and follicle cell nuclei. An anti-Caper antibody shown in red (C,G,J) marks nurse cell nuclei, the oocyte nucleus, follicle cell nuclei and is also found in the oocyte cytoplasm. Overlays of all channels are shown in (D,H,K). White arrows mark the oocyte nucleus. Yellow arrows show cytoplasmic expression of Caper marked with an anti-Caper antibody. A 50 micron scale bar is shown in (K).
Jdb 11 00002 g001
Figure 2. Reproductive output is decreased with caper dysfunction. (A) Reproductive output is affected in caper−/− females regardless of the genotype of the males they are mated with, and these deficits are increased with age. However, caper−/− females mated with caper−/− males show the greatest reduction in reproductive output. In each of the four genotypic pairings, 25 vials of 5 females each were scored. Statistical analysis of reproductive output revealed a significant female × male × day interaction (GLMM: χ2 = 35.4, p = 2.70 × 10⁻⁹). (B) Knockdown of caper specifically within the germline using nanosGal4 also results in a decreased reproductive output compared to nanosGal4 female controls and this phenotype was exacerbated by age (GLMM: genotype × day interaction, χ2 = 240.0, p = 2.2 × 10⁻¹⁶). In both genotypic pairings, 25 vials of 5 females each were scored. The number of eggs laid is plotted on the y-axis, with the age of the female in days plotted on the x-axis. Genotypes are indicated in the legend for each panel using color coding.
Jdb 11 00002 g002
Figure 3. Stages during which embryos arrest development due to caper dysfunction. (A) The number of embryos that did not complete development and the stage at which they arrested is shown. Number of embryos is plotted on the y-axis; parental genotypes are indicated on the x-axis. caper−/− embryos die significantly more than yw embryos (caper−/− n = 696, 7.47% dead; yw n = 759, 1.71% dead; Tukey’s test: z-ratio = −4.9, p = 6.58 × 10⁻⁶) and caper +/− embryos derived from caper mutant females outcrossed to yw males (n = 793, 3.53% dead; Tukey’s test: z-ratio = −3.3, p = 0.0055) or yw females outcrossed to caper mutant males (Tukey’s test: z-ratio = −5.4, p = 3.45 × 10⁻⁷). More caper +/− embryos derived from caper mutant females outcrossed to yw males are embryonically arrested than embryos derived from yw females outcrossed to caper mutant males (n = 834, 1.20% dead; Tukey’s test: z-ratio = −3.0, p = 0.016). (B) Knockdown of caper specifically within the female germline results in a significant increase in the arrest of embryonic development compared to controls (GLM: χ2 = 9.7, p = 0.00186).
Jdb 11 00002 g003
Figure 4. caper dysfunction results in smaller ovaries. (AF) Images of ovaries dissected from yw and caper−/− females at days 3, 5 and 14 post-eclosion using a Brightfield microscope. (G) Quantification of ovary area shows that ovaries from caper−/− females are significantly smaller at day 3 (caper−/− n = 50, average = 0.406 mm2, yw n = 46, average = 0.508 mm2, Tukey’s test: t-ratio = −2.128, p = 0.0352) and significantly larger at day 14 (caper−/− n = 44, average = 0.593 mm2, yw n = 68, average = 0.451 mm2, Tukey’s test: t-ratio = 3.147, p = 0.002) than ovaries from yw females. There is no significant difference in ovary size at day 5 (caper−/− n = 36, average = 0.759 mm2, yw n = 40, average = 0.782 mm2, Tukey’s test: t-ratio = −0.427, p = 0.6697). (HM) Images of ovaries dissected from nosGal4 ctl and nosGal4, UASCaperRNAiGLC01382 females at days 3, 5 and 14 post-eclosion using a Brightfield microscope. (N) Quantification of ovary area shows that ovaries from nosGal4, UASCaperRNAiGLC01382 females are significantly smaller at day 3 (nosGal4, UASCaperRNAiGLC01382 n = 54, average = 0.666 mm2, nosGal4 ctl n = 30, average = 0.835 mm2, Tukey’s test: t-ratio = −4.188, p = 4.92e × 10−5) and day 5 (nosGal4:UASCaperRNAiGLC01382 n = 56, average = 0.552 mm2, nosGal4 ctl n = 50, average = 0.848 mm2, Tukey’s test: t-ratio = −8.619, p = 1.19 × 10⁻¹⁴) than ovaries from nosGal4 ctl. At day 14 there is not a significant difference in ovary size (nosGal4:UASCaperRNAiGLC01382 n = 48, average = 0.536 mm2, nosGal4 ctl n = 58, average = 0.491 mm2, Tukey’s test: t-ratio = 1.298, p = 0.1964). Scale bar on panel A represents 500 μm.Lines within each graph represent the mean and 95% confidence interval and significance is indicated by * p ≤ 0.05, **, p ≤ 0.01, *** p ≤ 0.001 or ns (not significant).
Jdb 11 00002 g004
Table 1. caper is required for viability during larval stages but is dispensable during pupariation.
MalesFemales
ywcaper−/−RNAi Controlcaper RNAiywcaper−/−RNAi Controlcaper RNAi
Larval Death3(63)5(46)0(46)3(43)0(59)9(50)2(53)2(49)
Pupal Death6(60)8(41)2(46)1(40)8(59)3(41)4(51)1(47)
Cells are formatted A(B), such that A represents the number of animals that died during the developmental stage shown, while B shows the total number of animals examined. RNAi control describes the ActinGal4 outcrossed to yw, while caper RNAi describes the ActinGal4; UAScaperRNAiHMC animals.
Table 2. caper dysfunction results in decreased mating rates for females but not males.
Female Genotype
ywcaper−/−yw; nosGal4nosGal4; UAScaperRNAiTotals
Male Genotypeyw6024270
caper−/−60393829270
Totals150150120120
yw males mated significantly less than caper−/− males in both caper−/− (p = 1.45 × 10⁻³³) and caperRNAi (p = 1.04 × 10⁻¹⁹) trials. While caper−/− females mated significantly less than yw control females (p = 0.001), there was no significant difference in mating between caperRNAi females and their nosGal4 outcross control (p = 0.33). Numbers shown indicate the number of successful matings for a given cross.
Disclaimer/Publisher’s Note: The statements, opinions and data contained in all publications are solely those of the individual author(s) and contributor(s) and not of MDPI and/or the editor(s). MDPI and/or the editor(s) disclaim responsibility for any injury to people or property resulting from any ideas, methods, instructions or products referred to in the content.

