Article

Applicability Analysis and Ensemble Application of BERT with TF-IDF, TextRank, MMR, and LDA for Topic Classification Based on Flood-Related VGI

1
National Engineering Research Center of Geographic Information System, School of Geography and Information Engineering, China University of Geosciences, Wuhan 430074, China
2
State Key Laboratory of Information Engineering in Surveying, Mapping and Remote Sensing (LIESMARS), Wuhan University, Wuhan 430079, China
*
Author to whom correspondence should be addressed.
ISPRS Int. J. Geo-Inf. 2023, 12(6), 240; https://doi.org/10.3390/ijgi12060240
Submission received: 7 April 2023 / Revised: 27 May 2023 / Accepted: 7 June 2023 / Published: 9 June 2023
(This article belongs to the Special Issue Urban Geospatial Analytics Based on Crowdsourced Data)

Abstract

:
Volunteered geographic information (VGI) plays an increasingly crucial role in flash floods. However, topic classification and spatiotemporal analysis are complicated by the various expressions and lengths of social media textual data. This paper conducted applicability analysis on bidirectional encoder representation from transformers (BERT) and four traditional methods, TextRank, term frequency–inverse document frequency (TF-IDF), maximal marginal relevance (MMR), and linear discriminant analysis (LDA), and the results show that for user type, BERT performs best on the Government Affairs Microblog, whereas LDA-BERT performs best on the We Media Microblog. As for text length, TF-IDF-BERT works better for texts with a length of <70 and length >140 words, and LDA-BERT performs best with a text length of 70–140 words. For the spatiotemporal evolution pattern, the study suggests that in a Henan rainstorm, the textual topics follow the general pattern of “situation-tips-rescue”. Moreover, this paper detected the hotspot of “Metro Line 5” related to a Henan rainstorm and discovered that the topical focus of the Henan rainstorm spatially shifts from Zhengzhou, first to Xinxiang, and then to Hebi, showing a remarkable tendency from south to north, which was the same as the report issued by the authorities. We integrated multi-methods to improve the overall topic classification accuracy of Sina microblogs, facilitating the spatiotemporal analysis of flooding.

1. Introduction

The frequency of extreme precipitation events has grown dramatically in recent years, with torrential rains and floods having caused widespread deaths and economic damage. Their direct economic losses account for about 44.4% [1] of the total losses produced by all meteorological risks. Floods and torrential rain harm more people and are more deadly than other calamities. In response to flooding, process monitoring and spatiotemporal analysis can help governments and emergency agencies accelerate emergency actions and post-disaster management. Volunteered geographic information (VGI) has become a crucial data source for disaster response [2,3]. Compared to remote sensing and ground-based observation data, VGI offers greater timeliness and fewer information expenses [4].
The characteristics of VGI make it feasible to be applied to flood disaster research [5,6,7]. Typically, when applying VGI data in flooding, researchers often utilize data from the four aspects of spatial location, text, photo, and social network [8]. The study themes of applying VGI in floods concentrate on textual topic recognition [9], user sentiment monitoring [10], witness post identification [11], and the extraction of the water level from photos [12,13]. In the course of our research into the classification of themes, we find that the characteristics of redundant topics, low logic, and unpredictable word count in VGI data frequently lead to unsatisfactory classification outcomes. The majority of microblog topic classification relies on unsupervised methods, such as clustering, but these methods are often complex and have no defined termination conditions. For instance, Dou et al. [14] use fine-grained topic extraction to assess disaster losses. Zhang et al. [15] classified microblog text using the TextCNN model based on convolutional neural networks, utilizing the Government Affairs Microblog of Peking University as an example. Junaid et al. [16] used LDA clustering to determine the category labels for each paragraph. Han et al. [17] employed LDA and random forest to construct a microblog topic extraction and classification model using the microblog data. Wang et al. [18] applied K-means clustering to NCP-related microblogs and generated 21 sentiment labels related to “NCP rumors” and “epidemic rumors”.
The supervised method [19] is trained with known samples or called prior knowledge (known inputs and corresponding outputs) to construct an optimal model and then is applied to the new data and obtains the output. After going through this process, the model becomes predictive. Compared to supervised methods, unsupervised [20] approaches do not have known samples, and there is no prior knowledge concerning the training. As opposed to unsupervised classification, supervised classification models, such as Bidirectional Encoder Representation from Transformers (BERT), could allow users to set topics as their interests. BERT has been pre-trained in cross-domain corpora, such as Wikipedia and book corpora, and can perform well on a variety of text-processing tasks [21]. Based on it, Tobias et al. [22] fine-tuned BERT for various tasks in the domain of requirements analysis. Therefore, this study focuses on supervised classification. On the subject of data language types, Jacob et al. [21] used the English corpus to propose two BERT models, BERT-large and BERT-base. Furthermore, the classification procedure in Chinese differs from that in English. There are natural spaces between English words to separate them; however, in Chinese, there is no separator in the center of each sentence. As a result, when we utilize computer technology to perform automatic semantic analysis of Chinese, the initial operation is usually Chinese word segmentation, and Bert has a built-in word divider that is capable of handling this problem well.
In dealing with microblogging data, the length of microblog data can range from a few words to a few thousand, and the expressions of Government Affairs Microblog and We Media Microblog are different; therefore, it is important to find the best way to categorize the traits of various microblogs rather than using a single method for them. Although microblogging themes can be categorized using clustering, it is difficult to determine the names and numbers of the categories, and the small number of categories may be ignored or moved into other categories to the point where it has an impact on the outcomes of evolutionary analysis. For the evolutionary analysis of flooding themes, it is crucial that a classification method retains a smaller number of categories and specifies the name and number of categories in advance.
Based on the abovementioned research background and status quo, this paper aims to solve the following problems: (1) to analyze the advantages and disadvantages of different topic classification methods in flood-related microblogs and to formulate an ensemble processing scheme for the optimal topic classification, and (2) to take the intensive rainfall event in Henan, China, on 20 July 2021 as an example to validate the optimal topic classification method, and analyze the spatiotemporal evolution of this event. To quantitatively assess the applicability of different topic classification methods to different types of VGI data, the whole architecture of this paper is as follows. Section 2 describes the details of the study area and data and provides a preliminary discussion of some of the issues with BERT… Section 3 describes the experimental procedure and the rationale for each method. Section 4 explains the experiments and the corresponding results and discusses the influence of the user type factor and the text length factor. Section 5 takes the whole Henan intensive rainfall event as an example and analyses the spatiotemporal evolution of the event to verify the feasibility of the method. Finally, Section 6 concludes the paper and provides an outlook.

2. Experimental Scenario and Data

2.1. Experimental Scenario

On 20 July 2021, Henan, China, was hit by an unusual and catastrophic flooding calamity. The tragedy affected 14,786,000 people in 150 counties (cities and districts), with 398 dead and missing. Zhengzhou saw 627.4 mm of 24 h rainfall, more than twice the threshold for very high rainfall (https://www.cma.gov.cn/2011xwzx/2011xqxxw/2011xqxyw/201208/t20120817_182197.html accessed on 25 December 2022), and the cumulative precipitation was close to the historical annual precipitation of 640.8 mm (https://www.thepaper.cn/newsDetail_forward_13664770 accessed on 25 December 2022). The intensive rainfall caused significant damage to transportation infrastructure, with water damaging 2639 highways and 351 shipping facilities (https://zhuanlan.zhihu.com/p/401527415 accessed on 6 May 2022). The 2021 Henan flooding event is a once-in-a-millennium massive meteorological calamity that generated considerable public interest due to its severe, and it also provided abundant data; therefore, it was chosen as a case study (hereinafter referred to as Henan intensive rainfall). Furthermore, the 2020 Hubei flood, one of the “Top 10 Natural Disasters in 2020” in China, was used for comparison (hereinafter referred to as Hubei intensive rainfall).

2.2. Data Acquisition and Tagging

This study utilized VGI taken from the Sina Microblog, China’s largest social media platform, with an average of 252 million active daily users, and the data were collected using web crawlers and APIs. The data were acquired as follows: the crawling portion of the solution is implemented in Python, where we simulate a login by obtaining a browser cookie, generate the requested URL based on the search parameters, and parse the requested page using the path-finding language XPath to locate the Weibo ID that appears on the page. We use the Show interface of the Sina Weibo API to obtain the details of the microblog based on the obtained microblog IDs. After crawling and parsing the Weibo ID, the crawler contacts the Show interface via the Python SDK of the Sina Weibo API to organize the data into a library for further processing. The data were crawled using the keywords of “torrential rain, rescue, disaster”, and “Weihui, Hebi, Henan”, etc., between 00:00 UTC+8 on 15 July and 23:59 UTC+8 on 15 August 2021. In total, 810,502 and 29,625 microblogs were gathered, respectively, for the Henan and Hubei intensive rainfall events, with the 13 fields of microblog ID, user ID, username, text, post location, Weibo @user, tag, retweet count, comment count, like count, post time, posting tool, and retweet ID. To complete our tests and analysis, we use three main fields: text, time, and location [23]. Finally, we crawled 38,894 and 2312 of them, respectively. As the text is in Chinese, all of the subsequent processing of the text will follow the same process as used for Chinese. Eight topics of “warning, situation, help, disaster, pray, rescue, guide, irrelevant” were defined in this study by referring to past studies [24,25], and we randomly sampled the check-in data and divided the training set and the test set by 8:2 in all of the experiments of this paper.

2.3. Problem in Different/Experimental Scenario

BERT, derived from the transform model, can perform NLP (natural language processing) tasks such as text classification [26]. BERT is a supervised pre-trained language model that requires manual category annotation. The version of the BERT model chosen for our experiments is the bert-base-chinese, the tensorflow version, with 12 num_hidden_layers. Following a series of experiments, it was determined that the Hubei and Henan deluge datasets were annotated at 70% and 10%, respectively, in order to strike a balance between the manual labeling burden and classification accuracy.
BERT performs effectively in news texts [27], with a fixed form, clear structure, and no crossover between the categories. However, VGI data pertaining to the flood differed significantly from news texts. There are mainly two types of users present on the Sina microblog, official and personal. Texts posted by official users are similar to those of news, with fixed structures, common expressions, and very clearly defined meanings, while the personal texts posted are often quite free in terms of word choice, structure, and length; therefore, the performance of BERT in relation to these texts may vary. In this paper, these two types of Sina microblog texts were named Government Affairs Microblog and We Media Microblog, respectively, and quantitative analysis was performed on both of them. The overall accuracy and the accuracy of the two text types based on the Hubei and Henan intensive rainfall datasets are shown in Table 1.
It can be found from T 1 that BERT performs differently in relation to different types of datasets, with higher performance exhibited in terms of the Government Affairs Microblog than on the We Media Microblog. Government Affairs Microblogs typically contain a “whole-part” or “part-whole” structure, as well as discrete subject phrases from which textual topics can be easily extracted. This paper hypothesizes that the use of too many sentences in the We Media Microblogs affects the categorization accuracy of the BERT, and we try to use the traditional topic classification methods to determine the key sentences to improve the accuracy of BERT in relation to We Media Microblogs.

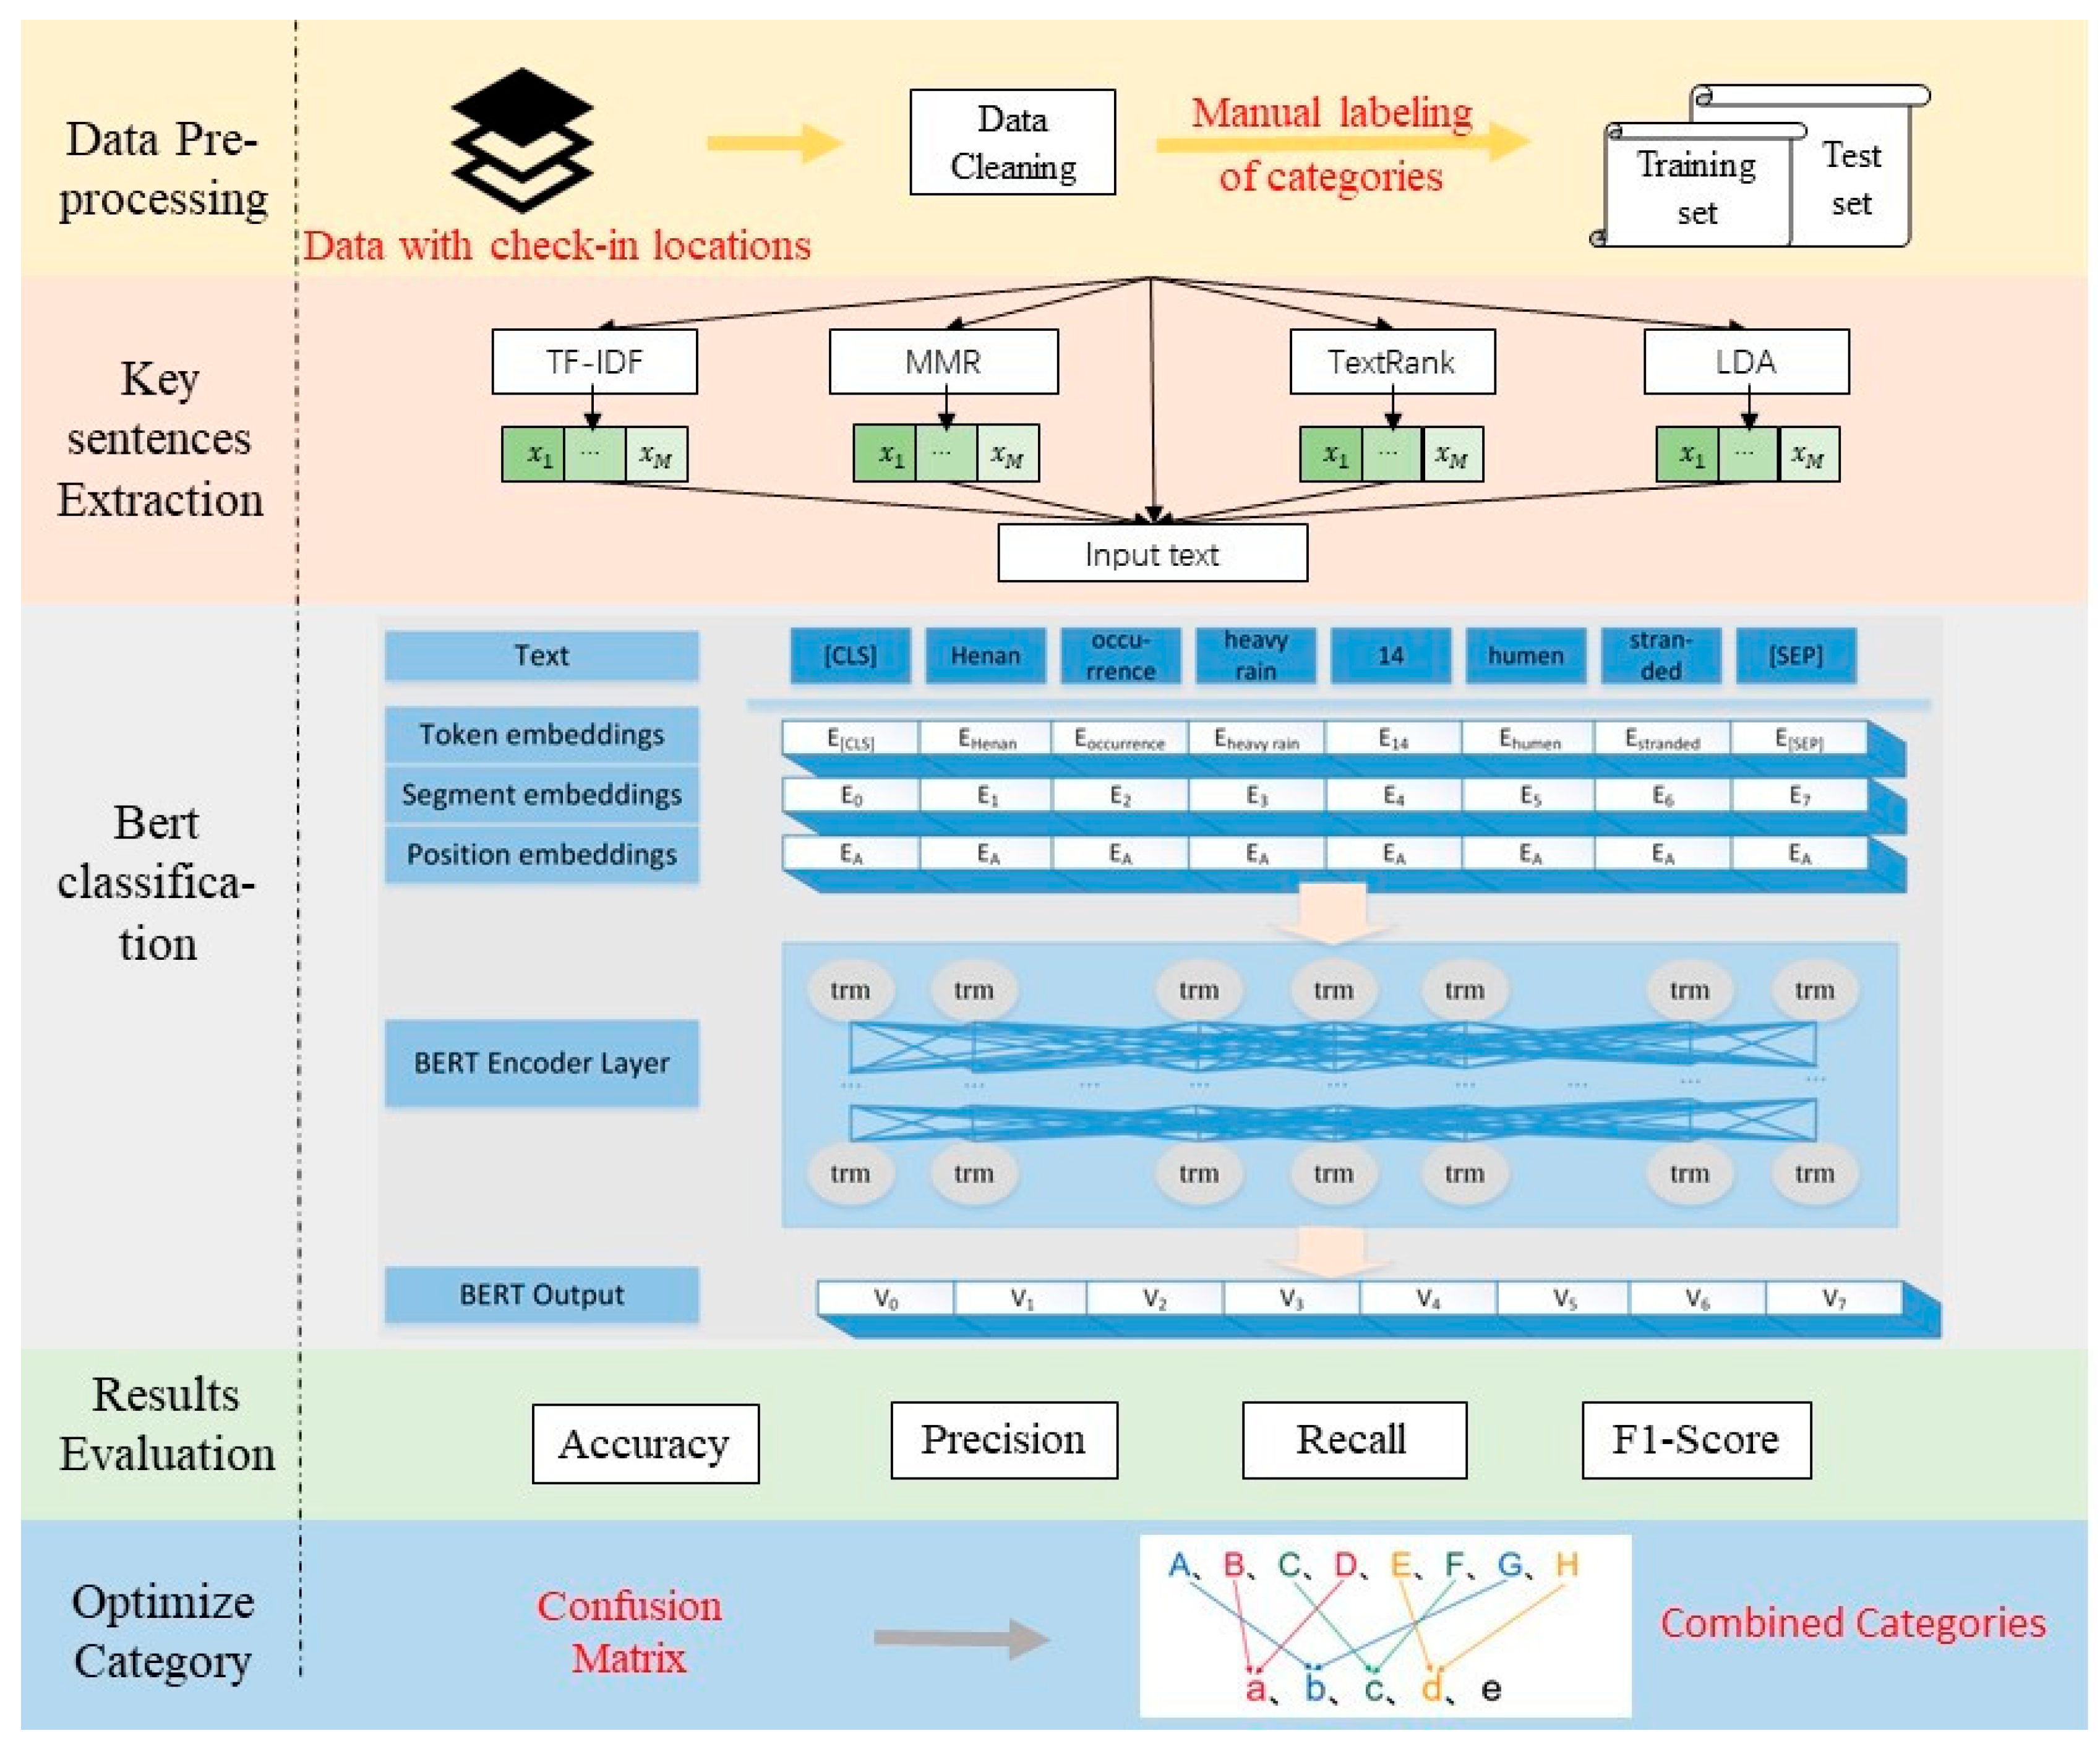
3. Pipeline of Applicability Analysis
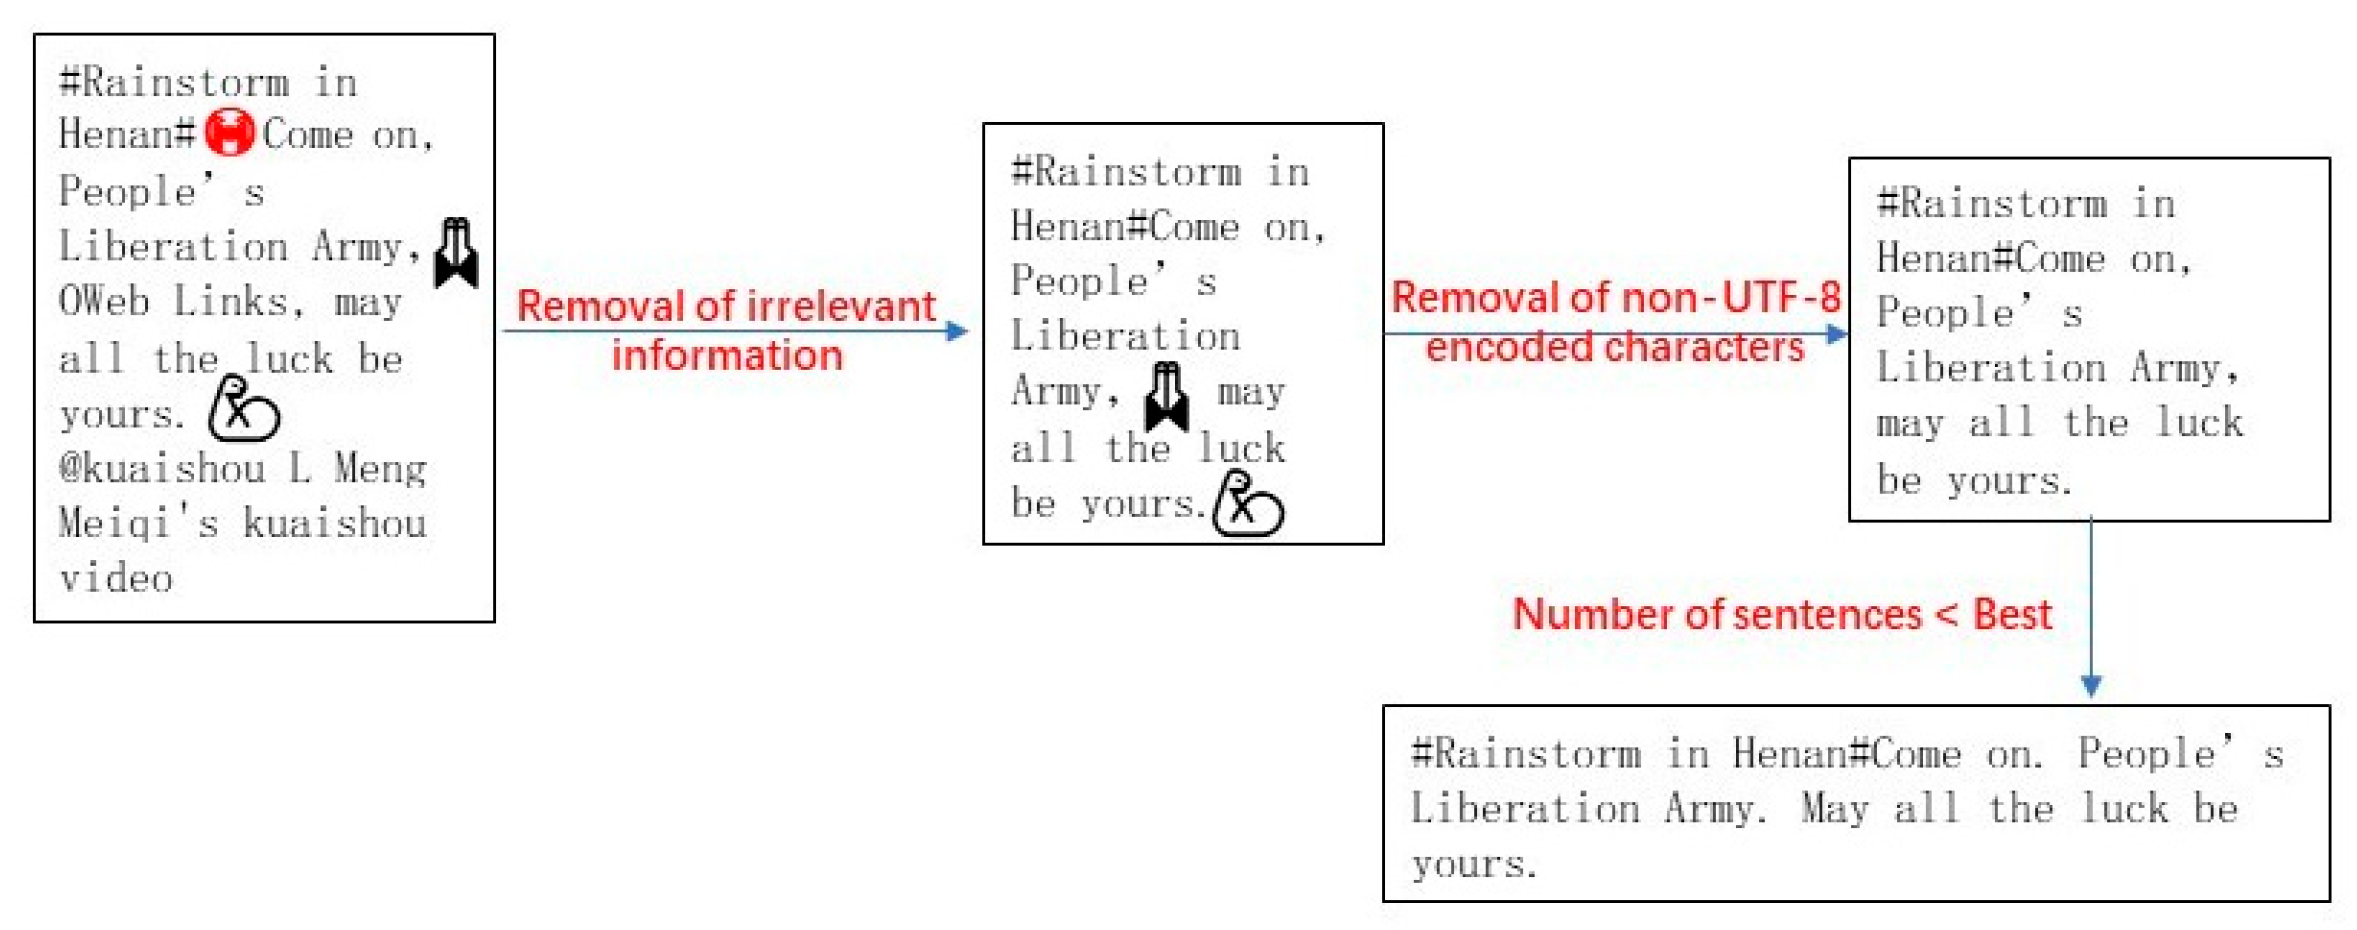
As shown in Figure 1, the pipeline of applicability analysis primarily involves building text phrase sets, extracting key sentences, pre-training the BERT classification model, evaluating the accuracy, and optimizing the results. In this paper, we obtained intensive rainfall data from Sina Weibo, selected microblogs containing geographical location information for cleaning and preprocessing, and manually tagged a portion of the data to create the experimental data. The extracted key sentences and the original experimental data were then used as training inputs for BERT, which was calculated in terms of accuracy to identify the text types to which each method was adopted.

3.1. Data Cleaning

As depicted in Figure 2, the first rectangle represents the original text of the microblog, and we find that the text contains a great deal of redundant information; therefore, removing irrelevant information, such as emojis, web links, L-user videos (hyperlinked representation of microblogs), @users, etc., can enhance the focus of the text; thus, the second rectangle represents the text after removing the irrelevant information. In addition to this, we find that users can post tweets from mobile devices, but mobile emojis are not included in the Emoji library. As a result, we must divide the text into words, check whether each character is UTF-8 encoded, and eliminate non-UTF-8 encoded letters, as shown in the third rectangle. Users frequently use colloquial language when posting texts; therefore, commas are used more often because users are less concerned with the overall logical structure of a paragraph. To increase the efficiency of summary extraction, a full stop should be used in place of a comma in the text when there are fewer than three sentences during the data cleaning phase.

3.2. Key Sentence Extraction

Extracting key sentences from long Sina microblog texts reduces redundancy. This method also increases the focus of the text on its subject as well as the effectiveness of subsequent processing. This paper uses TextRank, TF-IDF, MMR, and LDA for key sentence extraction from four perspectives: graph-based ranking, statistical-based, maximum-edge-correlation-based, and topic-model-based. TextRank [28] and TF-IDF [29] are utilized frequently for keyword extraction, MMR [30] is utilized for document reordering, and LDA [31] is utilized for topic clustering. In principle, all of these methods compute the similarity between words or sentences, and key sentence extraction can be implemented based on the algorithm’s underlying principles.
The TextRank algorithm is a graph-based approach [32]. Furthermore, Li and Zhao [33] assessed the similarity between words by creating a concept vector and a keywords matrix and then extracted keywords using TextRank. TF-IDF is a statistically based method, which tends to keep significant words while removing unnecessary ones [34,35]. The main idea behind TF-IDF [36] is to find words with unique traits, and it can be used to make microtext lines easier to read. MMR considers the similarity between the extracted text and the entire document and between the extracted sentences and the summaries [37,38]. After calculating the similarity of each sentence to the entire text and between two sentences, the algorithm formula is iterated to rank the sentence scores of the microblog texts. LDA has three structural layers: words, topics, and text [39]. The topic with the most microblog sentences is chosen via similarity computation. We use probability to rank subject sentences to evaluate text sentence importance.

3.3. BERT Classification

BERT is a time-saving encoder that is well-suited for the migration learning of textual tasks and does not require a large corpus for training. The workflow of BERT was described in detail in the study by Lu et al. [40]. The BERT layer [21,41] extracts contextual semantic information from texts using the word, segmentation, and location embeddings in the flooded Sina microblog data topic classification task. The model in this paper is trained on the flooded Sina microblog dataset. The pre-training input to BERT is the sum of three vectors: token embeddings, segment embeddings, and position embeddings, where the token vector transforms each word into a word vector, segment embeddings indicate where the word belongs to, and position embeddings tell where the word belongs. The learned location information is represented by the location vector. Each line begins with the [CLS] flag, and the last position embeddings can be utilized as a semantic representation of the entire sentence, allowing it to be used for downstream classification tasks, and the [SEP] flag is used to distinguish between the two input sentences.

3.4. Accuracy Evaluation

On the issue of thematic classification, previous studies have typically been based on the accuracy (ACC), precision (P), recall (R), and F1-score (F1) [42] when evaluating the strengths and weaknesses of each model. Therefore, this paper evaluates the model using Acc, P, R, and F1. Prediction accuracy is Acc (positive category and negative category). P is the percentage of positive predictions that were correct. R is the ratio of accurate positive forecasts to all positives. F1 is a model recall–accuracy average. These indexes are calculated via four statistical evaluations: true positive (TP), false positive (FP), true negative (TN), and false negative (FN). TP and TN, respectively, indicate the number of true samples and false samples, which are classified into the corresponding categories correctly. FP indicates the number of true samples divided into the false sample. FN indicates the number of false samples divided into the true sample. Four accuracy evaluation methods work best for sample imbalance, misdetection, and omission errors. Equations (1)–(4) can be used to calculate accuracy, precision, recall, and F1, respectively:
A c c u r a c y = T P + T N T P + T N + F P + F N
P r e c i s i o n = T P T P + F P
R = T N T N + F N
F 1 = 2 × P × R P + R

4. Applicability Analysis Experiments and Results

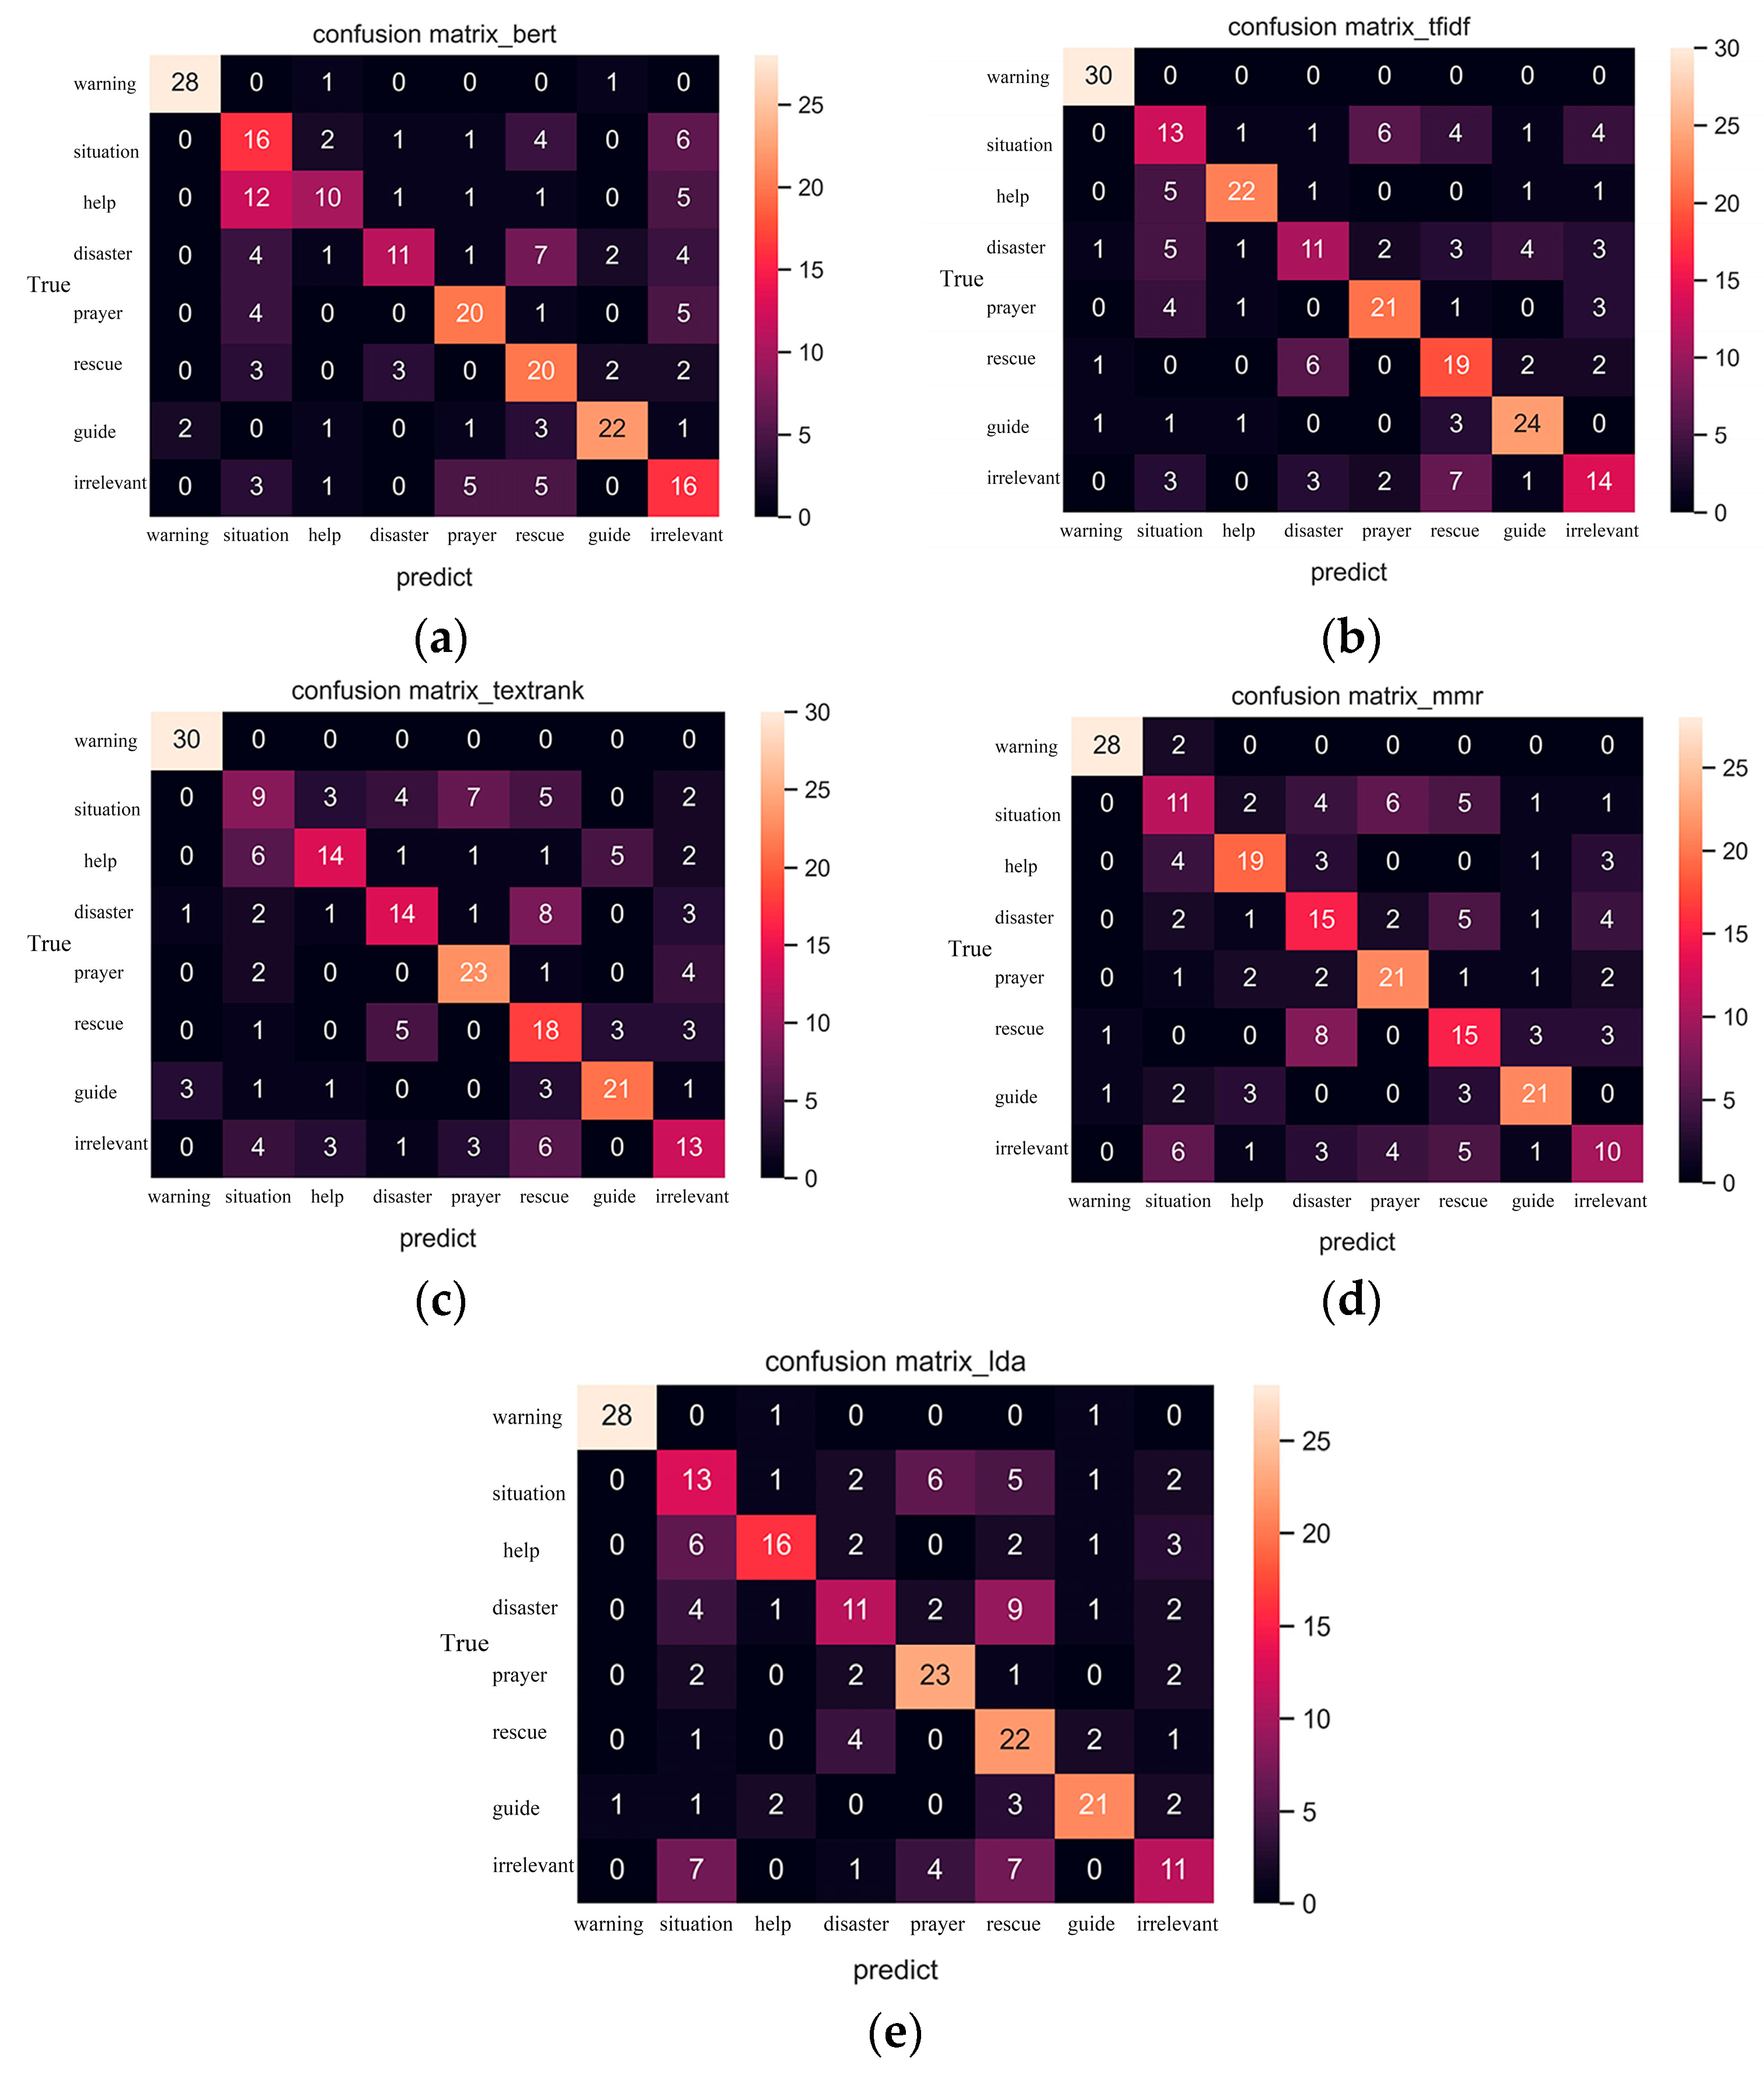
4.1. Topic Classification Results

The Sina microblog standard microblogs have a 140-character limit, double that of text messages, indicating that 70 characters can express simple semantics and 140 can convey single-thing information. Zhang et al. [43] found that 63% of the sentences extracted are very relevant to the text’s topic; therefore, the public usually expresses the same topic in three sentences. To guarantee text and eliminate irrelevant sentences, three key sentences are extracted. We use four algorithms, TextRank, MMR, TF-IDF, and LDA, to process the text in datasets 1, 2, 3, and 4. Each dataset has 3600 training and 400 test records. One epoch completes forward and backpropagation. Multiple experiments can be found wherein the model test results tend to be stable when the epoch is set to 15; therefore, in the subsequent experiments, the epoch is set to 15.
The training set accuracy for each of the different datasets was 100%, and a comparison of the best test set accuracy comparisons is shown in Table 2 below. The results of the elapsed time indicate that the four extractive summary algorithms reduce the length of the text and improve the training efficiency of the model by removing redundant sentences after extracting the text’s key information. A comprehensive evaluation of the model using accuracy evaluation indexes, such as Acc, P, R, and F1, demonstrates that key sentence extraction reduces the redundancy of the Sina microblog text and improves the classification’s efficiency and accuracy. As shown in Table 2, TF-IDF-BERT, TextRank-BERT, MMR-BERT, and LDA-BERT have all improved in some way over BERT, with TF-IDF-BERT demonstrating the greatest improvement. The same experimental steps were carried out on the Hubei intensive rainfall dataset, and the results are shown in Table 3; the trends are roughly the same as the Henan intensive rainfall dataset above, except for the slightly more erratic TextRank-BERT results.
Confusion analysis was performed for the Henan and Hubei intensive rainfall events to check the misclassification level. There is not much misclassification in the Hubei intensive rainfall dataset, while for the Henan intensive rainfall dataset, misclassifications are severe, affecting the test set accuracy of the five methods, as shown in Figure 3. The warning and guide categories are both instructional in nature and contain forewarning and reminder content; the help and rescue categories, although active and passive in subject matter, typically appear together in textual expressions. Semantic proximity leads to category confusion; therefore, they are merged to solve the problem. The topic “warning” and “guide” were merged into “tips”, “situation” and “disaster” were merged into “situation”, “help” and “rescue” were merged into “rescue”, and “prayer” and “irrelevant” were merged into “emotions” to avoid confusion. In addition, a hotspot is often a focus of natural disasters, and the State Council executive meeting of China was alarmed by the Zhengzhou Metro Line 5 fatality [44]; therefore, the hotspot was also listed as a topic.
The number of Sina microblog texts for each category before and after the merging is shown in Table 4. As can be seen, there are fewer entries in the prompt category and more in the emotions category. As it is randomly selected for labeling, it matches the ratio of the categories of the Sina microblogs issued for the whole Henan intensive rainfall event.
The data from the model test set were reclassified into the new five categories of “hotspots, situation, tips, rescue, and emotions” and re-entered into the prediction model. Table 5 displays the prediction results of the five models, with the accuracy being improved by about 10%.
Hotspots are representative of the entire flooding event, and studying them allows us to analyze the event from a very subtle perspective, discovering interesting and fruitful details. Extreme rainstorms destroyed the Wulongkou car park’s water retention fence and poured into the metro tunnel during the Henan intensive rainfall event. The discussion of current events contains an abundance of useful information. As illustrated in Figure 4, the change in the water level can be extracted from Sina microblogs in order to map the severity of the Henan intensive rainfall event.

4.2. Applicability Analysis

4.2.1. User Type Analysis

The topic classification on the Government Affairs and We Media Microblogs for the Henan and Hubei intensive rainfall events are displayed in Table 6 and Table 7. All of the classification methods have higher accuracy in terms of the Government Affairs Microblogs than the We Media Microblogs, and BERT has the highest accuracy. Government Affairs Microblogs usually have explicit intentions, little redundancy, and fixed expression patterns of “whole-part” or “part-whole”, and the first or last sentence is often able to express the theme of the entire text. Extracting only a portion may destroy the contextual links and affect the accuracy. Therefore, no key sentence extraction is needed for Government Affairs Microblogs, and BERT is suitable for the processing of this type of text.
Unlike the Government Affairs Microblogs, there is no fixed structure for We Media Microblogs, and topic sentences may appear in the first, middle, or even the last sentences. In addition, the texts often have vague and emotional expressions, focusing more on an opinion or emotional catharsis, making it difficult to extract the topic.

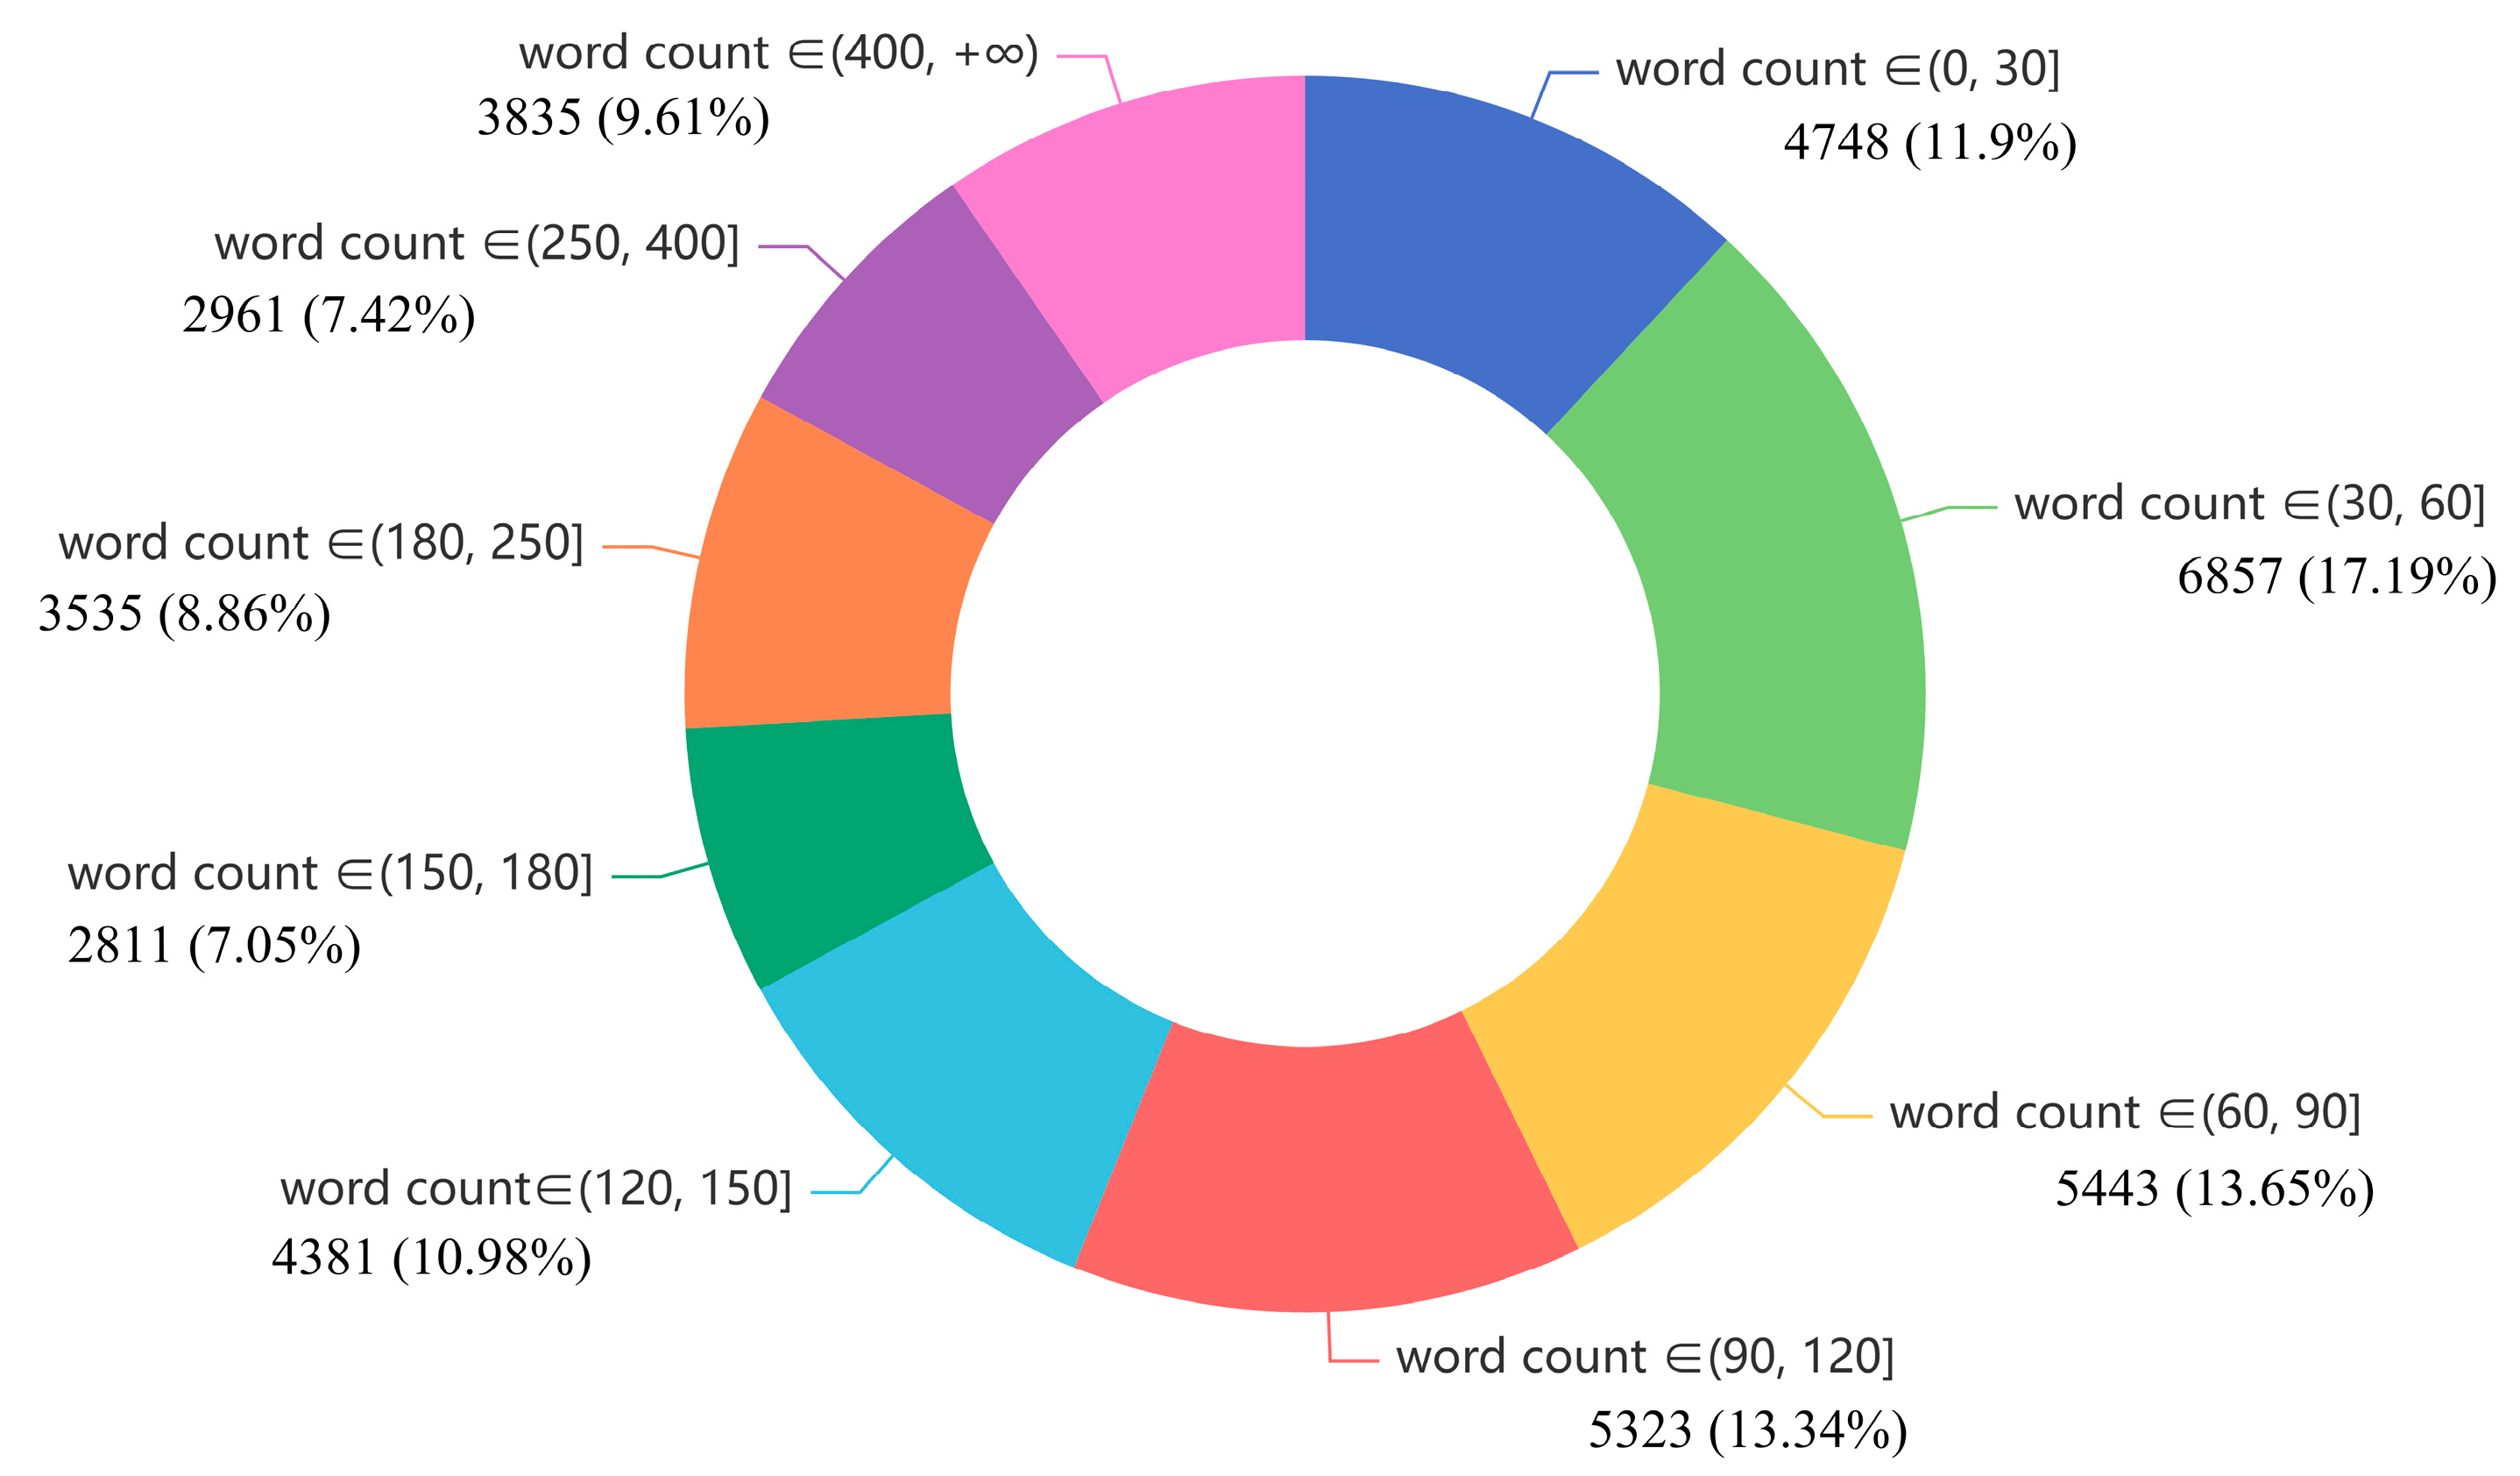
4.2.2. Text length Analysis

Sina microblogs vary in length. Figure 5 shows the number of Sina microblogs with text lengths in 15-word intervals, such as 0–15, 16–30,…, and >390, etc. There is an inverse correlation between the number of postings and the word number of a certain posting, which suggests that individual users do not accumulate multiple events to send together but rather tend to describe what occurred instantly and express their feelings. To choose the most important subjects, the text must be specified using rules related to this form of text if it comprises a given number of words, phrases, and topics.
Based on the length of the text, individual microblog texts are divided into three sets, word count ∈ (1, 70), word count ∈ (70, 140), and word count ∈ (140, +∞). The accuracy of each of the five models is evaluated by inserting each of the three datasets into it, and the evaluation’s findings are presented in Table 8 and Table 9.
The findings indicate that TF-IDF-BERT performs noticeably better when the number of words is either relatively low or relatively high, whereas LDA-BERT performs significantly better when the number of words is medium. TF-IDF ranks the importance of sentences more effectively than the other three methods when the number of words is small. The dataset is then fed into BERT for training, and BERT can better learn the relationship between the sentences. When the number of words is moderate, LDA is the most common clustering technique, and the vocabulary of Sina microblog text is more colloquial and less transformed. Therefore, clustering can be carried out according to the topics that are expressed by each sentence in the text. When the word count is high, there are more topics expressed between each sentence of the text, and it is difficult to classify them. However, TF-IDF can not only consider the number of words in each sentence but also consider the sentence connection according to the word frequency.

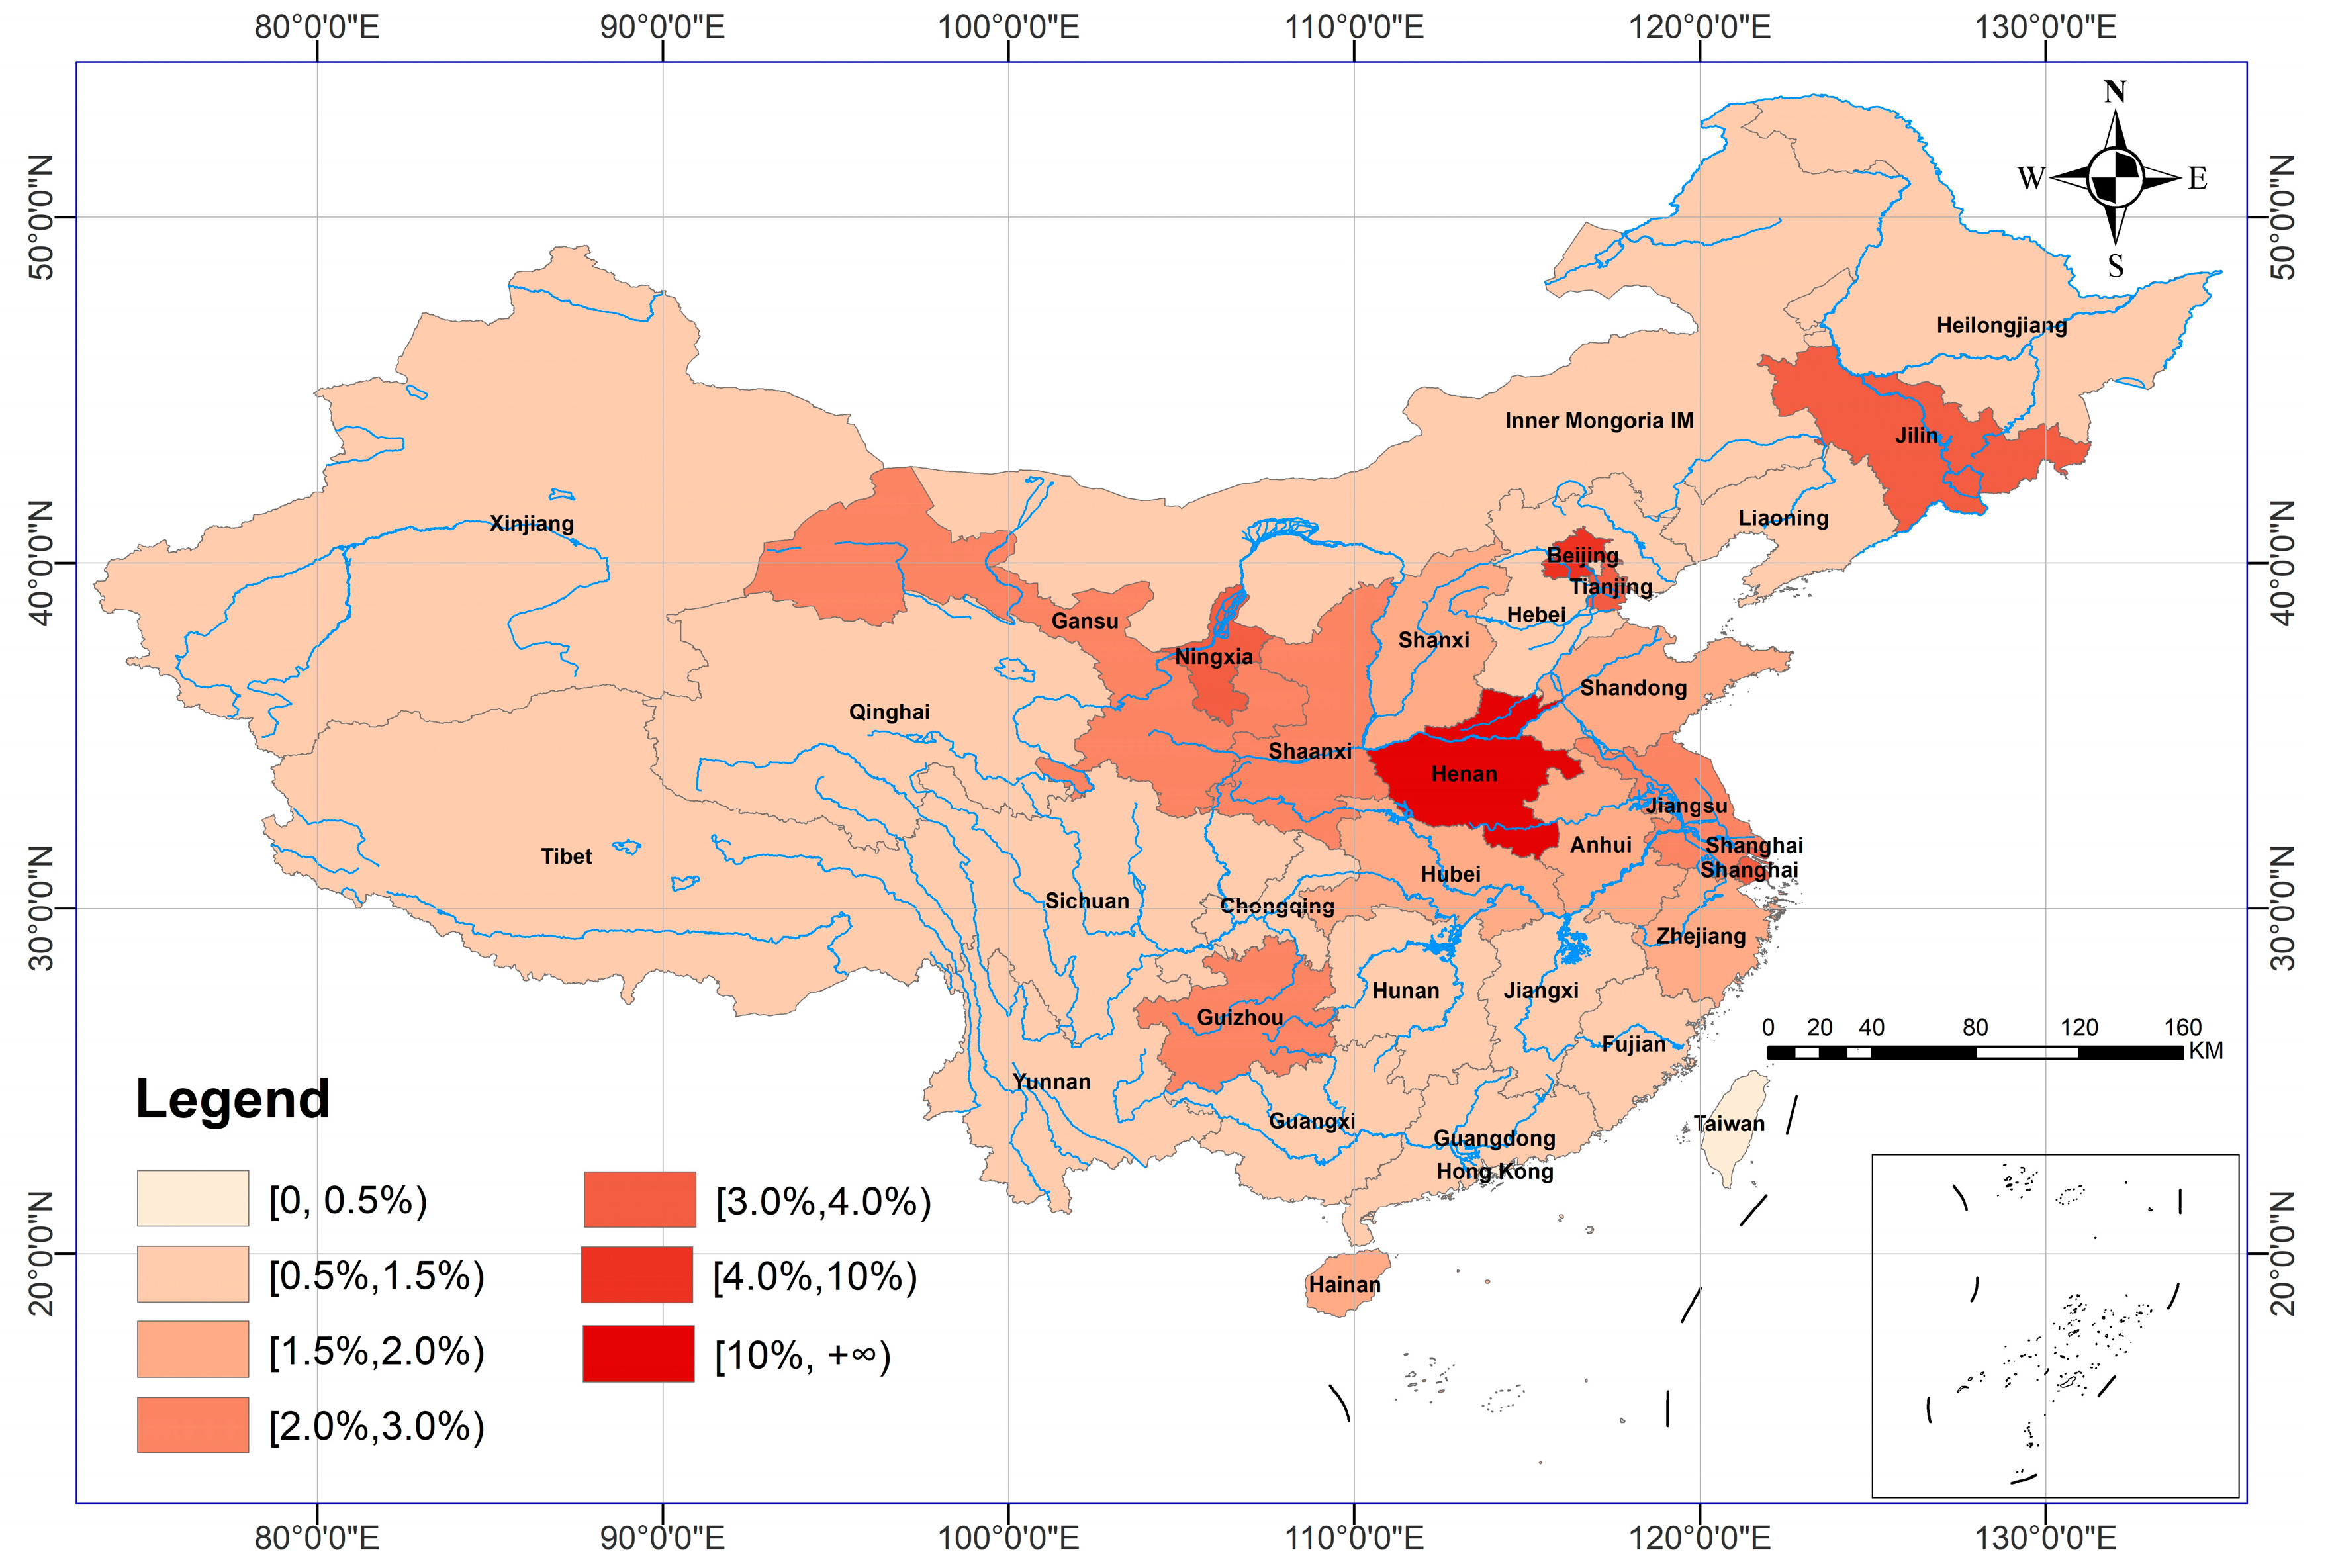
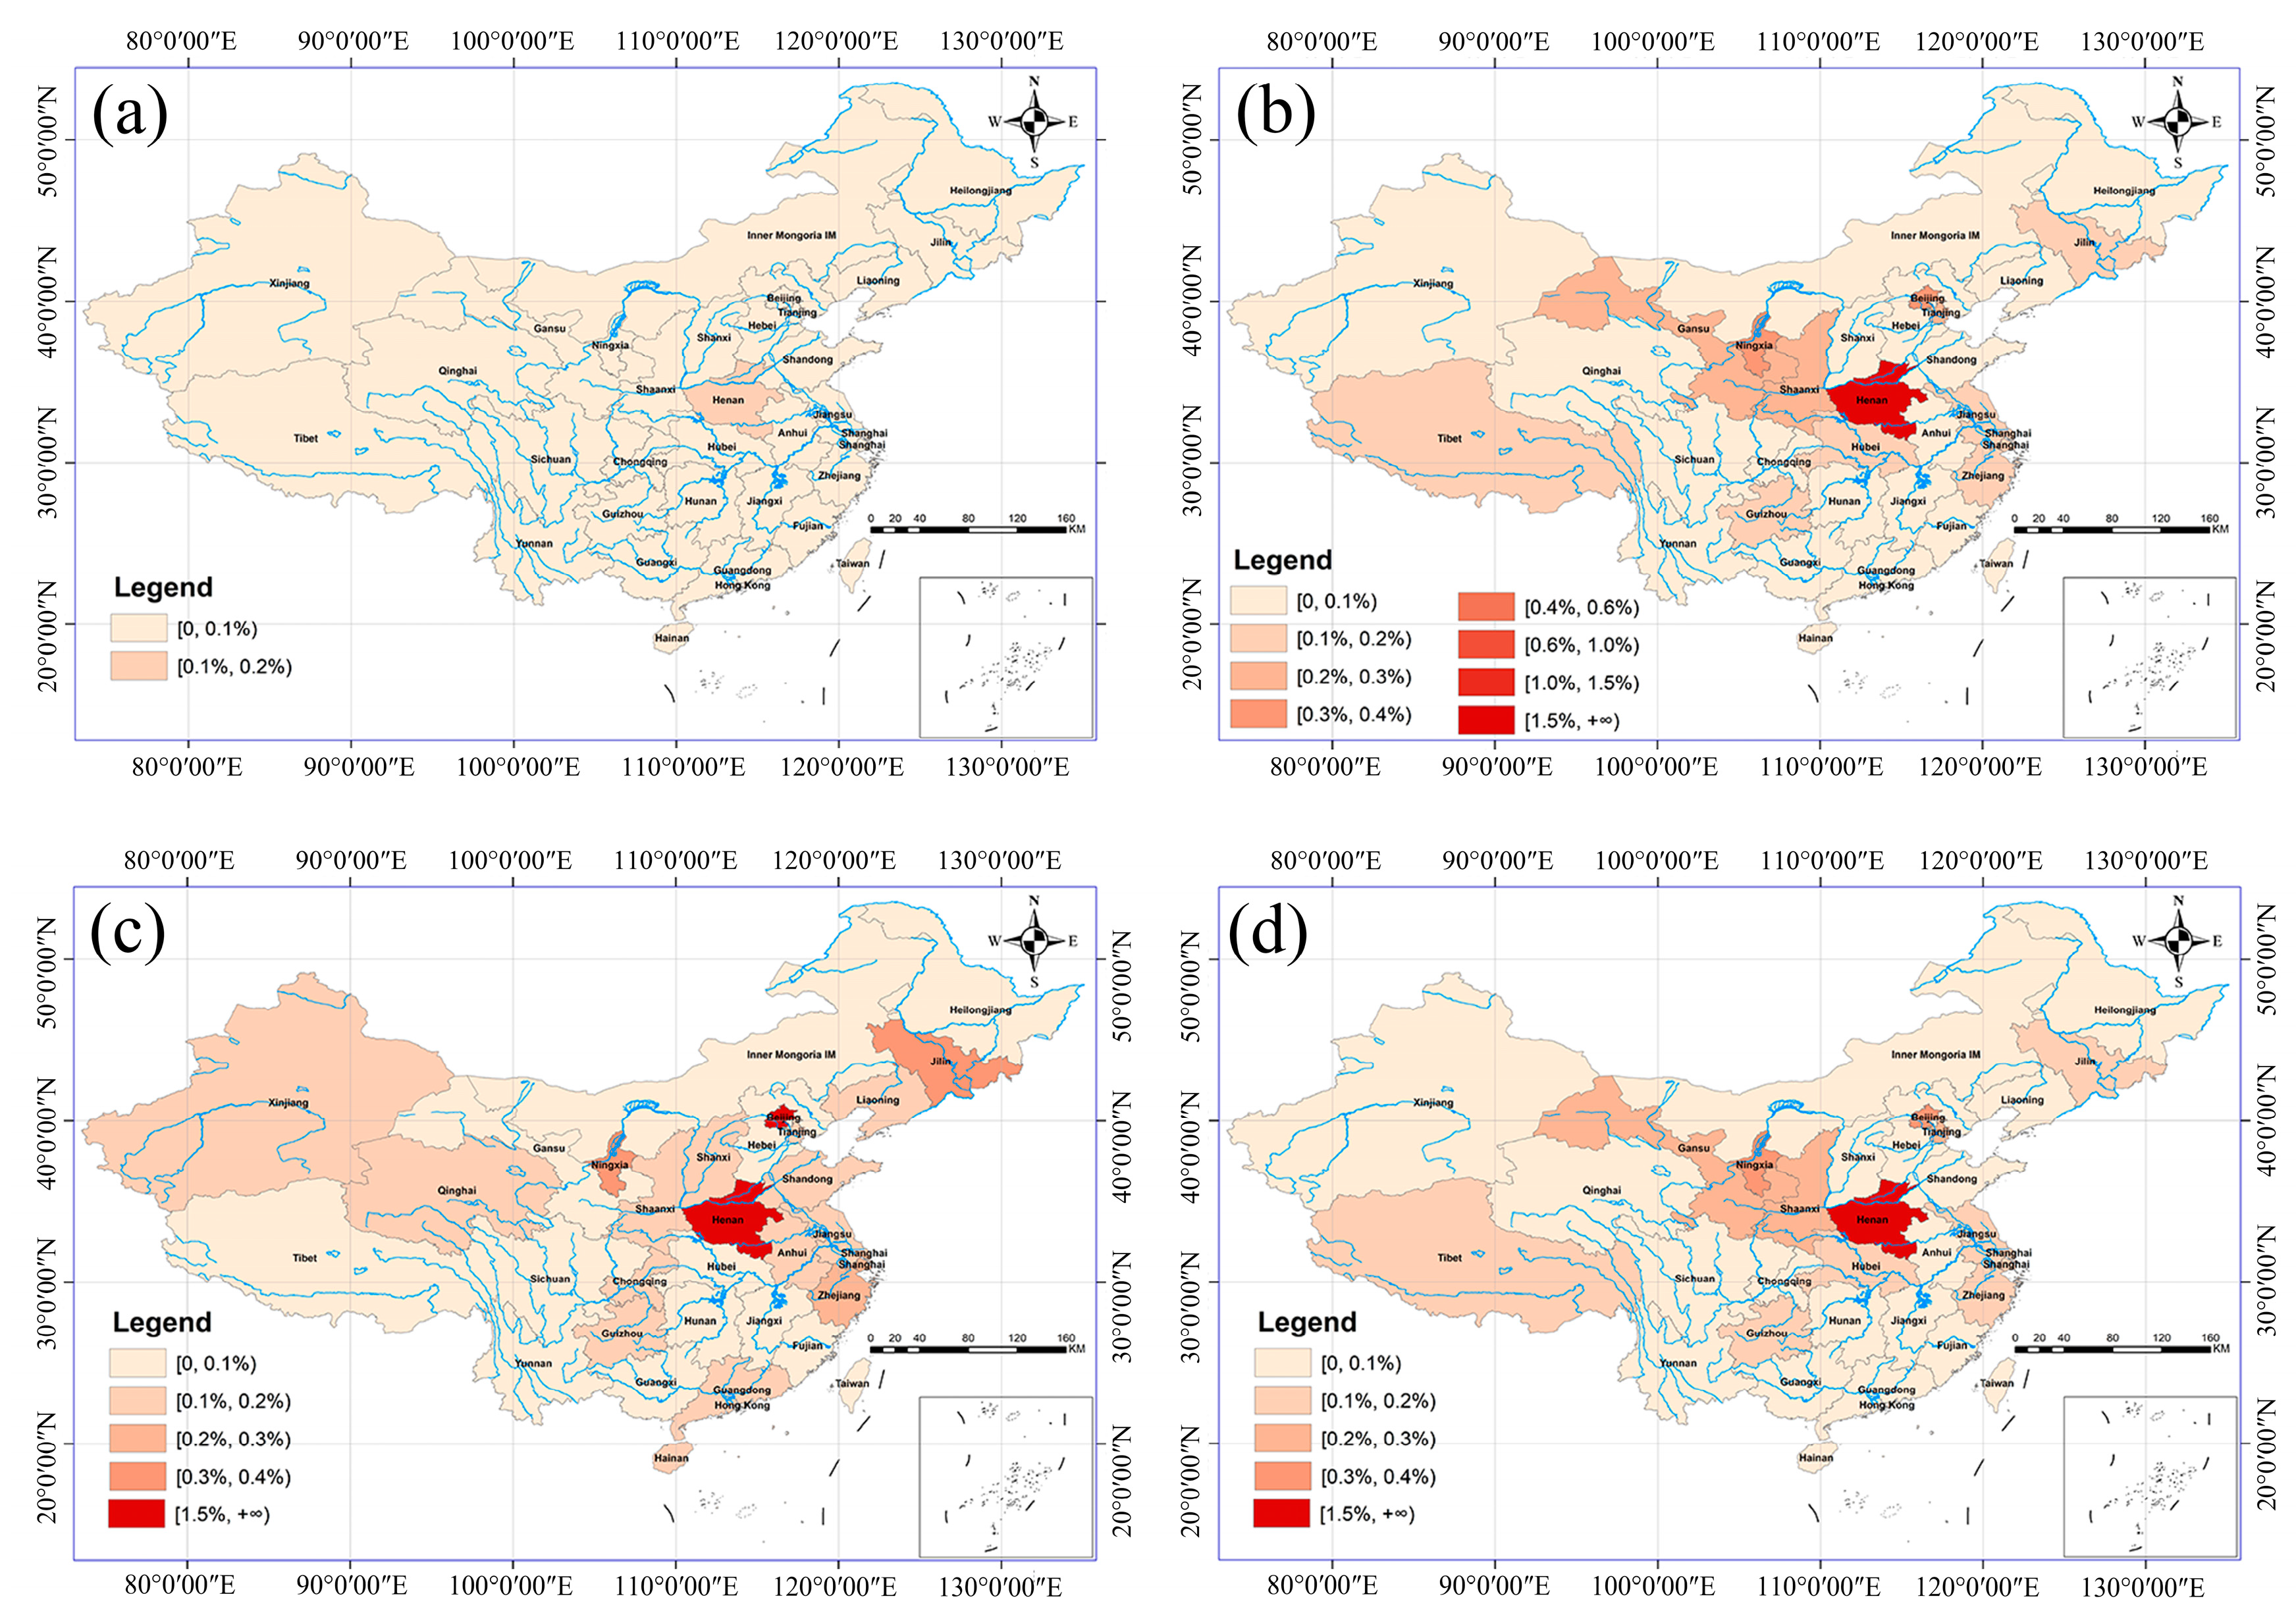
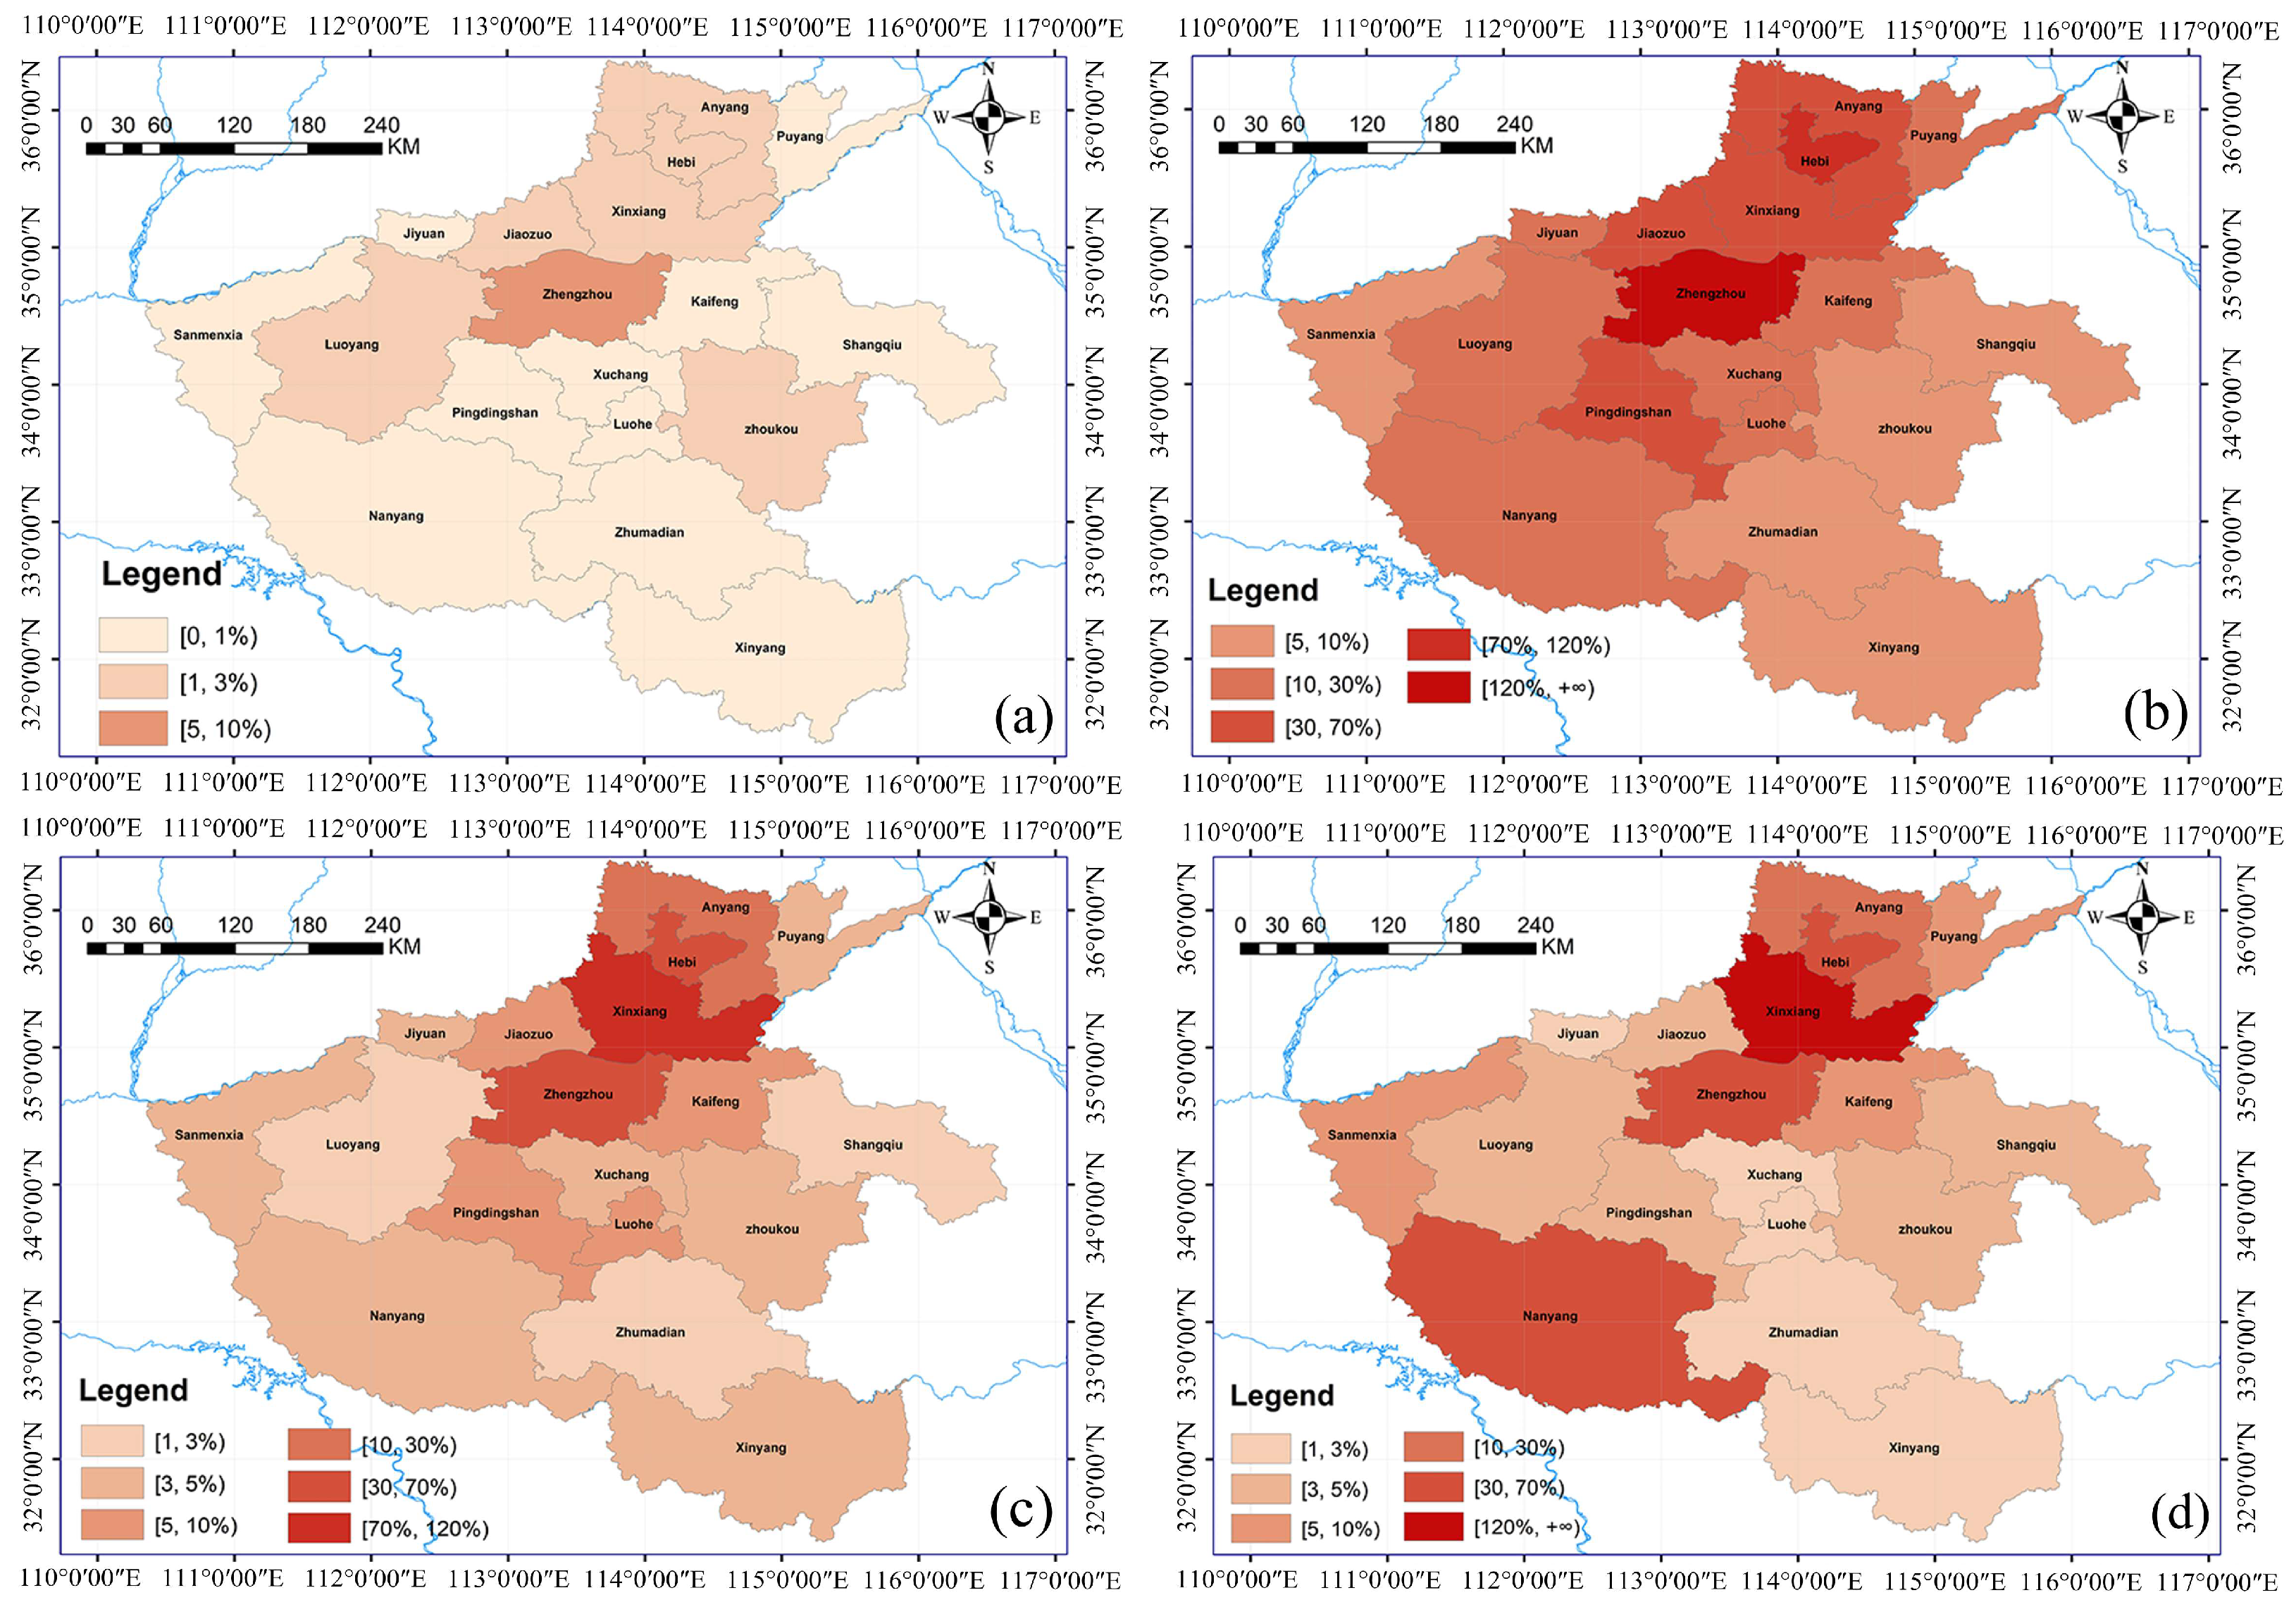
5. Spatiotemporal Analysis of the Text Themes

5.1. Validation of Classification Results
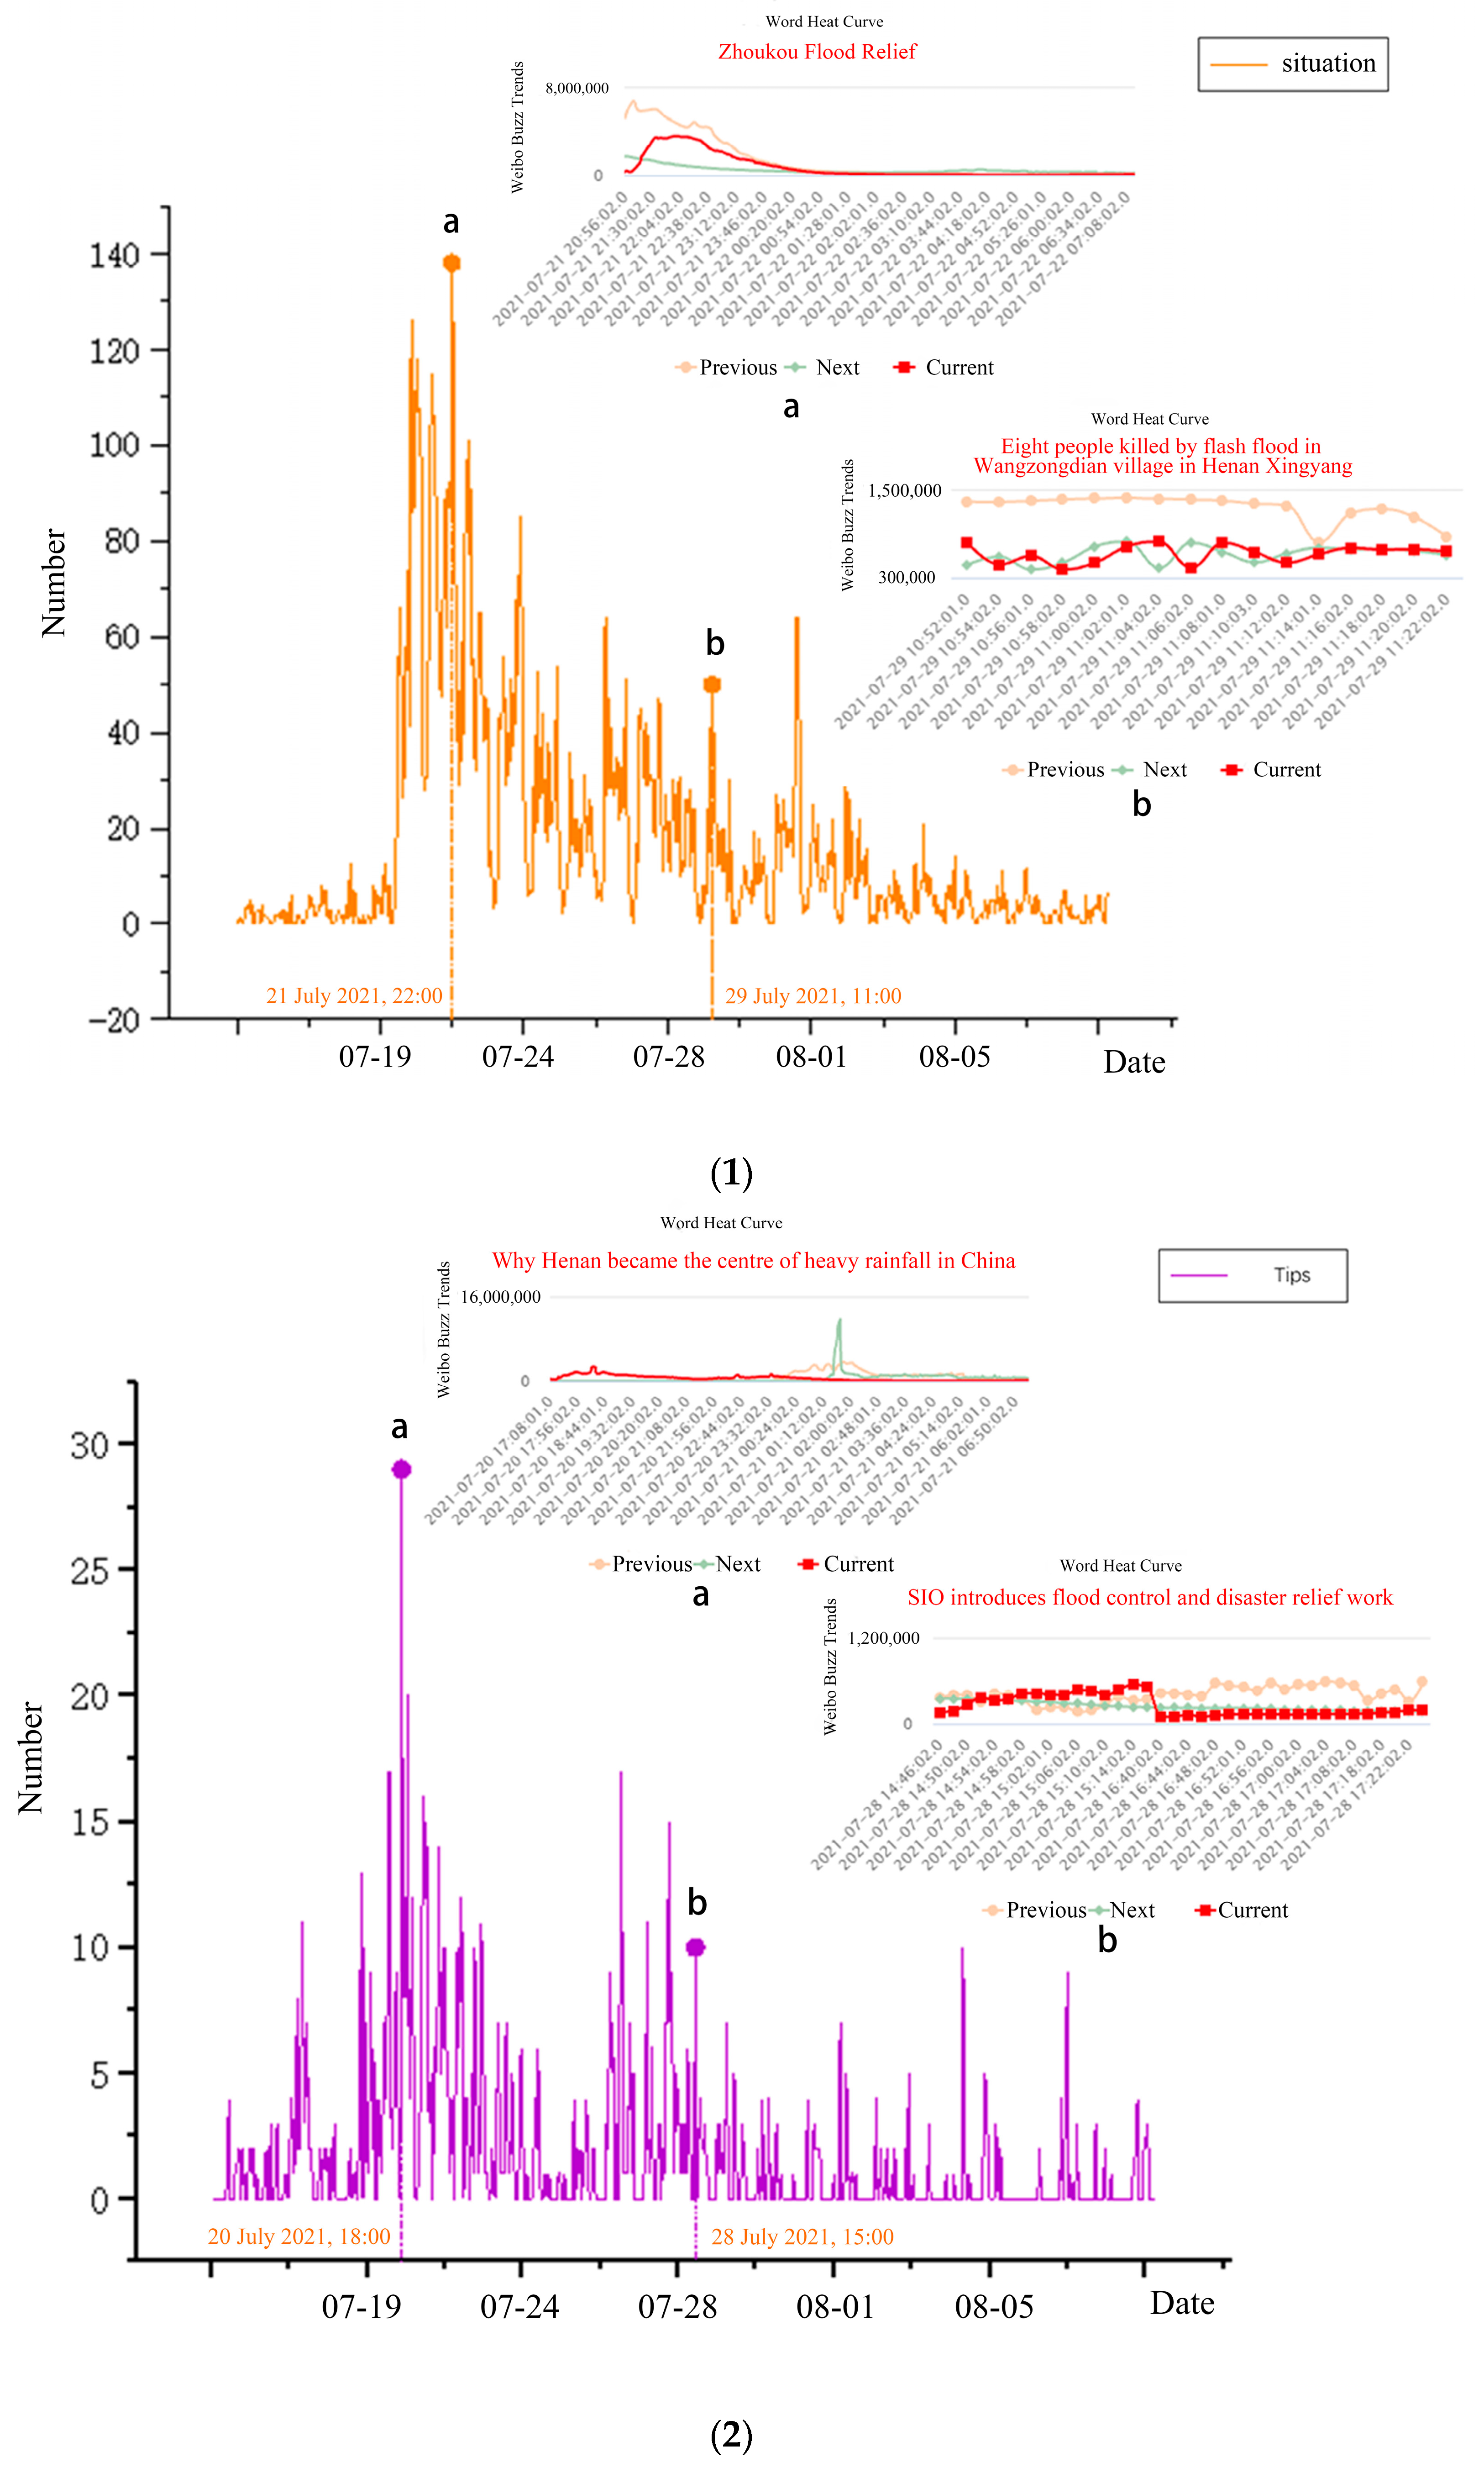
Referring to a study by Scheele et al. [45] that combined data from social media with data from reliable sources, we compared Sina microblog hot search-related topic terms and plotted the validation results, where the subplots indicate the trend of the term’s hotness over time (to ensure image clarity, the text is shown in the case category, and the rest of the category images are placed in Figure A1(1)–(4) in Appendix A). Figure 6 and Appendix A Figure A1(1)–(4) demonstrate that Sina microblog hot search list closely matches user attention and direction of hot content: situation, tips, rescue, emotion, and hot categories peaked at 17:00, 18:00, 15:00, and 21:00. On July 20, urban Zhengzhou experienced 120–201.9 mm of rain between 16:00 and 17:00. At 18:00, the Zhengzhou Metro Line 5 access line water retaining wall broke into the main line interval. At 20:00, the flood control level III emergency response began. The list of hot search phrases matches the curve’s peak:
(1)
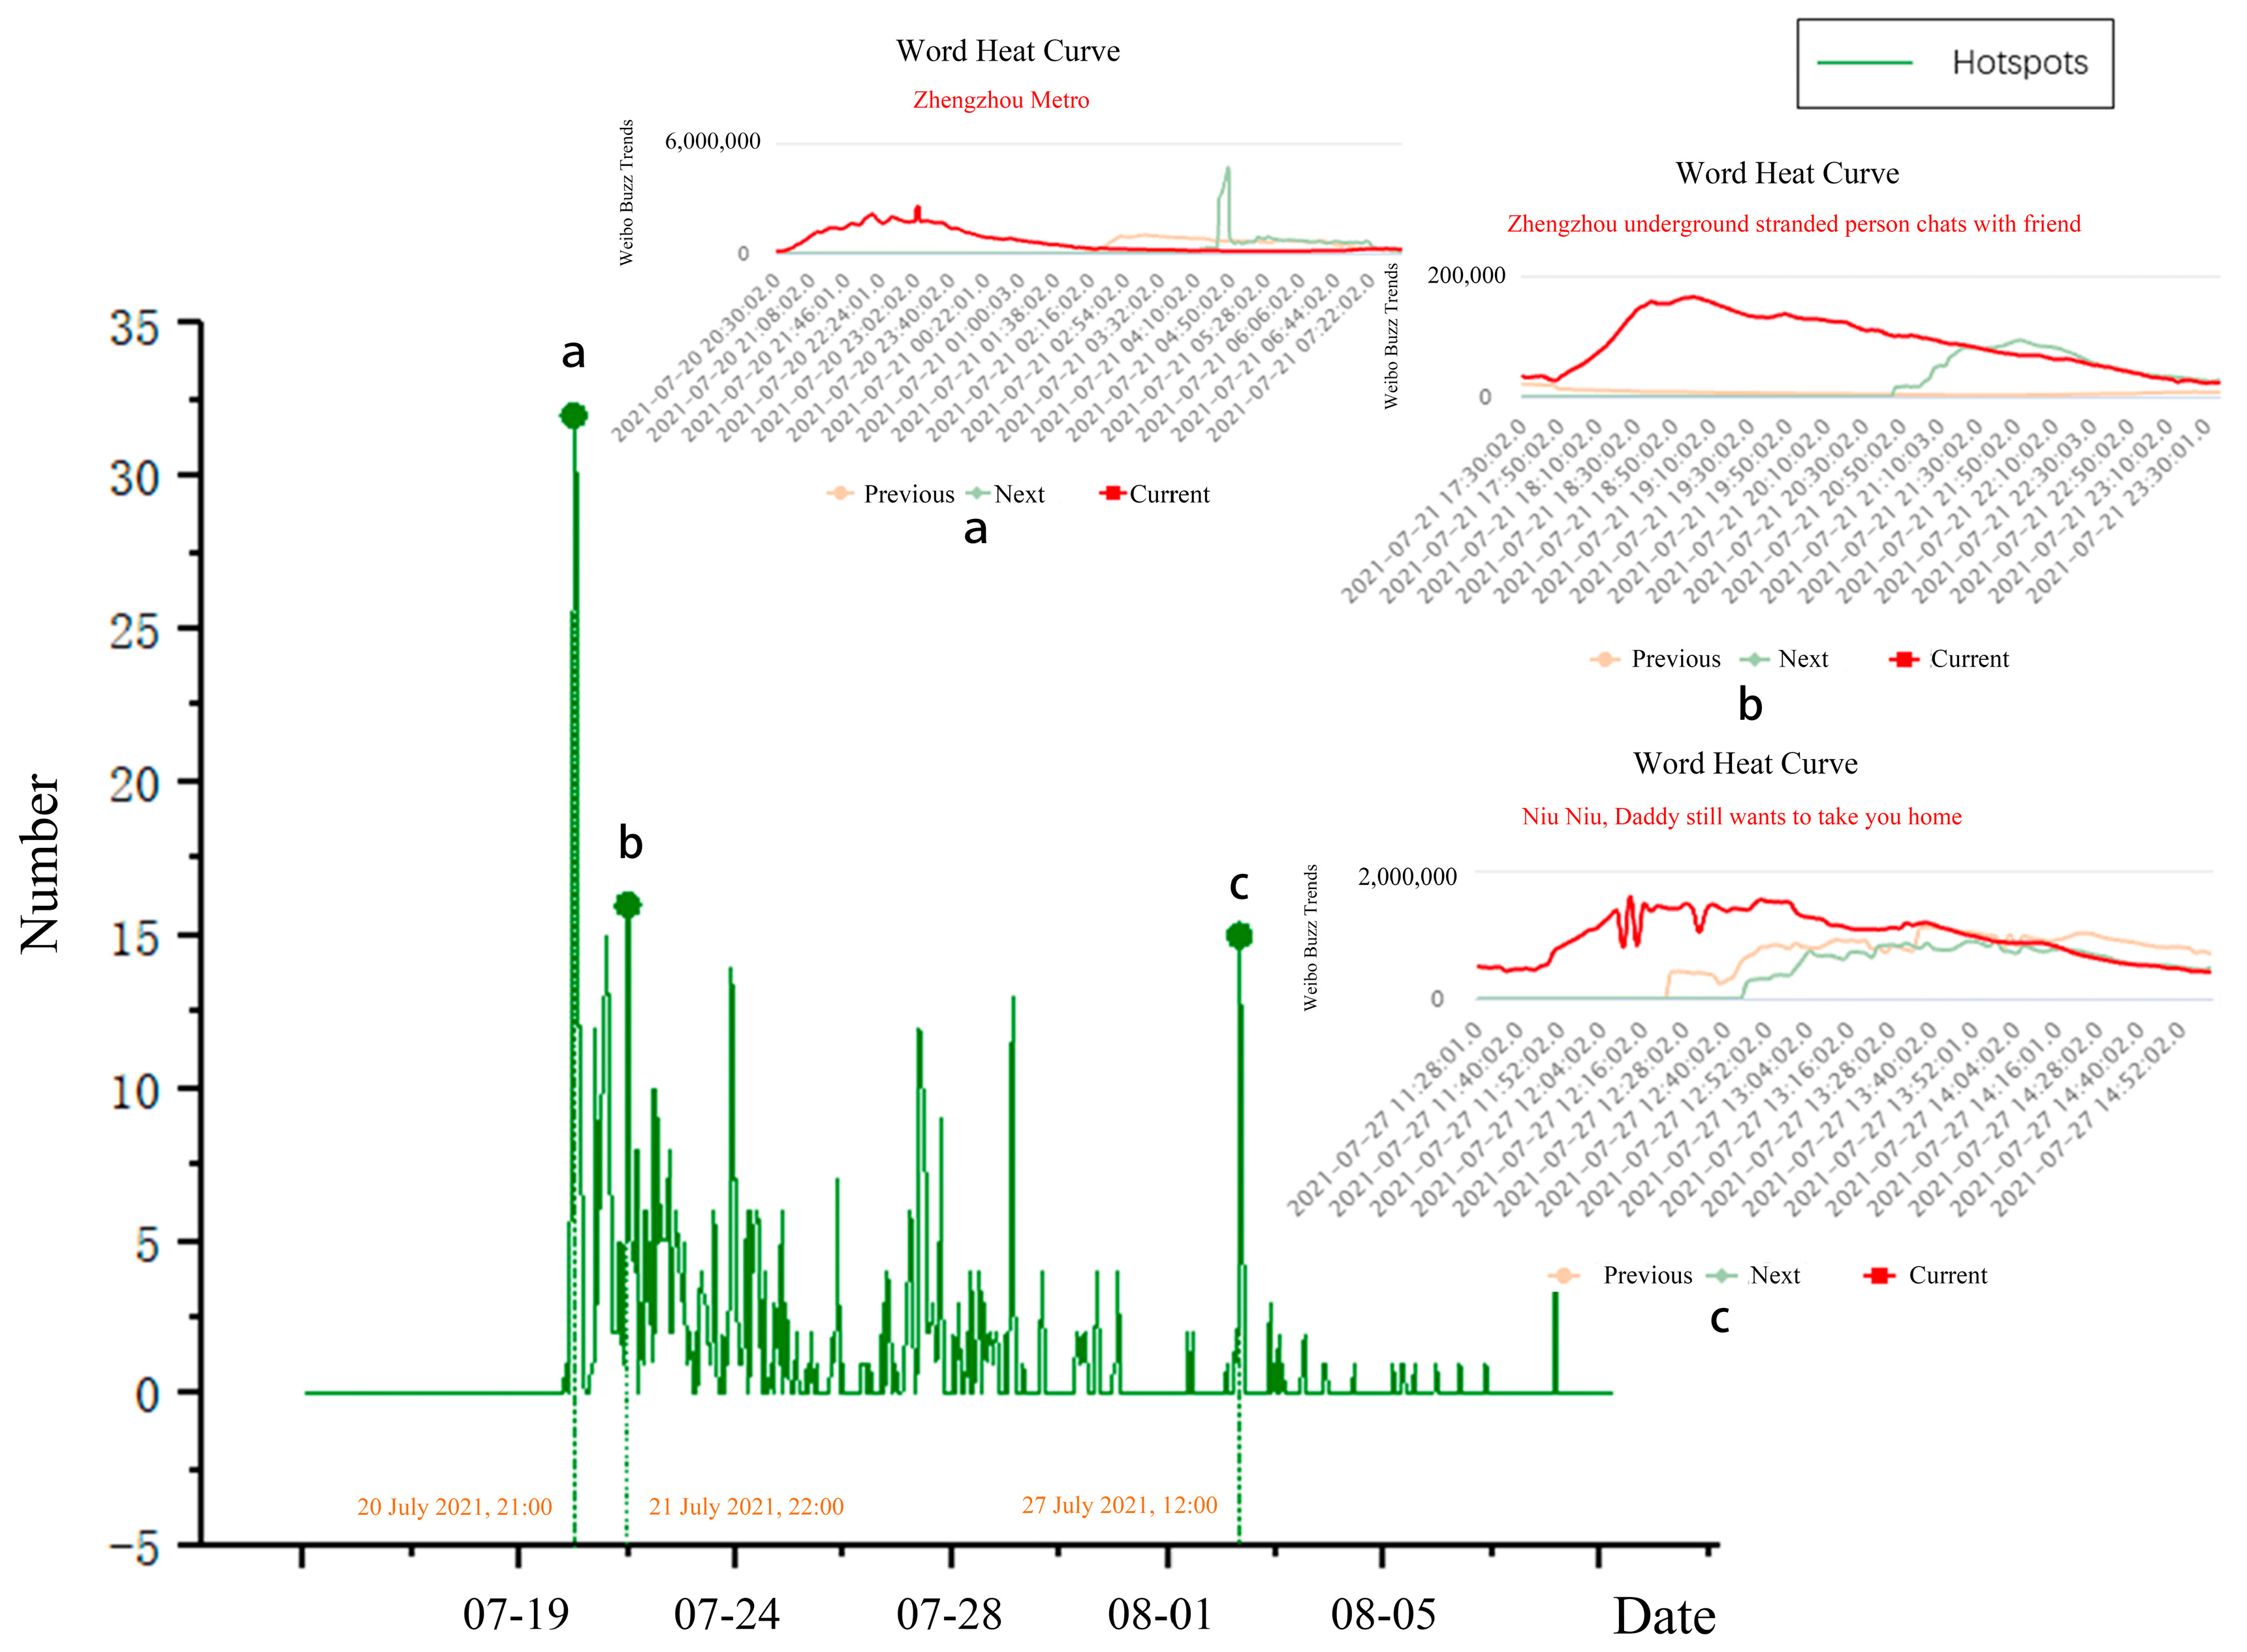
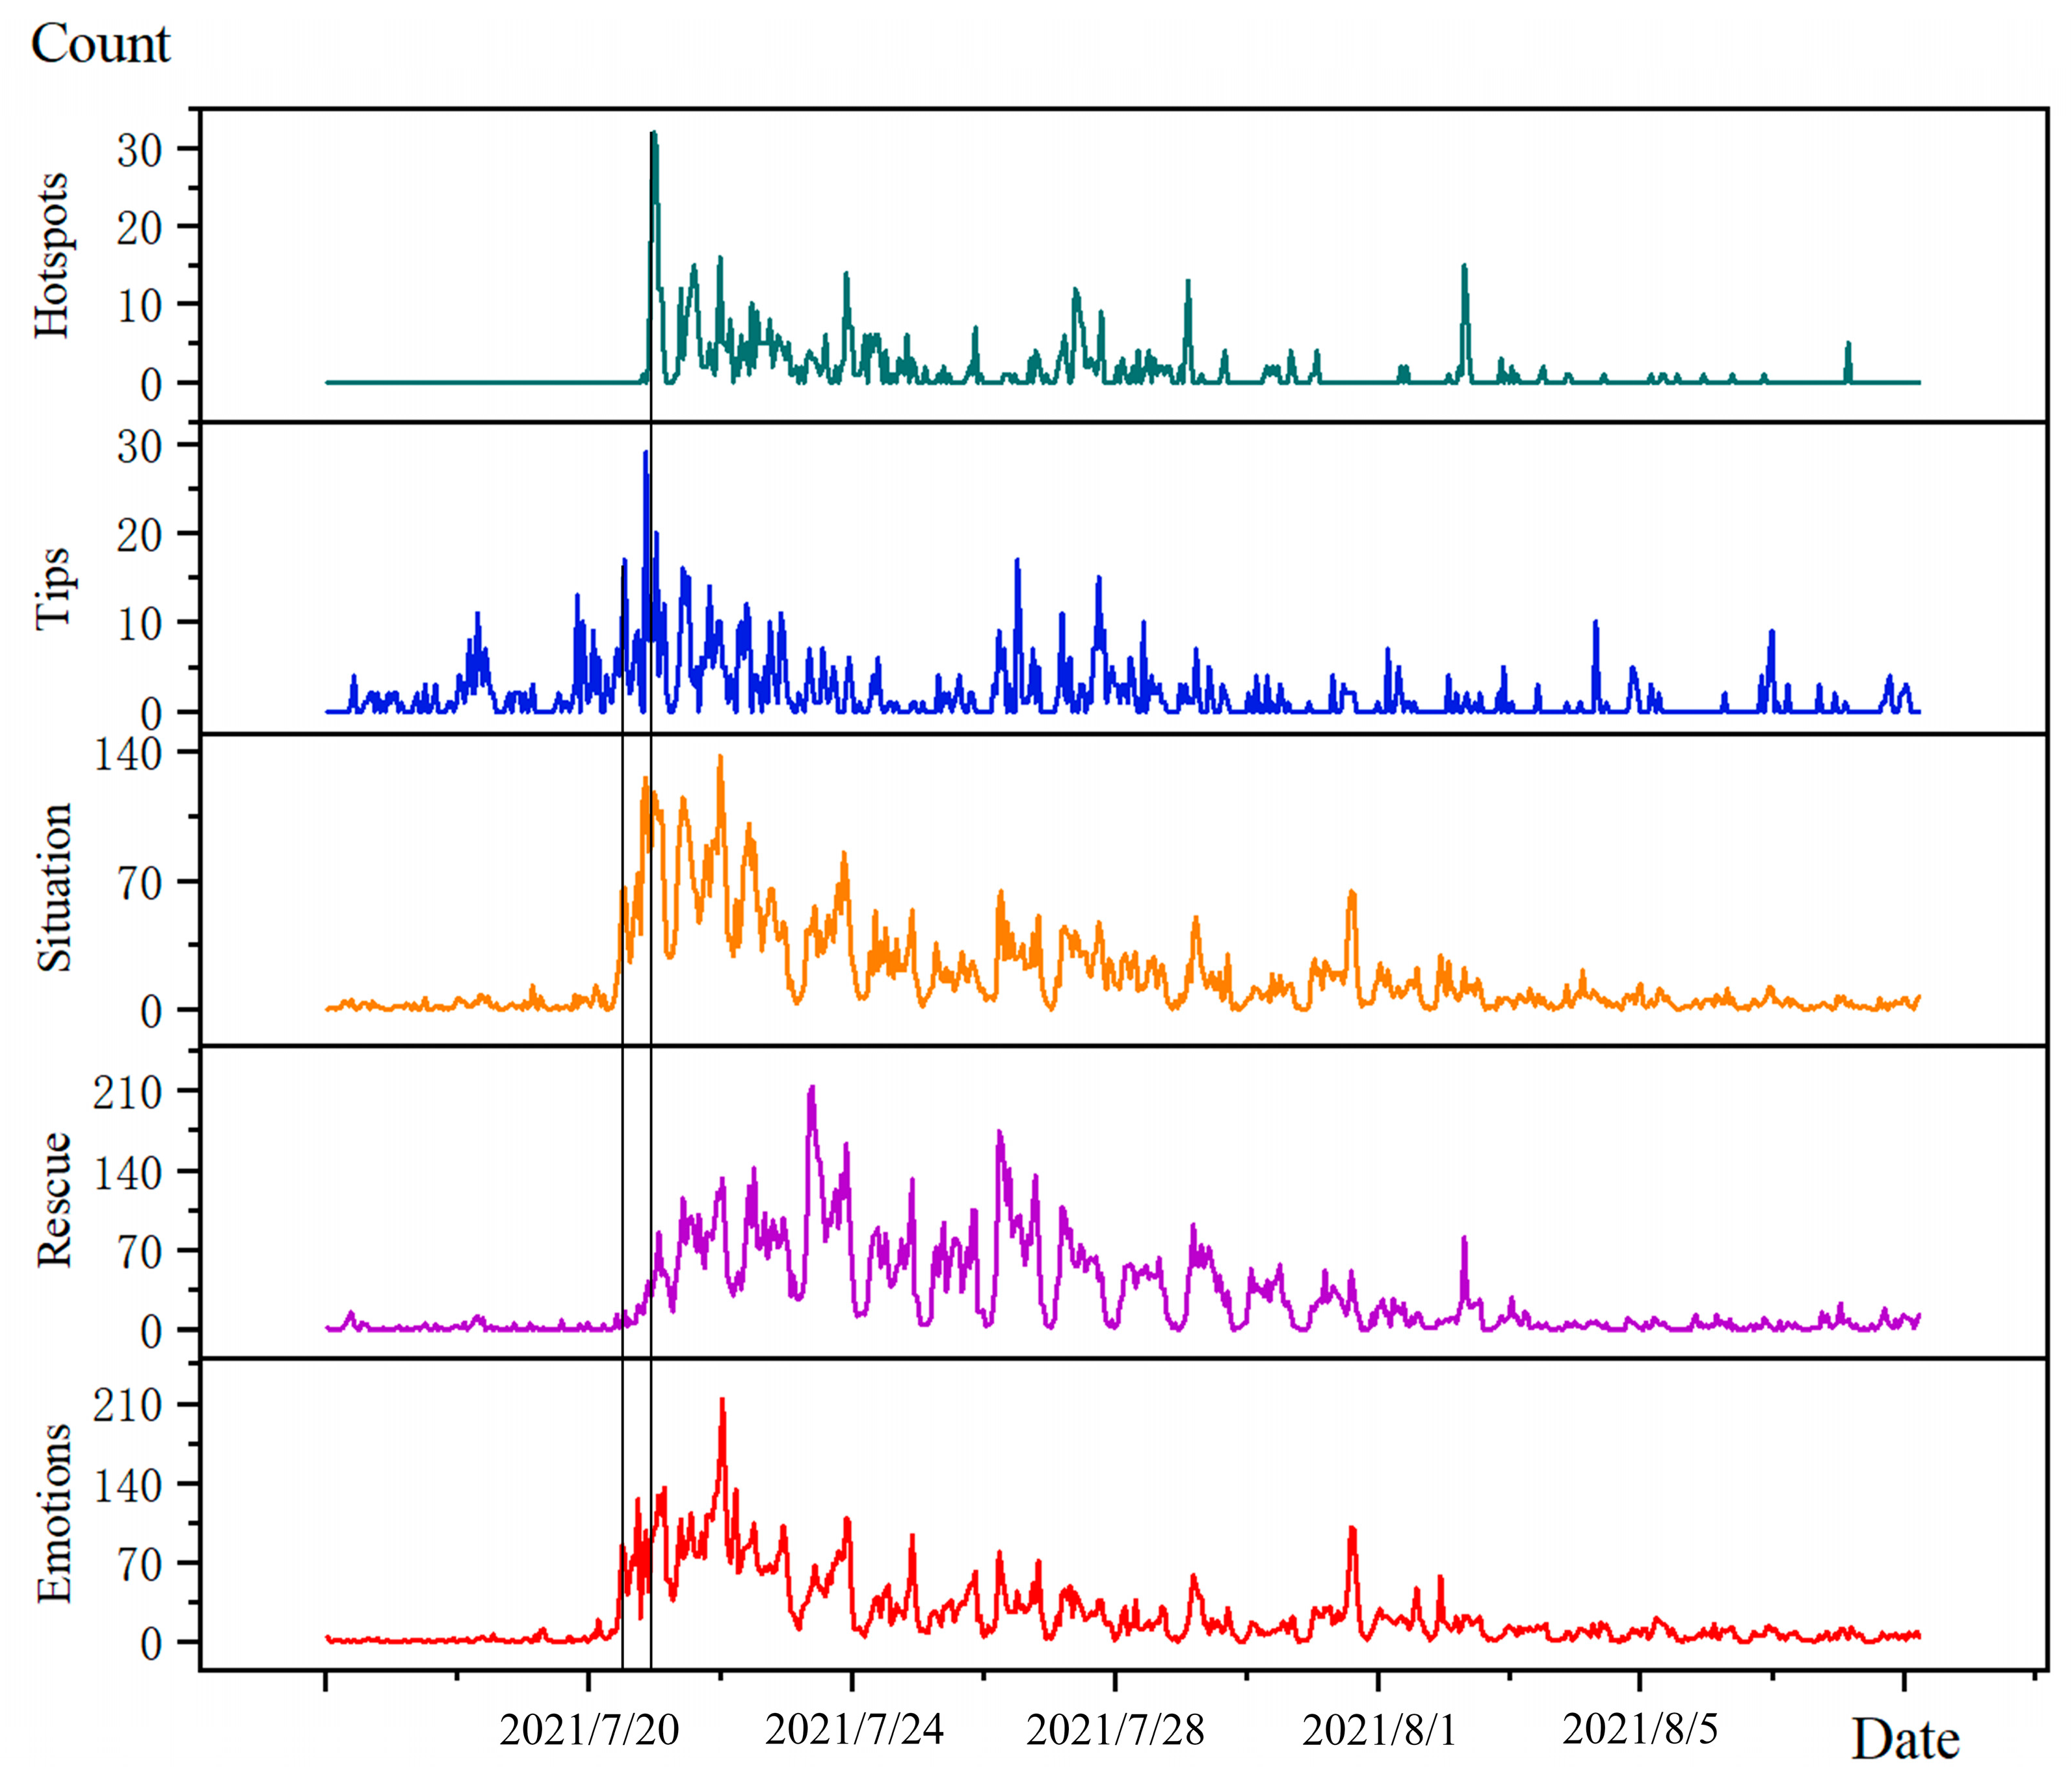
In the situation category, “Zhoukou Flood Relief” and “Xinxiang torrential rain” were among the top 10 Sina microblog searches by 22:00 on 21 July. “Eight people killed flash flood in Wangzongdian village in Henan Xingyang” trended on the Sina microblog at 11:00 on 29 July after the torrential rain stopped.
(2)
In the category of tips, on 20 July, the microblogging search trending list at 18:00 included “Why Henan became the center of heavy rainfall in China” and “Flood control emergency response in Zhengzhou, Henan Province was raised to level 1”; therefore, there was a peak on 28 July, and “The State New Office introduced the flood control and disaster relief work” was on the top lists because the government usually sums up.
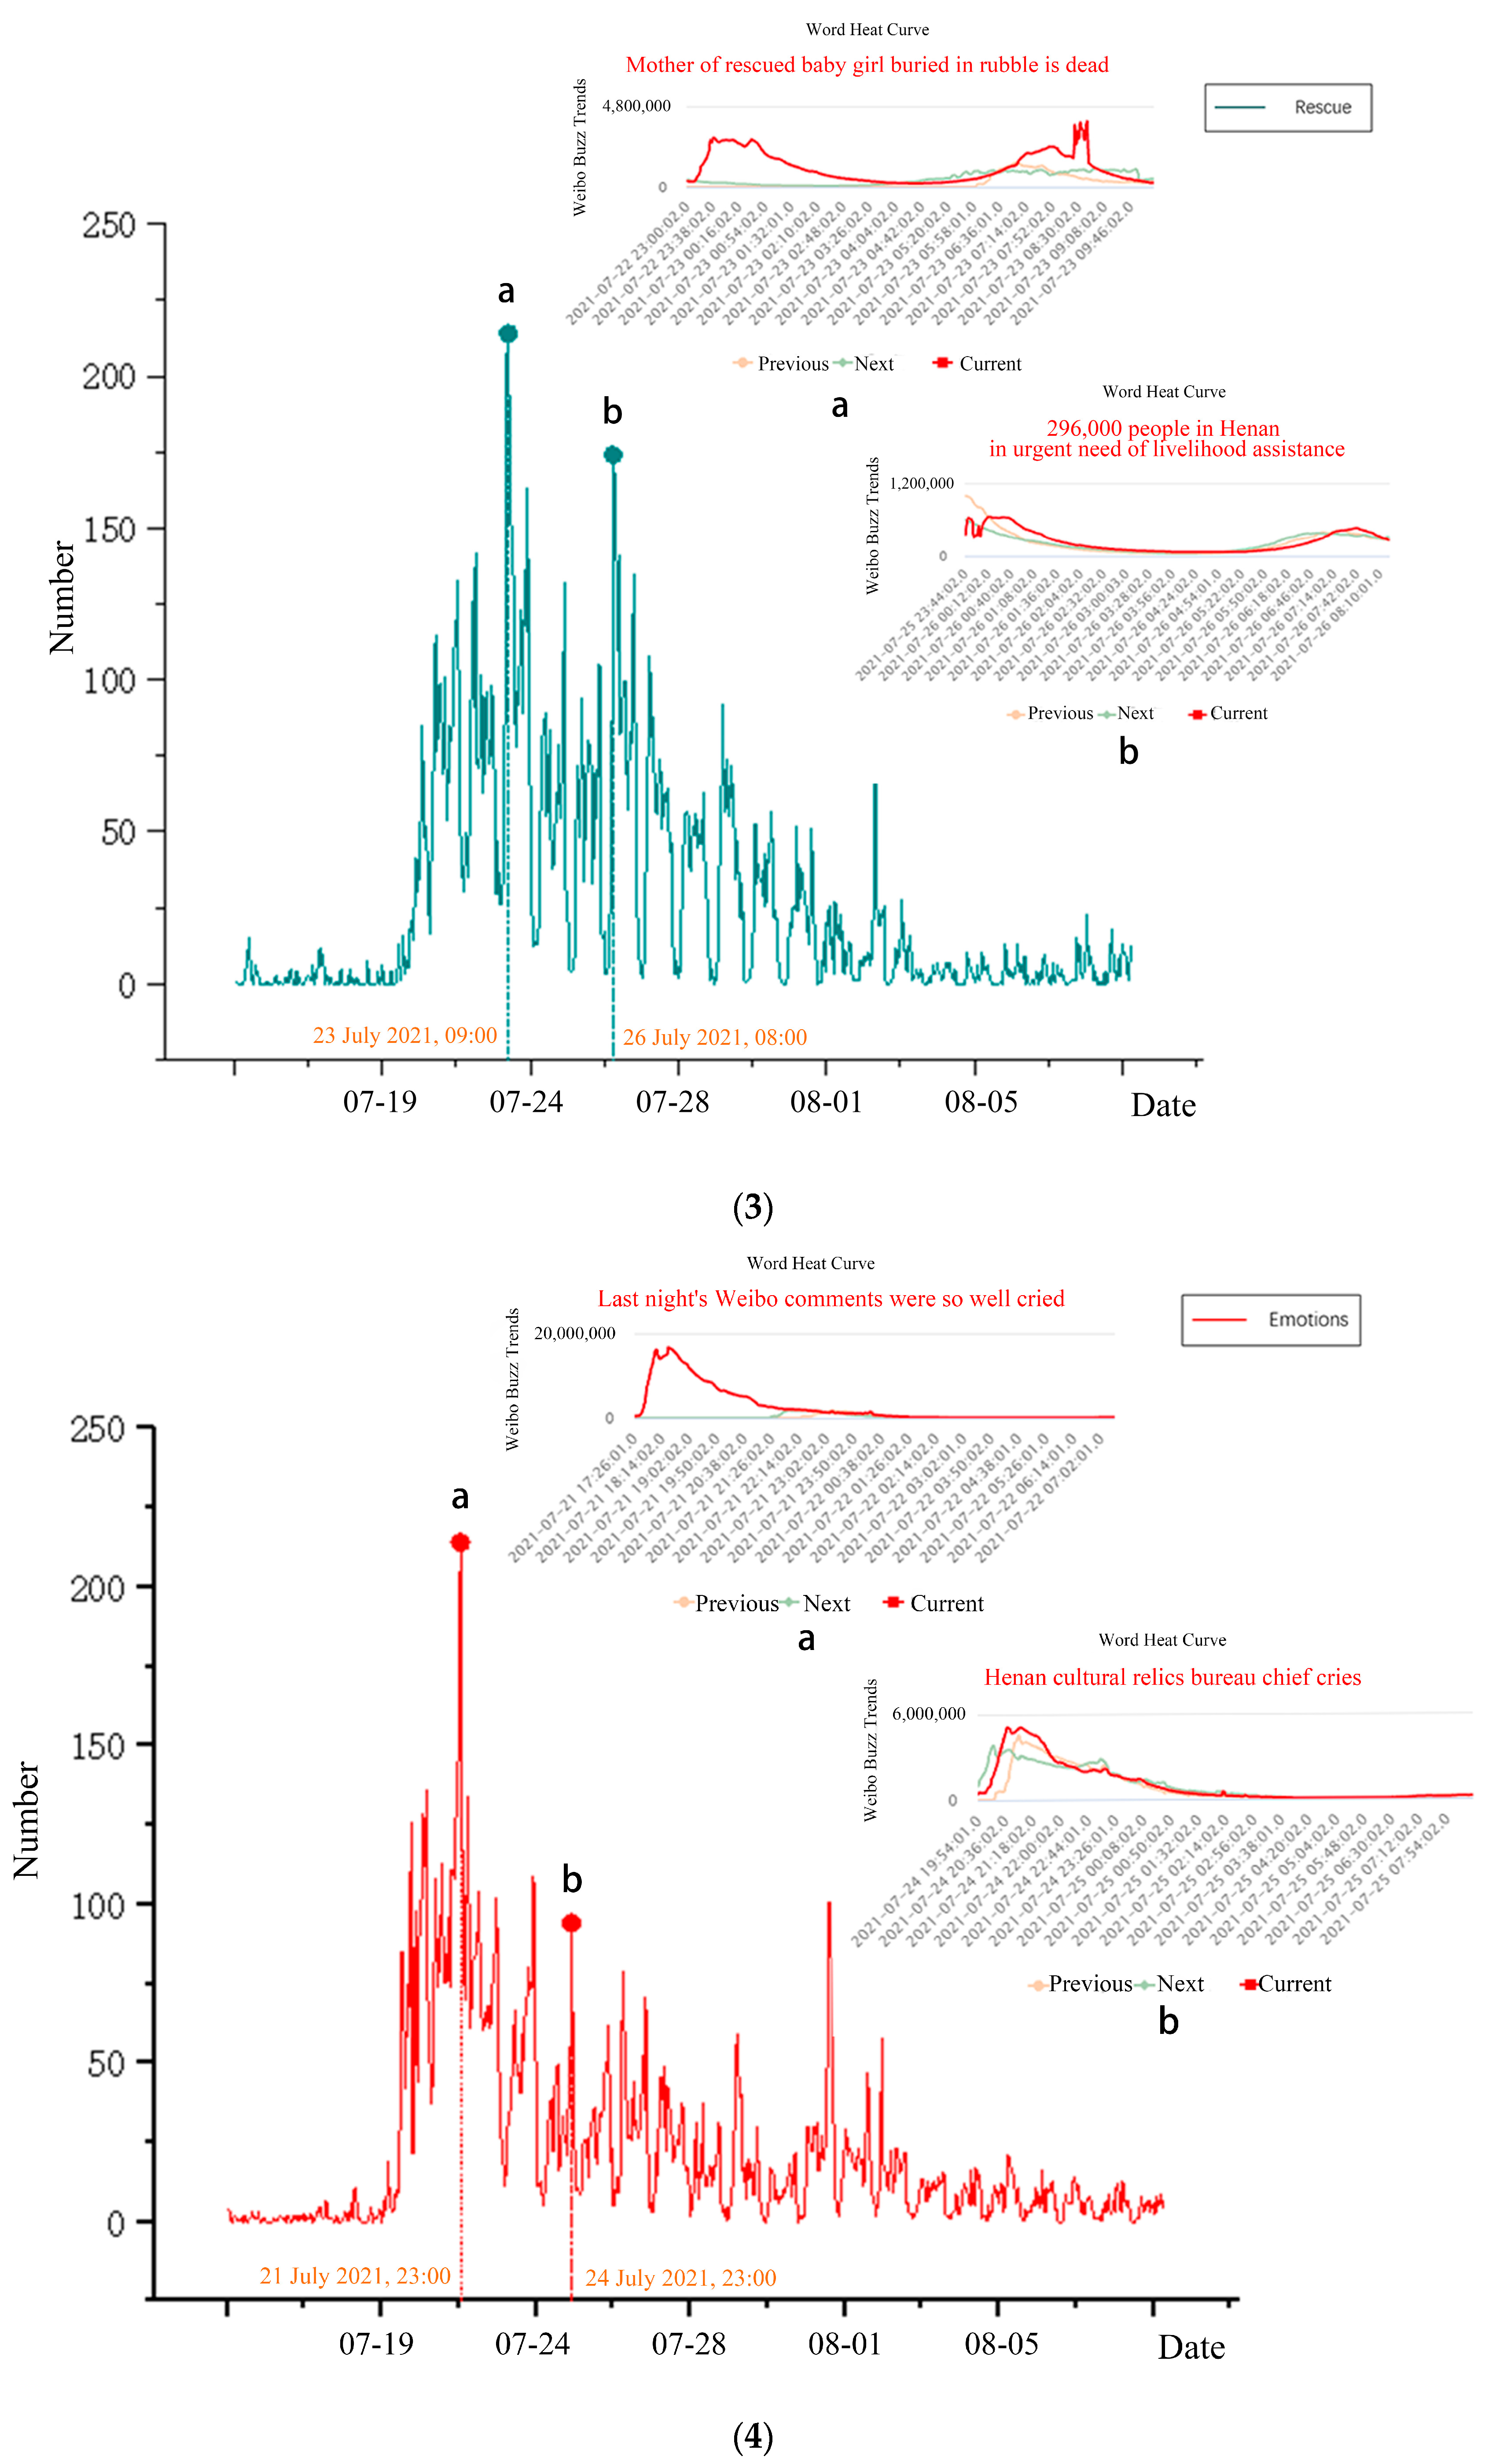
(3)
For the rescue category, “Mother of rescued baby girl buried in rubble dead” and “deputy director of Henan Xinmi Development and Reform Commission killed” topped the 23 July rescue reports. Five days after the tragedy, government departments revealed the damage statistics, and “296,000 people in Henan in urgent need of livelihood assistance” caught notice.
(4)
Regarding the emotion category, emotional microblogs have search trending terms but less fluctuation. At 23:00, users generally mentioned, “Last night’s Weibo comments were so well cried”, during the 21 July Henan rainfall event. The post, “Henan cultural relics bureau chief cries”, at 22:00 on 24 July, made many internet users grieve the natural calamity that ruined cultural treasures and other objects.
(5)
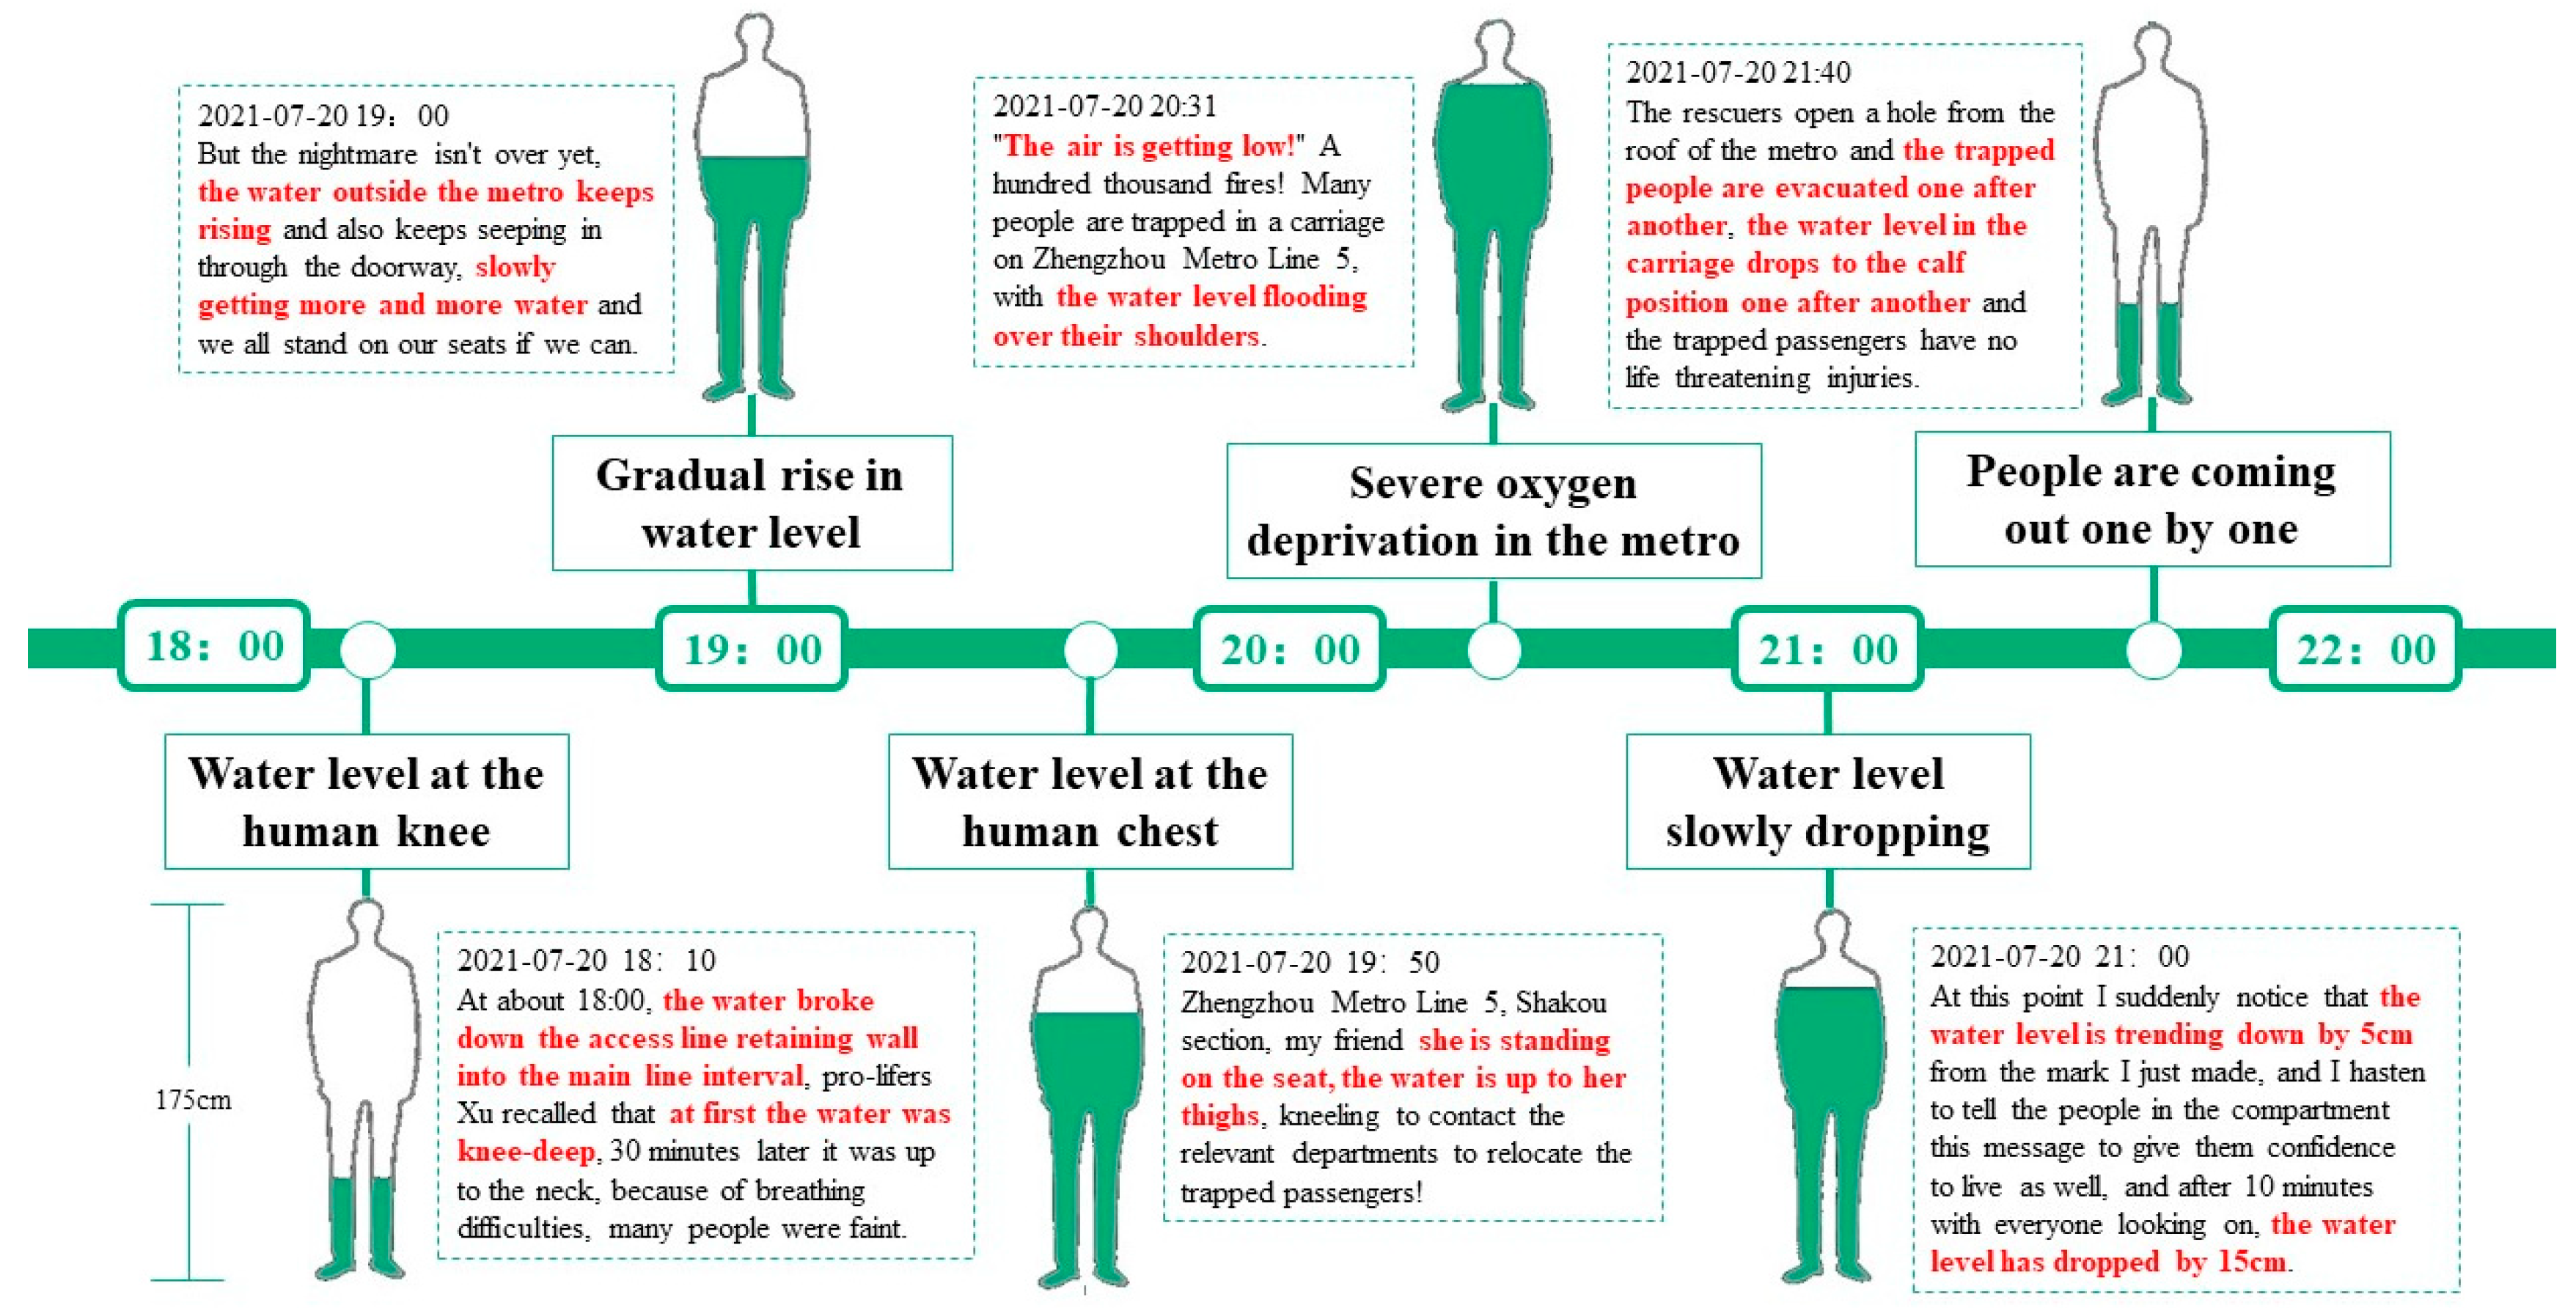
Hotspots events were mainly focused on “Metro Line 5”, while on 20 and 21 July, the words “Zhengzhou Metro” and “Zhengzhou underground stranded person chats with a friend” appeared, and on 27 July, the 12:00 curve peaked mainly because the words “Niu Niu, Daddy still wants to take you home” inspired the public to mourn the victims of the rainstorm.

5.2. Temporal Analysis

The temporal evolution of the microblog theme during the Henan intensive rainfall event is shown in Figure 7. The two black lines in the figure help us to see the order in which the themes appear. The unexpected occurrence of intensive rainfall in Henan caused the first topic of concern among the users of Sina microblogs to be the disaster. This was followed by the category of warnings and alerts issued by the counties and cities, and the rescue category reached its peak approximately two days after the situation. This is basically in line with the general pattern of “situation–tips–rescue”.

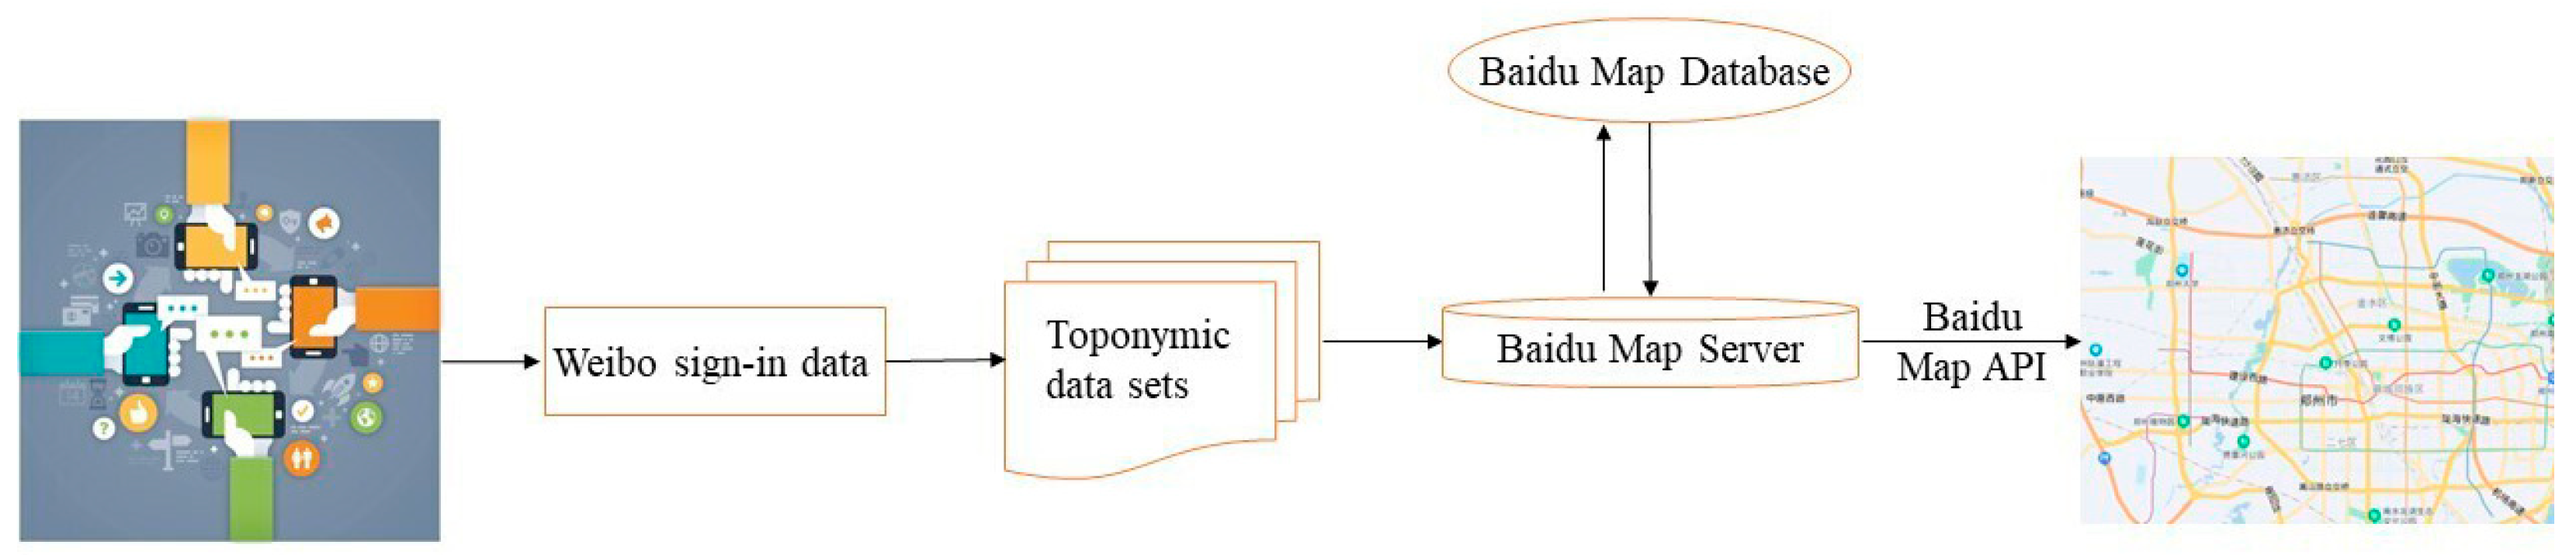
5.3. Spatial Analysis

When people post on the Sina microblog, the data can be time-stamped and geolocated, and users can share information in real-time about the storms [46] that occurred around them. As shown in Figure 8, the Sina microblog check-in data are first compiled and then converted into latitude and longitude coordinates by making a call to the Baidu Maps API. Then, ArcGIS is used to visualize and analyze the data.
The check-in data are selected as the sample for the study on the assumption that it is a random sample of all of the data; therefore, it is representative to analyze and discuss based on the check-in data as it is difficult to determine how many Weibo users are registered in each province. Based on the statistical yearbook, the number of registered Weibo users in each province or city is determined by the population aged 15 to 65. We follow Equation (5) to calculate the attention of each region to the Henan rainstorm event, where H means the amount of attention paid to the heavy rainfall event in Henan in that region, COUNT means the number of microblogs positioned in that region at the check-in location throughout a certain time period, and PERSON means the proportionate number of individuals aged 15–65 in that region. The calculation formula is as follows:
H = C O U N T P E R S O N × 100 %
By plotting the Sina microblog check-in data on a map, as depicted in Figure 9, it is evident that the residents of Henan Province were the most concerned about the event during the intensive rainfall event in Henan Province. Around Henan Province, especially in the coastal areas, there was a high level of concern about the event. Firstly, the location of the event determines the degree of concern, followed by the population density and economic development of the area. In the meantime, we learn that numerous people were affected by floods in Guizhou (http://www.xsx.gov.cn/zfbm/yjglj/zfxxgk/fdzdgknr/zhjy/202108/t20210813_69506393.html accessed on 3 January 2023) in July, and a significant fire broke out in Jilin (https://www.sohu.com/a/540732186_121106842 accessed on 4 January 2023) Province on the afternoon of 24 July. From the perspective of the afflicted population’s psychology, it is simple to empathize with the Henan rainstorm and, as a result, pay more attention to the event. Consequently, the occurrence of comparable disasters interacts to influence the level of attention that affected individuals pay to the disaster.
Figure 10 shows the nationwide check-in microblog heat on 19, 21, 24, and 27 July. Deng et al. [47] found that most cities in Henan Province are at moderate risk and that Zhengzhou is prone to severe rainfall and flooding due to its high catastrophe risk. The Sina microblog buzz changed on 19 July, the day before the rainfall, when check-in data were low. Normally, Henan rain talk is hot. The matter was heavily discussed in Henan Province on 21 July, the day of the rainfall. On 27 July, subject hotness dropped substantially across numerous provinces and cities, demonstrating that the government’s emergency response strategy for the deluge in Henan was well received, the city recovered better, and users gradually turned their attention to other events.
With the development of the event, the overall heat of the topic discussed in all regions decreased, except for Henan Province on 24 July, where it slightly decreased; the overall look of the heat first increased and then decreased, of which Henan Province heat is steadily high, and it lasted longer in coastal areas lasted longer than in inland areas. Figure 11 shows the heat change in Henan Province, with Zhengzhou having the maximum heat, followed by Xinxiang, Anyang, and Hebi. In the latter half of the period, the heat shifts north. Liu et al. [48] employed 10 high-resolution satellite precipitation products to determine the spatial distribution of heavy rainfall in central and northern Henan, confirming the analysis.

6. Conclusions

This paper offers a novel theme classification model that uses multiple classification methods for distinct microblog expressions to tackle the problem of classifying diverse microblog texts and integrating flooding microblog data by class classification. In this study, we construct a microblog dataset related to Henan Province’s intensive rainfall events and classify the texts using BERT based on a summary and analysis of the findings. We use four algorithms, TextRank, LDA, MMR, and TF-IDF, to extract the text for summary processing before building the dataset for text classification and reach the following conclusions:
  • BERT is superior for classifying microblogs related to government affairs. When there are a small or a high number of words in a We Media Microblog entry, the TF-IDF -BERT classification method is utilized, and the LDA -BERT classification method is utilized when the number of words is medium;
  • The intensive rainfall in Henan was unexpected. Disaster information attracted more attention than warning information, but warning information garnered greater attention quickly after the warning-relief statute was passed;
  • The microblog hot topics list all have corresponding category topics and are at the top, and as the hot topics change, the number of microblogs for each category decreases until the next hot topic appears.
  • Residents of areas around Henan Province and areas that are also suffering from other natural disasters are more concerned about the intense rainfall in Henan Late heat shifted northward in Henan Province, with Zhengzhou, Xinxiang, Anyang, and Hebi having the highest topic heat;
  • Issues during the experiments may have reduced precision: the text data are insufficient, with too many categories and a small number. Humans manually annotate categories and add subjectivity. We can improve the dataset in future experiments to improve precision. In addition, the semantics of the microblog check-in data are unclear; therefore, multiple sources of data can be used to improve it.
  • Due to human and material limitations, we are unable to designate a substantial number of samples for BERT training. In addition, the irregular use of punctuation by individual users when expressing themselves can pose a challenge in terms of accurately identifying complete sentences when performing the main sentence extraction task. Even though we optimize the data during data pre-processing, this still diminishes the precision of the results to some degree. In addition to these, the studies are based on the Chinese corpus, and no comparative experiments in the English corpus have been undertaken. After that, we can add the English dataset and repeat the experiment to see if the approach is generalizable.

Author Contributions

Writing, review and editing, Wenying Du, Chang Ge, Shuang Yao, and Nengcheng Chen, Lei Xu; methodology, Chang Ge; software, Chang Ge; conceptualization, Wenying Du; supervision, Wenying Du; writing, original draft, Chang Ge; data acquisition, Nengcheng Chen, Lei Xu. All authors have read and agreed to the published version of the manuscript.

Funding

This work was supported by grants from the National Key Research and Development Program of China (No. 2021YFF0704400), the National Nature Science Foundation of China Program (Nos. 41971351, 42201438), the Special Fund of Hubei Luojia Laboratory (No. 220100034), China Postdoctoral Science Foundation (No. 2022M722930), and the Open Fund of the National Engineering Research Center for Geographic Information System (No. 2021KFJJ06).

Data Availability Statement

All source codes and data related to this article can be found at https://github.com/gechang-hub/KS-bert (accessed on 25 December 2022).

Acknowledgments

We acknowledge the advice provided by the anonymous reviewers.

Conflicts of Interest

The authors declare no conflict of interest.

Appendix A

Figure A1. Comparison of predicted peaks by category with Weibo hot searches. (1) Disaster, (2) tips (3), relief, and (4) emotions.
Ijgi 12 00240 g0a1aIjgi 12 00240 g0a1b

References

  1. Tan, L.; Schultz, D.M. Damage Classification and Recovery Analysis of the Chongqing, China, Floods of August 2020 Based on Social-Media Data. J. Clean. Prod. 2021, 313, 127882. [Google Scholar] [CrossRef]
  2. Liu, Q.; Gao, Y.; Chen, Y. Study on Disaster Information Management System Compatible with VGI and Crowdsourcing. In Proceedings of the IEEE Workshop on Advanced Research and Technology in Industry Applications (WARTIA), Ottawa, ON, Canada, 29–30 September 2014; pp. 464–468. [Google Scholar] [CrossRef]
  3. Sit, M.A.; Koylu, C.; Demir, I. Identifying Disaster-Related Tweets and Their Semantic, Spatial and Temporal Context Using Deep Learning, Natural Language Processing and Spatial Analysis: A Case Study of Hurricane Irma. Int. J. Digit. Earth 2019, 12, 1205–1229. [Google Scholar] [CrossRef]
  4. Zhang, Y.; Chen, Z.; Zheng, X.; Chen, N.; Wang, Y. Extracting the Location of Flooding Events in Urban Systems and Analyzing the Semantic Risk Using Social Sensing Data. J. Hydrol. 2021, 603, 127053. [Google Scholar] [CrossRef]
  5. Xiao, Y.; Li, B.; Gong, Z. Real-Time Identification of Urban Rainstorm Waterlogging Disasters Based on Weibo Big Data. Nat. Hazards 2018, 94, 833–842. [Google Scholar] [CrossRef]
  6. Wang, R.Q.; Mao, H.; Wang, Y.; Rae, C.; Shaw, W. Hyper-Resolution Monitoring of Urban Flooding with Social Media and Crowdsourcing Data. Comput. Geosci. 2018, 111, 139–147. [Google Scholar] [CrossRef] [Green Version]
  7. Restrepo-Estrada, C.; de Andrade, S.C.; Abe, N.; Fava, M.C.; Mendiondo, E.M.; de Albuquerque, J.P. Geo-Social Media as a Proxy for Hydrometeorological Data for Streamflow Estimation and to Improve Flood Monitoring. Comput. Geosci. 2018, 111, 148–158. [Google Scholar] [CrossRef]
  8. Wang, Z.; Ye, X. Social Media Analytics for Natural Disaster Management. Int. J. Geogr. Inf. Sci. 2018, 32, 49–72. [Google Scholar] [CrossRef]
  9. Arapostathis, S.G. A Methodology for Automatic Acquisition of Flood-event Management Information From Social Media: The Flood in Messinia, South Greece, 2016. Inf. Syst. Front. 2021, 23, 1127–1144. [Google Scholar] [CrossRef]
  10. Karmegam, D.; Mappillairaju, B. Spatiooral Distribution of Negative Emotions on Twitter during Floods in Chennai, India, in 2015: A Post Hoc Analysis. Int. J. Health Geogr. 2020, 19, 19. [Google Scholar] [CrossRef]
  11. Zahra, K.; Imran, M.; Ostermann, F.O. Automatic Identification of Eyewitness Messages on Twitter during Disasters. Inf. Process. Manag. 2020, 57, 102107. [Google Scholar] [CrossRef]
  12. Szczepanek, R. A Deep Learning Model of Spatial Distance and Named Entity Recognition (SD-NER) for Flood Mark Text Classification. Water 2023, 15, 1197. [Google Scholar] [CrossRef]
  13. Lin, Y.T.; Yang, M.D.; Han, J.Y.; Su, Y.F.; Jang, J.H. Quantifying Flood Water Levels Using Image-Based Volunteered Geographic Information. Remote Sens. 2020, 12, 706. [Google Scholar] [CrossRef] [Green Version]
  14. Dou, M.; Wang, Y.; Gu, Y.; Dong, S.; Qiao, M.; Deng, Y. Disaster Damage Assessment Based on Fine-Grained Topics in Social Media. Comput. Geosci. 2021, 156, 104893. [Google Scholar] [CrossRef]
  15. Zhang, W.; Xu, C. Microblog Text Classification System Based on TextCNN and LSA Model. In Proceedings of the 5th International Conference on Information Science, Computer Technology and Transportation (ISCTT), Shenyang, China, 13–15 November 2020; pp. 469–474. [Google Scholar] [CrossRef]
  16. Wahid, J.A.; Shi, L.; Gao, Y.; Yang, B.; Wei, L.; Tao, Y.; Hussain, S.; Ayoub, M.; Yagoub, I. Topic2Labels: A Framework to Annotate and Classify the Social Media Data through LDA Topics and Deep Learning Models for Crisis Response. Expert Syst. Appl. 2022, 195, 116562. [Google Scholar] [CrossRef]
  17. Han, X.; Wang, J.; Zhang, M.; Wang, X. Using Social Media to Mine and Analyze Public Opinion Related to COVID-19 in China. Int. J. Environ. Res. Public Health 2020, 17, 2788. [Google Scholar] [CrossRef] [Green Version]
  18. Wang, P.; Shi, H.; Wu, X.; Jiao, L. Sentiment Analysis of Rumor Spread amid Covid-19: Based on Weibo Text. Healthcare 2021, 9, 1275. [Google Scholar] [CrossRef]
  19. Yu, M.; Huang, Q.; Qin, H.; Scheele, C.; Yang, C. Deep Learning for Real-Time Social Media Text Classification for Situation Awareness—Using Hurricanes Sandy, Harvey, and Irma as Case Studies. Int. J. Digit. Earth 2019, 12, 1230–1247. [Google Scholar] [CrossRef]
  20. Wang, Y.; Wang, T.; Ye, X.; Zhu, J.; Lee, J. Using Social Media for Emergency Response and Urban Sustainability: A Case Study of the 2012 Beijing Rainstorm. Sustainability 2016, 8, 25. [Google Scholar] [CrossRef]
  21. Devlin, J.; Chang, M.W.; Lee, K.; Toutanova, K. BERT: Pre-Training of Deep Bidirectional Transformers for Language Understanding. In Proceedings of the Conference of the North American Chapter of the Association for Computational Linguistics: Human Language Technologies, Minneapolis, MN, USA, 24 May 2019; Volume 1, pp. 4171–4186. [Google Scholar] [CrossRef]
  22. Hey, T.; Keim, J.; Koziolek, A.; Tichy, W.F. NoRBERT: Transfer Learning for Requirements Classification. In Proceedings of the IEEE 28th International Requirements Engineering Conference (RE), Zurich, Switzerland, 31 August–4 September 2020; pp. 169–179. [Google Scholar] [CrossRef]
  23. Gao, Y.; Wang, S.; Padmanabhan, A.; Yin, J.; Cao, G. Mapping Spatiotemporal Patterns of Events Using Social Media: A Case Study of Influenza Trends. Int. J. Geogr. Inf. Sci. 2018, 32, 425–449. [Google Scholar] [CrossRef]
  24. Han, X.; Wang, J. Using Social Media to Mine and Analyze Public Sentiment during a Disaster: A Case Study of the 2018 Shouguang City Flood in China. ISPRS Int. J. Geo-Inf. 2019, 8, 185. [Google Scholar] [CrossRef] [Green Version]
  25. Cheng, X.; Han, G.; Zhao, Y.; Li, L. Evaluating Social Media Response to Urban Flood Disaster: Case Study on an East Asian City (Wuhan, China). Sustainability 2019, 11, 330. [Google Scholar] [CrossRef] [Green Version]
  26. Kaliyar, R.K.; Goswami, A.; Narang, P. FakeBERT: Fake News Detection in Social Media with a BERT-Based Deep Learning Approach. Multimed. Tools Appl. 2021, 80, 11765–11788. [Google Scholar] [CrossRef] [PubMed]
  27. Chen, X.; Cong, P.; Lv, S. A Long-Text Classification Method of Chinese News Based on BERT and CNN. IEEE Access 2022, 10, 34046–34057. [Google Scholar] [CrossRef]
  28. Onan, A.; Korukoǧlu, S.; Bulut, H. Ensemble of Keyword Extraction Methods and Classifiers in Text Classification. Expert Syst. Appl. 2016, 57, 232–247. [Google Scholar] [CrossRef]
  29. Huang, X.; Wu, Q. Micro-Blog Commercial Word Extraction Based on Improved TF-IDF Algorithm. In Proceedings of the IEEE International Conference of IEEE Region 10 (TENCON 2013), Xi’an, China, 22–25 October 2013. [Google Scholar] [CrossRef]
  30. Yang, L.; Ji, D.; Leong, M. Document Reranking by Term Distribution and Maximal Marginal Relevance for Chinese Information Retrieval. Inf. Process. Manag. 2007, 43, 315–326. [Google Scholar] [CrossRef]
  31. Wu, W.; Li, J.; He, Z.; Ye, X.; Zhang, J.; Cao, X.; Qu, H. Tracking Spatio-Temporal Variation of Geo-Tagged Topics with Social Media in China: A Case Study of 2016 Hefei Rainstorm. Int. J. Disaster Risk Reduct. 2020, 50, 101737. [Google Scholar] [CrossRef]
  32. Kumar, S. Analyzing the Facebook Workload. In Proceedings of the IEEE International Symposium on Workload Characterization (IISWC), La Jolla, CA, USA, 4–6 November 2012; pp. 111–112. [Google Scholar] [CrossRef]
  33. Li, W.; Zhao, J. TextRank Algorithm by Exploiting Wikipedia for Short Text Keywords Extraction. In Proceedings of the 3rd International Conference on Information Science and Control Engineering (ICISCE), Beijing, China, 8–10 July 2016; pp. 683–686. [Google Scholar] [CrossRef]
  34. Shanchen, P.; Jiamin, Y.; Ting, L.; Hua, Z.; Hongqi, C. A Text Similarity Measurement Based on Semantic Fingerprint of Characteristic Phrases. Chin. J. Electron. 2020, 29, 233–241. [Google Scholar] [CrossRef]
  35. Wang, Y.; Zhang, D.; Yuan, Y.; Liu, Q.; Yang, Y. Improvement of TF-IDF Algorithm Based on Knowledge Graph. In Proceedings of the IEEE 16th International Conference on Software Engineering Research, Management and Applications (SERA), Kunming, China, 13–15 June 2018; pp. 19–24. [Google Scholar] [CrossRef]
  36. Zhang, T.; Ge, S.S. An Improved Tf-IdF Algorithm Based on Class Discriminative Strength for Text Categorization on Desensitized Data. In Proceedings of the 3rd International Conference on Innovation in Artificial Intelligence, Suzhou, China, 15–18 March 2019; Part F1481. pp. 39–44. [Google Scholar] [CrossRef]
  37. Flores, M.L.; Santos, E.R.; Silveira, R.A. Ontology-Based Extractive Text Summarization: The Contribution of Instances. Comput. Y Sist. 2019, 23, 905–914. [Google Scholar] [CrossRef]
  38. Ullah, S.; Al Islam, A.B.M.A. A Framework for Extractive Text Summarization Using Semantic Graph Based Approach. In Proceedings of the 6th International Conference on Networking, Systems and Security, Dhaka, Bangladesh, 17–19 December 2019; pp. 48–58. [Google Scholar] [CrossRef]
  39. Kim, D.; Seo, D.; Cho, S.; Kang, P. Multi-Co-Training for Document Classification Using Various Document Representations: TF–IDF, LDA, and Doc2Vec. Inf. Sci. 2019, 477, 15–29. [Google Scholar] [CrossRef]
  40. Lu, Q.; Zhu, Z.; Xu, F.; Zhang, D.; Wu, W.; Guo, Q. Bi-Gru Sentiment Classification for Chinese Based on Grammar Rules and Bert. Int. J. Comput. Intell. Syst. 2020, 13, 538–548. [Google Scholar] [CrossRef]
  41. Vaswani, A.; Shazeer, N.; Parmar, N.; Uszkoreit, J.; Jones, L.; Gomez, A.N.; Kaiser, Ł.; Polosukhin, I. Attention Is All You Need. Adv. Neural Inf. Process. Syst. 2017, 2017, 5999–6009. [Google Scholar] [CrossRef]
  42. Chen, N.; Zhang, Y.; Du, W.; Li, Y.; Chen, M.; Zheng, X. KE-CNN: A New Social Sensing Method for Extracting Geographical Attributes from Text Semantic Features and Its Application in Wuhan, China. Comput. Environ. Urban Syst. 2021, 88, 101629. [Google Scholar] [CrossRef]
  43. Zhang, Y.; Gong, L.; Wang, Y. Extracting Key Sentences from Chinese Text. In Proceedings of the 11th Joint International Computer Conference, Chongqing, China, 10–12 November 2005; pp. 364–367. [Google Scholar] [CrossRef]
  44. Yang, H.; Zhao, L.; Chen, J. Metro System Inundation in Zhengzhou, Henan Province, China. Sustainability 2022, 14, 9292. [Google Scholar] [CrossRef]
  45. Scheele, C.; Yu, M.; Huang, Q. Geographic Context-Aware Text Mining: Enhance Social Media Message Classification for Situational Awareness by Integrating Spatial and Temporal Features. Int. J. Digit. Earth 2021, 14, 1721–1743. [Google Scholar] [CrossRef]
  46. Chae, J.; Thom, D.; Jang, Y.; Kim, S.; Ertl, T.; Ebert, D.S. Public Behavior Response Analysis in Disaster Events Utilizing Visual Analytics of Microblog Data. Comput. Graph. 2014, 38, 51–60. [Google Scholar] [CrossRef]
  47. Deng, G.Q.; Chen, H.; Wang, S.Q. Risk Assessment and Prediction of Rainstorm and Flood Disaster Based on Henan Province, China. Math. Probl. Eng. 2022, 2022, 5310920. [Google Scholar] [CrossRef]
  48. Liu, S.N.; Wang, J.; Wang, H.J. Assessing 10 Satellite Precipitation Products in Capturing the July 2021 Extreme Heavy Rain in Henan, China. J. Meteorol. Res. 2022, 36, 798–808. [Google Scholar] [CrossRef]
Figure 1. Pipeline of applicability analysis.
Ijgi 12 00240 g001
Figure 2. Data cleaning flowchart.
Ijgi 12 00240 g002
Figure 3. Prediction and true value confusion matrices for the five training approaches (a) BERT display, (b) TF-IDF-BERT display, (c) TextRank-BERT display, (d) MMR-BERT display, and (e) LDA-BERT display.
Ijgi 12 00240 g003
Figure 4. Information contained in texts related to hotspots.
Ijgi 12 00240 g004
Figure 5. Variation in the number of different micro-blog text lengths.
Ijgi 12 00240 g005
Figure 6. Comparison of predicted peaks of hotspots with Weibo hot searches.
Ijgi 12 00240 g006
Figure 7. Diagram of the evolution of the theme over time.
Ijgi 12 00240 g007
Figure 8. Flow chart of check-in data processing.
Ijgi 12 00240 g008
Figure 9. Diagram of check-in data during the heavy rainfall event in Henan.
Ijgi 12 00240 g009
Figure 10. Spatial and temporal variation of national blogging locations for the Henan intensive rainfall event. (a) Blogging location on 19 July 2021, (b) blogging location on 21 July 2021, (c) blogging location on 24 July 2021, (d) blogging location on 27 July 2021.
Ijgi 12 00240 g010
Figure 11. Spatial and temporal variation of blogging locations in Henan Province for the Henan intensive rainfall event. (a) Blogging location on 19 July 2021, (b) blogging location on 21 July 2021, (c) blogging location on 24 July 2021, (d) blogging location on 27 July 2021.
Ijgi 12 00240 g011
Table 1. Accuracy statistics of BERT under different scenarios.
Type OverallGovernment Affairs MicroblogWe Media Microblog
Datasets
Hubei intensive rainfall datasets71.4%87.2%67.4%
Henan intensive rainfall datasets59.7%75.0%58.0%
Table 2. Accuracy comparison of BERT, TF-IDF-BERT, TextRank-BERT, MMR-BERT, and LDA-BERT on the Henan intensive rainfall test set.
Evaluation FactorsAccTimeF1PR
Method
BERT57.3%4 h 34 min56.0%58.0%53.8%
TF-IDF-BERT63.3%3 h 30 min63.2%66.7%63.3%
TextRank-BERT58.8%3 h 31 min59.1%62.3%58.8%
MMR-BERT62.0%3 h 32 min60.9%61.7%62.1%
LDA-BERT60.0%3 h 31 min60.0%61.4%60.0%
Table 3. Accuracy comparison of BERT, TF-IDF-BERT, TextRank-BERT, MMR-BERT, and LDA-BERT on the Hubei intensive rainfall test set.
Evaluation FactorsAccTimeF1PR
Method
BERT63.9%4 h 11 min63.9%53.5%51.9%
TF-IDF-BERT65.3%3 h 46 min65.1%57.5%54.1%
TextRank-BERT61.5%3 h 41 min61.5%50.1%49.8%
MMR-BERT64.1%3 h 51 min64.0%57.9%55.4%
LDA-BERT64.7%3 h 49 min64.7%57.2%53.5%
Table 4. Number of test sets by category before and after merging.
Original CategoryNumberPresent CategoryNumber
warning160tips280
guide120
situation235situation640
disaster421
help423rescue978
rescue570
prayer711emotions2031
irrelevant1360
hotspots71
Table 5. Comparison of the accuracy of the results of different methods for the test set after reclassification.
Evaluation FactorsAccF1PR
Method
BERT67.5%67.4%67.6%67.5%
TF-IDF-BERT69.2%68.7%68.5%69.2%
TextRank-BERT66.3%65.9%65.9%66.3%
MMR-BERT63.8%63.9%64.1%63.8%
LDA-BERT67.1%67.2%67.7%67.1%
Table 6. Results of the method suitability analysis by type of user in Henan intensive rainfall dataset.
Type Government Affairs MicroblogWe Media Microblog
Method
BERT79.0%62.0%
TF-IDF-BERT74.0%64.0%
TextRank-BERT72.0%55.5%
MMR-BERT69.0%51.5%
LDA-BERT78.0%64.5%
Table 7. Results of the method suitability analysis by type of user in the Hubei intensive rainfall dataset.
Type Government Affairs MicroblogWe Media Microblog
Method
BERT87.2%67.4%
TF-IDF-BERT80.4%67.5%
TextRank-BERT74.3%60.6%
MMR-BERT81.5%66.9%
LDA-BERT79.9%67.5%
Table 8. Applicability analysis on text length of intensive rainfall dataset in Henan, China.
DataSetWord Count ∈ [1, 70]Word Count ∈ (70, 140)Word Count ∈ (140, +∞)
Acc
Method
BERT65.7%58.6%61.7%
TF-IDF-BERT68.6%57.1%68.3%
TextRank-BERT58.6%48.6%60.0%
MMR-BERT52.9%57.1%53.3%
LDA-BERT61.4%68.6%63.3%
Table 9. Applicability analysis on text length of intensive rainfall dataset in Hubei, China.
DataSetWord Count ∈ [1, 70]Word Count ∈ (70, 140)Word Count ∈ (140, +∞)
Acc
Method
BERT63.2%68.7%75.0%
TF-IDF-BERT64.3%65.8%76.6%
TextRank-BERT55.3%62.7%69.6%
MMR-BERT63.3%67.4%74.4%
LDA-BERT63.3%70.5%73.1%
Disclaimer/Publisher’s Note: The statements, opinions and data contained in all publications are solely those of the individual author(s) and contributor(s) and not of MDPI and/or the editor(s). MDPI and/or the editor(s) disclaim responsibility for any injury to people or property resulting from any ideas, methods, instructions or products referred to in the content.

