

Synergy of Road Network Planning Indices on Central Retail District Pedestrian Evacuation Efficiency
Abstract
:1. Introduction
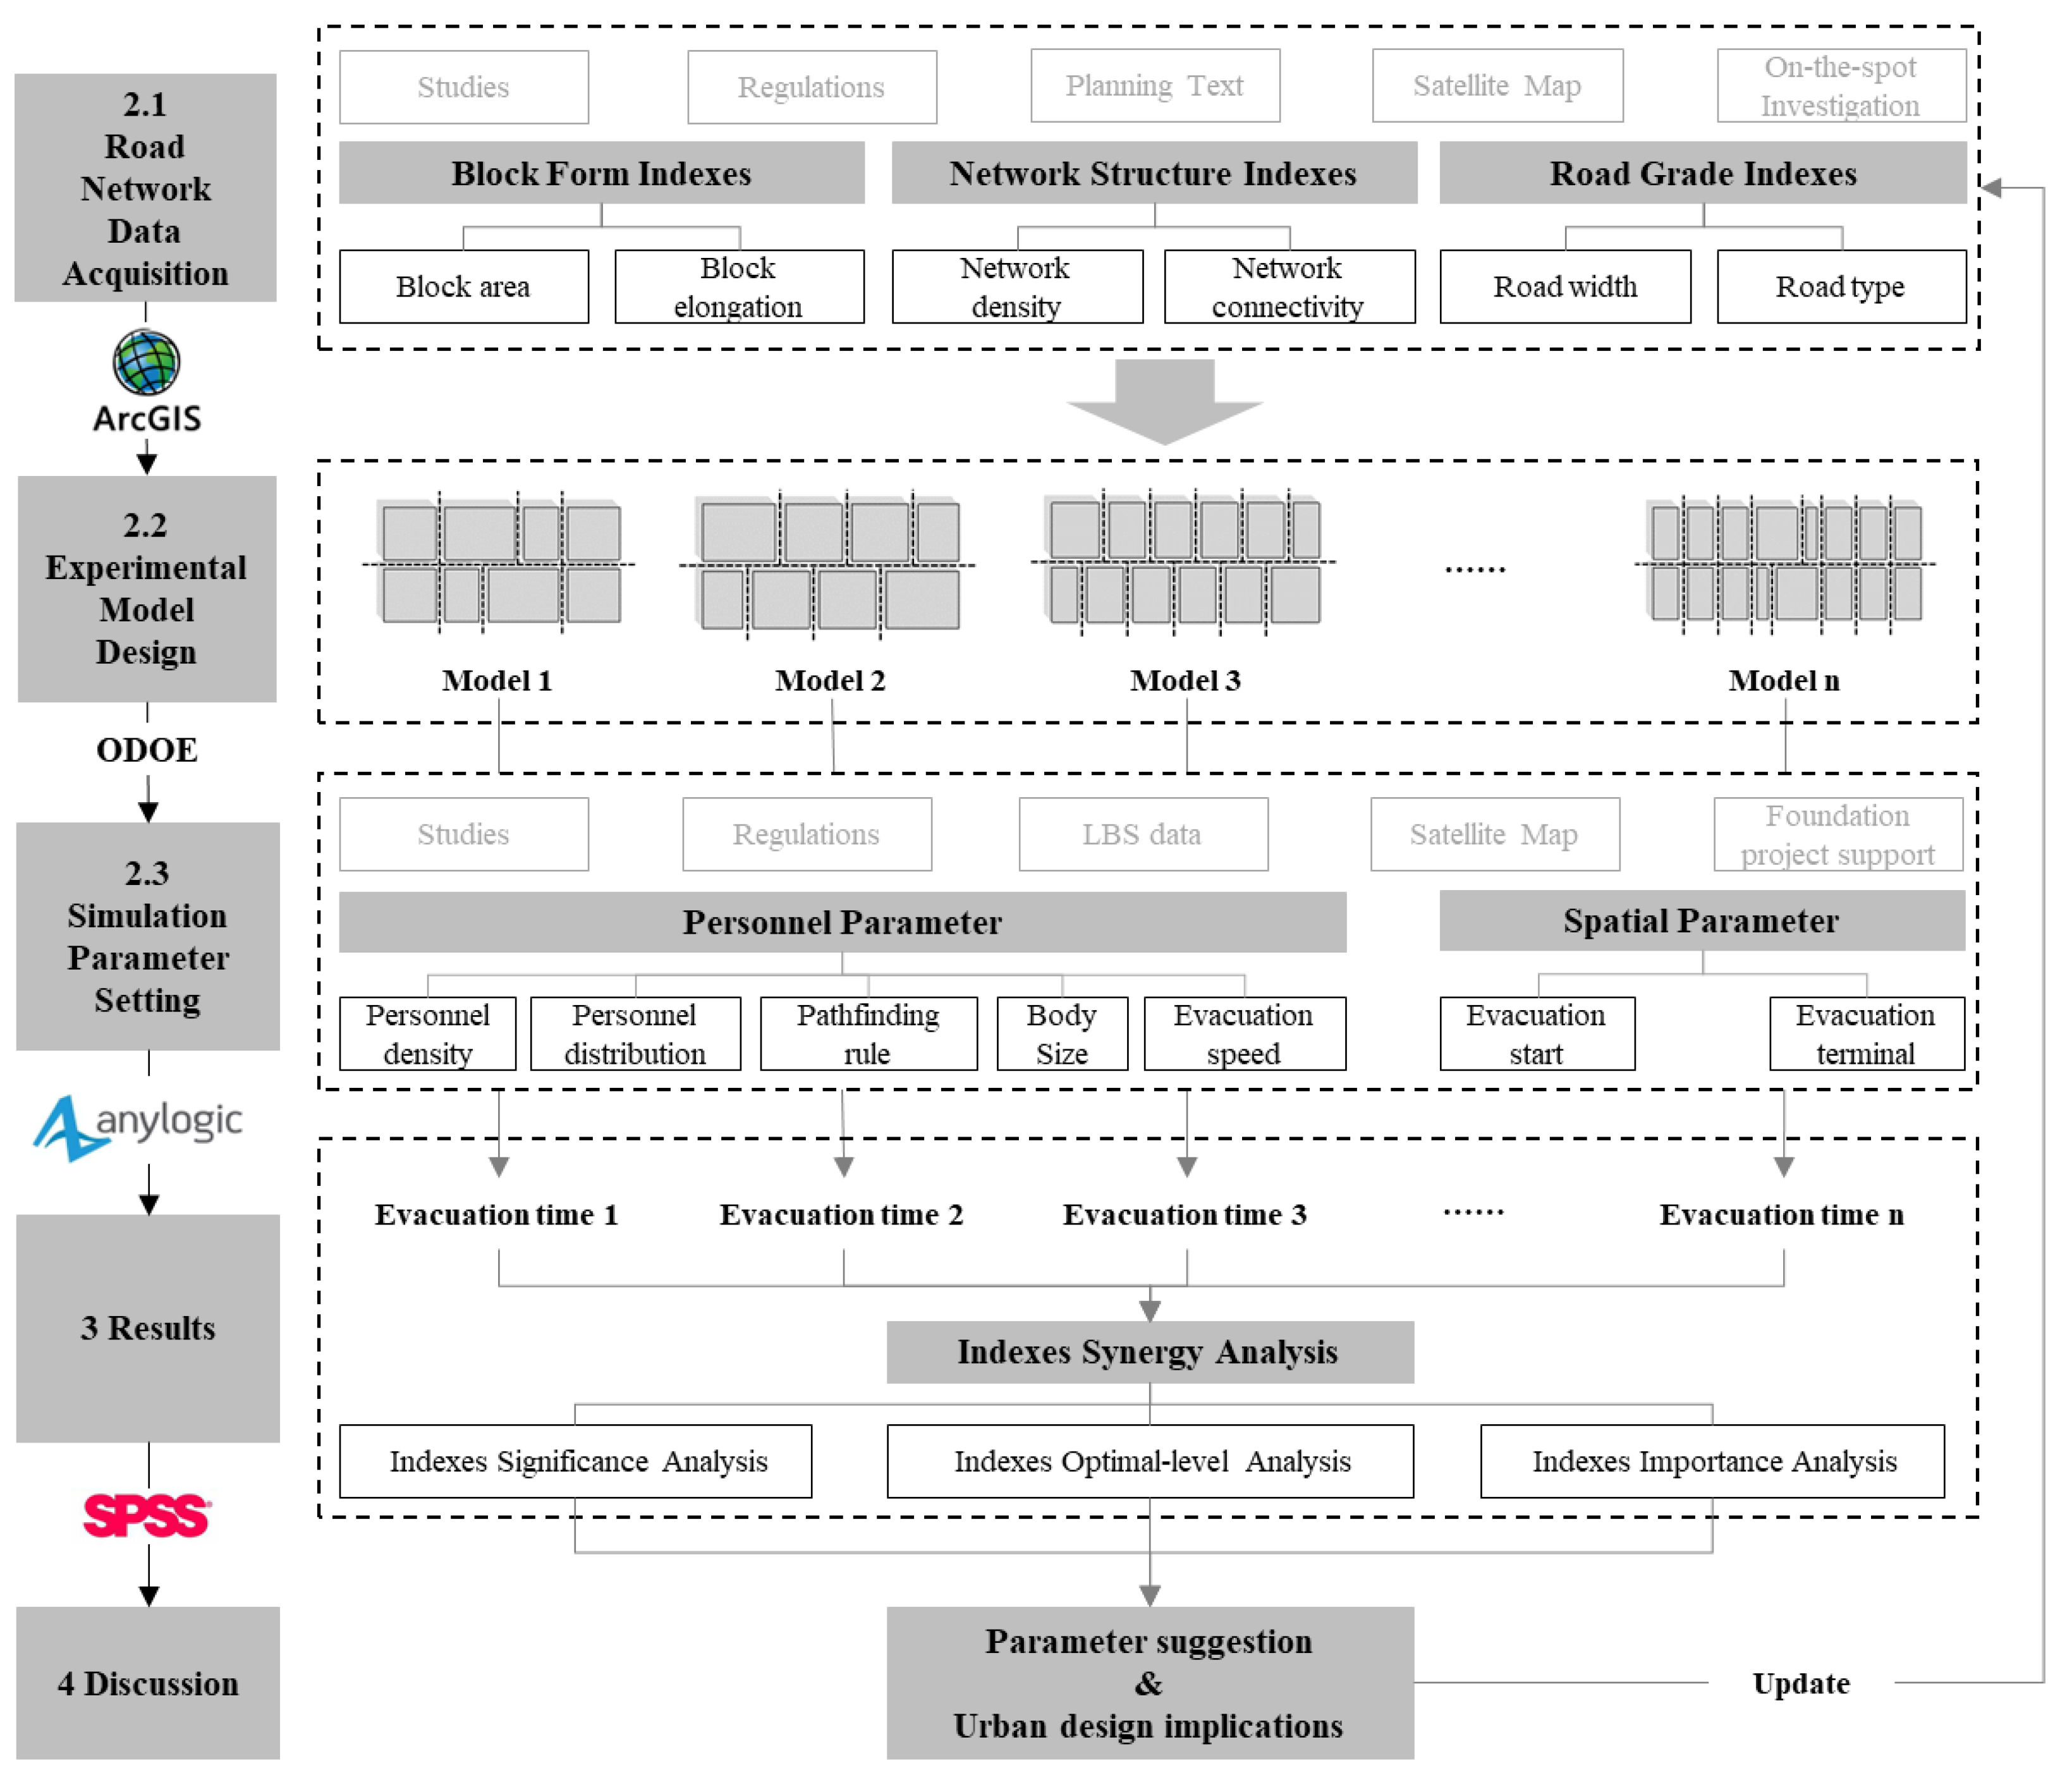
2. Methods
2.1. Road Network Data Acquisition
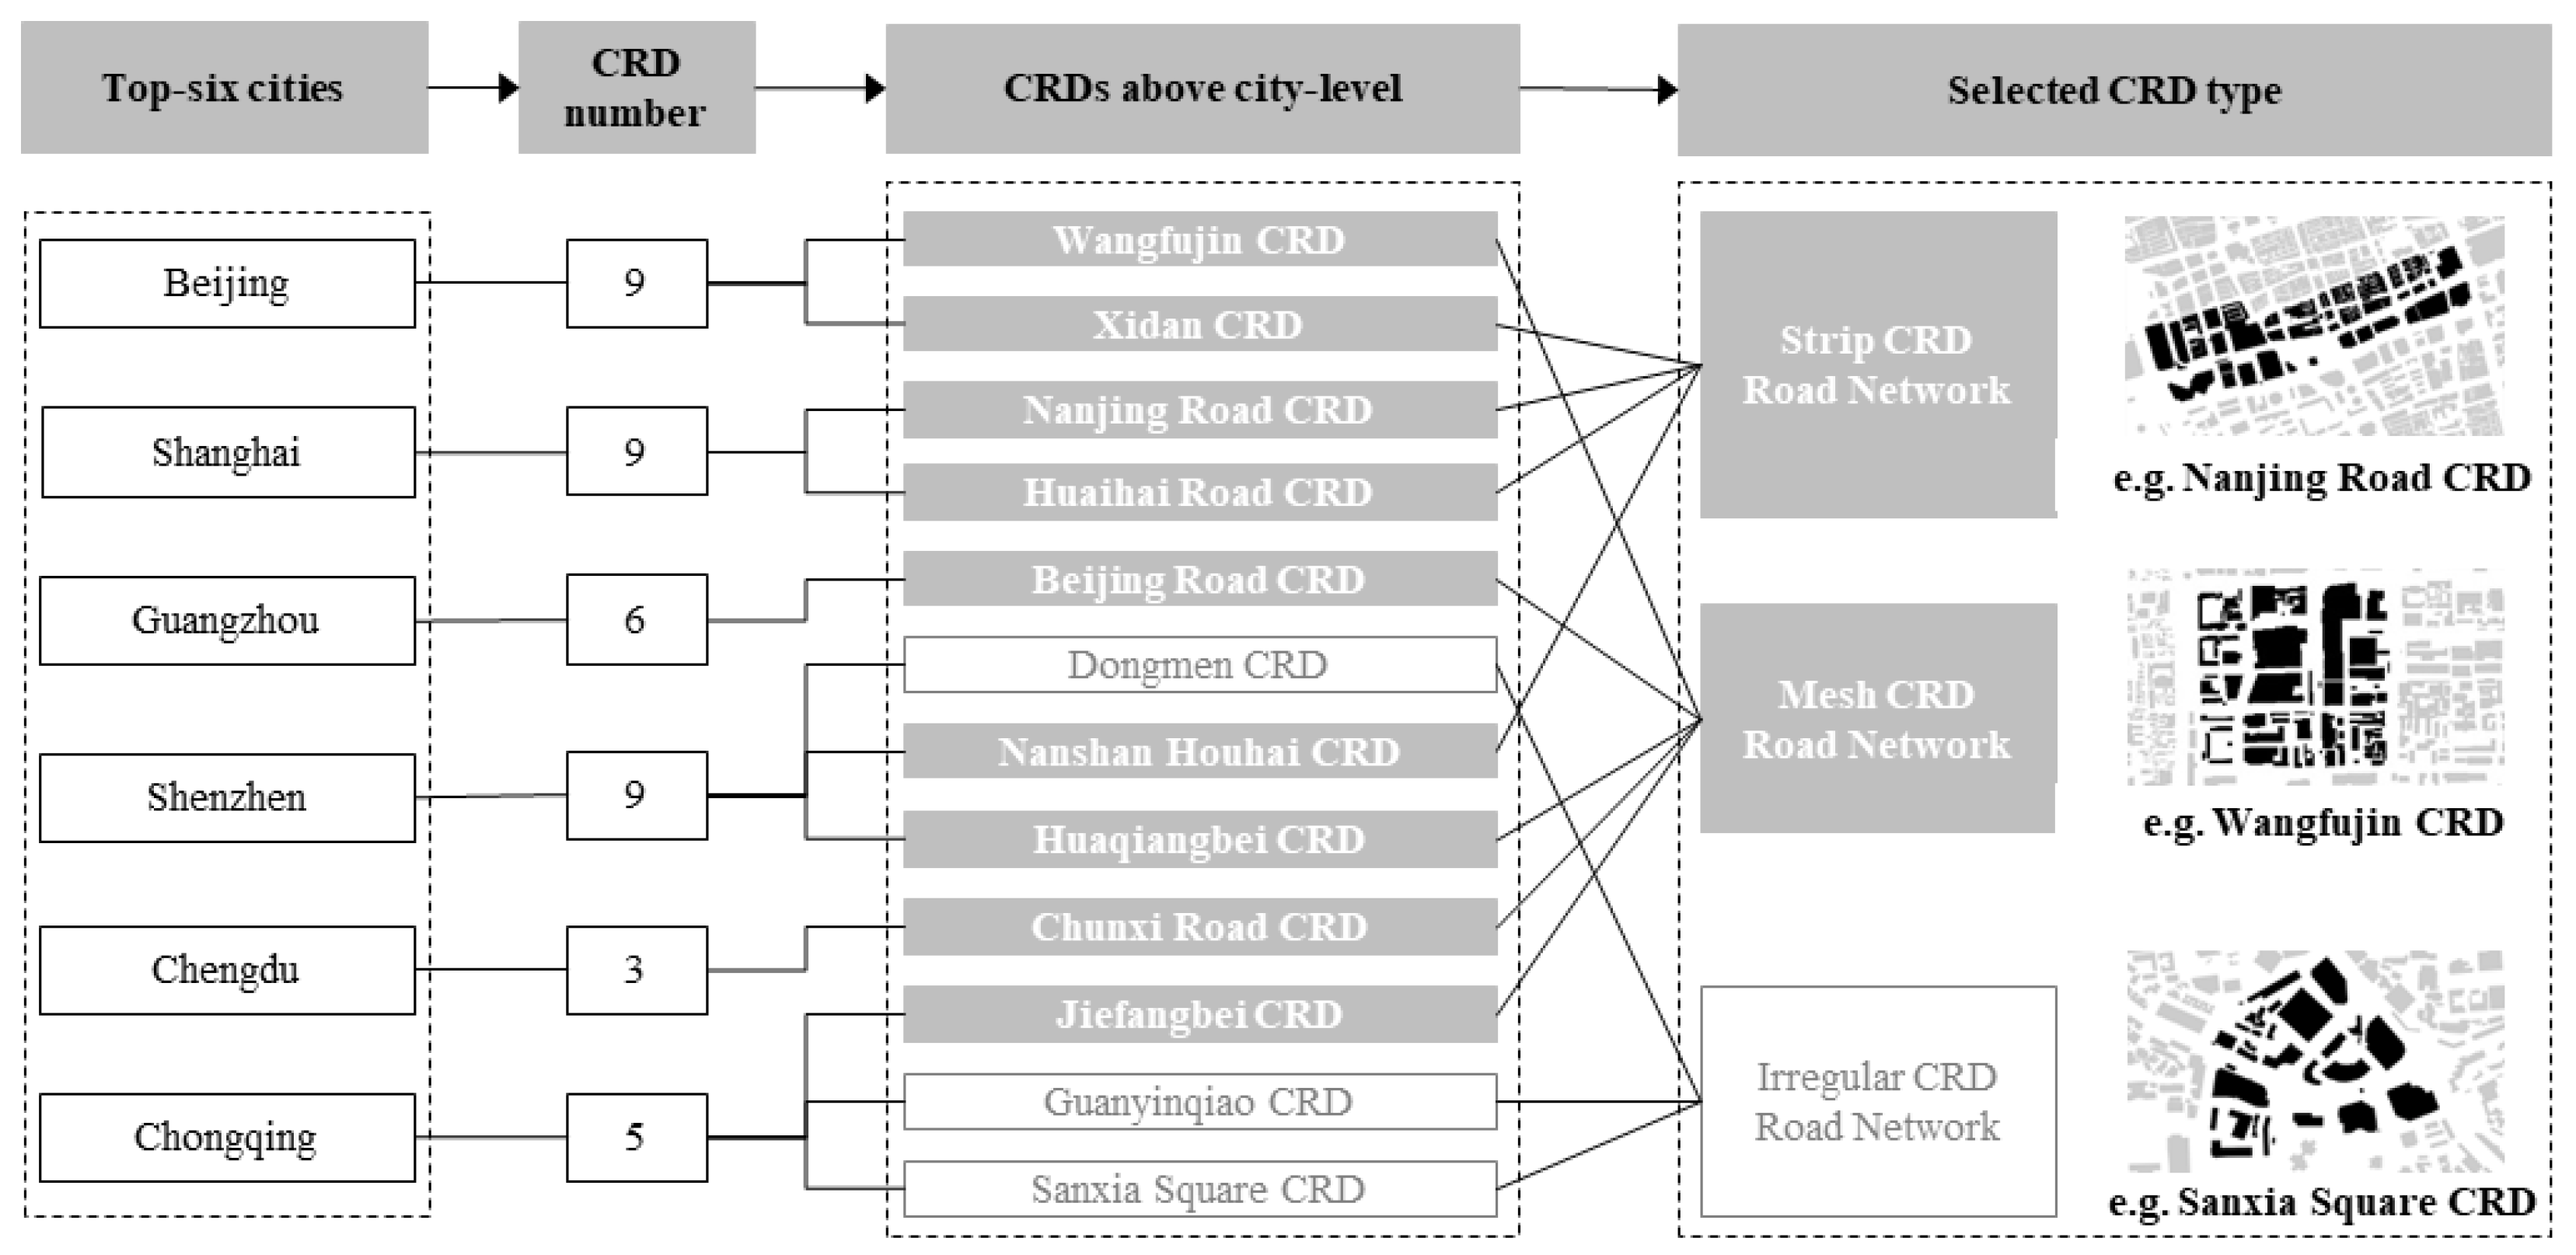
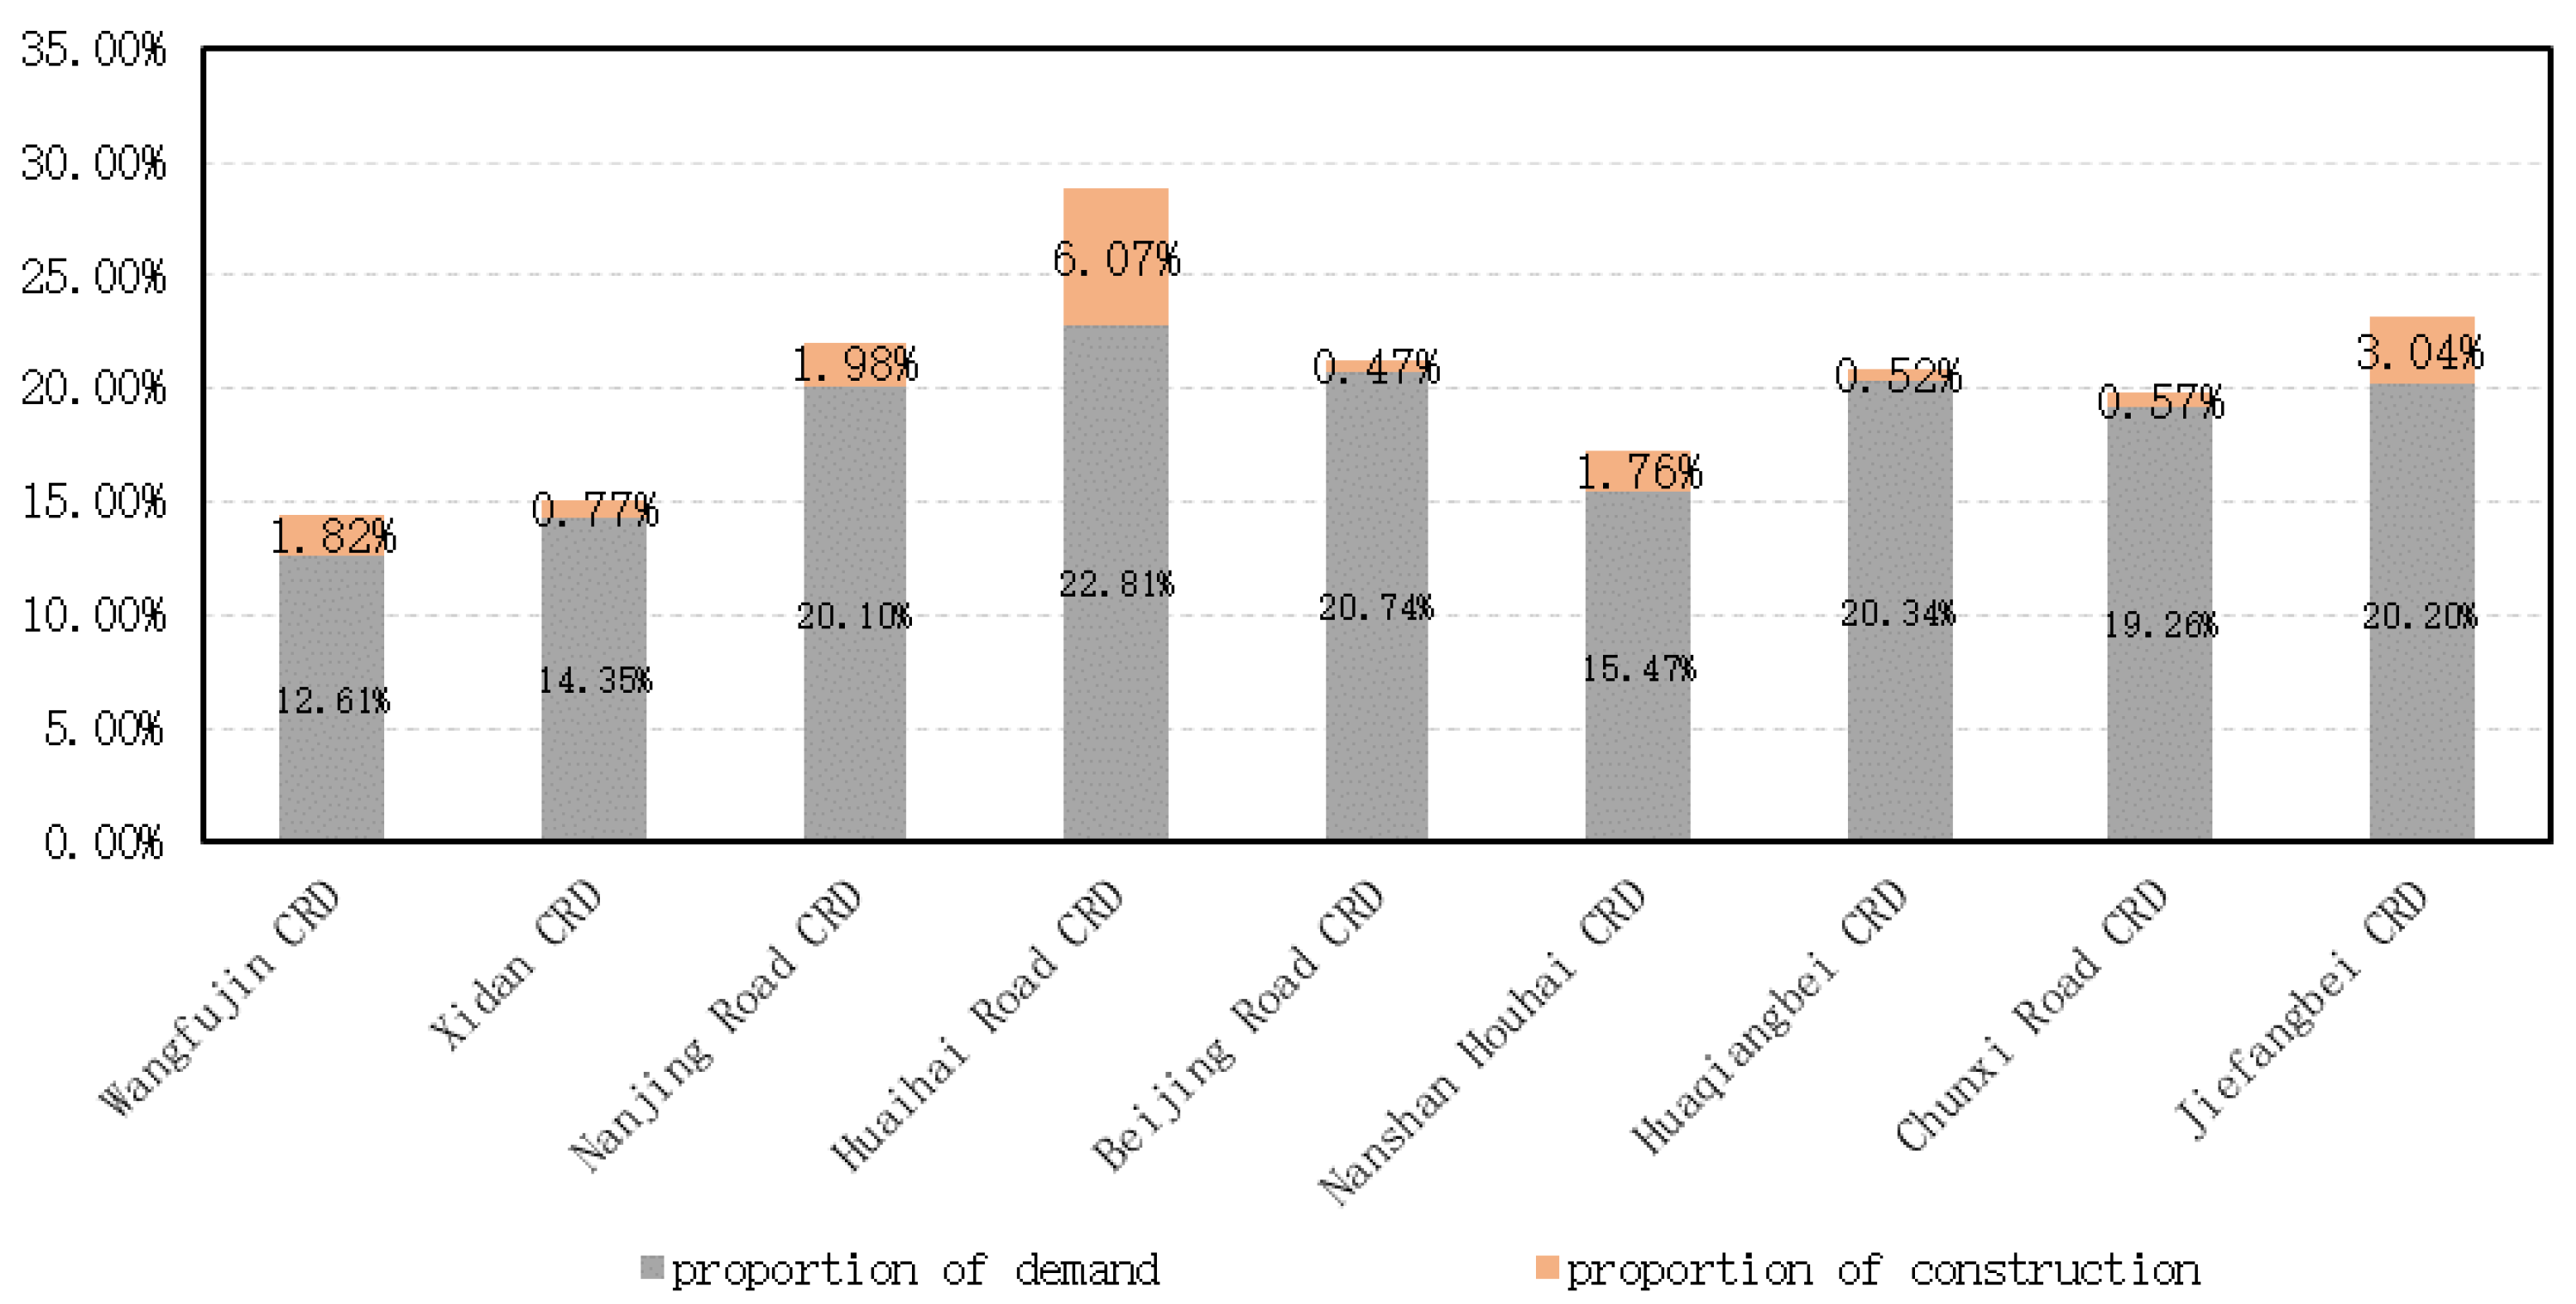
2.1.1. Study Area Selection
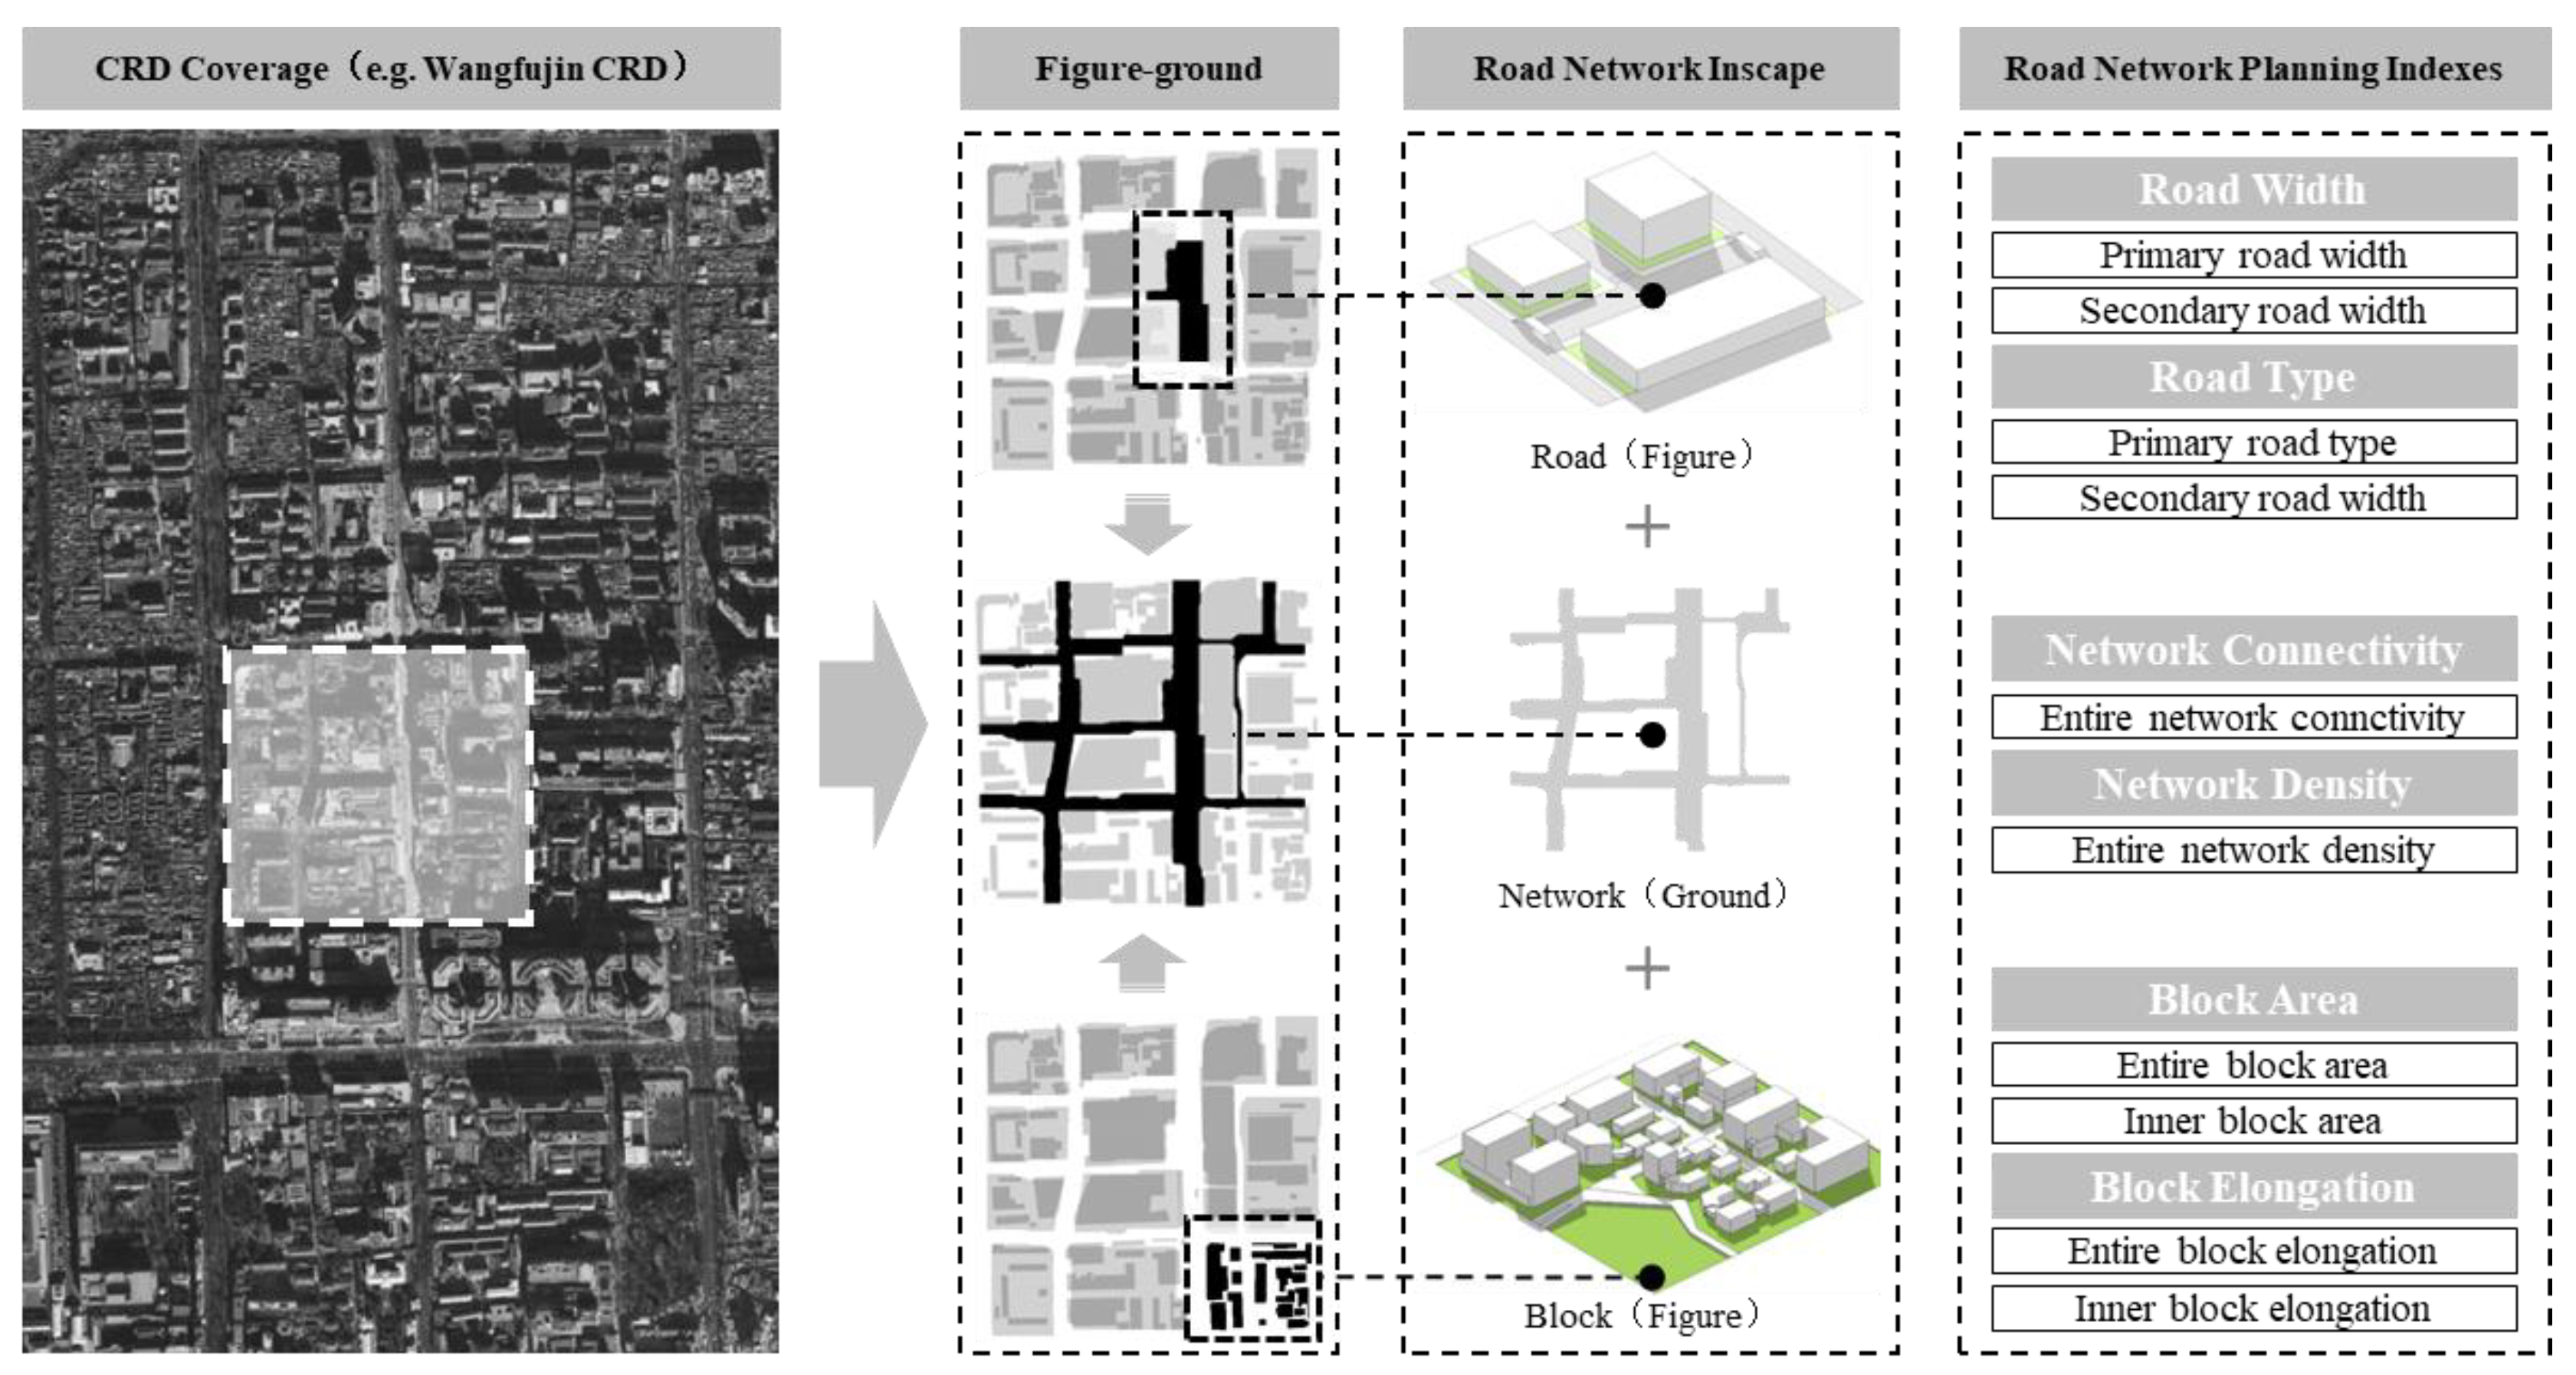
2.1.2. Road Network Planning Indices Selection
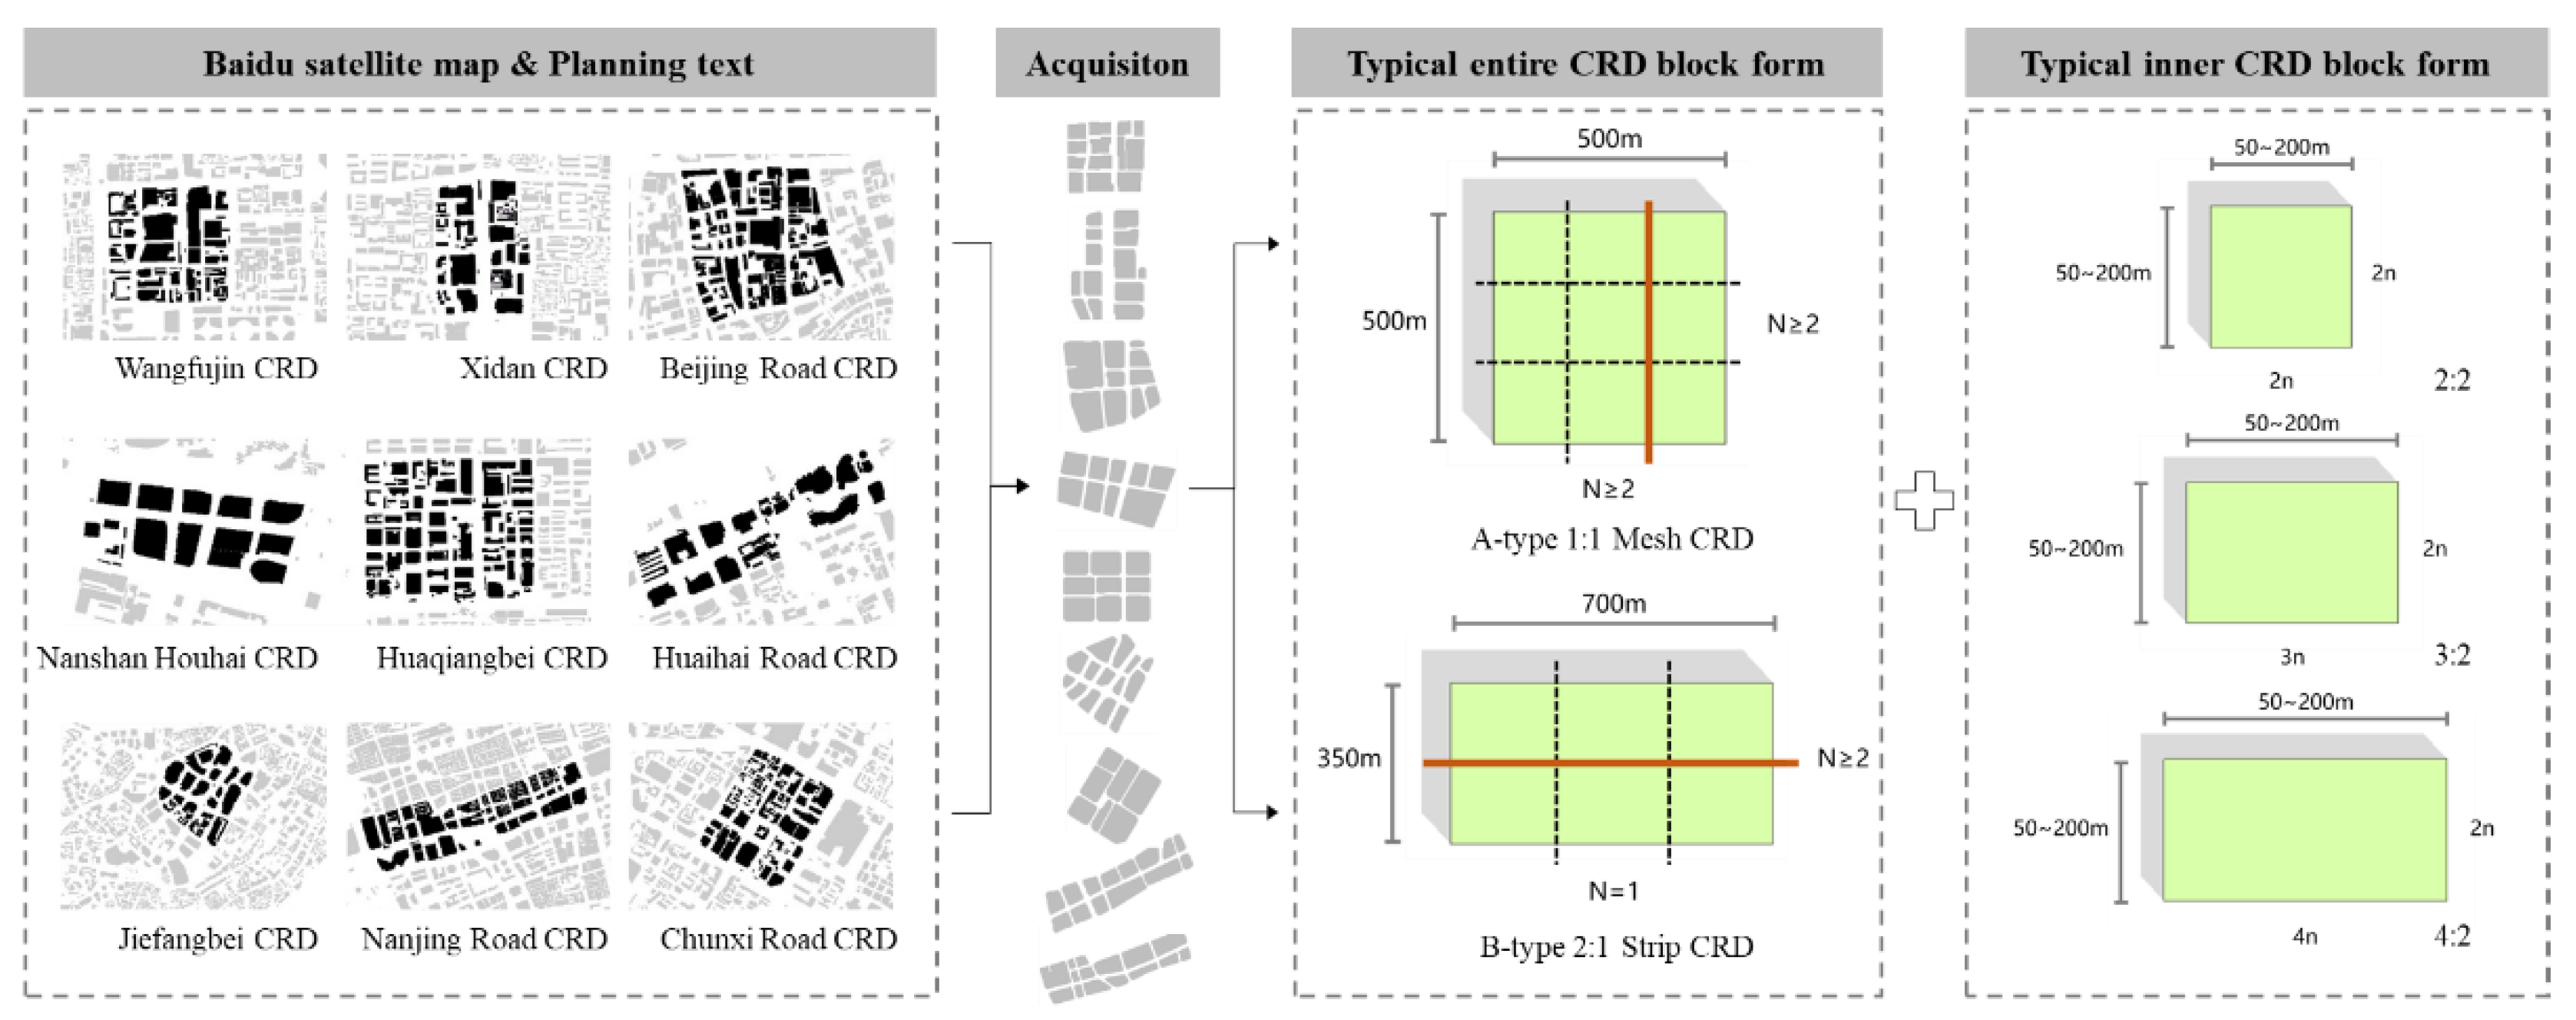
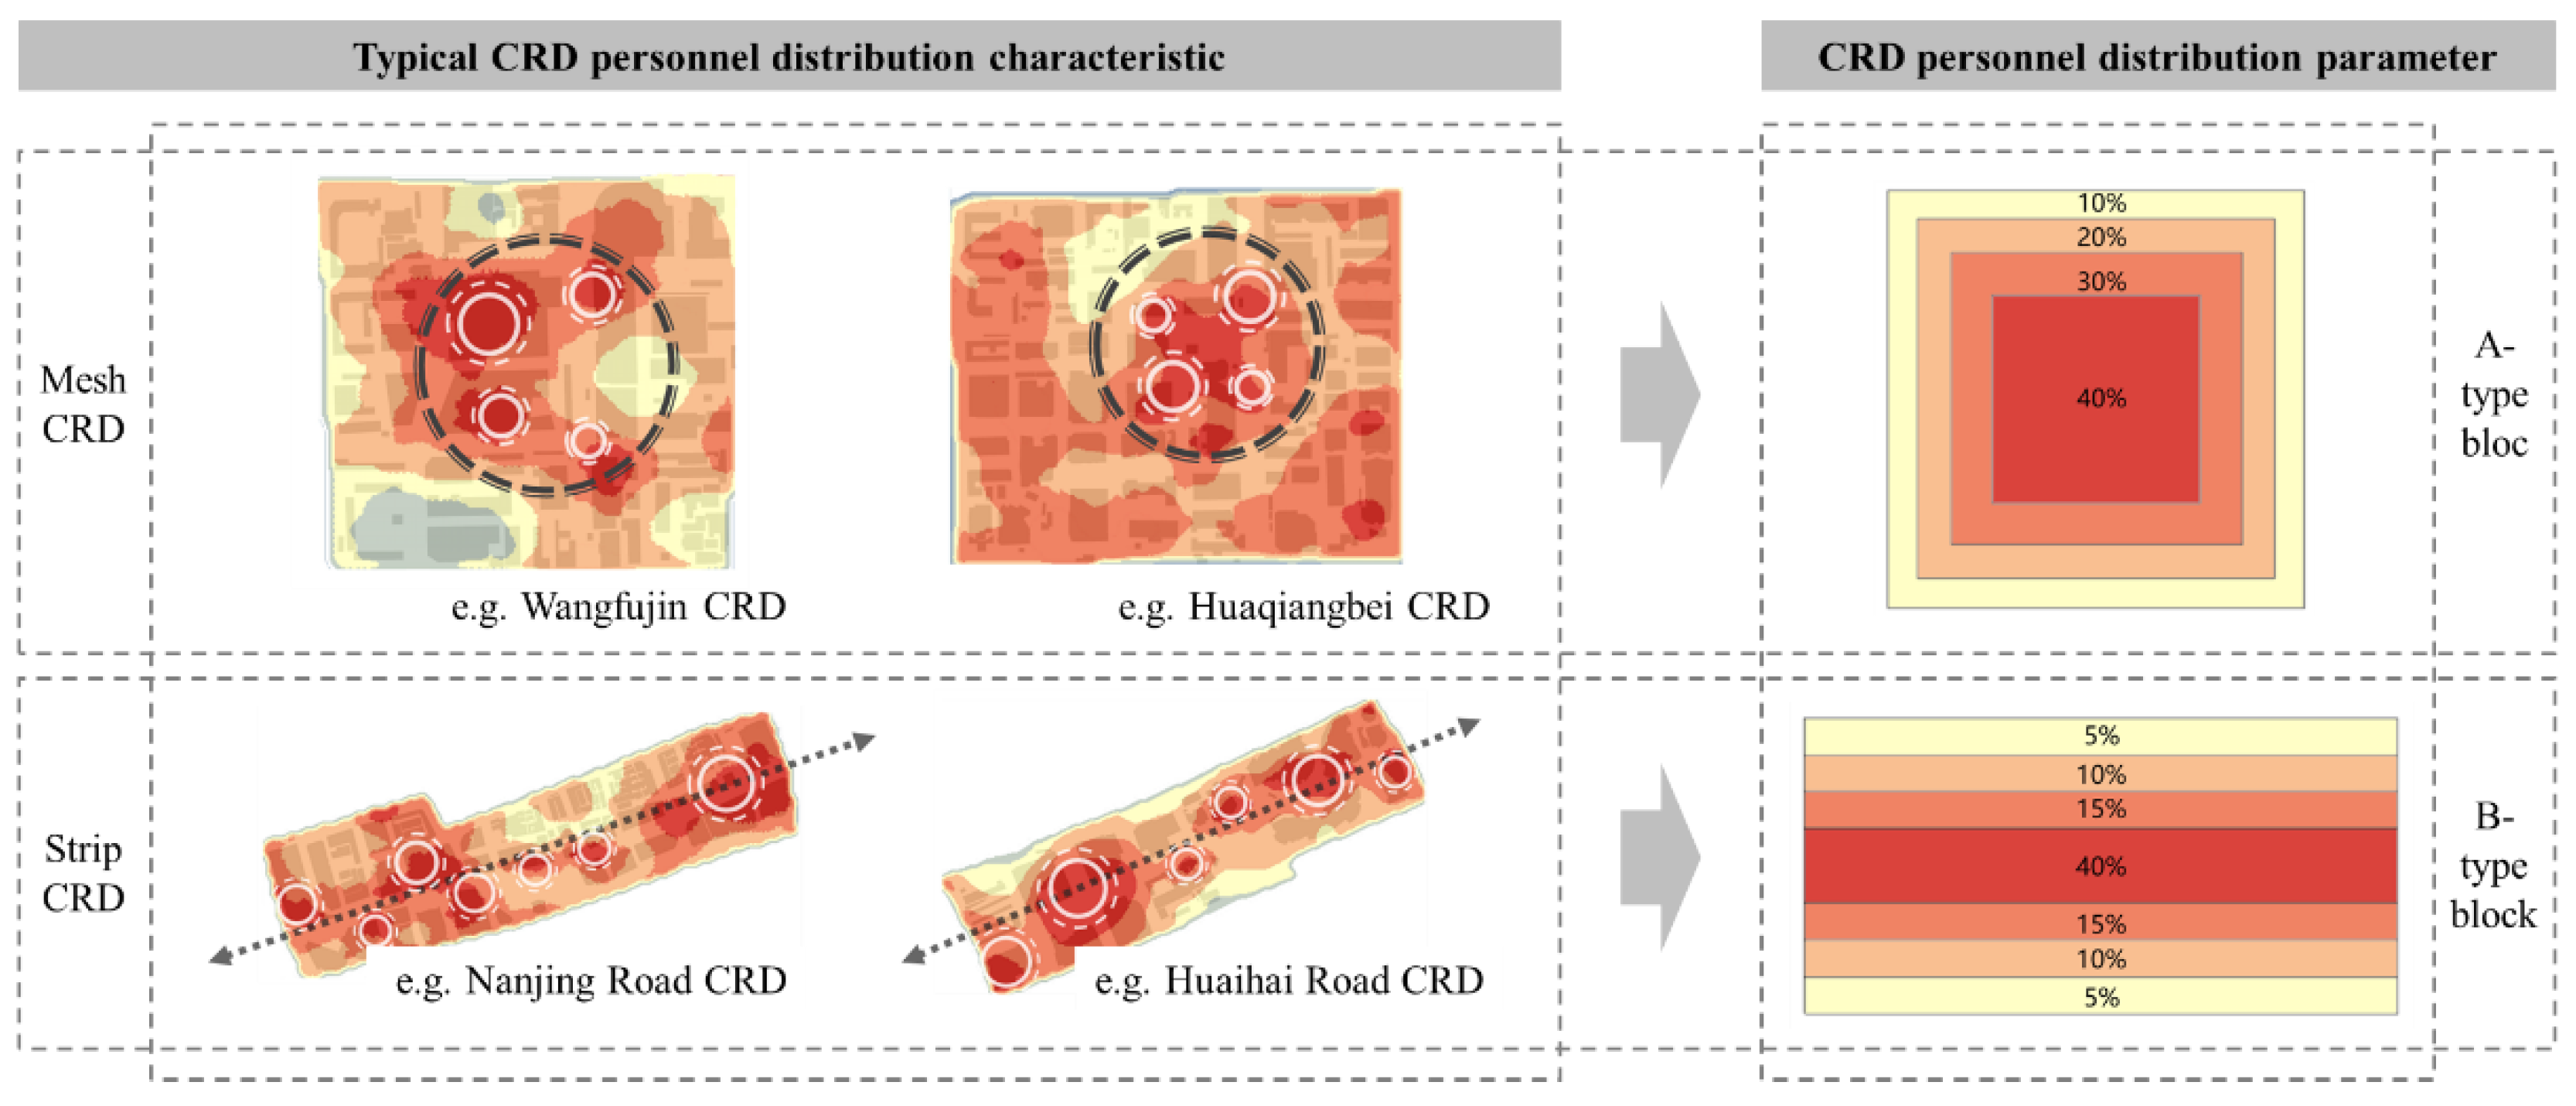
2.1.3. Typical CRD Road Network Form
- Block form
- 2.
- Network structure
- 3.
- Road grade
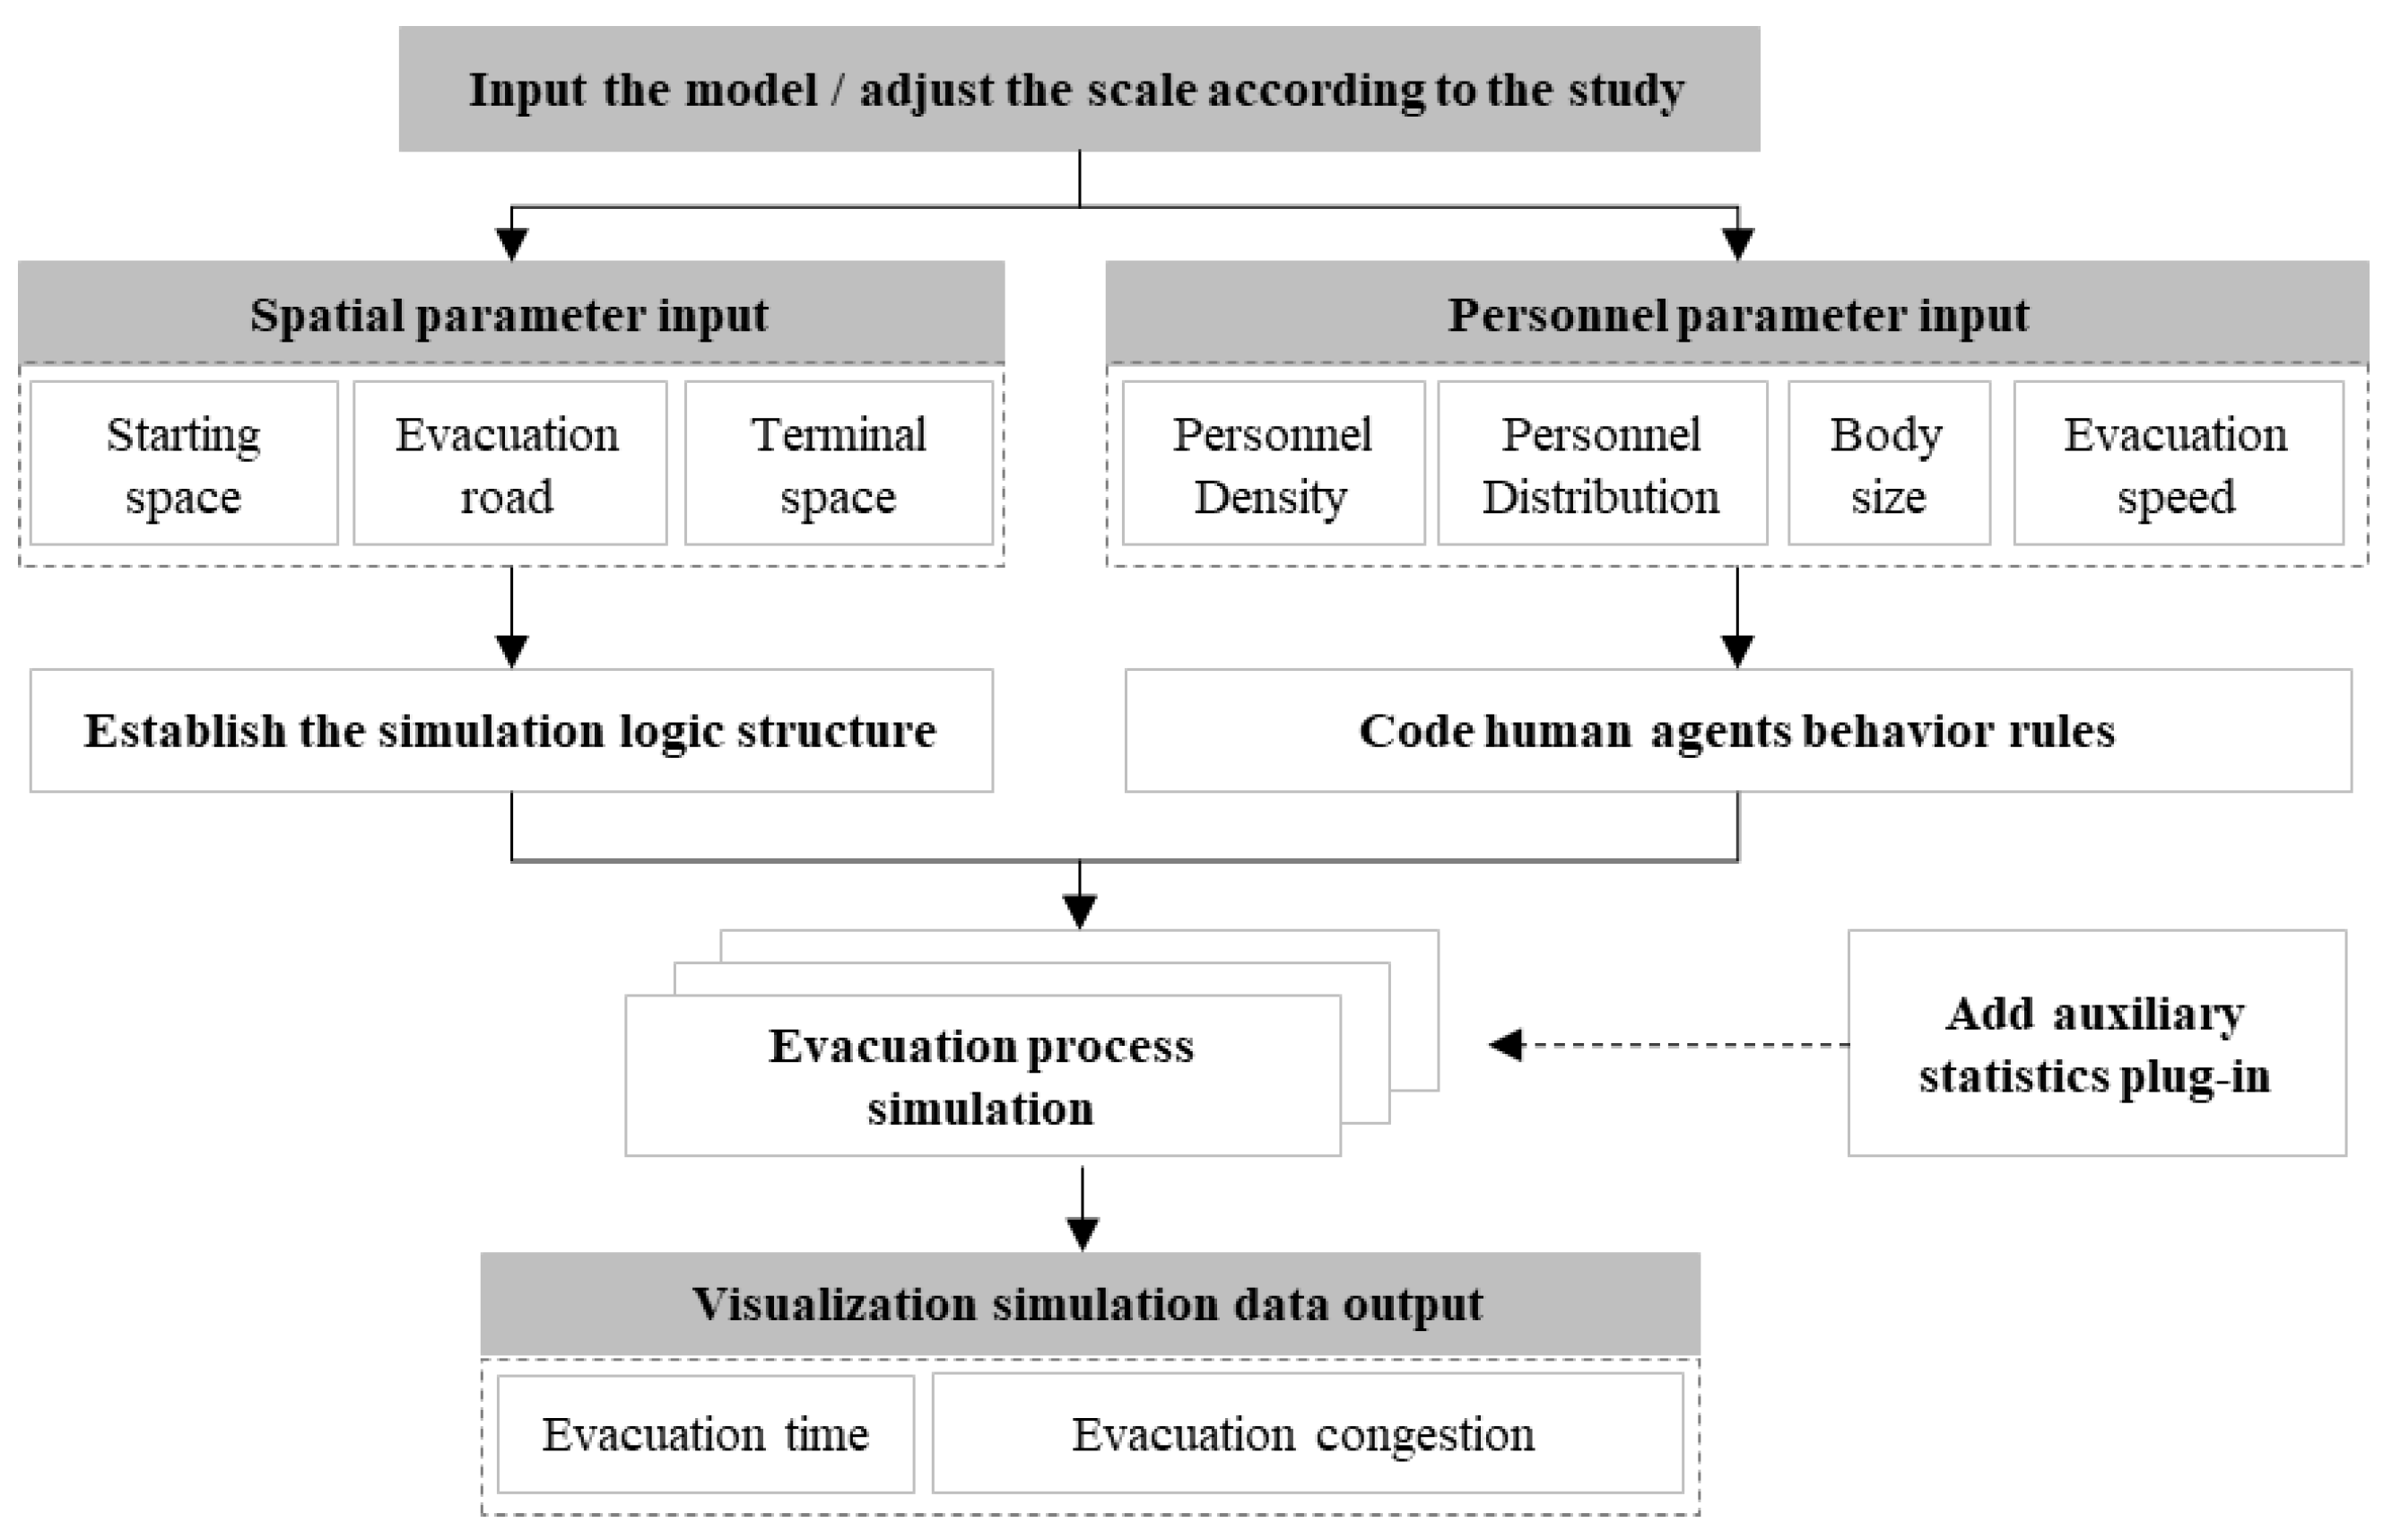
2.2. Experimental Model Design
2.3. Simulation Parameter Setting
2.3.1. Personnel Parameter Setting
- 1.
- Personnel density
- 2.
- Personnel distribution
- 3.
- Pathfinding rule
- 4.
- Body size
- 5.
- Evacuation speed
2.3.2. Spatial Parameter Setting
- 1.
- Evacuation starting space
- 2.
- Evacuation terminal space
3. Results
3.1. Indices Significance Analysis
3.2. Indices Importance Analysis
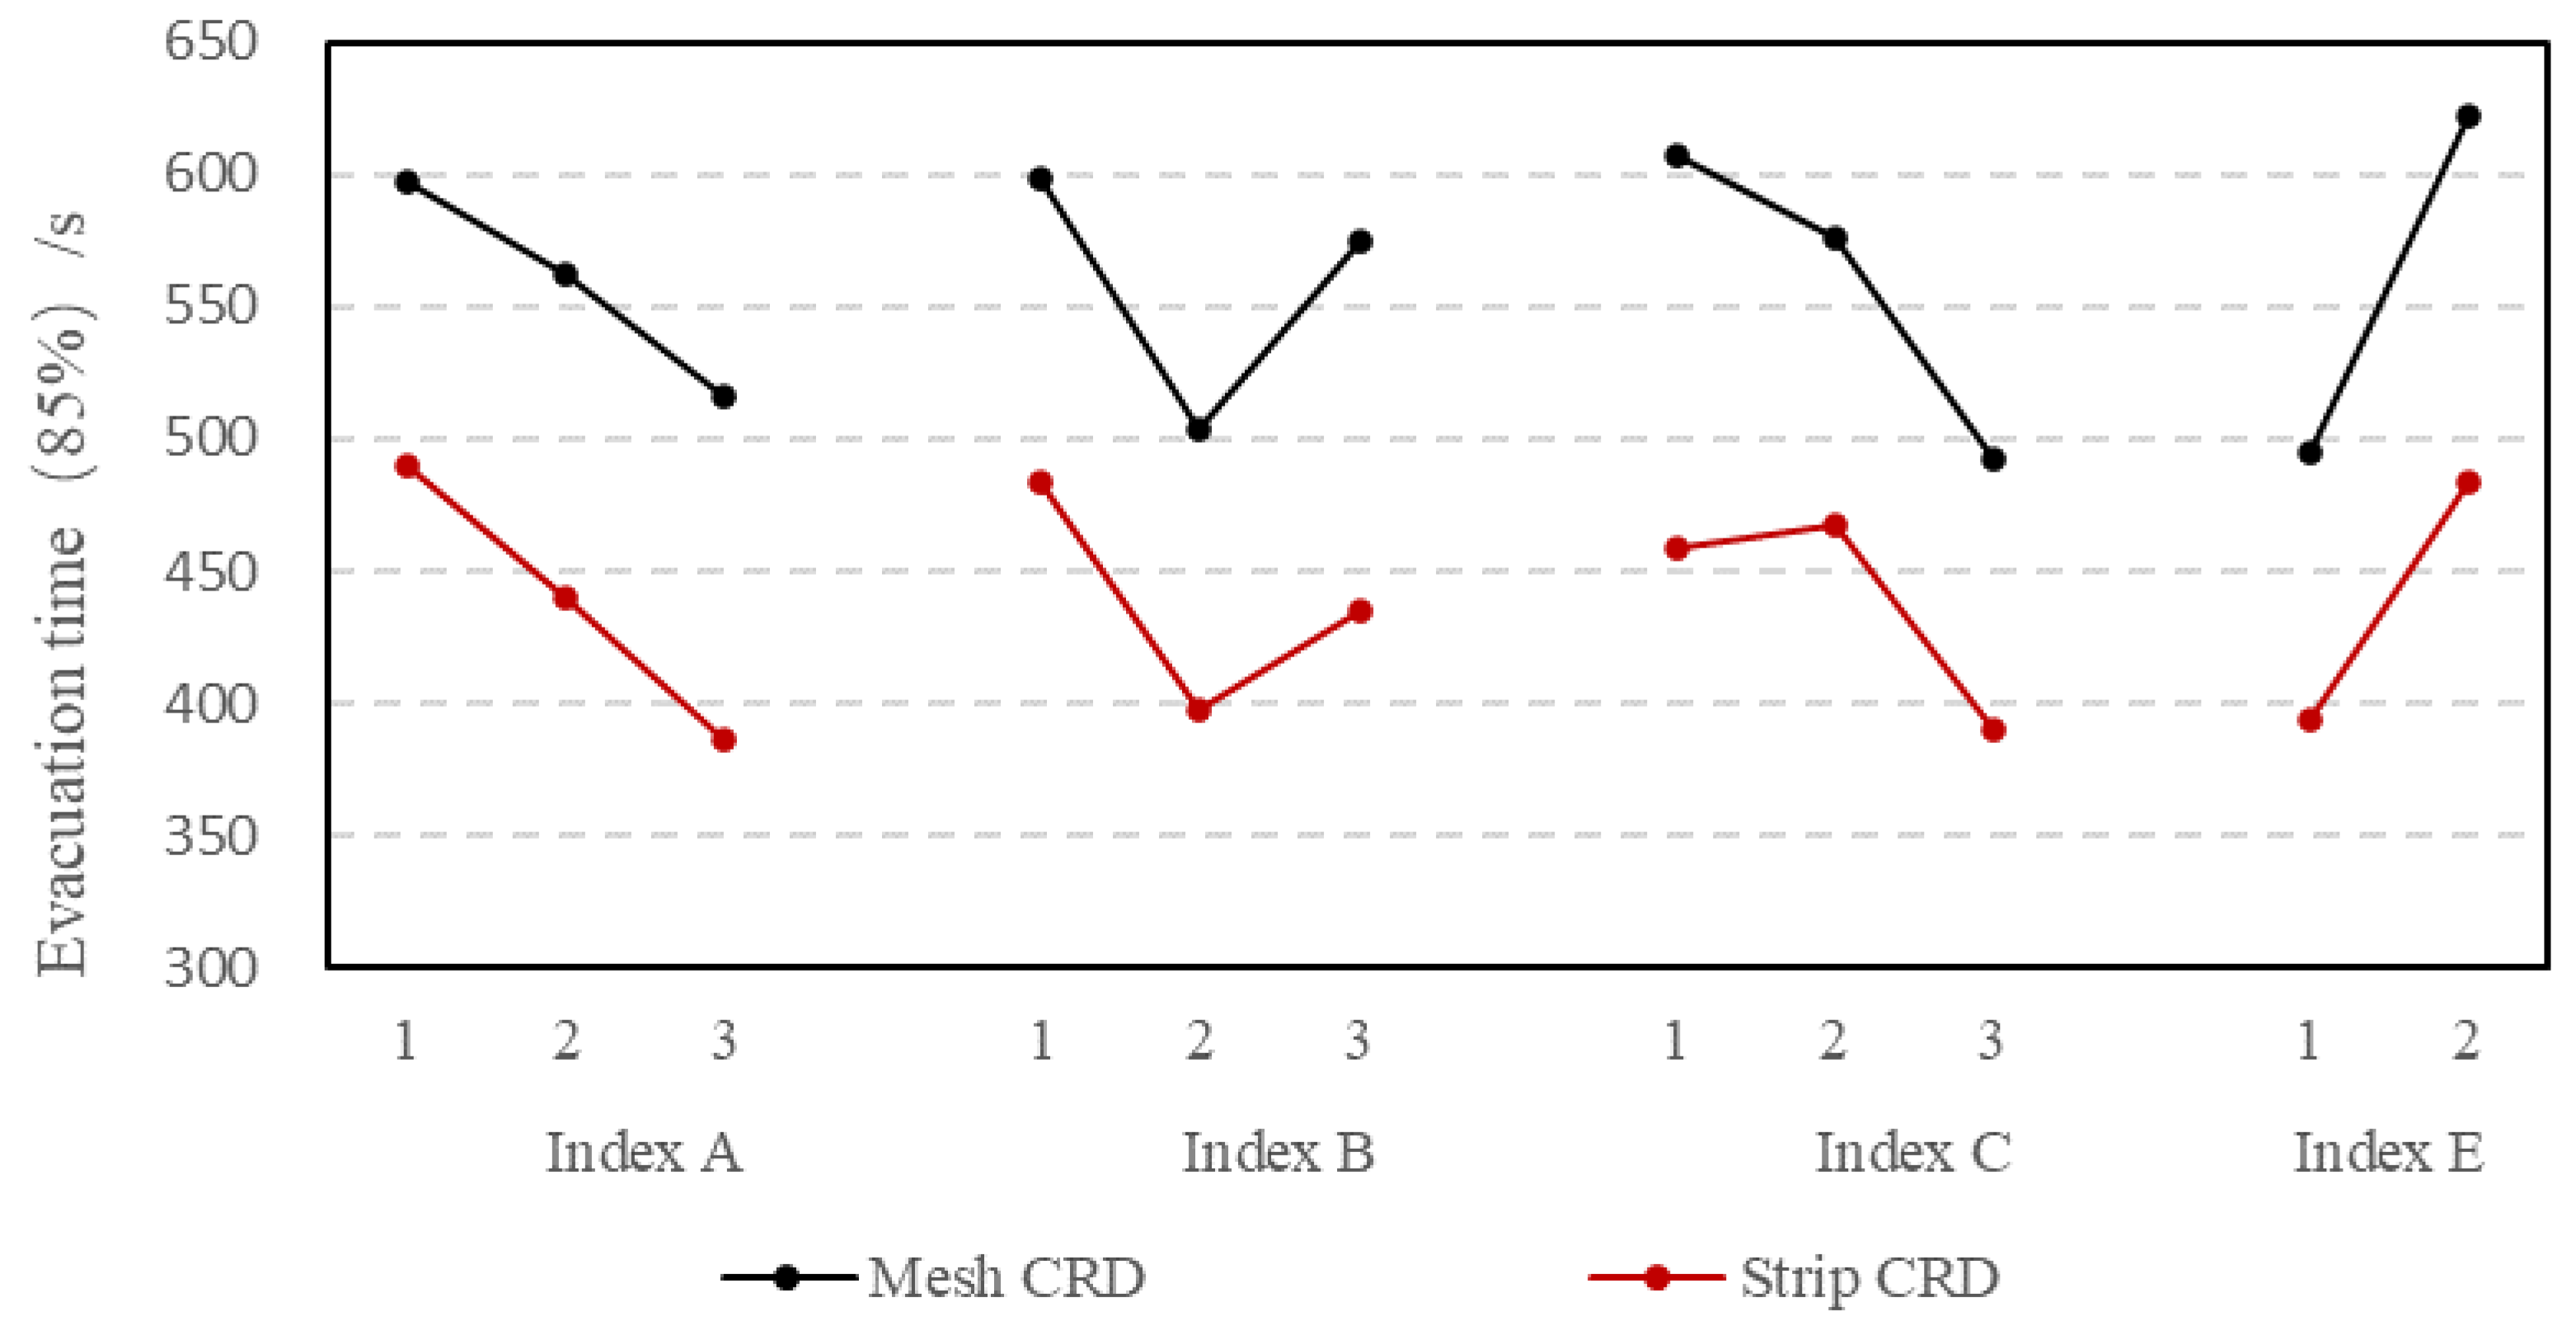
3.3. Indices Optimal Level Analysis
4. Discussion
4.1. Parametric and Synergistic Effect Analysis
4.2. Urban Design Implications
- 1.
- Improving primary road grade
- 2.
- Controlling secondary road width
- 3.
- Increasing network density
- 4.
- Flexible road connection
- 5.
- Ordered optimization
4.3. Limitations
5. Conclusions
Author Contributions
Funding
Data Availability Statement
Conflicts of Interest
References
- United Nations Office for Disaster Risk Reduction. GP2022 Co-Chairs’ Summary; United Nations Office for Disaster Risk Reduction: Bali, Indonesia, 2022. [Google Scholar]
- UN-Habitat. World Cities Report 2020—The Value of Sustainable Urbanization; UN-Habitat: Nairobi, Kenya, 2020; Volume 51. [Google Scholar]
- Amoako, C.; Cobbinah, P.B.; Niminga-Beka, R. Urban Infrastructure Design and Pedestrian Safety in the Kumasi Central Business District, Ghana. J. Transp. Saf. Secur. 2014, 6, 235–256. [Google Scholar] [CrossRef]
- Zeng, J.; Zuo, C. Analysis of disaster prevention and mitigation strategies in CBD spatial planning and design. Archit. J. 2010, 11, 75–79. [Google Scholar]
- Ercolano, J.M. Pedestrian Disaster Preparedness and Emergency Management: White Paper for Executive Management; New York State Department of Transportation: Albany, NY, USA, 2007. [Google Scholar]
- Zhou, T.J.; Wang, D.C. Discussion on the pedestrian emergency events evacuation preparedness space design of urban central areas: Literature review and research framework establishment. Urban Archit. 2017, 21, 21–26. [Google Scholar]
- Zegeer, C.V.; Sandt, L.; Scully, M. How to Develop a Pedestrian Safety Action Plan; Federal Highway Administration: Chapel Hill, NC, USA, 2008; Volume 1. [Google Scholar]
- Thomas, L.; Ryus, P.; Semler, C.; Thirsk, N.J.; Krizek, K.; Zegeer, C. Delivering safe, comfortable, and connected pedestrian and bicycle networks: A review of international practices. In Pedestrian and Cyclist Safety: U.S. Trends and Initiatives and International Practices; Nova Science Pub Inc.: Hauppauge, NY, USA, 2016. [Google Scholar]
- Ercolano, J. Pedestrian disaster preparedness and emergency management of mass evacuations on foot: State-of-the-art and best practices. J. Appl. Secur. Res. 2008, 3, 389–405. [Google Scholar] [CrossRef]
- Chen, P.; Zhang, J.; Zhang, L.; Sun, Y. Sun Evaluation of Resident Evacuations in Urban Rainstorm Waterlogging Disasters Based on Scenario Simulation: Daoli District (Harbin, China) as an Example. Int. J. Environ. Res. Public Health 2014, 11, 9964–9980. [Google Scholar] [CrossRef] [Green Version]
- Nguyen, D.-T.; Shen, Z.-J.; Truong, M.-H.; Sugihara, K. Improvement of evacuation modeling by considering road blockade in the case of an earthquake: A case study of Daitoku school district, Kanazawa city, Japan. Sustainability 2021, 13, 2637. [Google Scholar] [CrossRef]
- Xinhua News Agency. The Number of Motor Vehicles in China Exceeded 400 Million; Central People’s Government of the People’s Republic of China: Beijing, China, 2022. [Google Scholar]
- Lee, J. A three-dimensional navigable data model to support emergency response in microspatial built-environments. Ann. Assoc. Am. Geogr. 2007, 97, 512–529. [Google Scholar] [CrossRef]
- Dunn, C.E.; Newton, D. Optimal routes in GIS and emergency planning applications. Area 1992, 24, 259–267. [Google Scholar]
- Yamada, T. A network flow approach to a city emergency evacuation planning. Int. J. Syst. Sci. 1996, 27, 931–936. [Google Scholar] [CrossRef]
- Mohamadi, B.; Chen, S.; Liu, J. Evacuation priority method in tsunami hazard based on DMSP/OLS population mapping in the Pearl River estuary, China. ISPRS Int. J. Geo-Inf. 2019, 8, 137. [Google Scholar] [CrossRef] [Green Version]
- Zhang, N.; Huang, H.; Su, B.; Zhao, J. Analysis of dynamic road risk for pedestrian evacuation. Phys. A Stat. Mech. Its Appl. 2015, 430, 171–183. [Google Scholar] [CrossRef]
- Fang, Z.; Li, Q.; Li, Q.; Han, L.D.; Shaw, S.-L. A space-time efficiency model for optimizing intra-intersection vehicle-pedestrian evacuation movements. Transp. Res. Part C Emerg. Technol. 2013, 31, 112–130. [Google Scholar] [CrossRef]
- Cova, T.J.; Johnson, J.P. A network flow model for lane-based evacuation routing. Transp. Res. Part A Policy Pract. 2003, 37, 579–604. [Google Scholar] [CrossRef]
- León, J.; Vicuña, M.; Ogueda, A.; Guzmán, S.; Gubler, A.; Mokrani, C. From urban form analysis to metrics for enhancing tsunami evacuation: Lessons from twelve Chilean cities. Int. J. Disaster Risk Reduct. 2021, 58, 102215. [Google Scholar] [CrossRef]
- Zhou, T.; Wang, D.; Zong, D.; He, X. The Study of the responsibility space regionalization of emergency shelters in the urban center and the evaluation of evacuation road based on microscope computer simulation—A Case of Chongqing Three Gorges Square Area. Disaster Adv. 2012, 5, 230–236. [Google Scholar]
- Zuo, J.; Shi, J.; Li, C.; Mu, T.; Zeng, Y.; Dong, J. Simulation and optimization of pedestrian evacuation in high-density urban areas for effectiveness improvement. Environ. Impact Assess. Rev. 2020, 87, 106521. [Google Scholar] [CrossRef]
- Shi, Z.; Hsieh, S.; Fonseca, J.A.; Schlueter, A. Street grids for efficient district cooling systems in high-density cities. Sustain. Cities Soc. 2020, 60, 102224. [Google Scholar] [CrossRef]
- Minaei, M. Evolution, density and completeness of OpenStreetMap road networks in developing countries: The case of Iran. Appl. Geogr. 2020, 119, 102246. [Google Scholar] [CrossRef]
- Jiang, F.; Ma, L.; Broyd, T.; Chen, K.; Luo, H.; Pei, Y. Sustainable road alignment planning in the built environment based on the MCDM-GIS method. Sustain. Cities Soc. 2022, 87, 104246. [Google Scholar] [CrossRef]
- Shi, B.; Yang, J.; Zheng, Y. The Centre of City: Urban Central Structure; Springer: Singapore, 2021. [Google Scholar] [CrossRef]
- Jin, J.G.; Shen, Y.; Hu, H.; Fan, Y.; Yu, M. Optimizing underground shelter location and mass pedestrian evacuation in urban community areas: A case study of Shanghai. Transp. Res. Part A Policy Pract. 2021, 149, 124–138. [Google Scholar] [CrossRef]
- Irsyad, H.A.W.; Hitoshi, N. Flood disaster evacuation route choice in Indonesian urban riverbank kampong: Exploring the role of individual characteristics, path risk elements, and path network configuration. Int. J. Disaster Risk Reduct. 2022, 81, 103275. [Google Scholar] [CrossRef]
- Wang, D.; Zhou, T.; Yang, G. Way-finding Strategies and Individual Influencing Factors of Fire Evacuation in Underground Commercial Buildings. In Proceedings of the 2019 9th International Conference on Fire Science and Fire Protection Engineering (ICFSFPE), Chengdu, China, 18–20 October 2019; pp. 1–6. [Google Scholar] [CrossRef]
- Chen, D. The theory of the design of experiments. Technometrics 2001, 43, 497. [Google Scholar] [CrossRef]
- Alsnih, R.; Stopher, P.R. Review of the Procedures Associated with Devising Emergency Evacuation Plans. Transp. Res. Rec. 2004, 1865, 89–97. [Google Scholar] [CrossRef] [Green Version]
- Chen, J.; Yu, J.; Wen, J.; Zhang, C.; Yin, Z.; Wu, J.; Yao, S. Pre-evacuation Time Estimation Based Emergency Evacuation Simulation in Urban Residential Communities. Int. J. Environ. Res. Public Health 2019, 16, 4599. [Google Scholar] [CrossRef] [Green Version]
- Vermuyten, H.; Beliën, J.; De Boeck, L.; Reniers, G.; Wauters, T. A review of optimisation models for pedestrian evacuation and design problems. Saf. Sci. 2016, 87, 167–178. [Google Scholar] [CrossRef]
- Hoppe, B.; Tardos, É. Quickest transshipment problem. Math. Oper. Res. 2000, 25, 36–62. [Google Scholar] [CrossRef] [Green Version]
- Yu, J.; Zhang, C.; Wen, J.; Li, W.; Liu, R.; Xu, H. Integrating multi-agent evacuation simulation and multi-criteria evaluation for spatial allocation of urban emergency shelters. Int. J. Geogr. Inf. Sci. 2018, 32, 1884–1910. [Google Scholar] [CrossRef]
- Yuksel, M.E. Agent-based evacuation modeling with multiple exits using NeuroEvolution of Augmenting Topologies. Adv. Eng. Inform. 2018, 35, 30–55. [Google Scholar] [CrossRef]
- D’Orazio, M.; Spalazzi, L.; Quagliarini, E.; Bernardini, G. Agent-based model for earthquake pedestrians’ evacuation in urban outdoor scenarios: Behavioural patterns definition and evacuation paths choice. Saf. Sci. 2014, 62, 450–465. [Google Scholar] [CrossRef]
- Shi, J.; Ren, A.; Chen, C. Agent-based evacuation model of large public buildings under fire conditions. Autom. Constr. 2009, 18, 338–347. [Google Scholar] [CrossRef]
- Cheng, Z.; Lu, J.; Zhao, Y. Pedestrian Evacuation Risk Assessment of Subway Station under Large-Scale Sport Activity. Int. J. Environ. Res. Public Health 2020, 17, 3844. [Google Scholar] [CrossRef] [PubMed]
- Boeing, G. OSMnx: New methods for acquiring, constructing, analyzing, and visualizing complex street networks. Comput. Environ. Urban Syst. 2017, 65, 126–139. [Google Scholar] [CrossRef] [Green Version]
- Shi, Z.; Fonseca, J.A.; Schlueter, A. A parametric method using vernacular urban block typologies for investigating interactions between solar energy use and urban design. Renew. Energy 2020, 165, 823–841. [Google Scholar] [CrossRef]
- Sharifi, A. Resilient urban forms: A review of literature on streets and street networks. Build. Environ. 2019, 147, 171–187. [Google Scholar] [CrossRef]
- León, J.; March, A. Urban morphology as a tool for supporting tsunami rapid resilience: A case study of Talcahuano, Chile. Habitat Int. 2014, 43, 250–262. [Google Scholar] [CrossRef]
- First-Tier City Research Institute. China City Comprehensive Business Index Ranking in 2020; China Business Network: Shanghai, China, 2020. [Google Scholar]
- Ballard, D.H. Generalizing the Hough transform to detect arbitrary shapes. Pattern Recognit. 1981, 13, 111–122. [Google Scholar] [CrossRef] [Green Version]
- Liu, B.; Shi, Y.; Li, D.-J.; Wang, Y.-D.; Fernandez, G.; Tsou, M.-H. An economic development evaluation based on the openstreetmap road network density: The case study of 85 cities in china. ISPRS Int. J. Geo-Inf. 2020, 9, 517. [Google Scholar] [CrossRef]
- Lu, J.; Wang, W. Planning indices system of urban road network. J. Traffic Transp. Eng. 2004, 4, 62–67. [Google Scholar]
- NACTO. Global Street Design Guide; Island Press: Washington, DC, USA, 2016. [Google Scholar]
- Zurovac, J.; Brown, R. Orthogonal Design: A Powerful Method for Comparative Effectiveness Research with Multiple Interventions; Center on Healthcare Effectiveness: Washington, DC, USA, 2012. [Google Scholar]
- Helbing, D.; Buzna, L.; Johansson, A.; Werner, T.; van Wageningen-Kessels, F.; Daamen, W.; Hoogendoorn, S.P.; Jiang, R.; Hu, M.-B.; Wu, Q.-S.; et al. Self-organized pedestrian crowd dynamics: Experiments, simulations, and design solutions. Transp. Sci. 2005, 39, 1–24. [Google Scholar] [CrossRef] [Green Version]
- Borshchev, A.; Karpov, Y.; Kharitonov, V. Distributed simulation of hybrid systems with AnyLogic and HLA. Future Gener. Comput. Syst. 2002, 18, 829–839. [Google Scholar] [CrossRef]
- Song, X.; Sun, J.; Xie, H.; Li, Q.; Wang, Z.; Han, D. Characteristic time based social force model improvement and exit assignment strategy for pedestrian evacuation. Phys. A Stat. Mech. Its Appl. 2018, 505, 530–548. [Google Scholar] [CrossRef]
- Xu, H.; Tian, C.; Li, Y. Emergency evacuation simulation and optimization for a complex rail transit station: A perspective of promoting transportation safety. J. Adv. Transp. 2020, 2020, 8791503. [Google Scholar] [CrossRef] [Green Version]
- Shatu, F.; Yigitcanlar, T.; Bunker, J. Shortest path distance vs. least directional change: Empirical testing of space syntax and geographic theories concerning pedestrian route choice behaviour. J. Transp. Geogr. 2019, 74, 37–52. [Google Scholar] [CrossRef]
- Perry, R.W.; Lindell, M.K. Preparedness for emergency response: Guidelines for the emergency planning process. Disasters 2003, 27, 336–350. [Google Scholar] [CrossRef] [PubMed]
- Wifipix. Analysis of Customer Group Data of Typical Shopping Centers in Beijing and Shanghai; Baidu: Beijing, China, 2016. [Google Scholar]
- Lo, S.M.; Fang, Z.; Lin, P.; Zhi, G.S. An evacuation model: The SGEM package. Fire Saf. J. 2004, 39, 169–190. [Google Scholar] [CrossRef]
- Ayo-Odifiri, O.S.; Fasakin, J.O.; Henshaw, F.O. Road Connectivity Approach to Eased Traffic Congestion on Market Roads in Benin Metropolis, Nigeria. Am. J. Eng. Res. 2017, 6, 41–48. [Google Scholar]
- Dingil, A.E.; Rupi, F.; Stasiskiene, Z. A macroscopic analysis of transport networks: The influence of network design on urban transportation performance. Int. J. Transp. Dev. Integr. 2019, 3, 331–343. [Google Scholar] [CrossRef] [Green Version]
- Savitha, B.G.; Murthy, R.S.; Jagadeesh, H.S.; Sathish, H.S.; Sundararajan, T. Study on Geometric Factors Influencing Saturation Flow Rate at Signalized Intersections under Heterogeneous Traffic Conditions. J. Transp. Technol. 2017, 7, 83–94. [Google Scholar] [CrossRef] [Green Version]
- Kim, D.; Jeong, O. Cooperative traffic signal control with traffic flow prediction in multi-intersection. Sensors 2020, 20, 137. [Google Scholar] [CrossRef] [Green Version]
- Wang, Z.; Zhou, T.; Yang, G. Study on the influence of effective width of roads in the central business district on the evacuation time in case of emergency. Int. J. Electr. Eng. Educ. 2020. [Google Scholar] [CrossRef]
- Usman, F.; Hariyani, S.; Shoimah, F. Perencanaan Partisipatif Tanggap Darurat Bencana Tsunami Di Pesisir Selatan Watulimo, Trenggalek. TATALOKA 2021, 23, 138–150. [Google Scholar] [CrossRef]
- Wang, J.; Huang, H. Road network safety evaluation using Bayesian hierarchical joint model. Accid. Anal. Prev. 2016, 90, 152–158. [Google Scholar] [CrossRef]
- Wang, X.; Yuan, J.; Schultz, G.G.; Fang, S. Investigating the safety impact of roadway network features of suburban arterials in Shanghai. Accid. Anal. Prev. 2018, 113, 137–148. [Google Scholar] [CrossRef] [PubMed]
- Cai, J.; Cheng, M.; Zhu, F. Analysis of Impact of Key Indicators for Road Network Planning on Development Intensity: Case Study of 24 CBDs Worldwide. Urban Plan. Forum 2017, 1, 79–88. [Google Scholar]
- Lynch, K. Good City Form; The MIT Press: Cambridge, MA, USA, 1984. [Google Scholar]
- Berg, J.V.D.; Lin, M.; Manocha, D. Reciprocal velocity obstacles for real-time multi-agent navigation. In Proceedings of the 2008 IEEE International Conference on Robotics and Automation, Pasadena, CA, USA, 19–23 May 2008. [Google Scholar] [CrossRef] [Green Version]


| Index | Formula | Unit | Explaining |
|---|---|---|---|
| block area [23] | - | km2 | The size of a block. |
| block elongation (ELG) [23] | - | The geometry of a block. D1 is the equivalent circle diameter with the same area as the block; D2 is the minimum circumscribed diameter of the block. The closer the value is to 0.80, the closer the shape is to square. ELG is often expressed in terms of length–width ratio. | |
| network density (D) [46] | km/km2 | The rationality of a road network. L is the road length; S is the size of area. D in this study is the density of all roads. The rationality should be discussed according to traffic demand. | |
| network connectivity (J) [47] | - | The development level of a road network. N is the road node number; M is the number of road sections. J in this study is the connectivity of all roads. The higher the value, the higher the road network development level. | |
| road type [48] | - | - | The section composition of roads. CRD road mainly include two types: pedestrian traffic and mixed traffic with a pedestrian section on both sides. |
| road width (W) [48] | m | The width of all road sections. n is the number of motor vehicle sections, the width of which is limited to 3.5 m/lane; Wp is the pedestrian section width. Each road width should be the minimum width due to the buckets-effect. |
| Mesh CRD Type | Strip CRD Type | |||||
|---|---|---|---|---|---|---|
| Low Density 8.0 km/km2 | Medium Density 10.0 km/km2 | High Density 12.0 km/km2 | Low Density 7.0 km/km2 | Medium Density 9.8 km/km2 | High Density 12.6 km/km2 | |
| high connectivity (5.4~6.0) |  Aa1 |  Ab1 |  Ac1 |  Ba1 |  Bb1 |  Bc1 |
| medium connectivity (4.7~5.1) |  Aa2 |  Ab2 |  Ac2 |  Ba2 |  Bb2 |  Bc2 |
| low connectivity (4.0~4.5) |  Aa3 |  Ab3 |  Ac3 |  Ba3 |  Bb3 |  Bc3 |
| Primary Road | Secondary Road | ||
|---|---|---|---|
| Pedestrian-Traffic Road | Mixed-Traffic Road | Mixed-Traffic Road | |
| narrow width |  |  |  |
| P1 (15 m) | M11 (2 × 2 m + 14 m) | M21 (2 × 2 m + 7 m) | |
| medium width |  |  |  |
| P2 (25 m) | M12 (2 × 4 m + 14 m) | M22 (2 × 4 m + 7 m) | |
| broad width |  |  |  |
| P3 (35 m) | M13 (2 × 6 m + 14 m) | M23 (2 × 6 m + 7 m) | |
| CRD Type | Levels | Primary Road Width (A) | Secondary Road Width (B) | Network Density (C) | Network Connectivity (D) | Primary Road Type (E) |
|---|---|---|---|---|---|---|
| strip CRD | 1 | 15 m/2 × 2 + 14 m | 2 × 2 + 7 m | 7 km/km2 | 4.0~4.5 | pedestrian traffic |
| 2 | 25 m/4 × 2 + 14 m | 4 × 2 + 7 m | 9.8 km/km2 | 4.7~5.1 | mixed traffic | |
| 3 | 35 m/6 × 2 + 14 m | 6 × 2 + 7 m | 12.6 km/km2 | 5.4~6.0 | - | |
| mesh CRD | 1 | 15 m/2 × 2 + 14 m | 2 × 2 + 7 m | 8 km/km2 | 4.0~4.5 | pedestrian traffic |
| 2 | 25 m/4 × 2 + 14 m | 4 × 2 + 7 m | 10 km/km2 | 4.7~5.1 | mixed traffic | |
| 3 | 35 m/6 × 2 + 14 m | 6 × 2 + 7 m | 12 km/km2 | 5.4~6.0 | - |
| Level | Range | Average | Standard |
|---|---|---|---|
| low density | 0.08~0.15 p/m2 | 0.13 p/m2 | 0.1 p/m2 |
| medium density | 0.20~0.45 p/m2 | 0.32 p/m2 | 0.3 p/m2 |
| high density | 0.29~0.55 p/m2 | 0.48 p/m2 | 0.5 p/m2 |
| Male (Age: 18~60) | 383 | 398 | 405 | 431 | 460 | 469 | 486 |
| Female (Age: 18~55) | 347 | 363 | 371 | 397 | 428 | 438 | 458 |
| Percentile | 1 | 5 | 10 | 50 | 90 | 95 | 99 |
| Test ID | Index-Level | Simulation Test Model ID | Evacuate Time (85%) (s) | ||||||
|---|---|---|---|---|---|---|---|---|---|
| Index A | Index B | Index C | Index D | Index E | Strip CRD | Mesh CRD | Strip CRD | Mesh CRD | |
| 1 | 1 | 1 | 2 | 2 | 1 | P1M21Bb2 | P1M21Ab2 | 535 | 580 |
| 2 | 1 | 2 | 3 | 3 | 1 | P1M22Bc3 | P1M22Ac3 | 365 | 400 |
| 3 | 1 | 3 | 1 | 2 | 1 | P1M23Ba2 | P1M23Aa2 | 410 | 585 |
| 4 | 2 | 1 | 2 | 3 | 1 | P2M21Bb3 | P2M21Ab3 | 460 | 560 |
| 5 | 2 | 2 | 3 | 1 | 1 | P2M22Bc1 | P2M22Ac1 | 305 | 385 |
| 6 | 2 | 3 | 1 | 3 | 1 | P2M23Ba3 | P2M23Aa3 | 435 | 555 |
| 7 | 3 | 1 | 2 | 1 | 1 | P3M21Bb1 | P3M21Ab1 | 340 | 465 |
| 8 | 3 | 2 | 3 | 2 | 1 | P3M22Bc2 | P3M22Ac2 | 285 | 370 |
| 9 | 3 | 3 | 1 | 3 | 1 | P3M23Ba3 | P3M23Aa3 | 410 | 555 |
| 10 | 1 | 1 | 3 | 3 | 2 | M11M21Bc3 | M11M21Ac3 | 530 | 685 |
| 11 | 1 | 2 | 1 | 1 | 2 | M11M22Ba1 | M11M22Aa1 | 590 | 720 |
| 12 | 1 | 3 | 2 | 2 | 2 | M11M23Bb2 | M11M23Ab2 | 510 | 615 |
| 13 | 2 | 1 | 2 | 3 | 2 | M12M21Bb3 | M12M21Ab3 | 580 | 720 |
| 14 | 2 | 2 | 3 | 1 | 2 | M12M22Bc1 | M12M22Ac1 | 395 | 535 |
| 15 | 2 | 3 | 1 | 2 | 2 | M12M23Ba2 | M12M23Aa2 | 465 | 620 |
| 16 | 3 | 1 | 3 | 2 | 2 | M13M21Bc2 | M13M21Ac2 | 460 | 580 |
| 17 | 3 | 2 | 1 | 3 | 2 | M13M22Ba3 | M13M22Aa3 | 445 | 610 |
| 18 | 3 | 3 | 2 | 1 | 2 | M13M23Bb1 | M13M23Ab1 | 380 | 515 |
| Mesh CRD (R2 = 0.900) | Strip CRD (R2 = 0.943) | |||||
|---|---|---|---|---|---|---|
| F | p | Significance | F | p | Significance | |
| Index A | 8.792 | 0.010 ** | √ | 7.488 | 0.015 * | √ |
| Index B | 5.352 | 0.033 * | √ | 9.86 | 0.007 ** | √ |
| Index C | 6.325 | 0.023 * | √ | 15.22 | 0.002 ** | √ |
| Index D | 0.814 | 0.477 | × | 0.581 | 0.581 | × |
| Index E | 23.71 | 0.001 ** | √ | 56.933 | 0.000 ** | √ |
| Strip CRD | Mesh CRD | |||||||
|---|---|---|---|---|---|---|---|---|
| Index A | Index B | Index C | Index E | Index A | Index B | Index C | Index E | |
| K1 | 2940 | 2905 | 2755 | 3545 | 3585 | 3590 | 3645 | 4455 |
| K2 | 2640 | 2385 | 2805 | 4355 | 3375 | 3020 | 3455 | 5600 |
| K3 | 2320 | 2610 | 2340 | - | 3095 | 3445 | 2955 | - |
| k1 | 490.00 | 484.17 | 459.17 | 393.89 | 597.50 | 598.33 | 607.50 | 495.00 |
| k2 | 440.00 | 397.50 | 467.50 | 483.89 | 562.50 | 503.33 | 575.83 | 622.22 |
| k3 | 386.67 | 435.00 | 390.00 | - | 515.83 | 574.17 | 492.50 | - |
| R | 103.33 | 86.67 | 77.50 | 90.00 | 81.67 | 95.00 | 115.00 | 127.22 |
| CRD Type | Rank | Test ID | Evacuate Time | Model ID | Index A | Index B | Index C | Index E |
|---|---|---|---|---|---|---|---|---|
| Strip CRD | 1 | 8 | 285 s | A3B2C3E1 | broad | medium | high | pedestrian |
| 2 | 5 | 305 s | A2B2C3E1 | medium | medium | high | pedestrian | |
| 3 | 7 | 340 s | A3B1C2E1 | broad | medium | medium | pedestrian | |
| Mesh CRD | 1 | 8 | 370 s | A3B2C3E1 | broad | medium | high | pedestrian |
| 2 | 5 | 385 s | A2B2C3E1 | medium | medium | high | pedestrian | |
| 3 | 2 | 400 s | A1B2C3E1 | broad | medium | high | pedestrian |
| CRD Type | Strip CRD | Mesh CRD | ||||
|---|---|---|---|---|---|---|
| Significance | Importance | Optimal Level | Significance | Importance | Optimal Level | |
| Primary road width | √ | very important | 30.1~40.0 m | √ | less important | 30.1~40.0 m |
| Secondary road width | √ | medium | 3.1~5.0 m/side | √ | medium | 3.1~5.0 m/side |
| Network density | √ | less important | 11.0~13.0 km/km2 | √ | important | 11.0~13.0 km/km2 |
| Network connectivity | × | / | / | × | / | / |
| Primary road type | √ | important | pedestrian-traffic | √ | very important | pedestrian-traffic |
Disclaimer/Publisher’s Note: The statements, opinions and data contained in all publications are solely those of the individual author(s) and contributor(s) and not of MDPI and/or the editor(s). MDPI and/or the editor(s) disclaim responsibility for any injury to people or property resulting from any ideas, methods, instructions or products referred to in the content. |
© 2023 by the authors. Licensee MDPI, Basel, Switzerland. This article is an open access article distributed under the terms and conditions of the Creative Commons Attribution (CC BY) license (https://creativecommons.org/licenses/by/4.0/).
Share and Cite
Yang, G.; Zhou, T.; Peng, M.; Wang, Z.; Wang, D. Synergy of Road Network Planning Indices on Central Retail District Pedestrian Evacuation Efficiency. ISPRS Int. J. Geo-Inf. 2023, 12, 239. https://doi.org/10.3390/ijgi12060239
Yang G, Zhou T, Peng M, Wang Z, Wang D. Synergy of Road Network Planning Indices on Central Retail District Pedestrian Evacuation Efficiency. ISPRS International Journal of Geo-Information. 2023; 12(6):239. https://doi.org/10.3390/ijgi12060239
Chicago/Turabian StyleYang, Gen, Tiejun Zhou, Mingxi Peng, Zhigang Wang, and Dachuan Wang. 2023. "Synergy of Road Network Planning Indices on Central Retail District Pedestrian Evacuation Efficiency" ISPRS International Journal of Geo-Information 12, no. 6: 239. https://doi.org/10.3390/ijgi12060239