


An Earth Observation Framework in Service of the Sendai Framework for Disaster Risk Reduction 2015–2030
 ,
,
Abstract
:1. Introduction
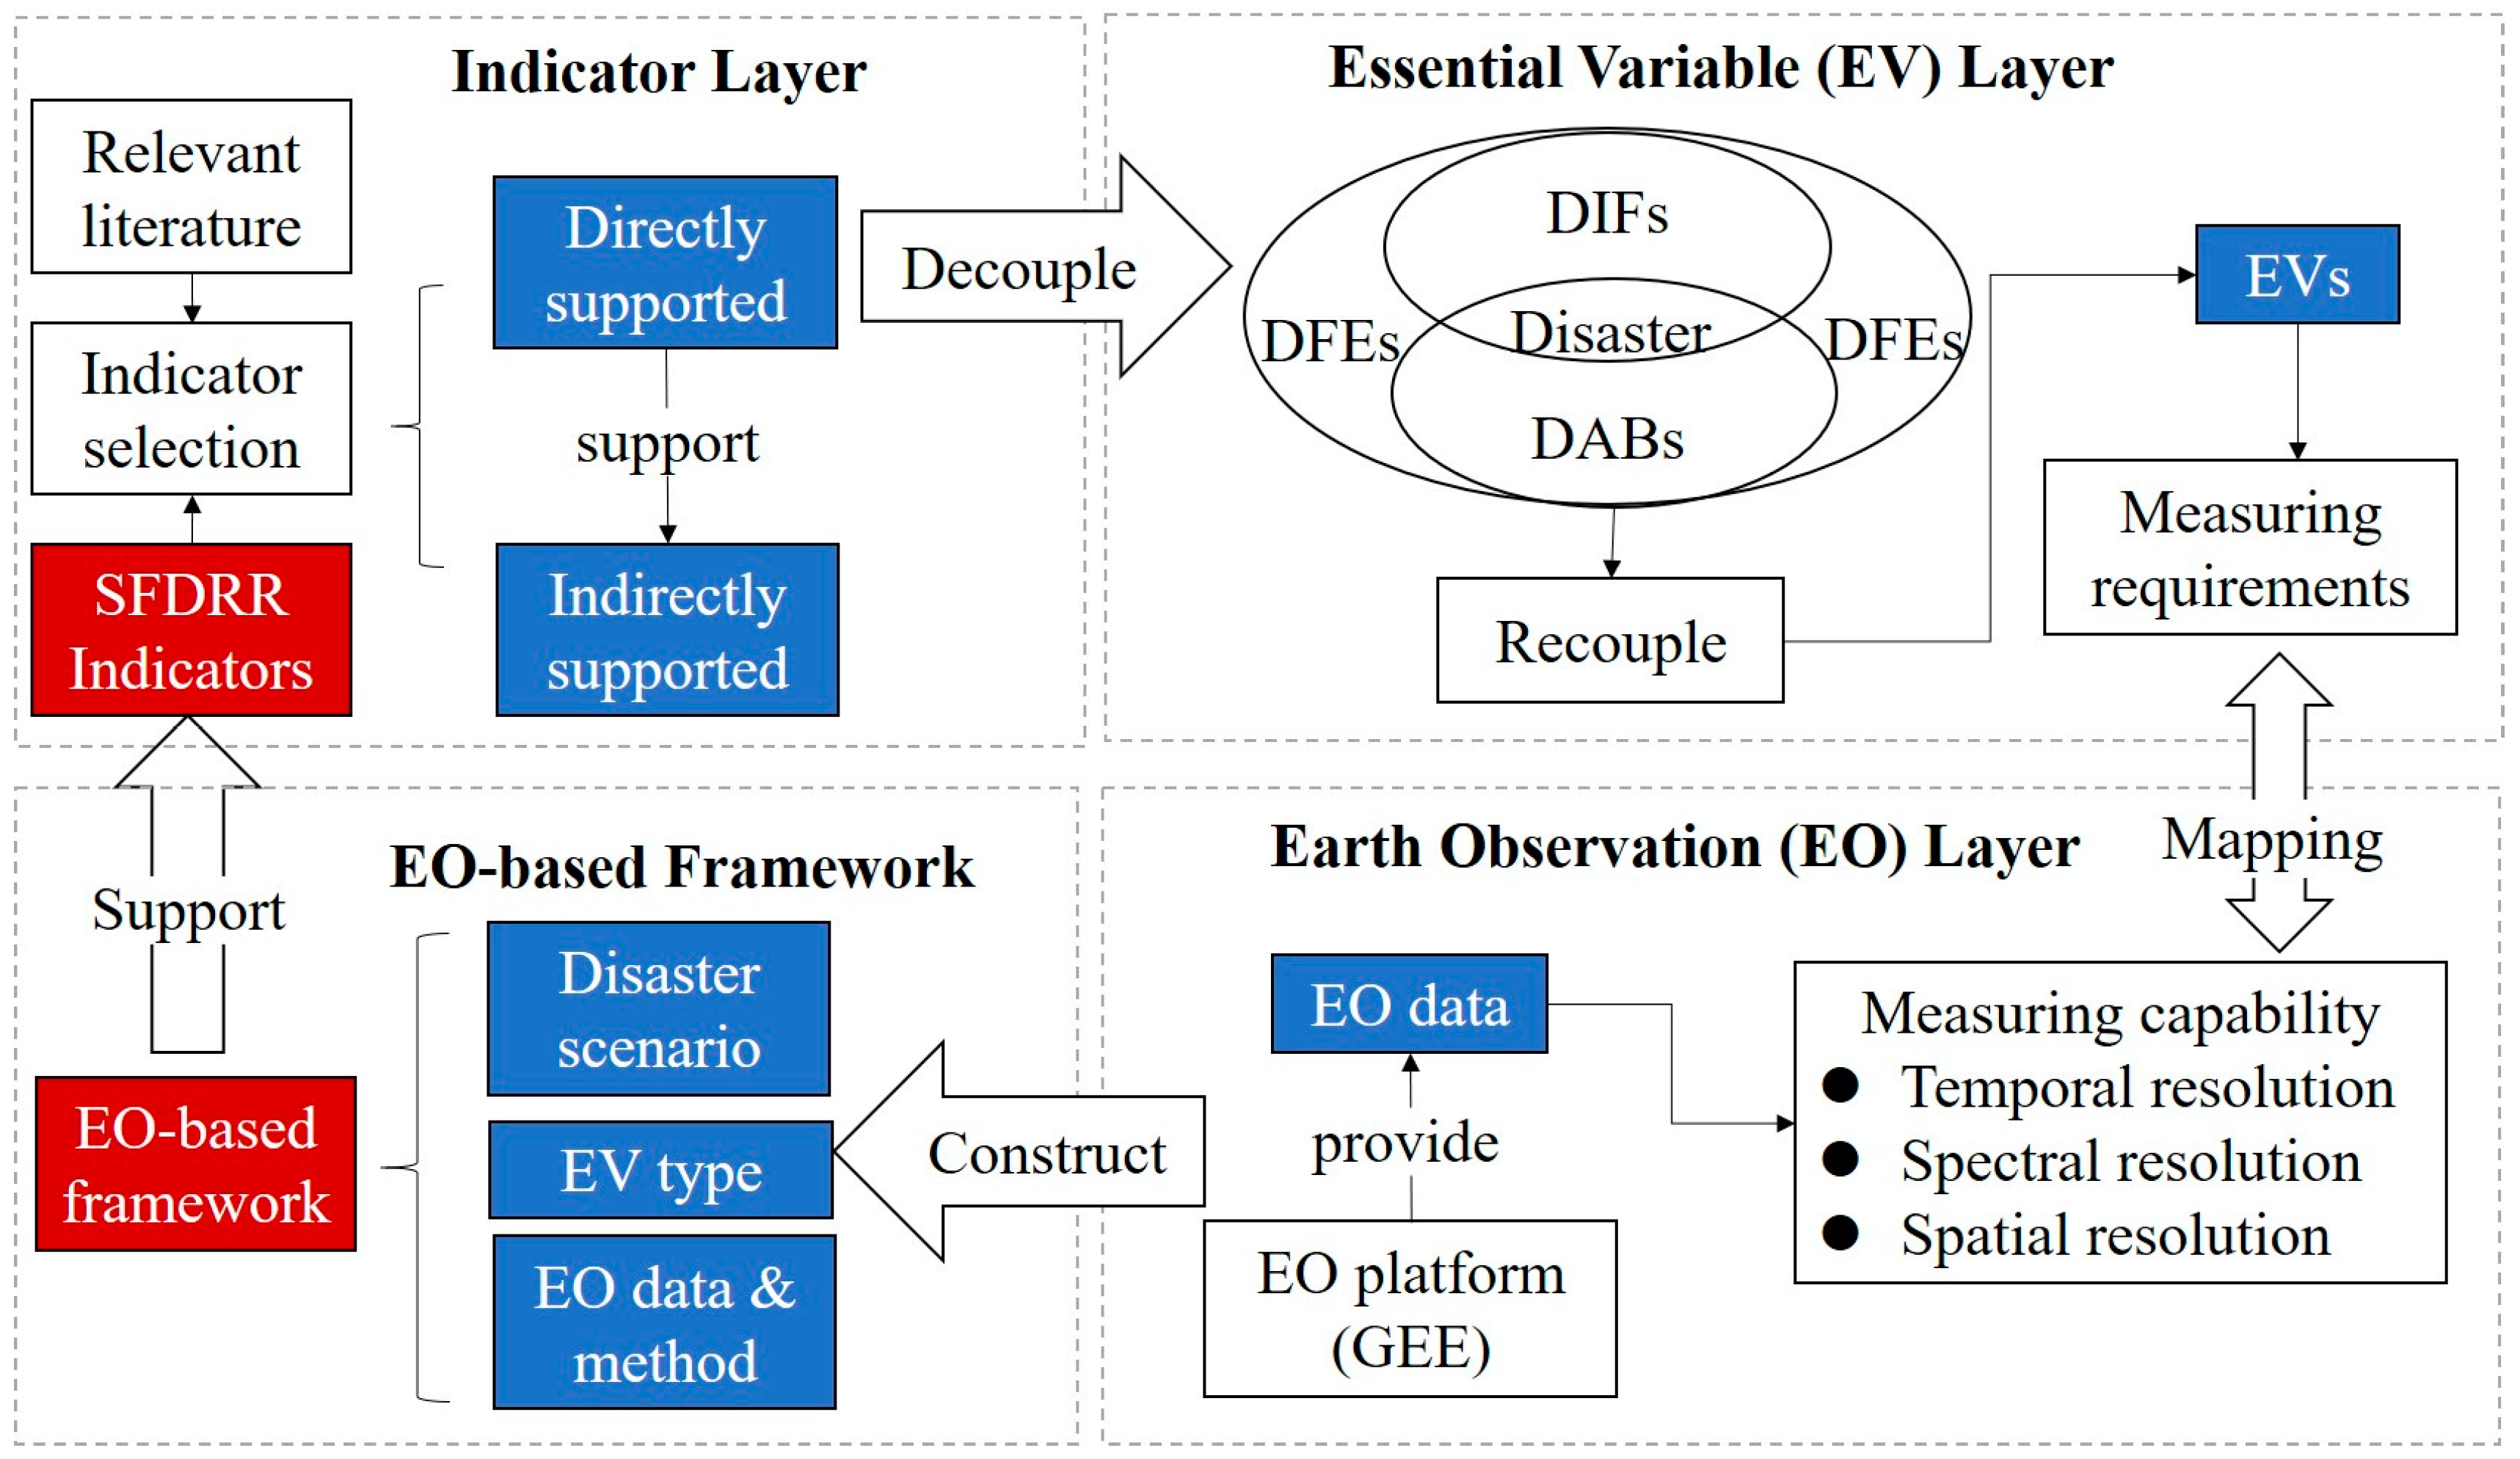
2. Methods
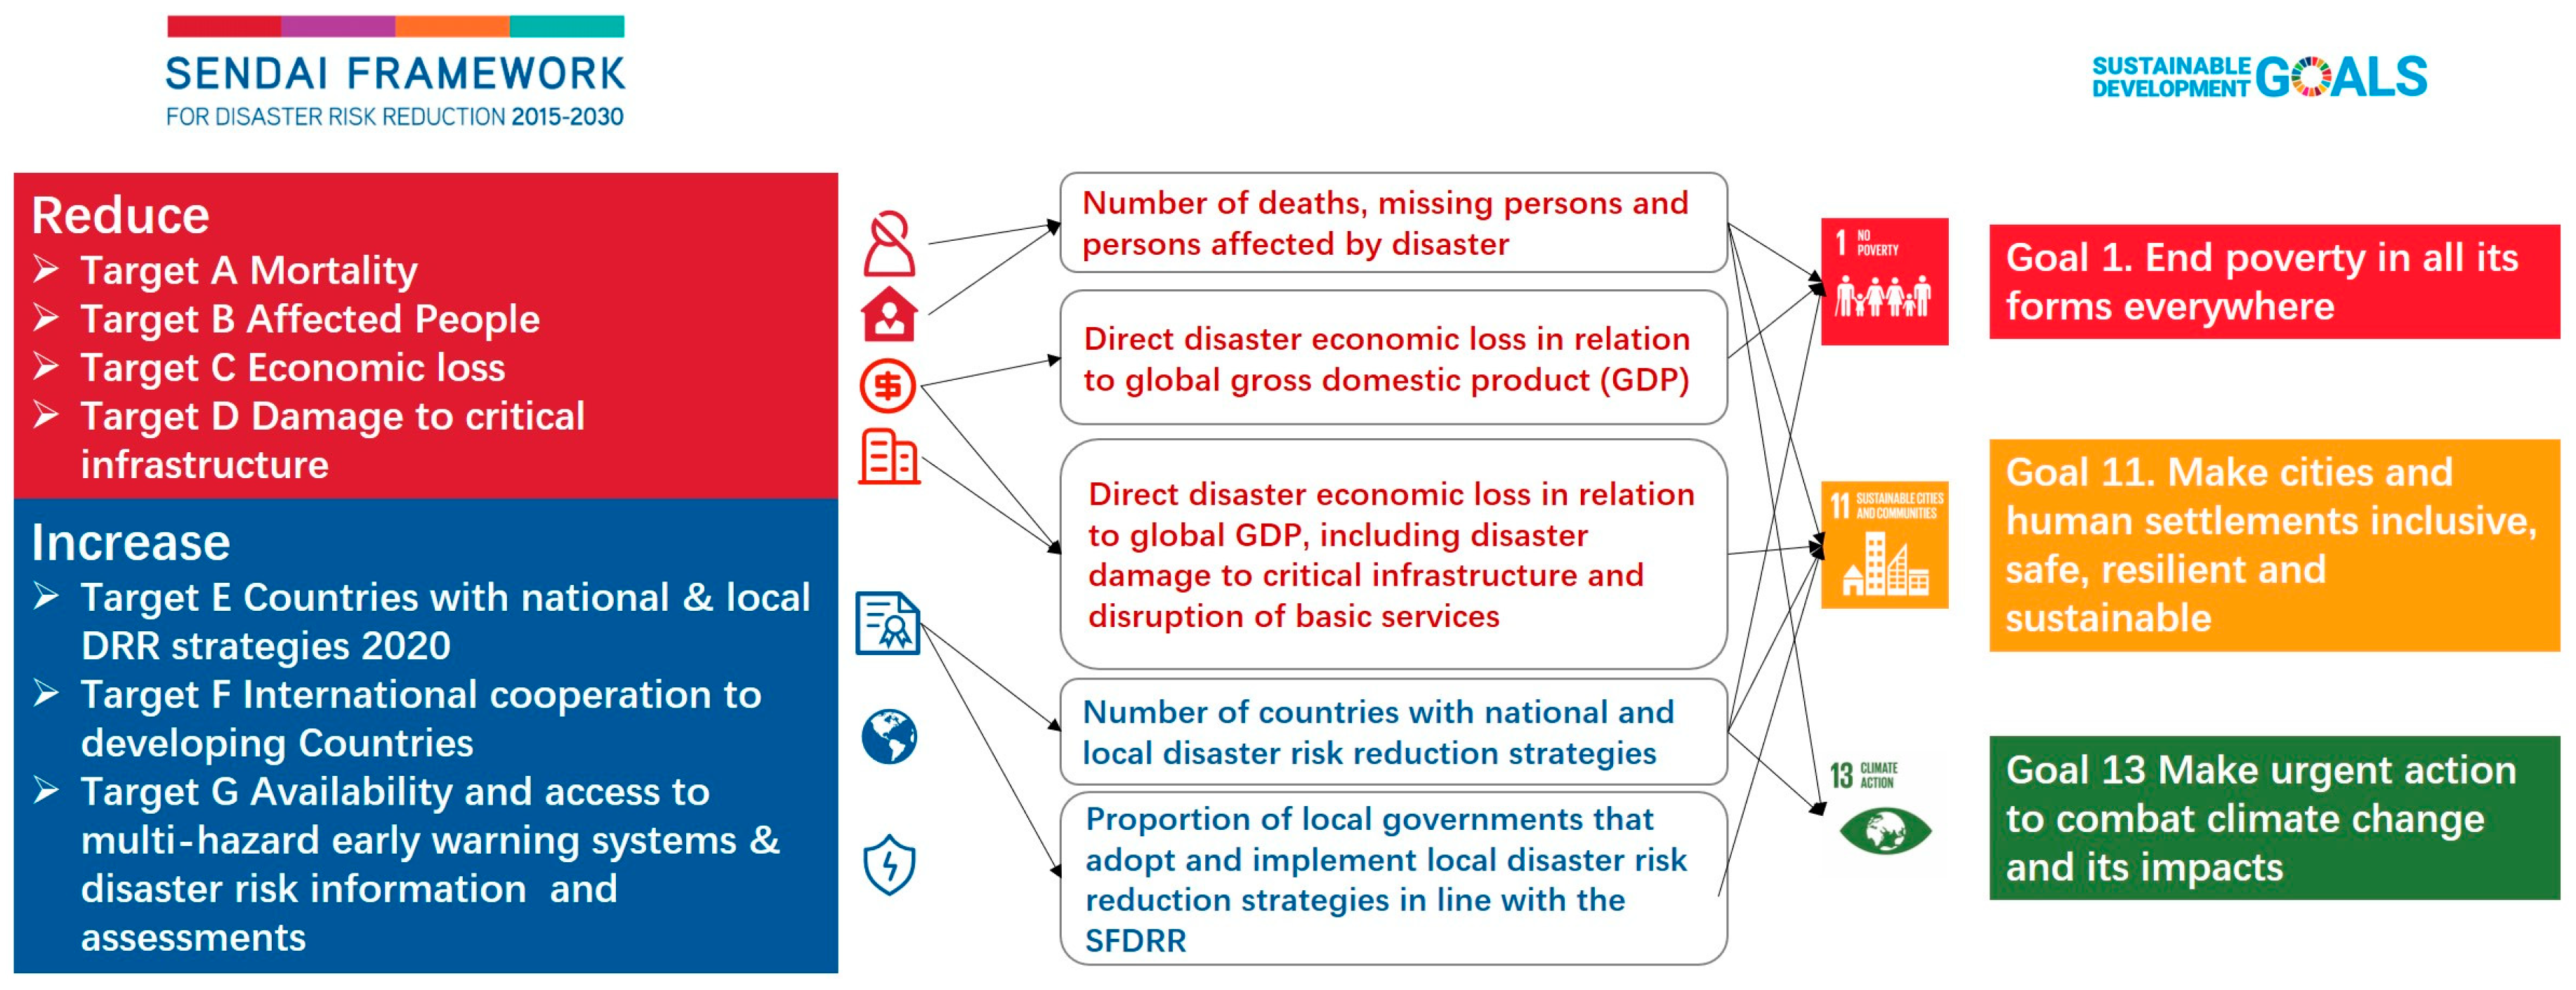
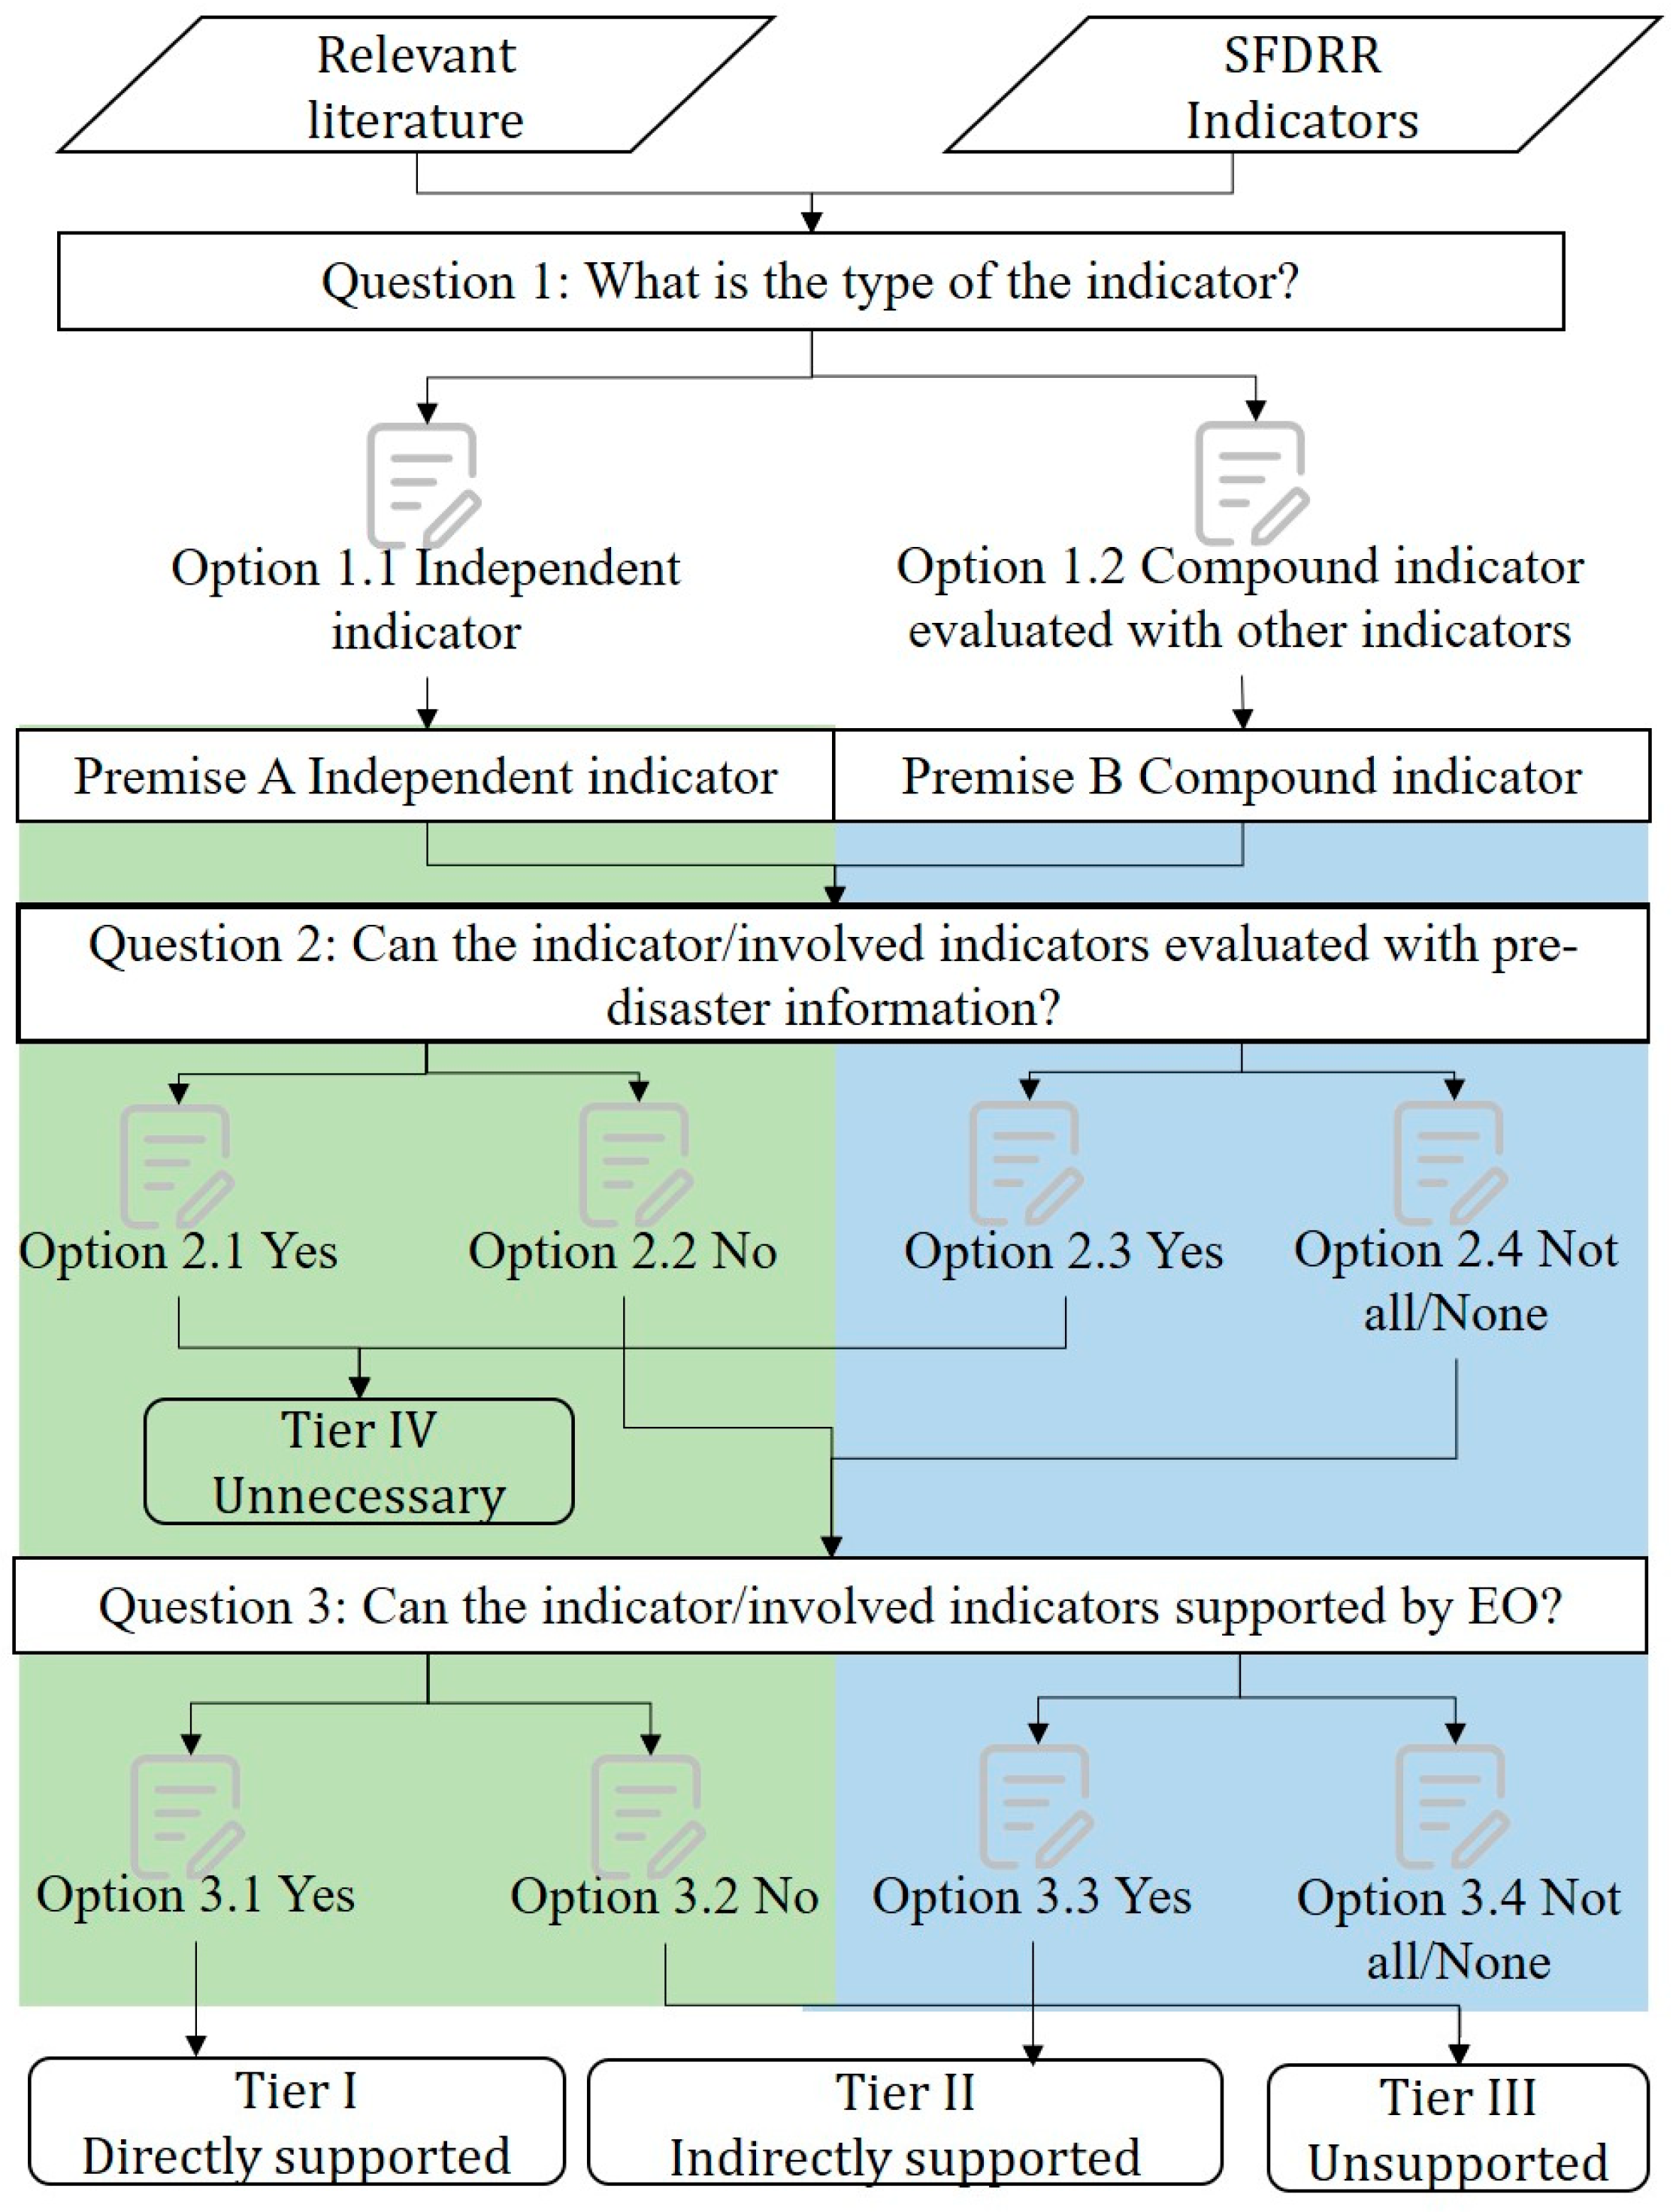
2.1. Indicator Layer: SFDRR Indicators Supported by EO
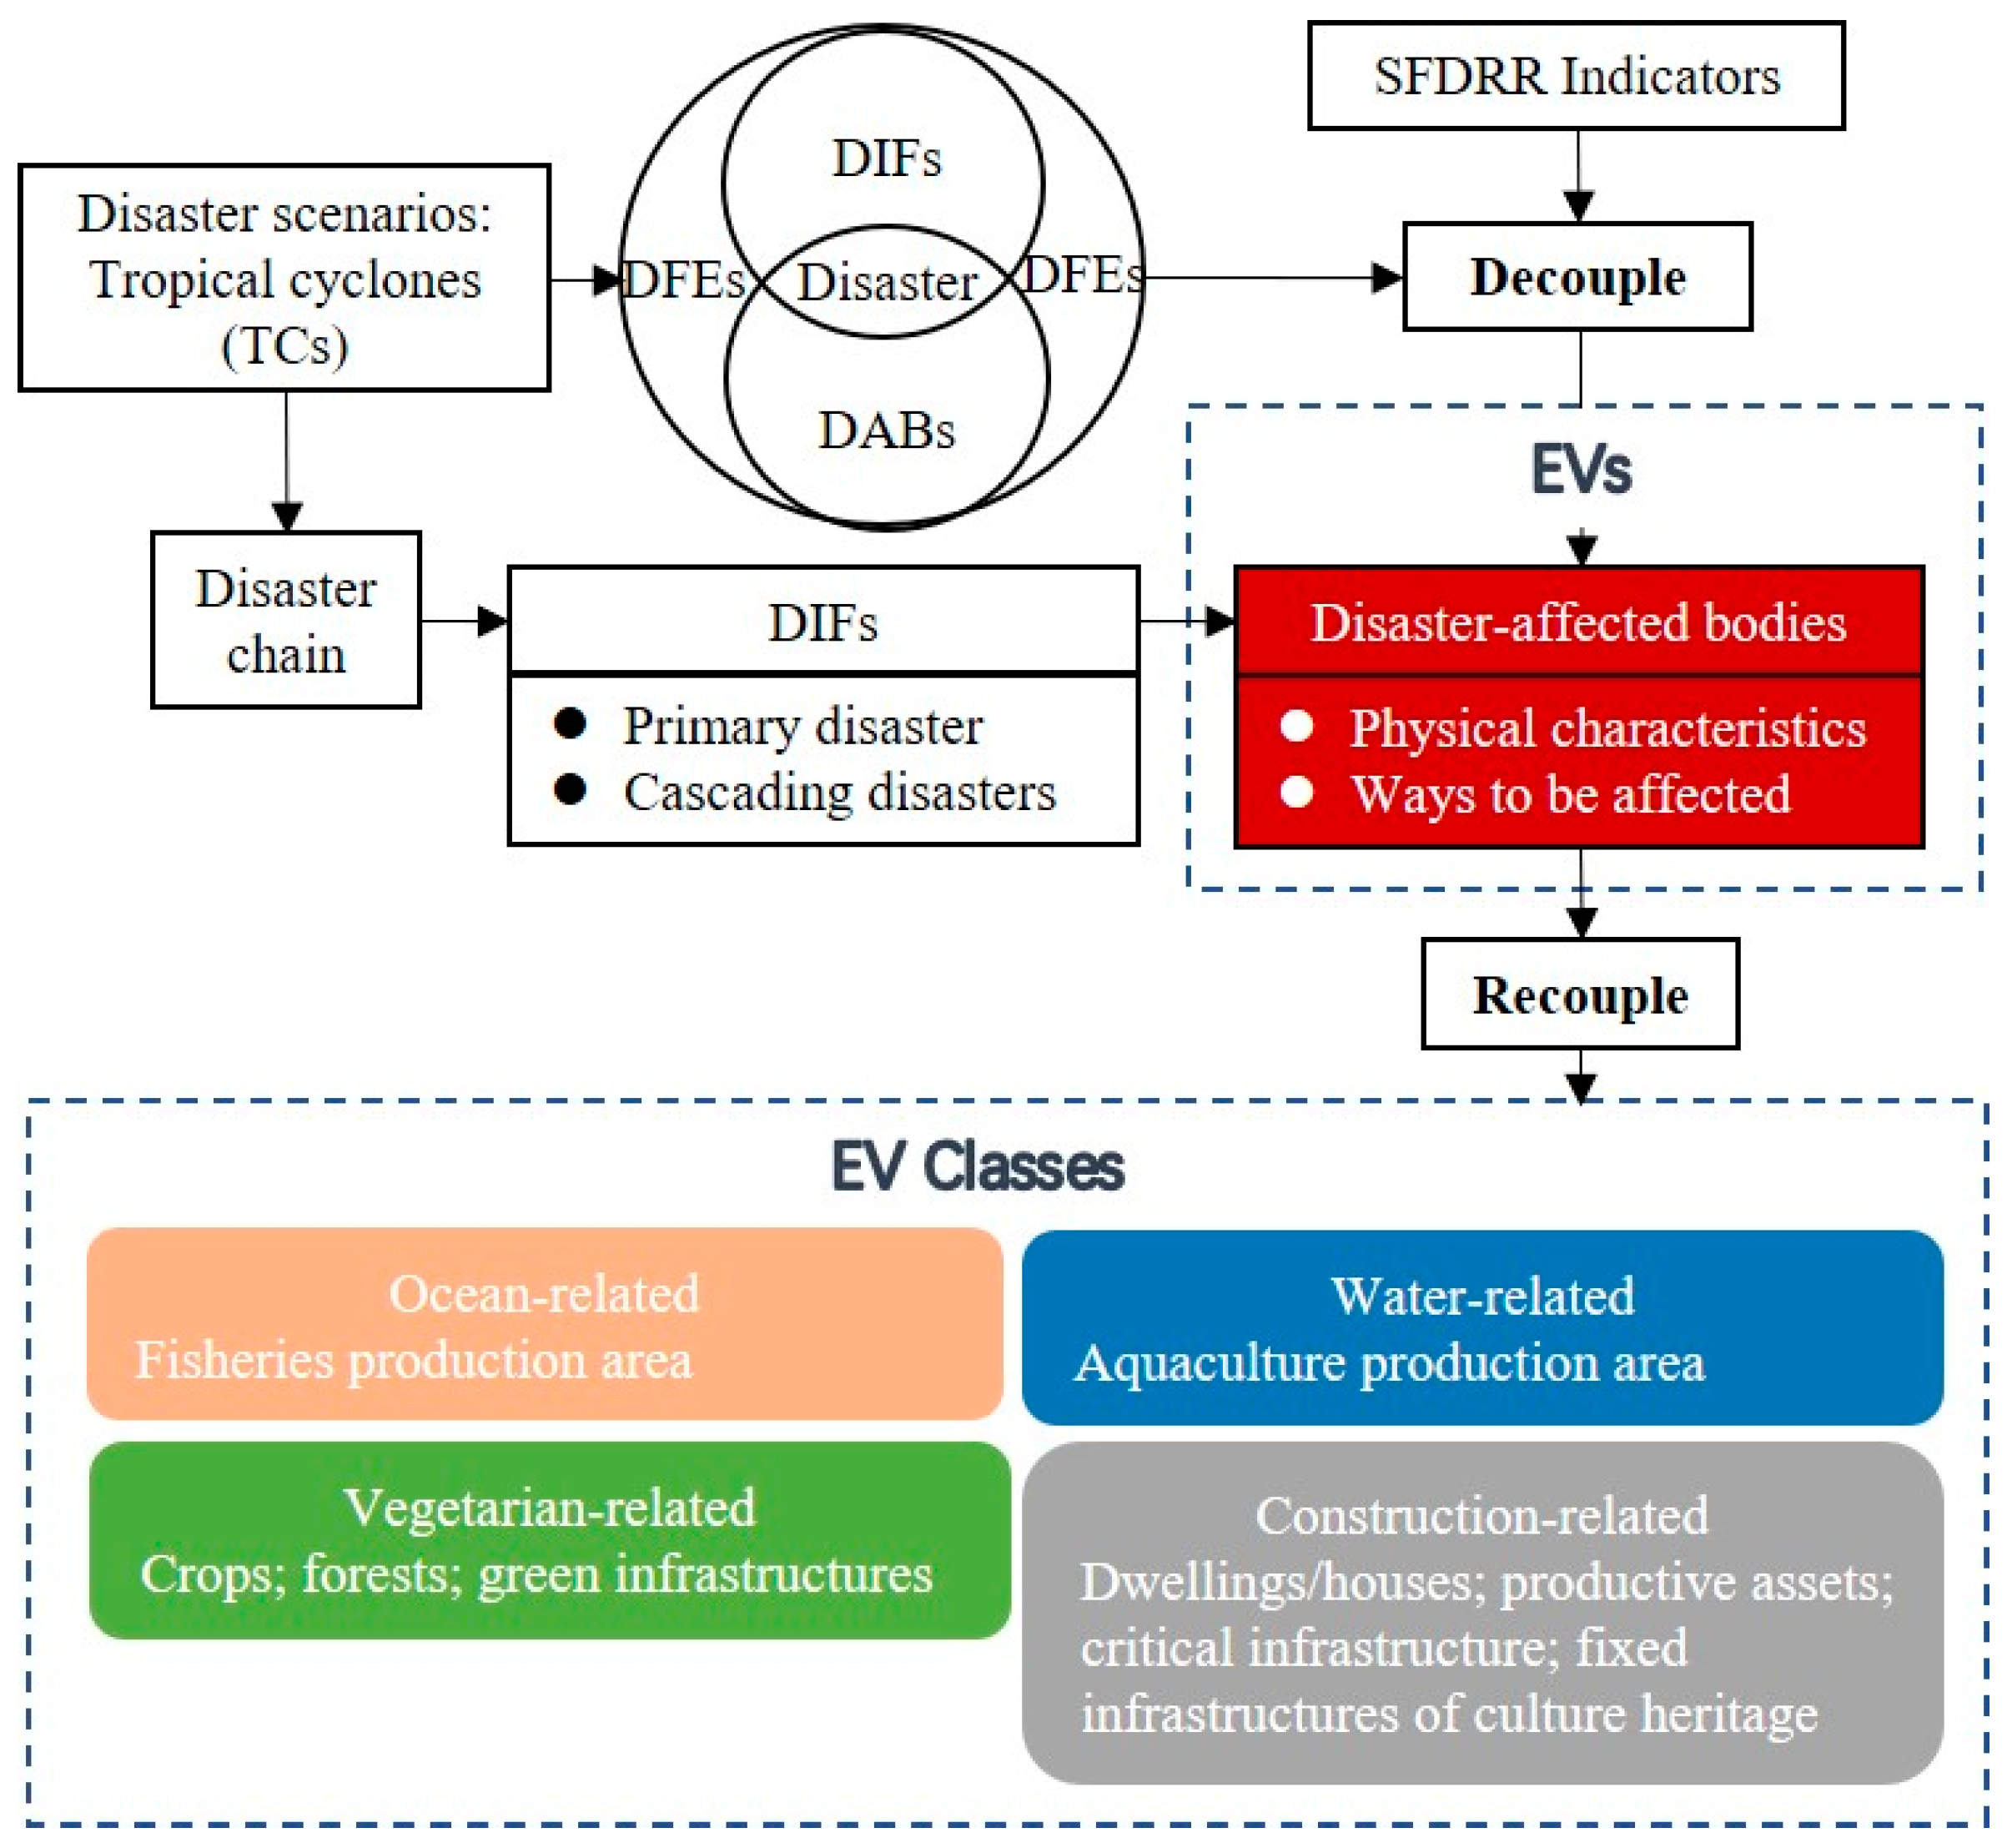
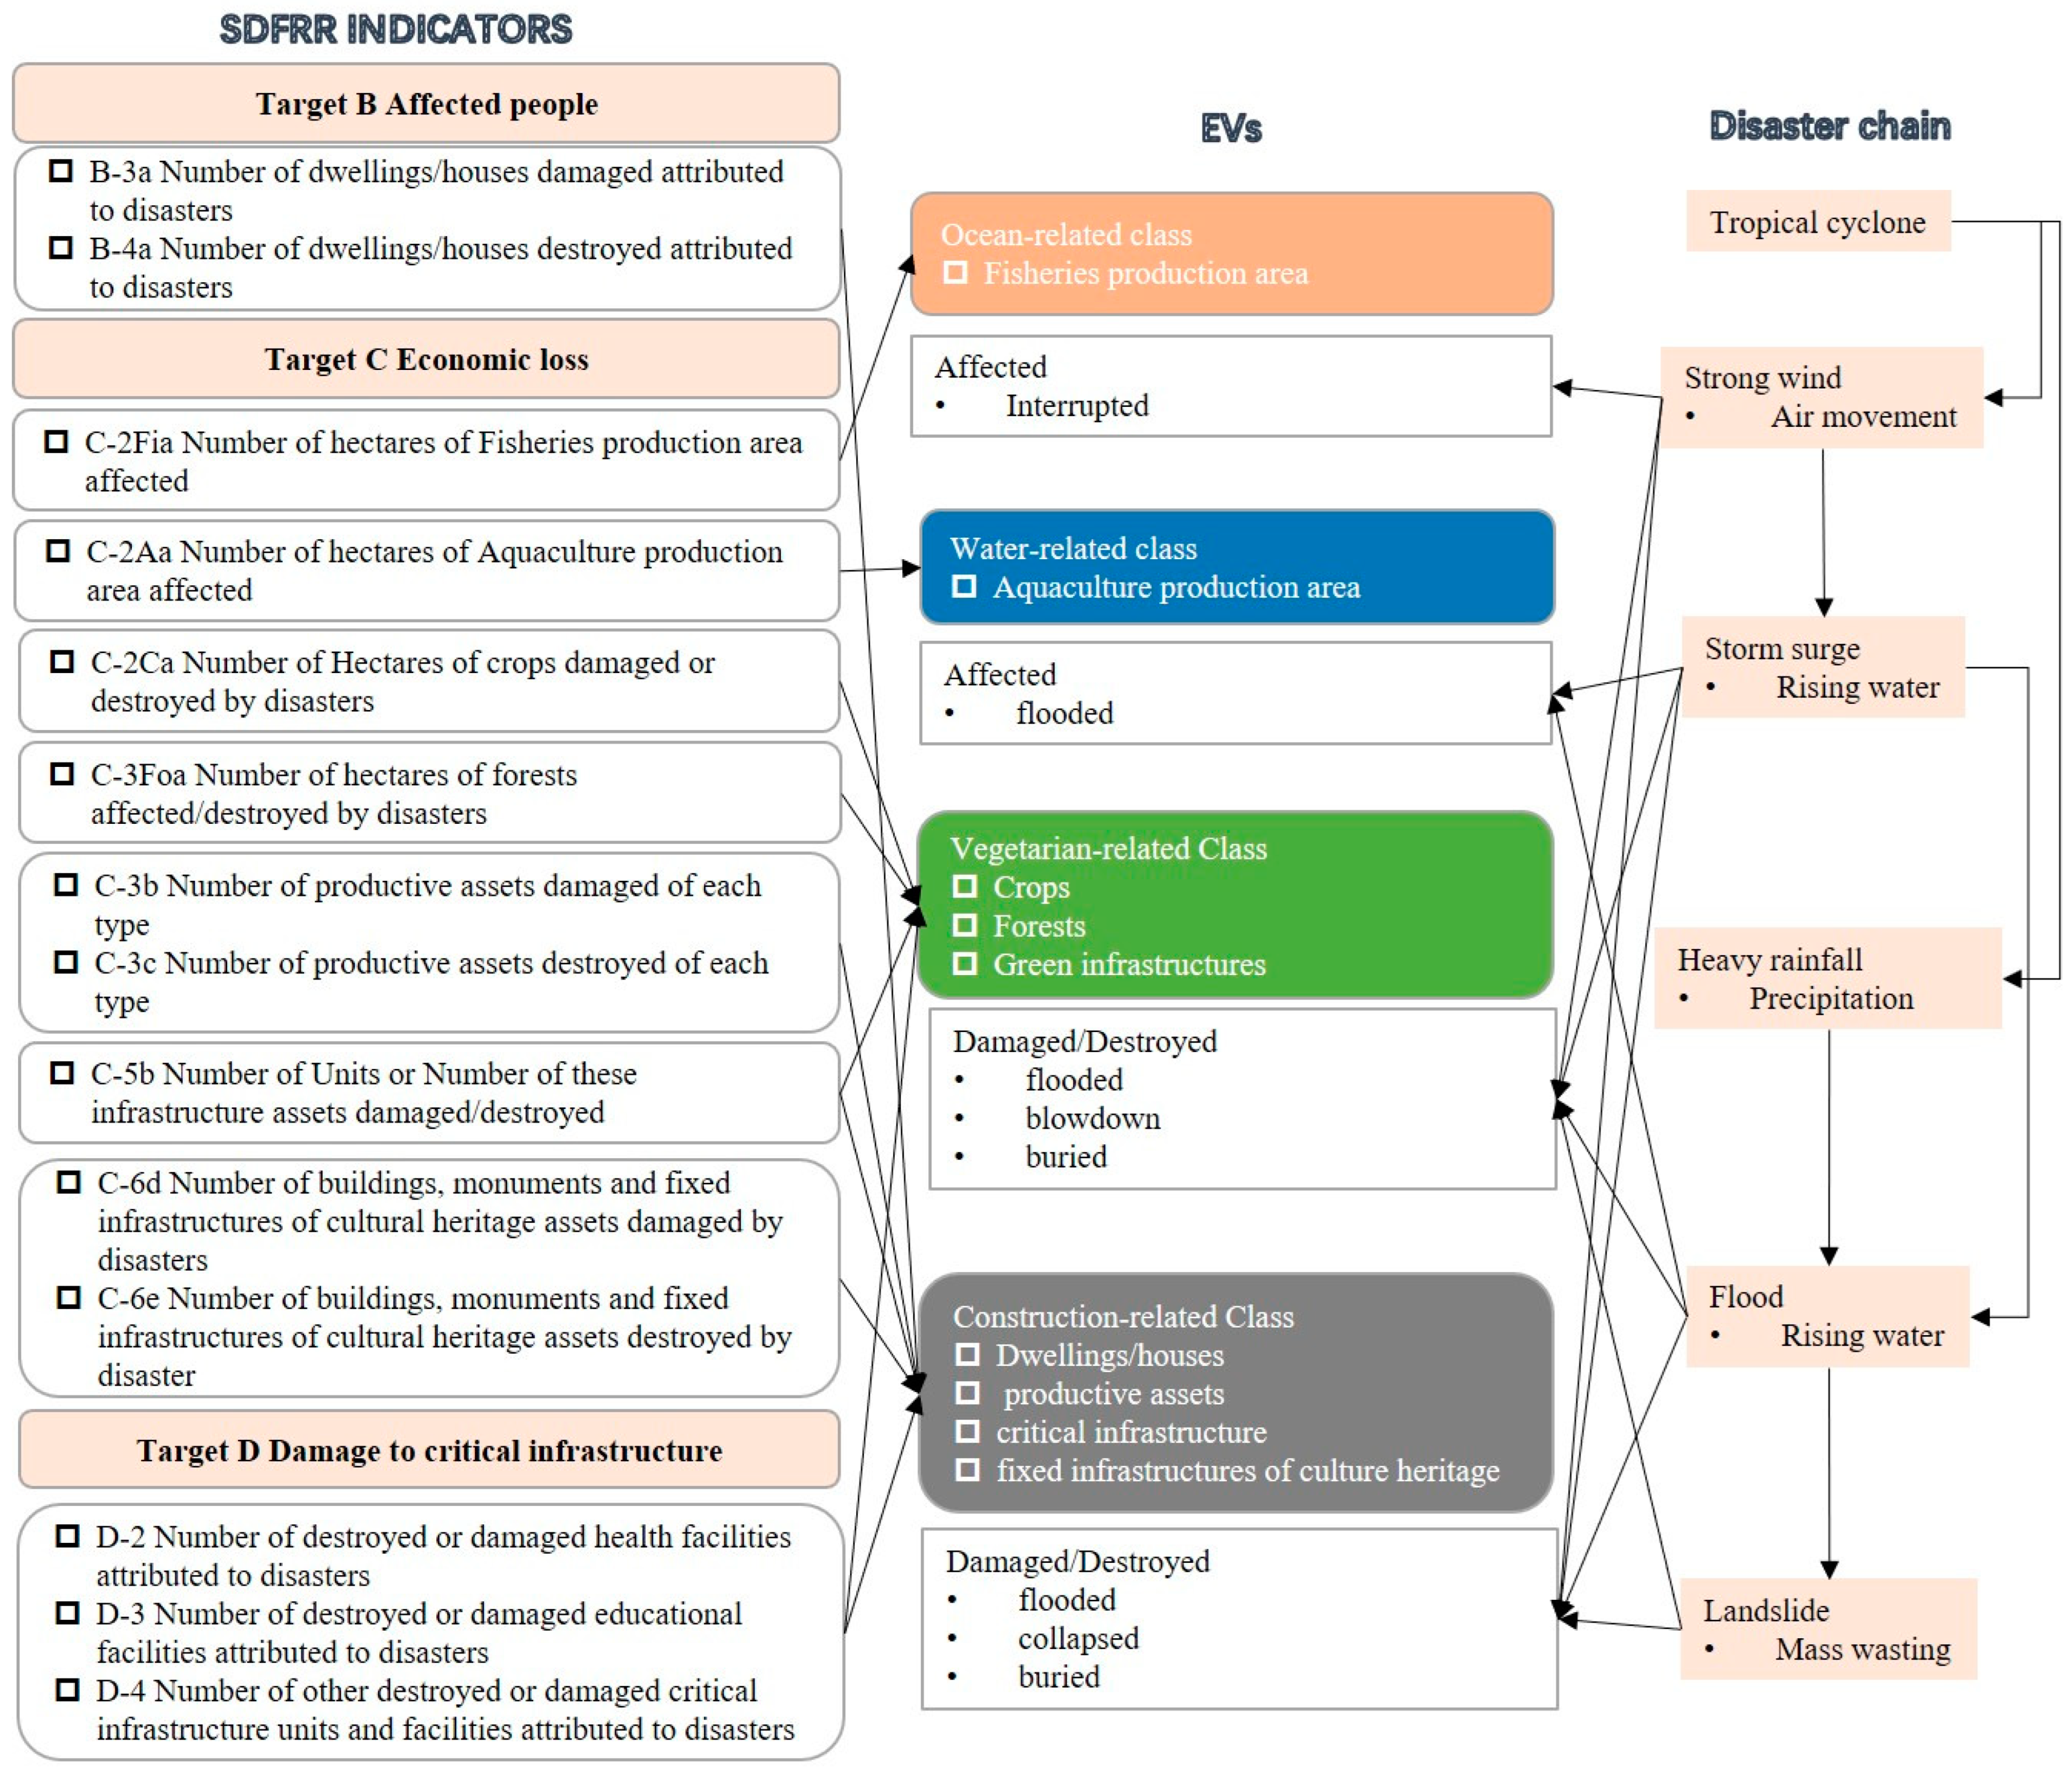
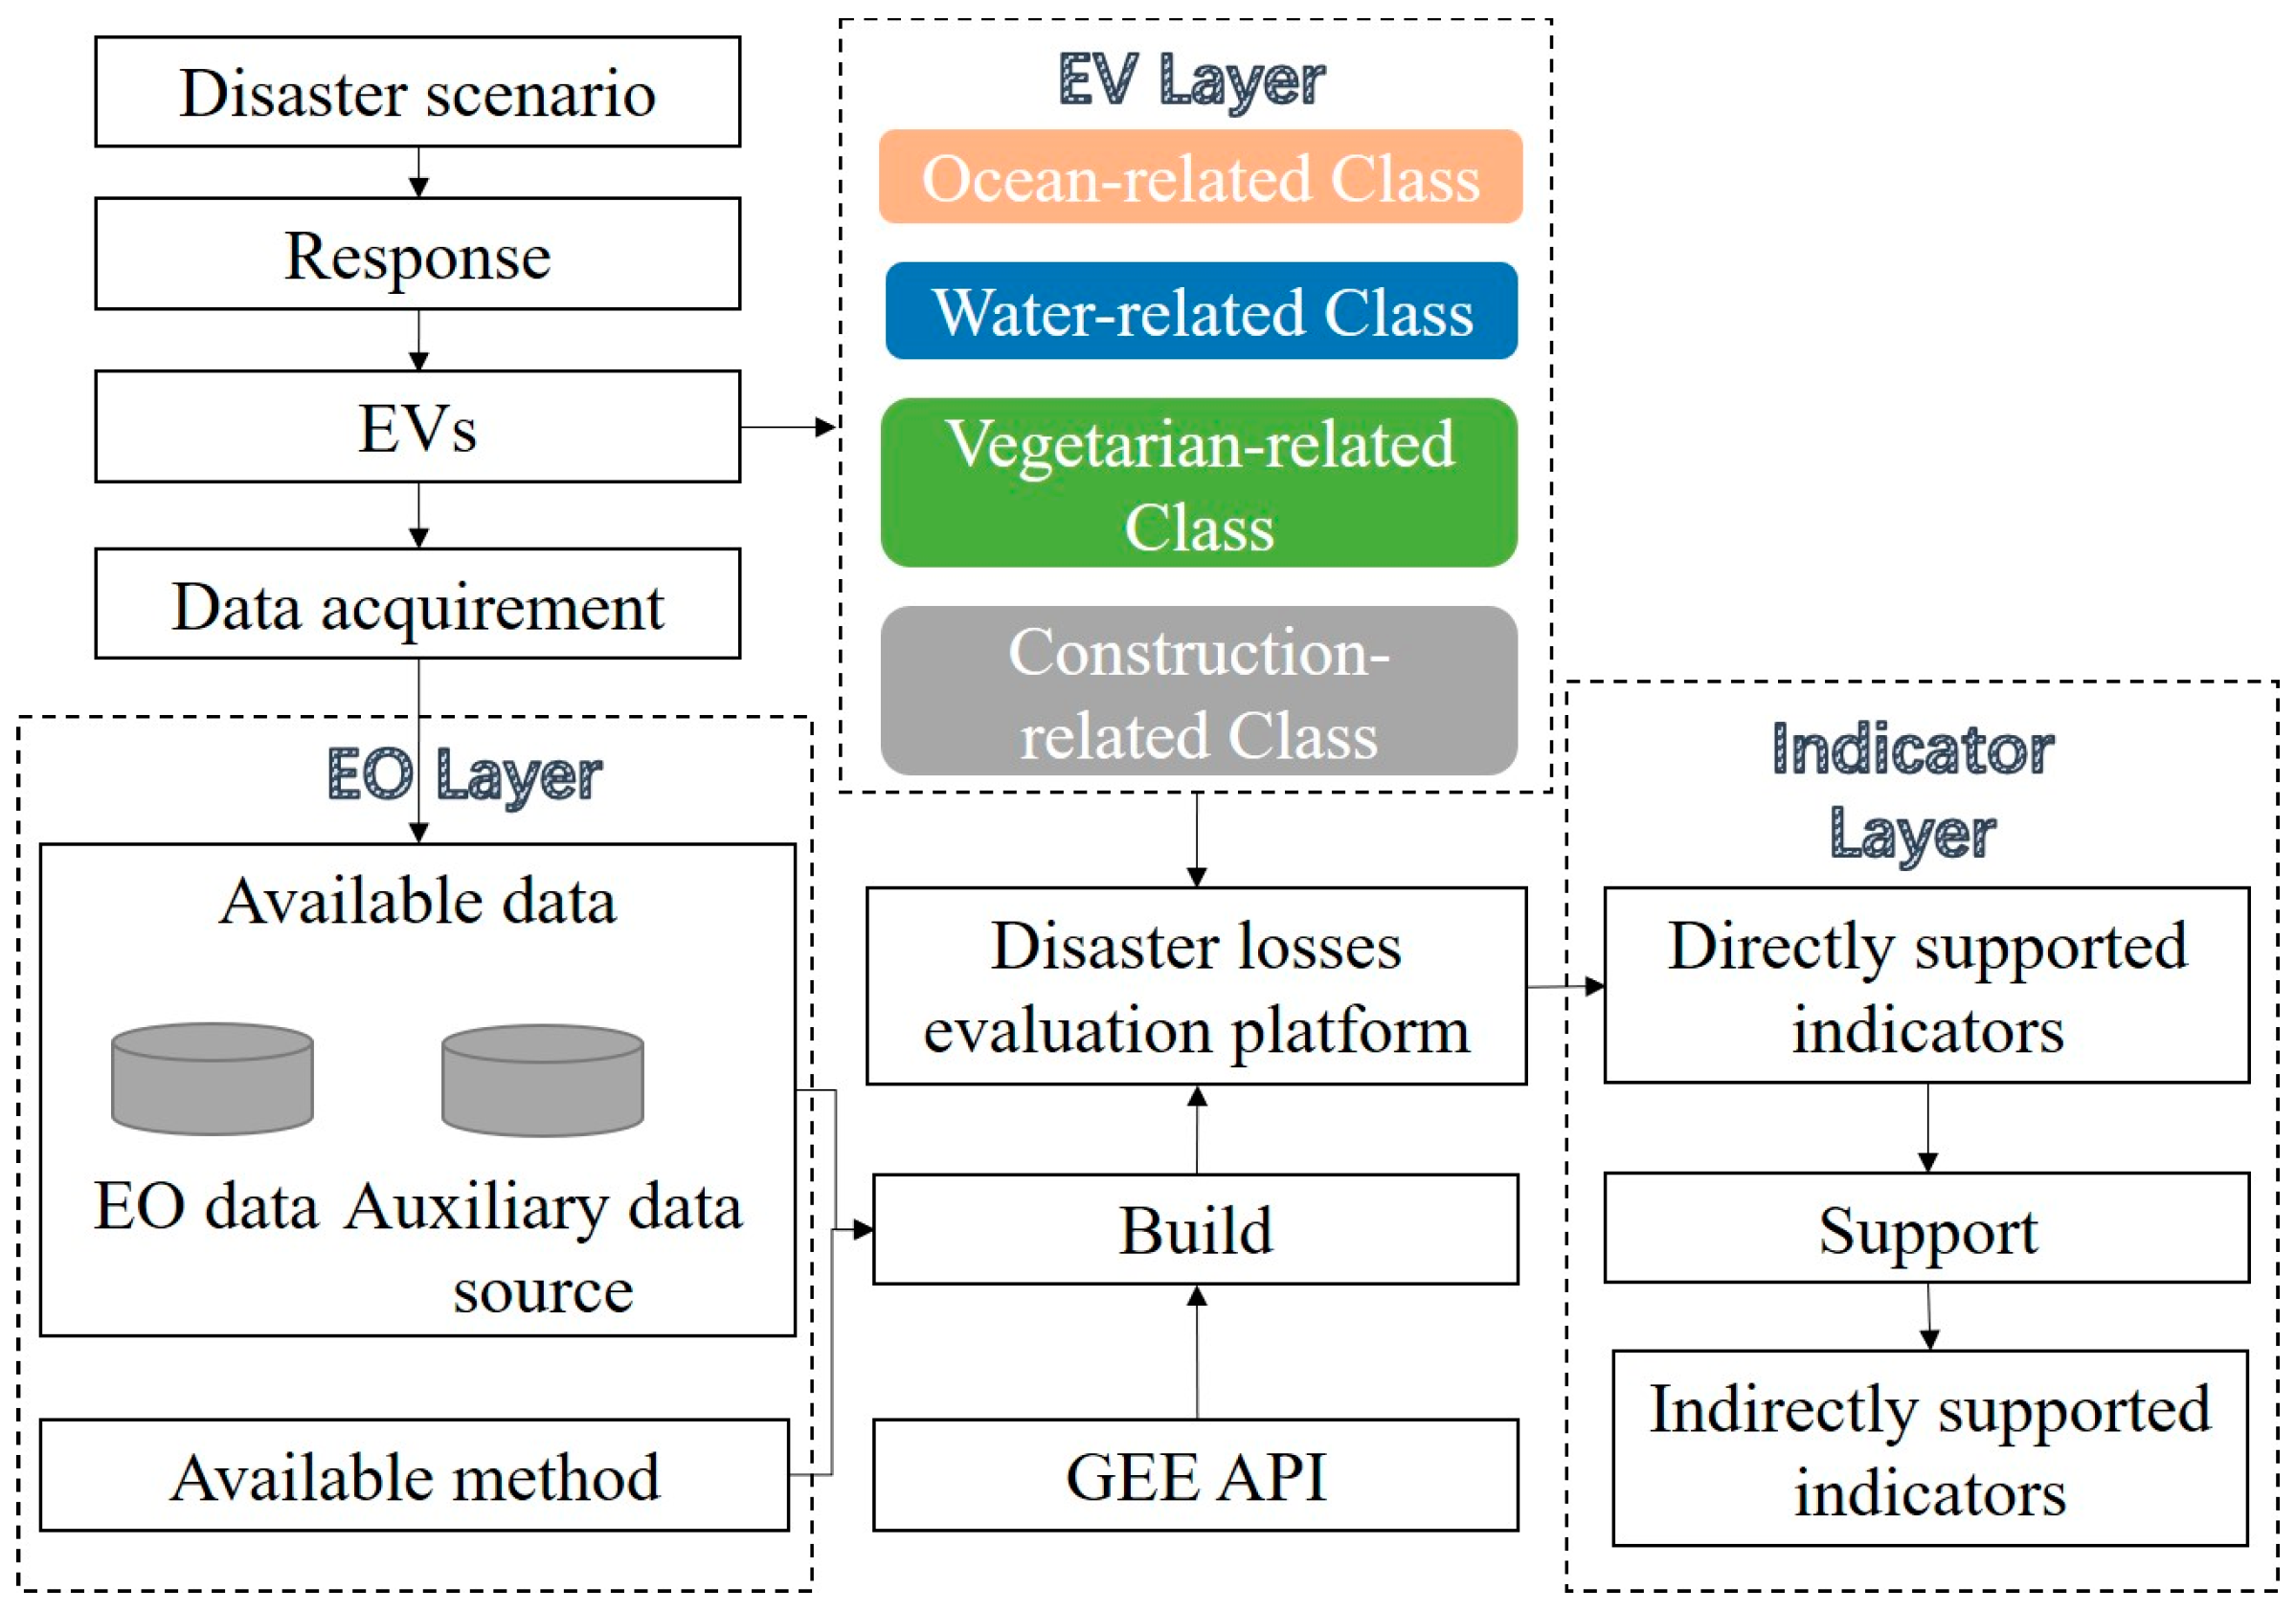
2.2. EV Layer: Decoupling and Recouping SFDRR Indicators
2.3. EO Layer: Mapping the Links between the Requirements of EVs and the Capabilities of EO
3. Results
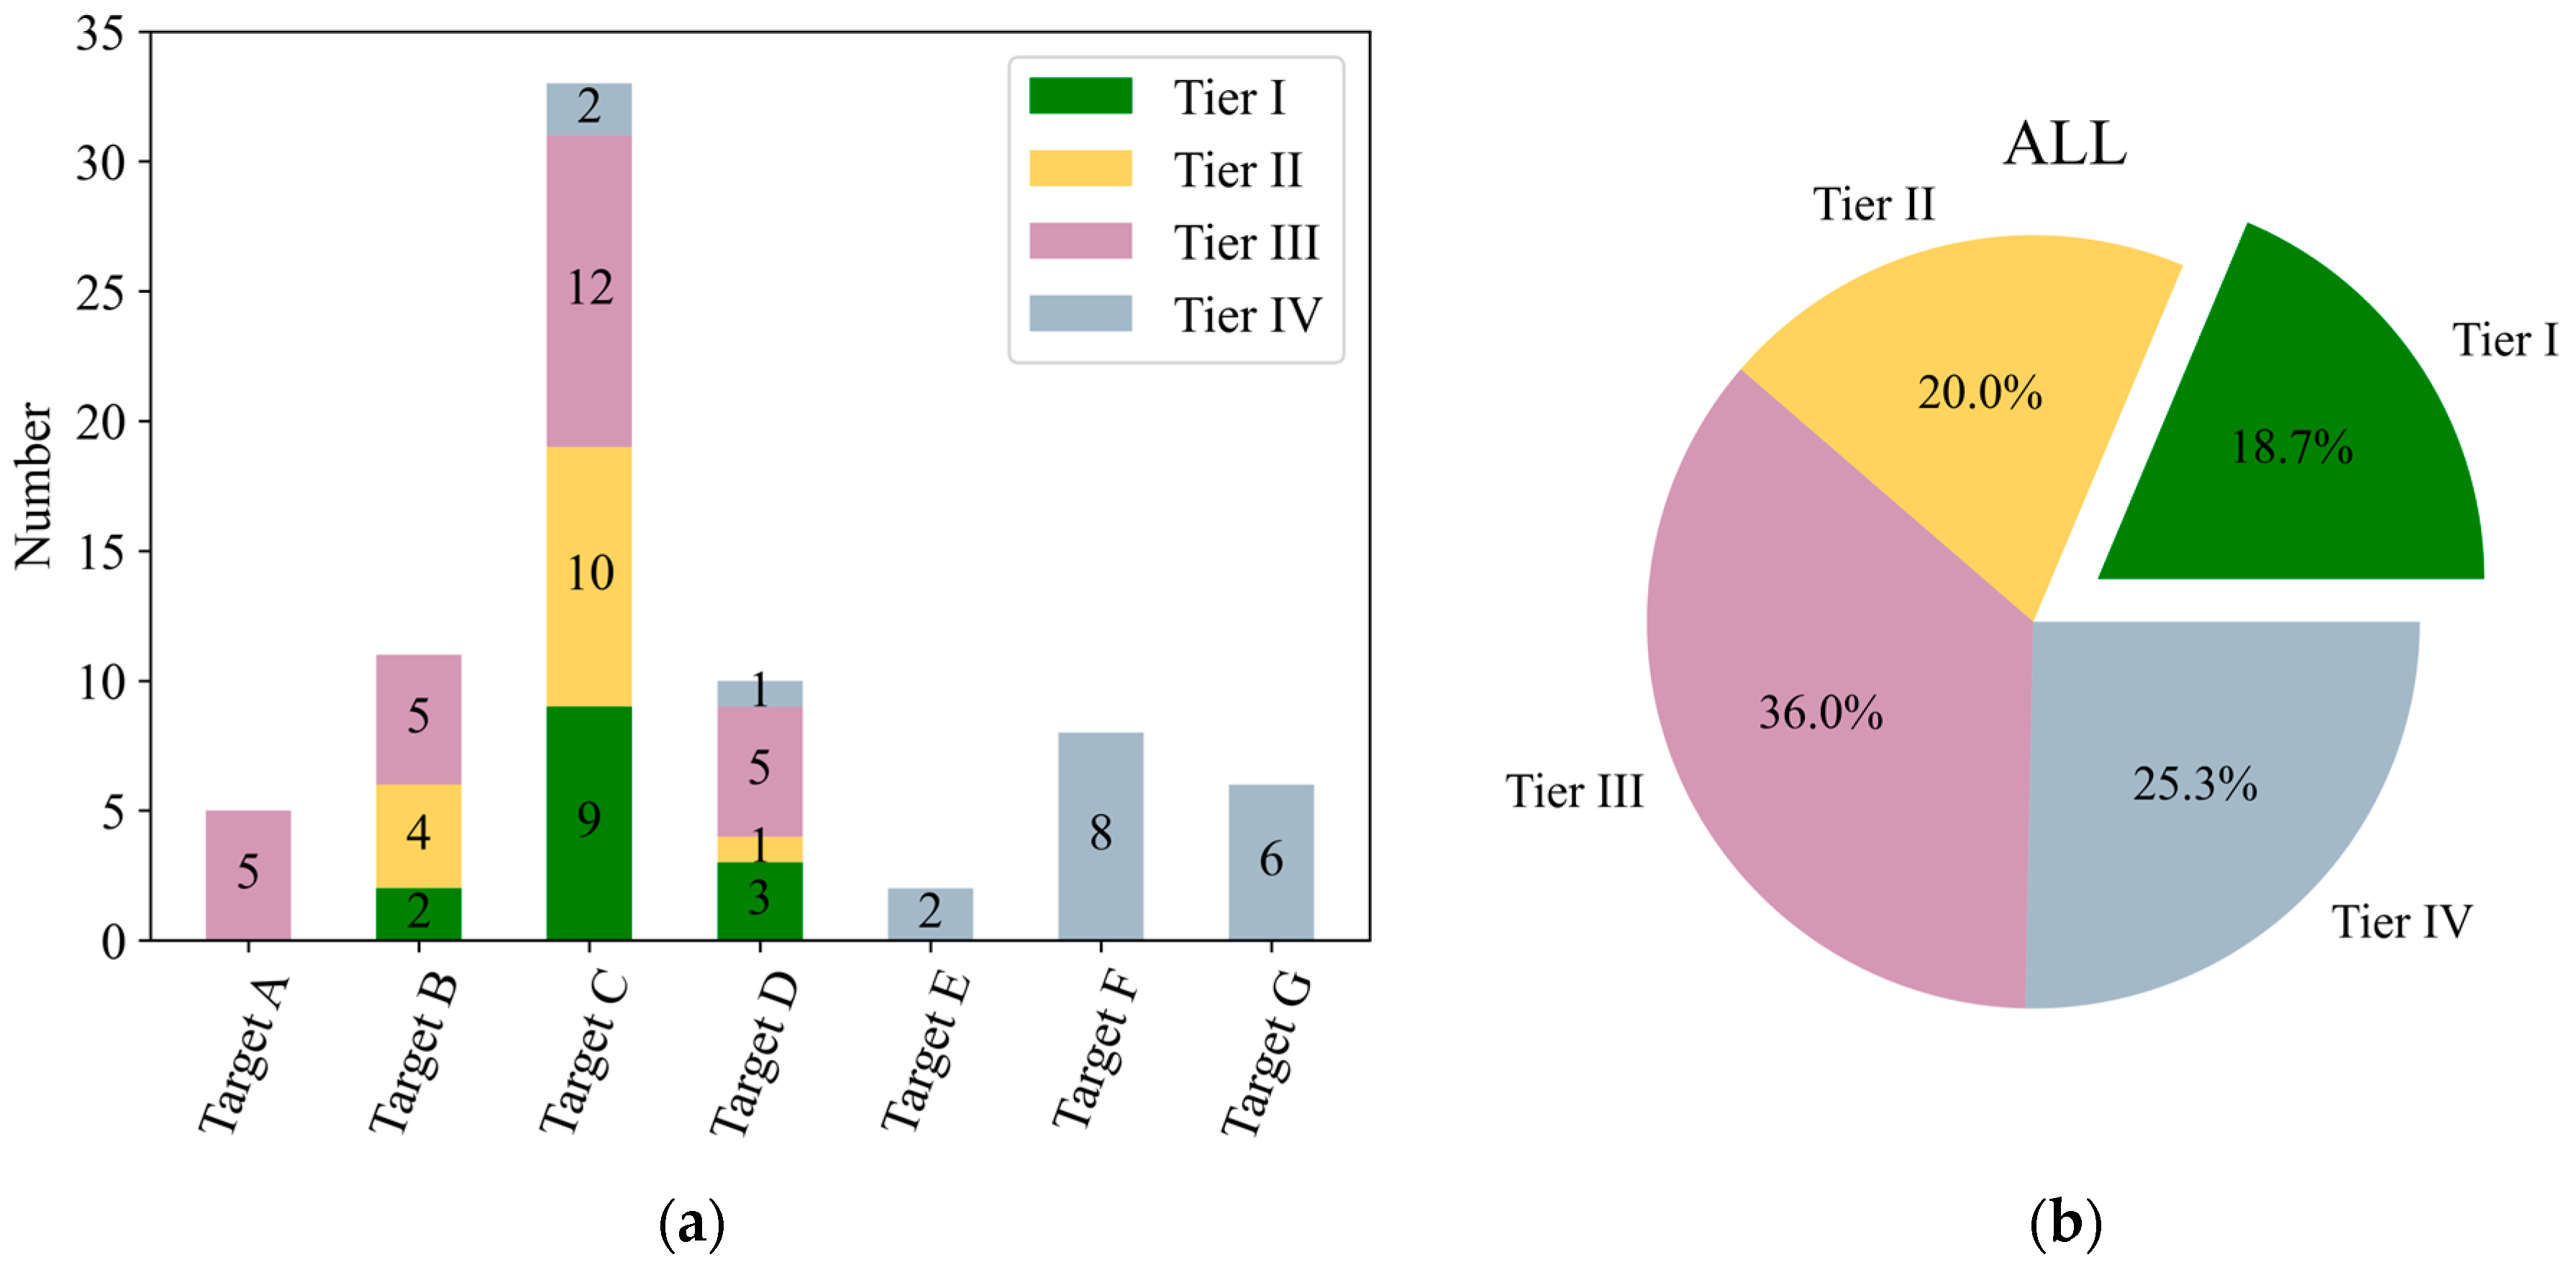
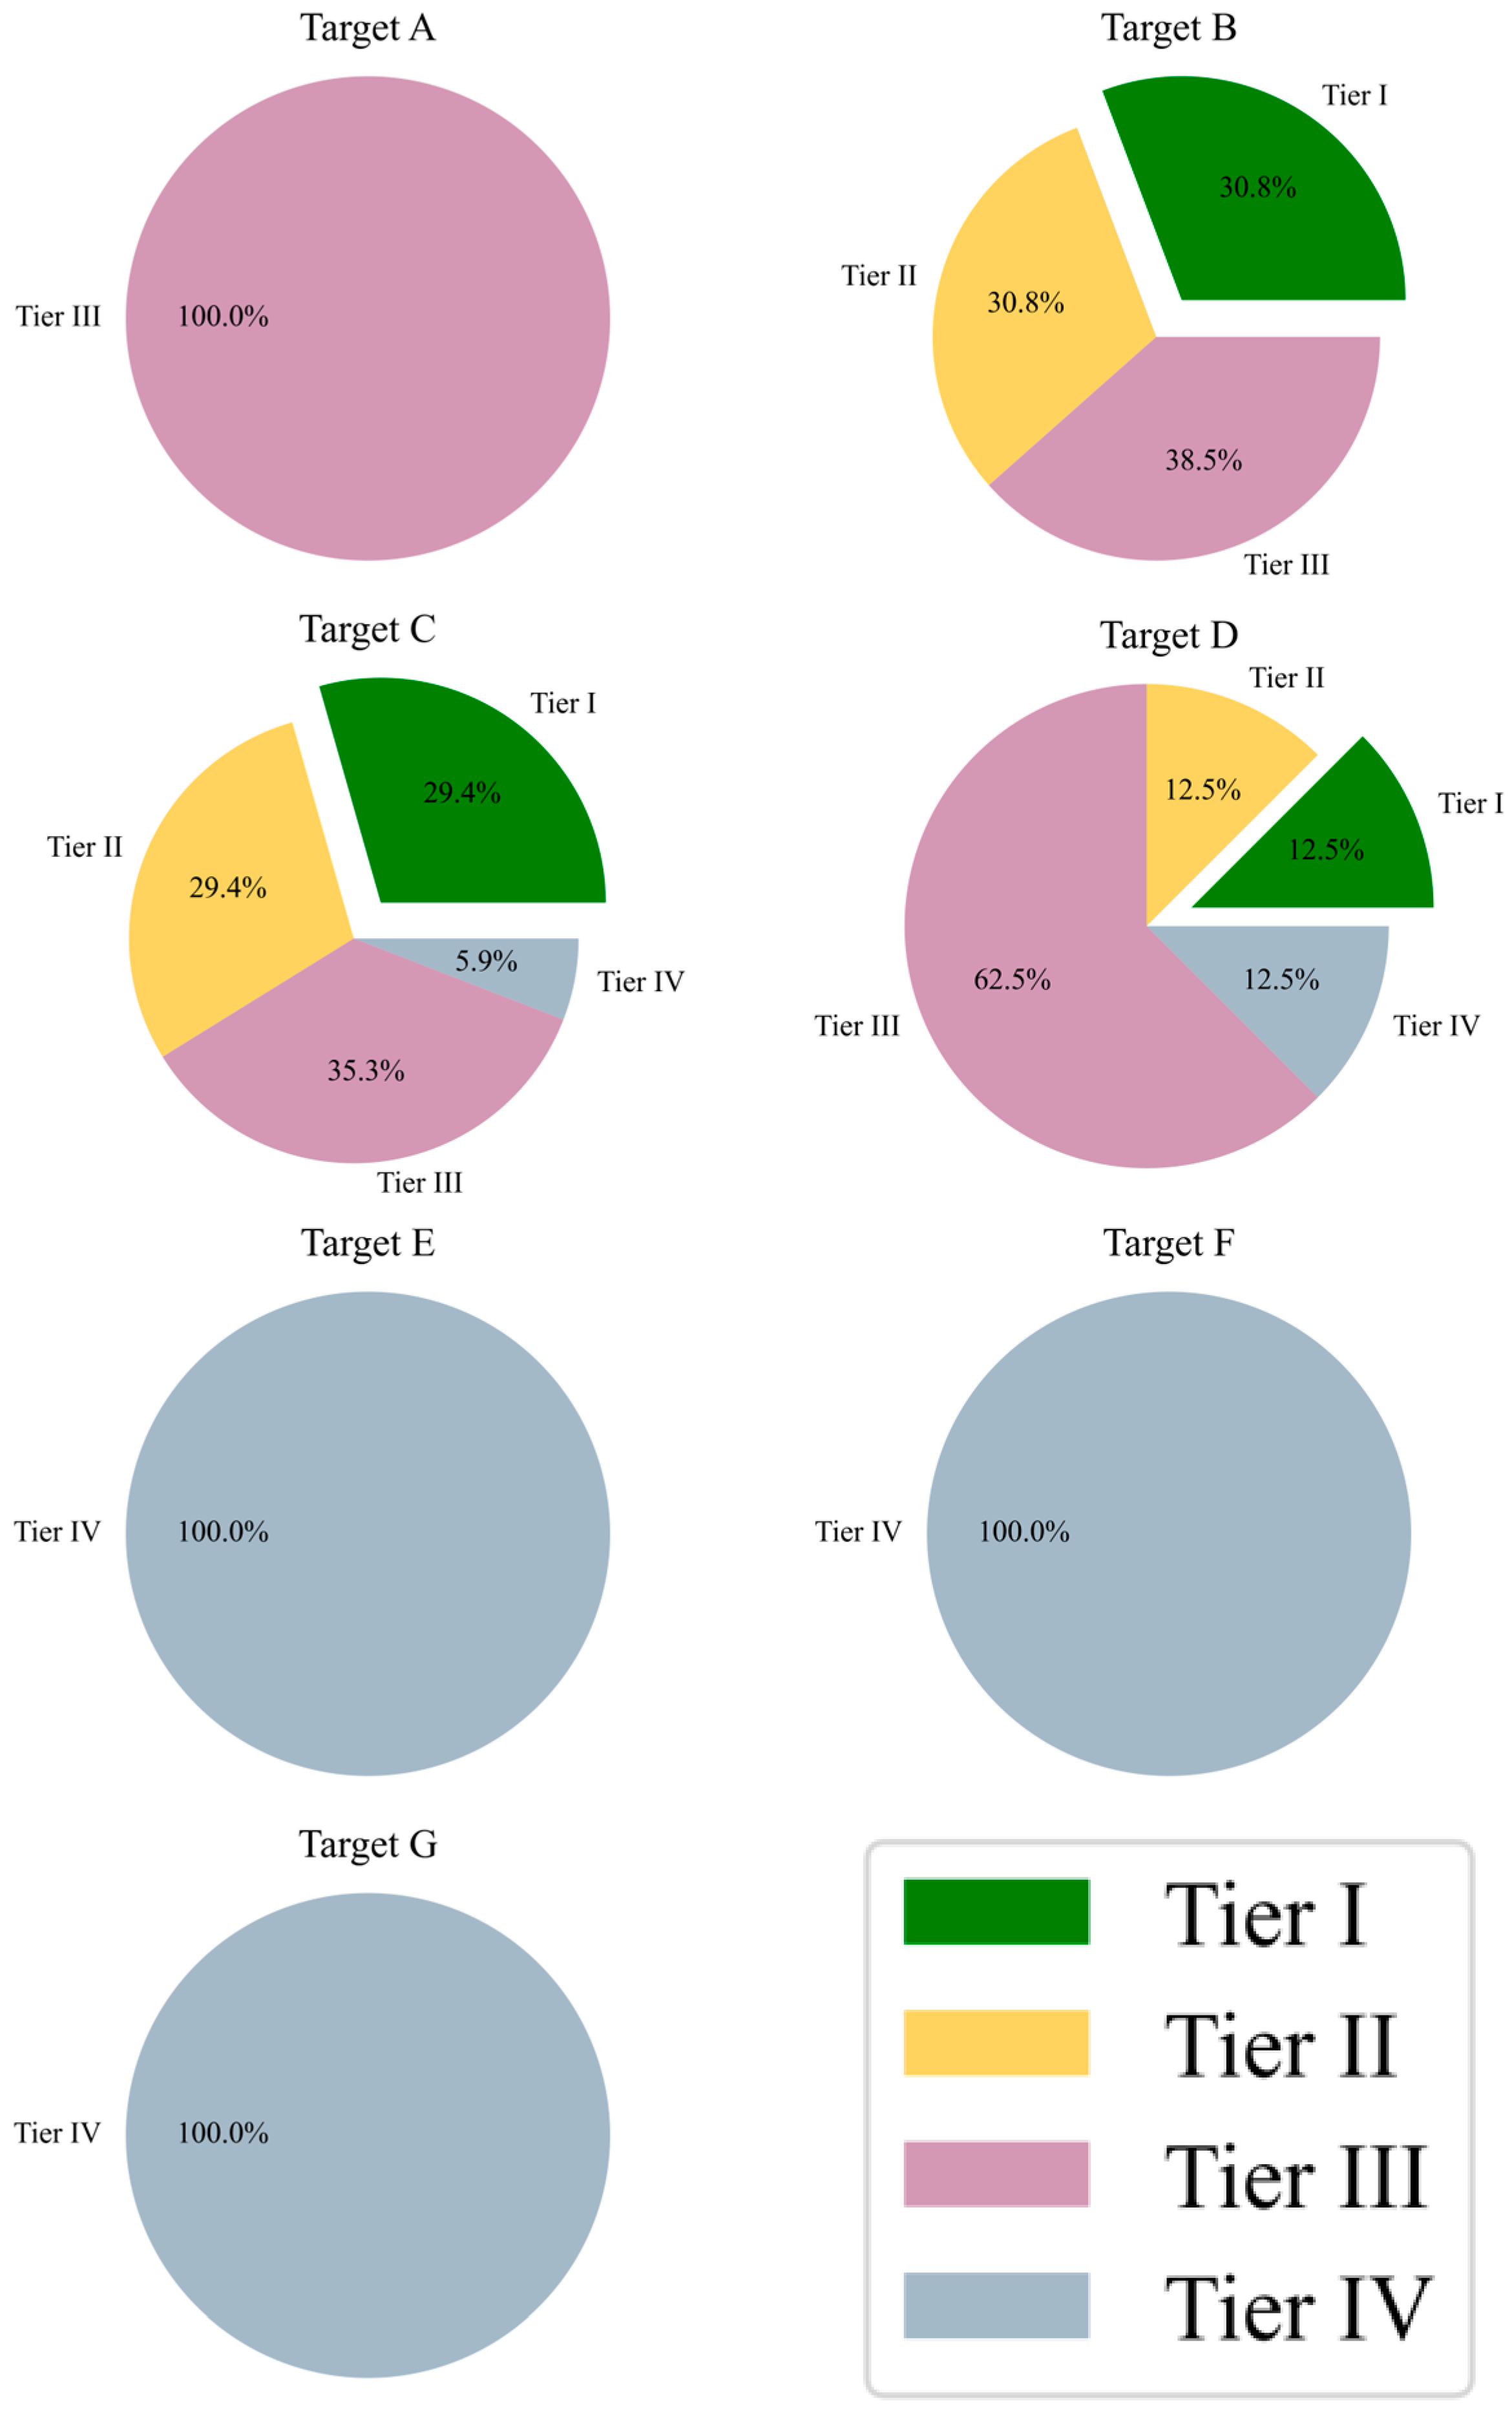
3.1. SFDRR Indicators Supported by EO
3.2. Links between EVs and SFDRR Indicators
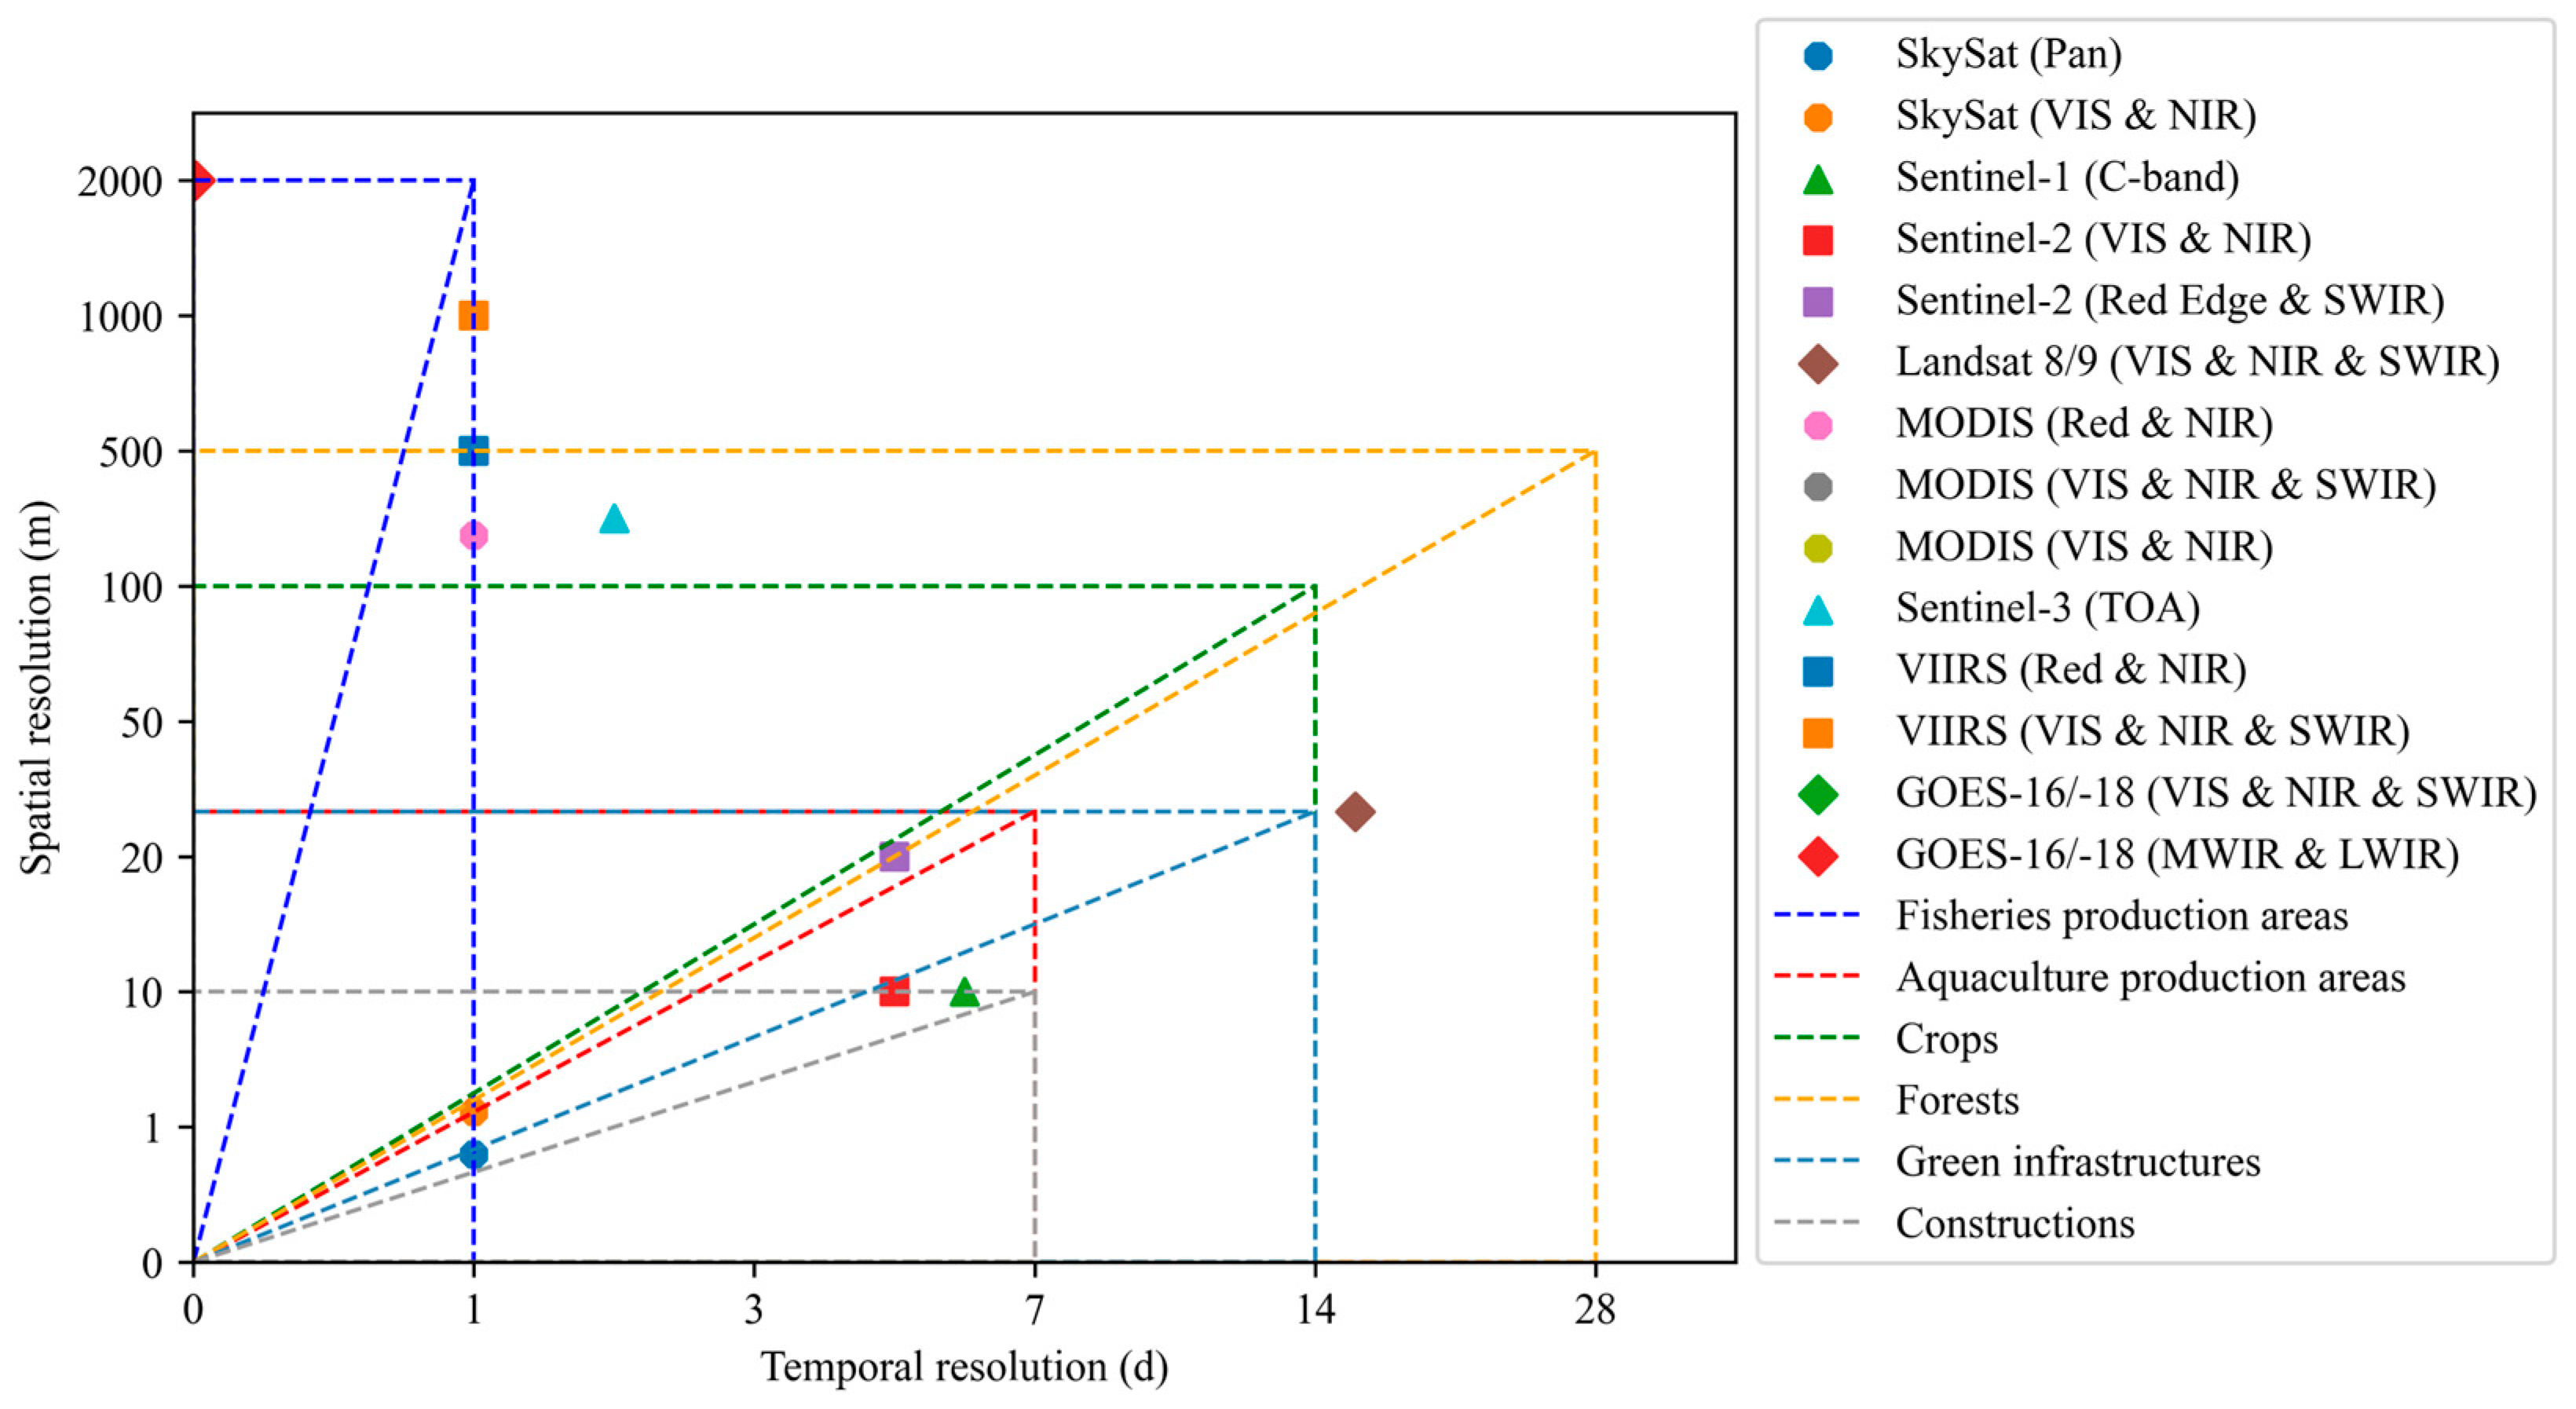
3.3. Mapping Relationship between EVs and EO
3.4. Matching EO to SFDRR
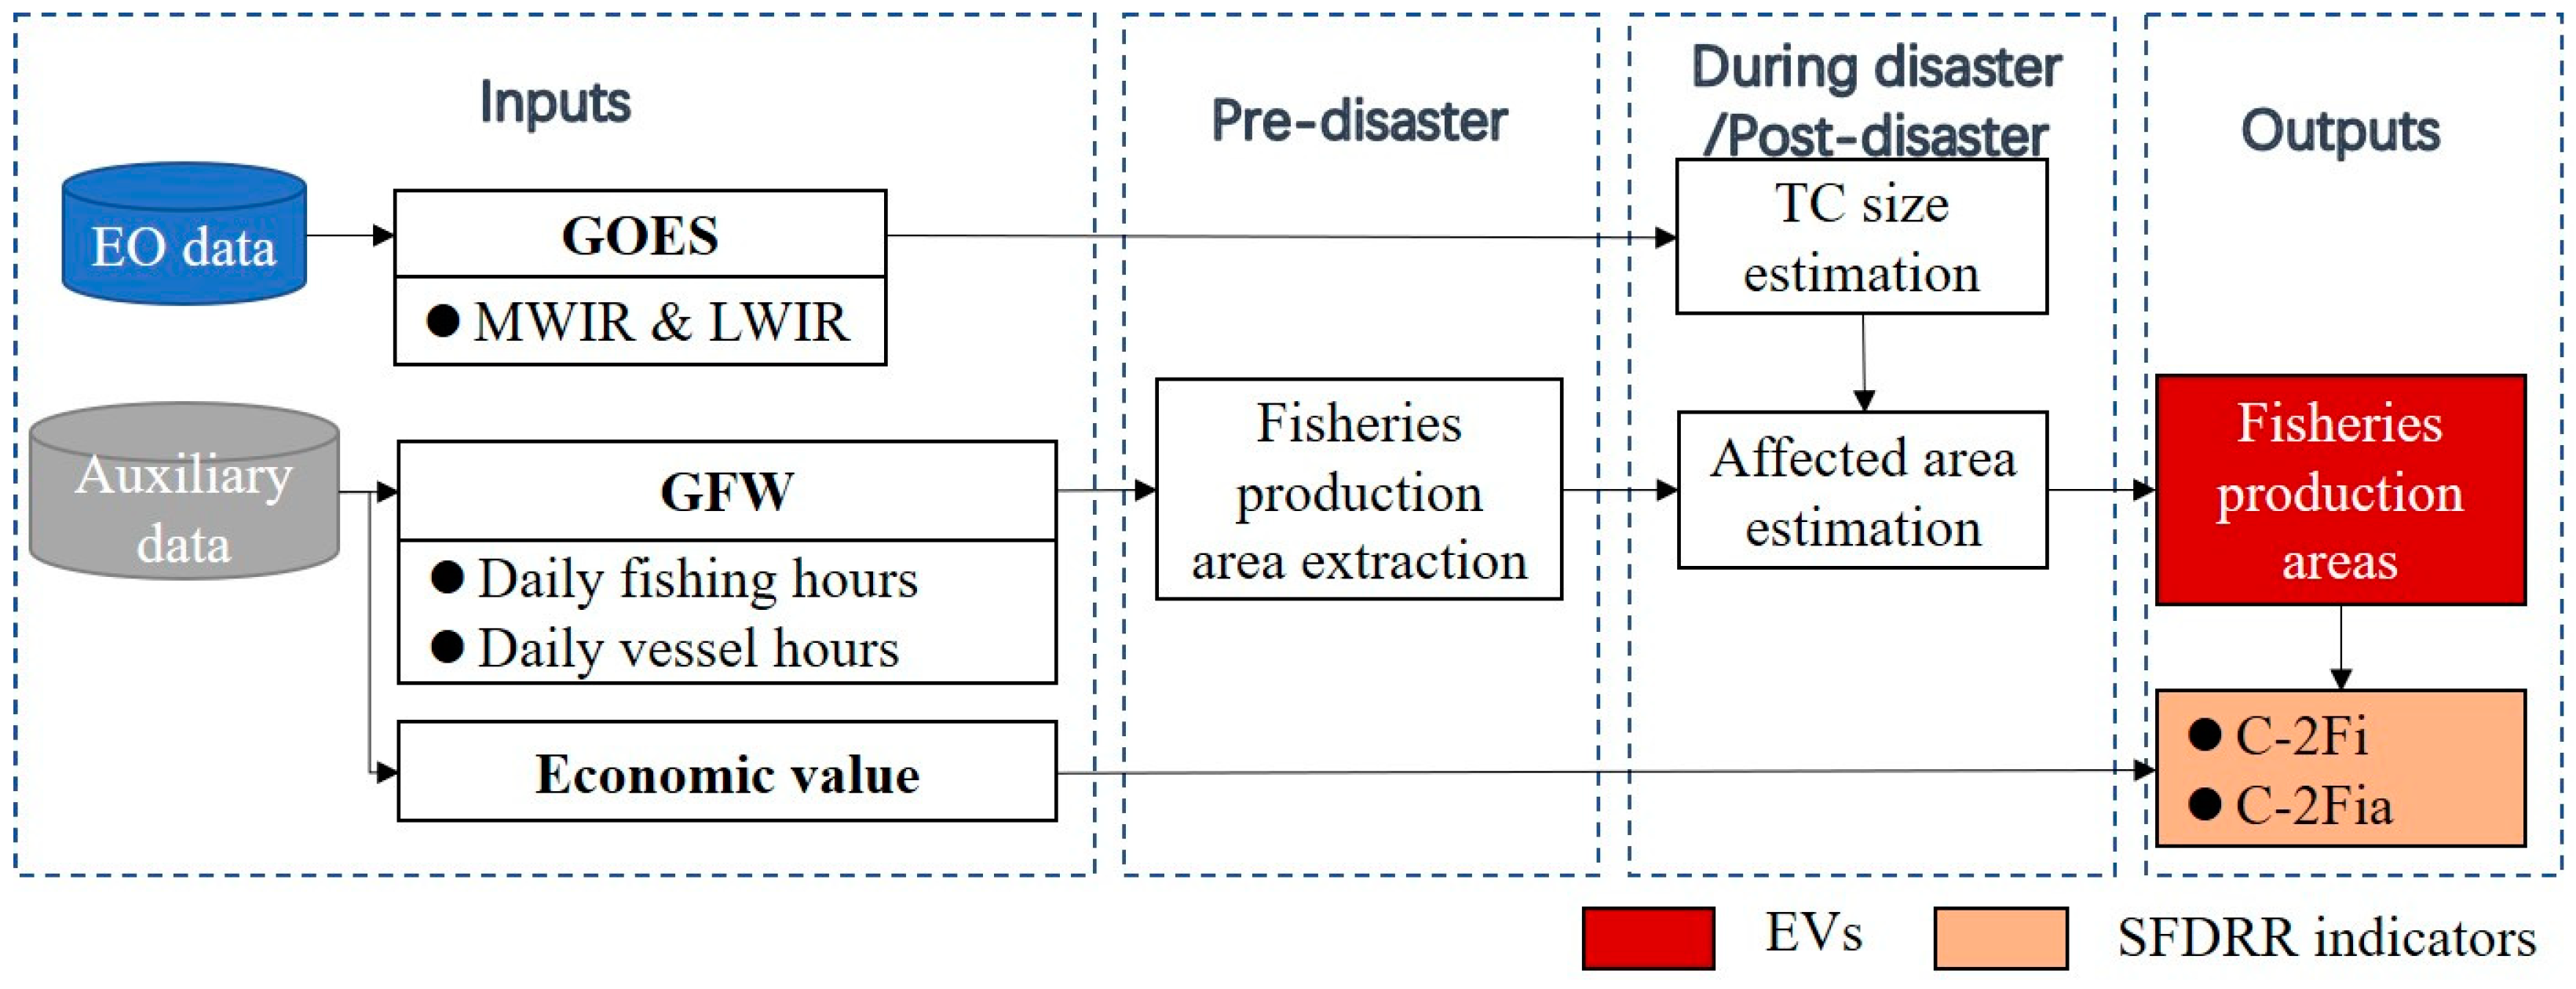
3.4.1. Ocean-Related Class
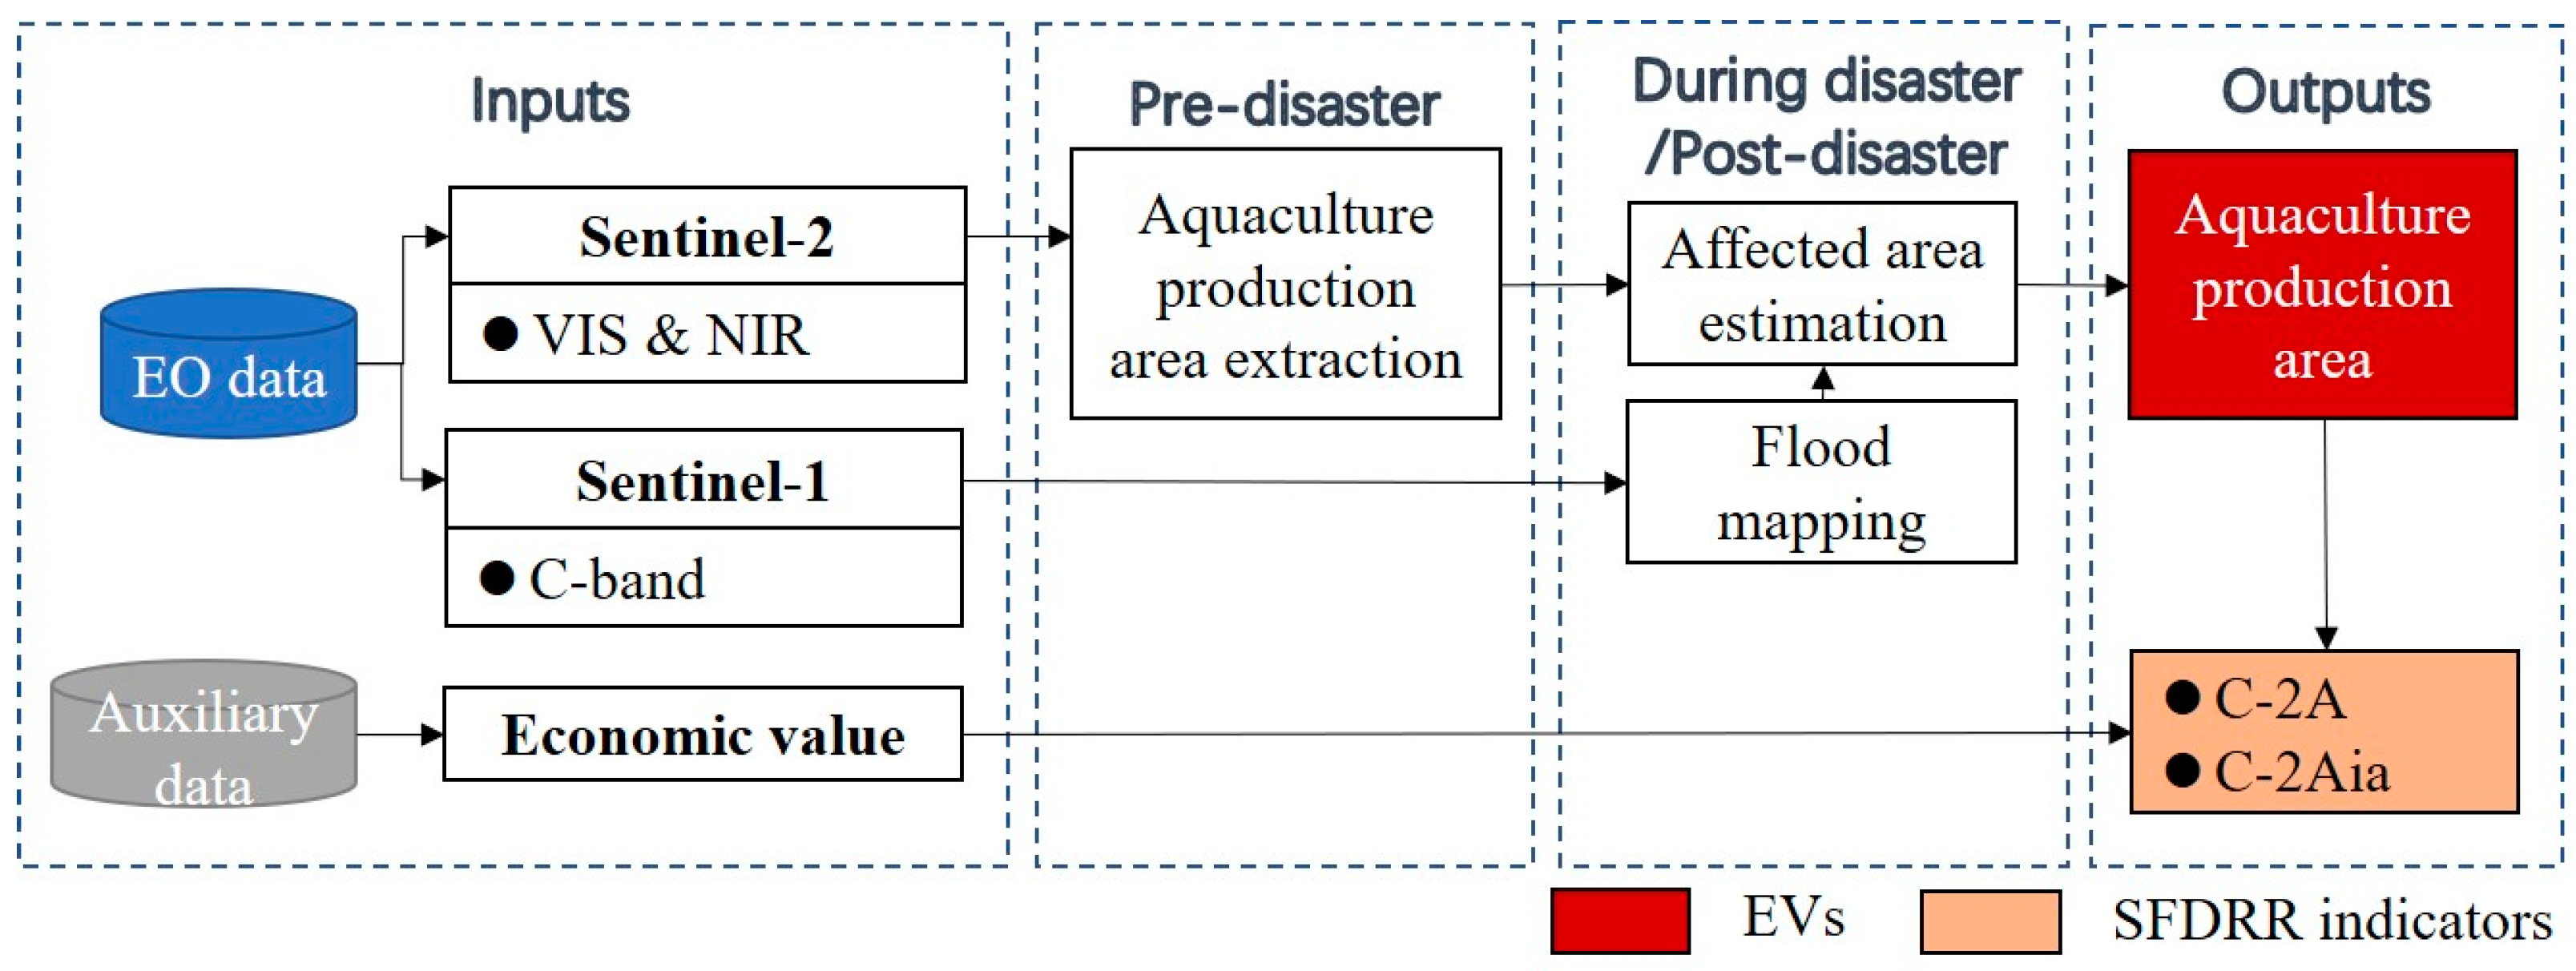
3.4.2. Water-Related Class
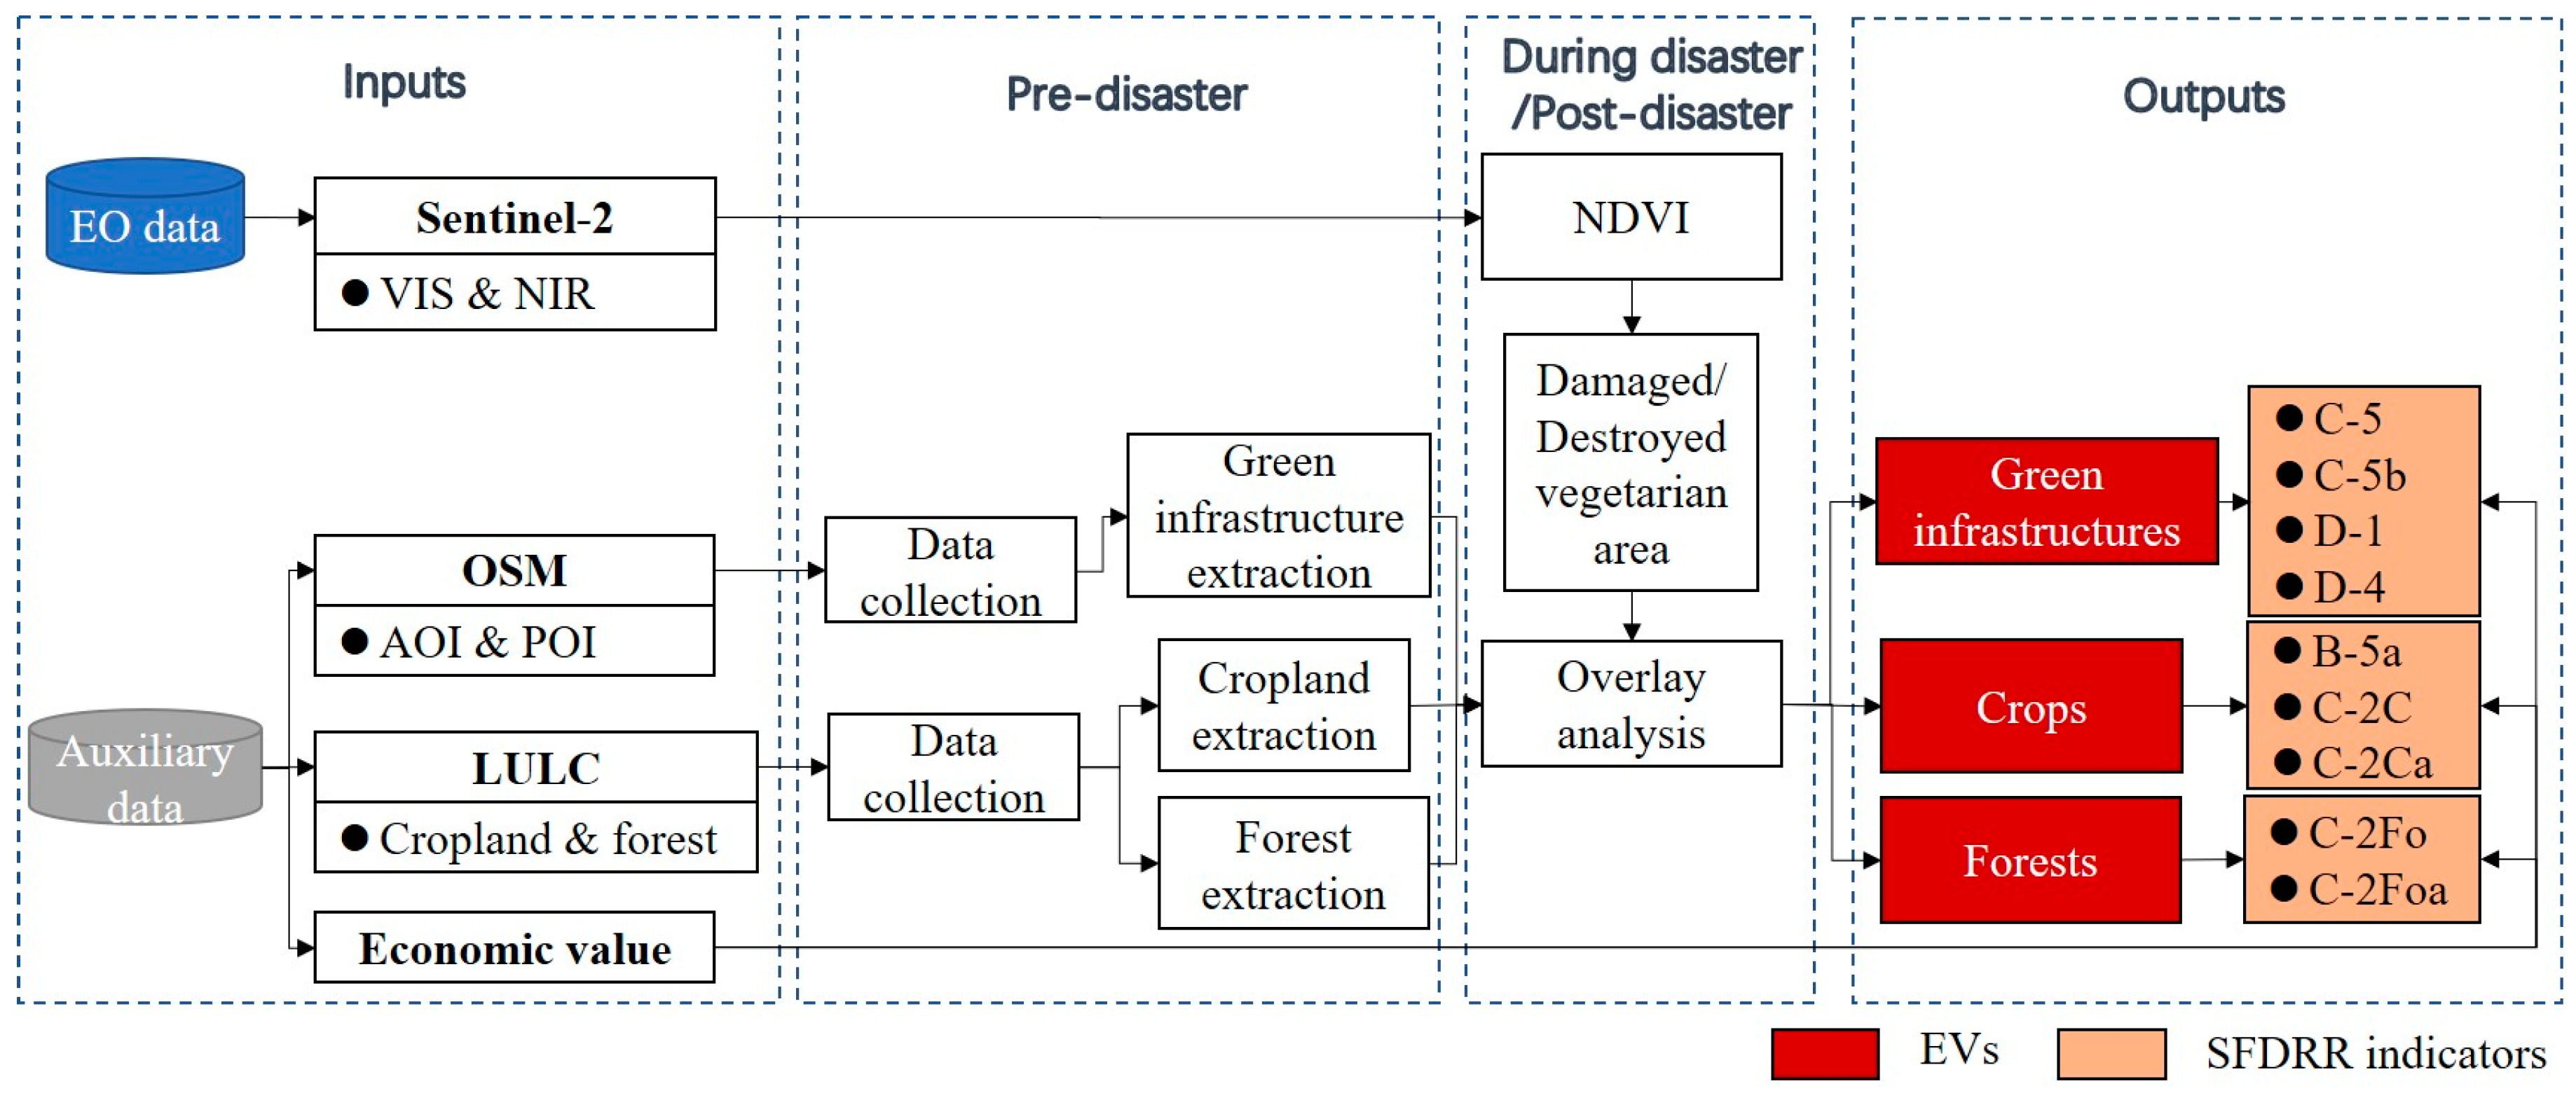
3.4.3. Vegetarian-Related Class
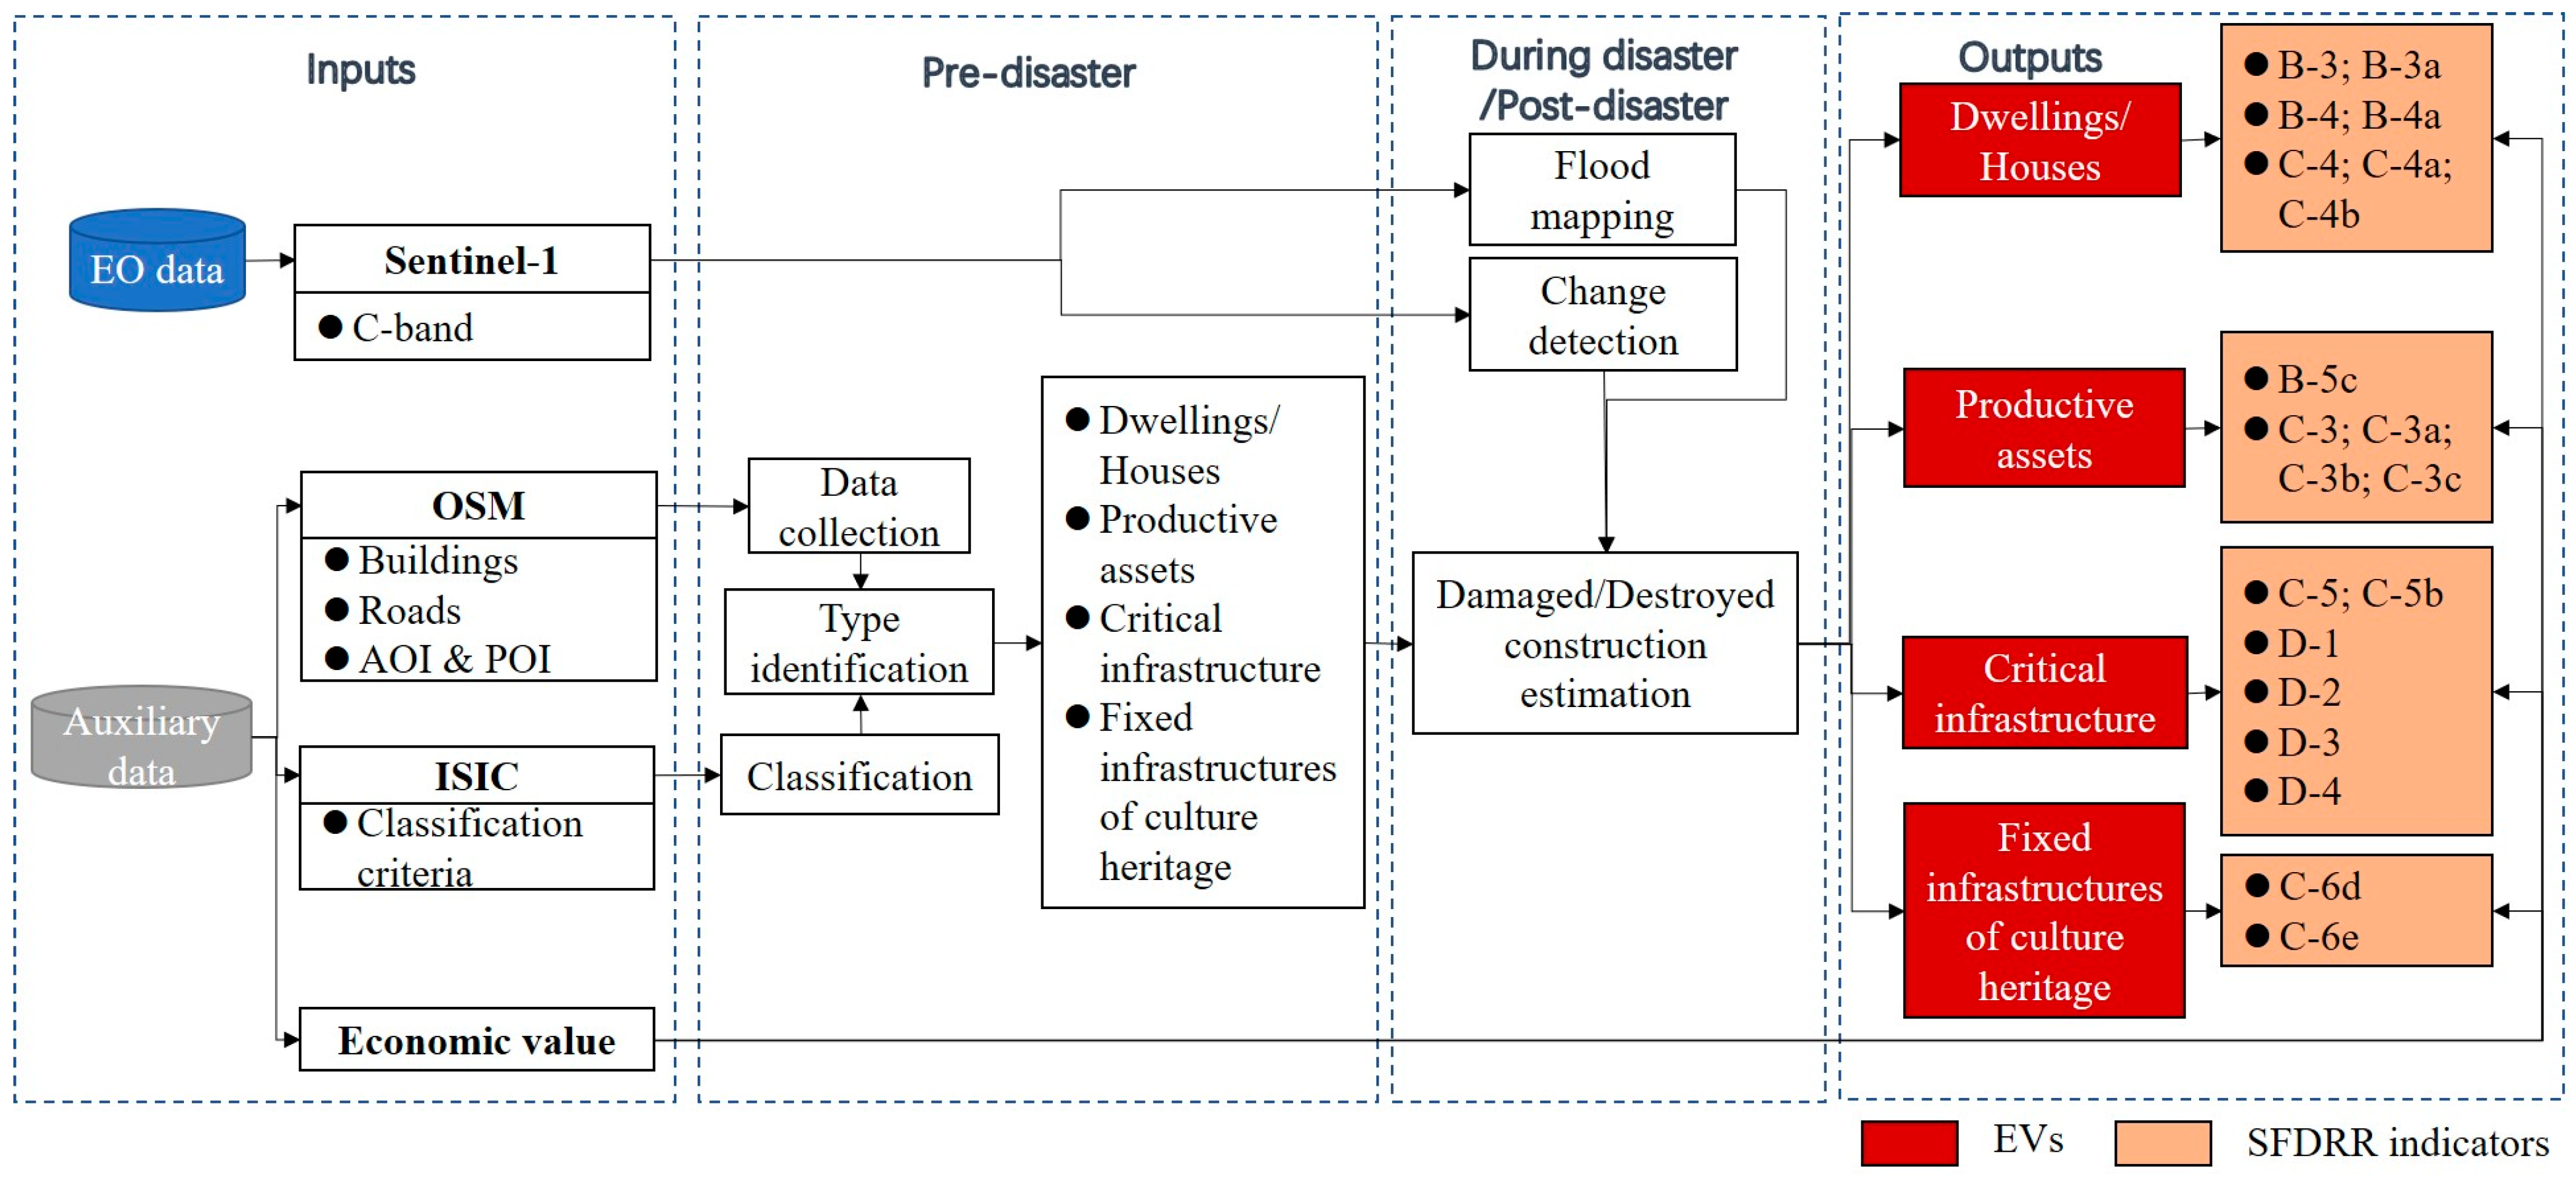
3.4.4. Construction-Related Class
4. Discussion
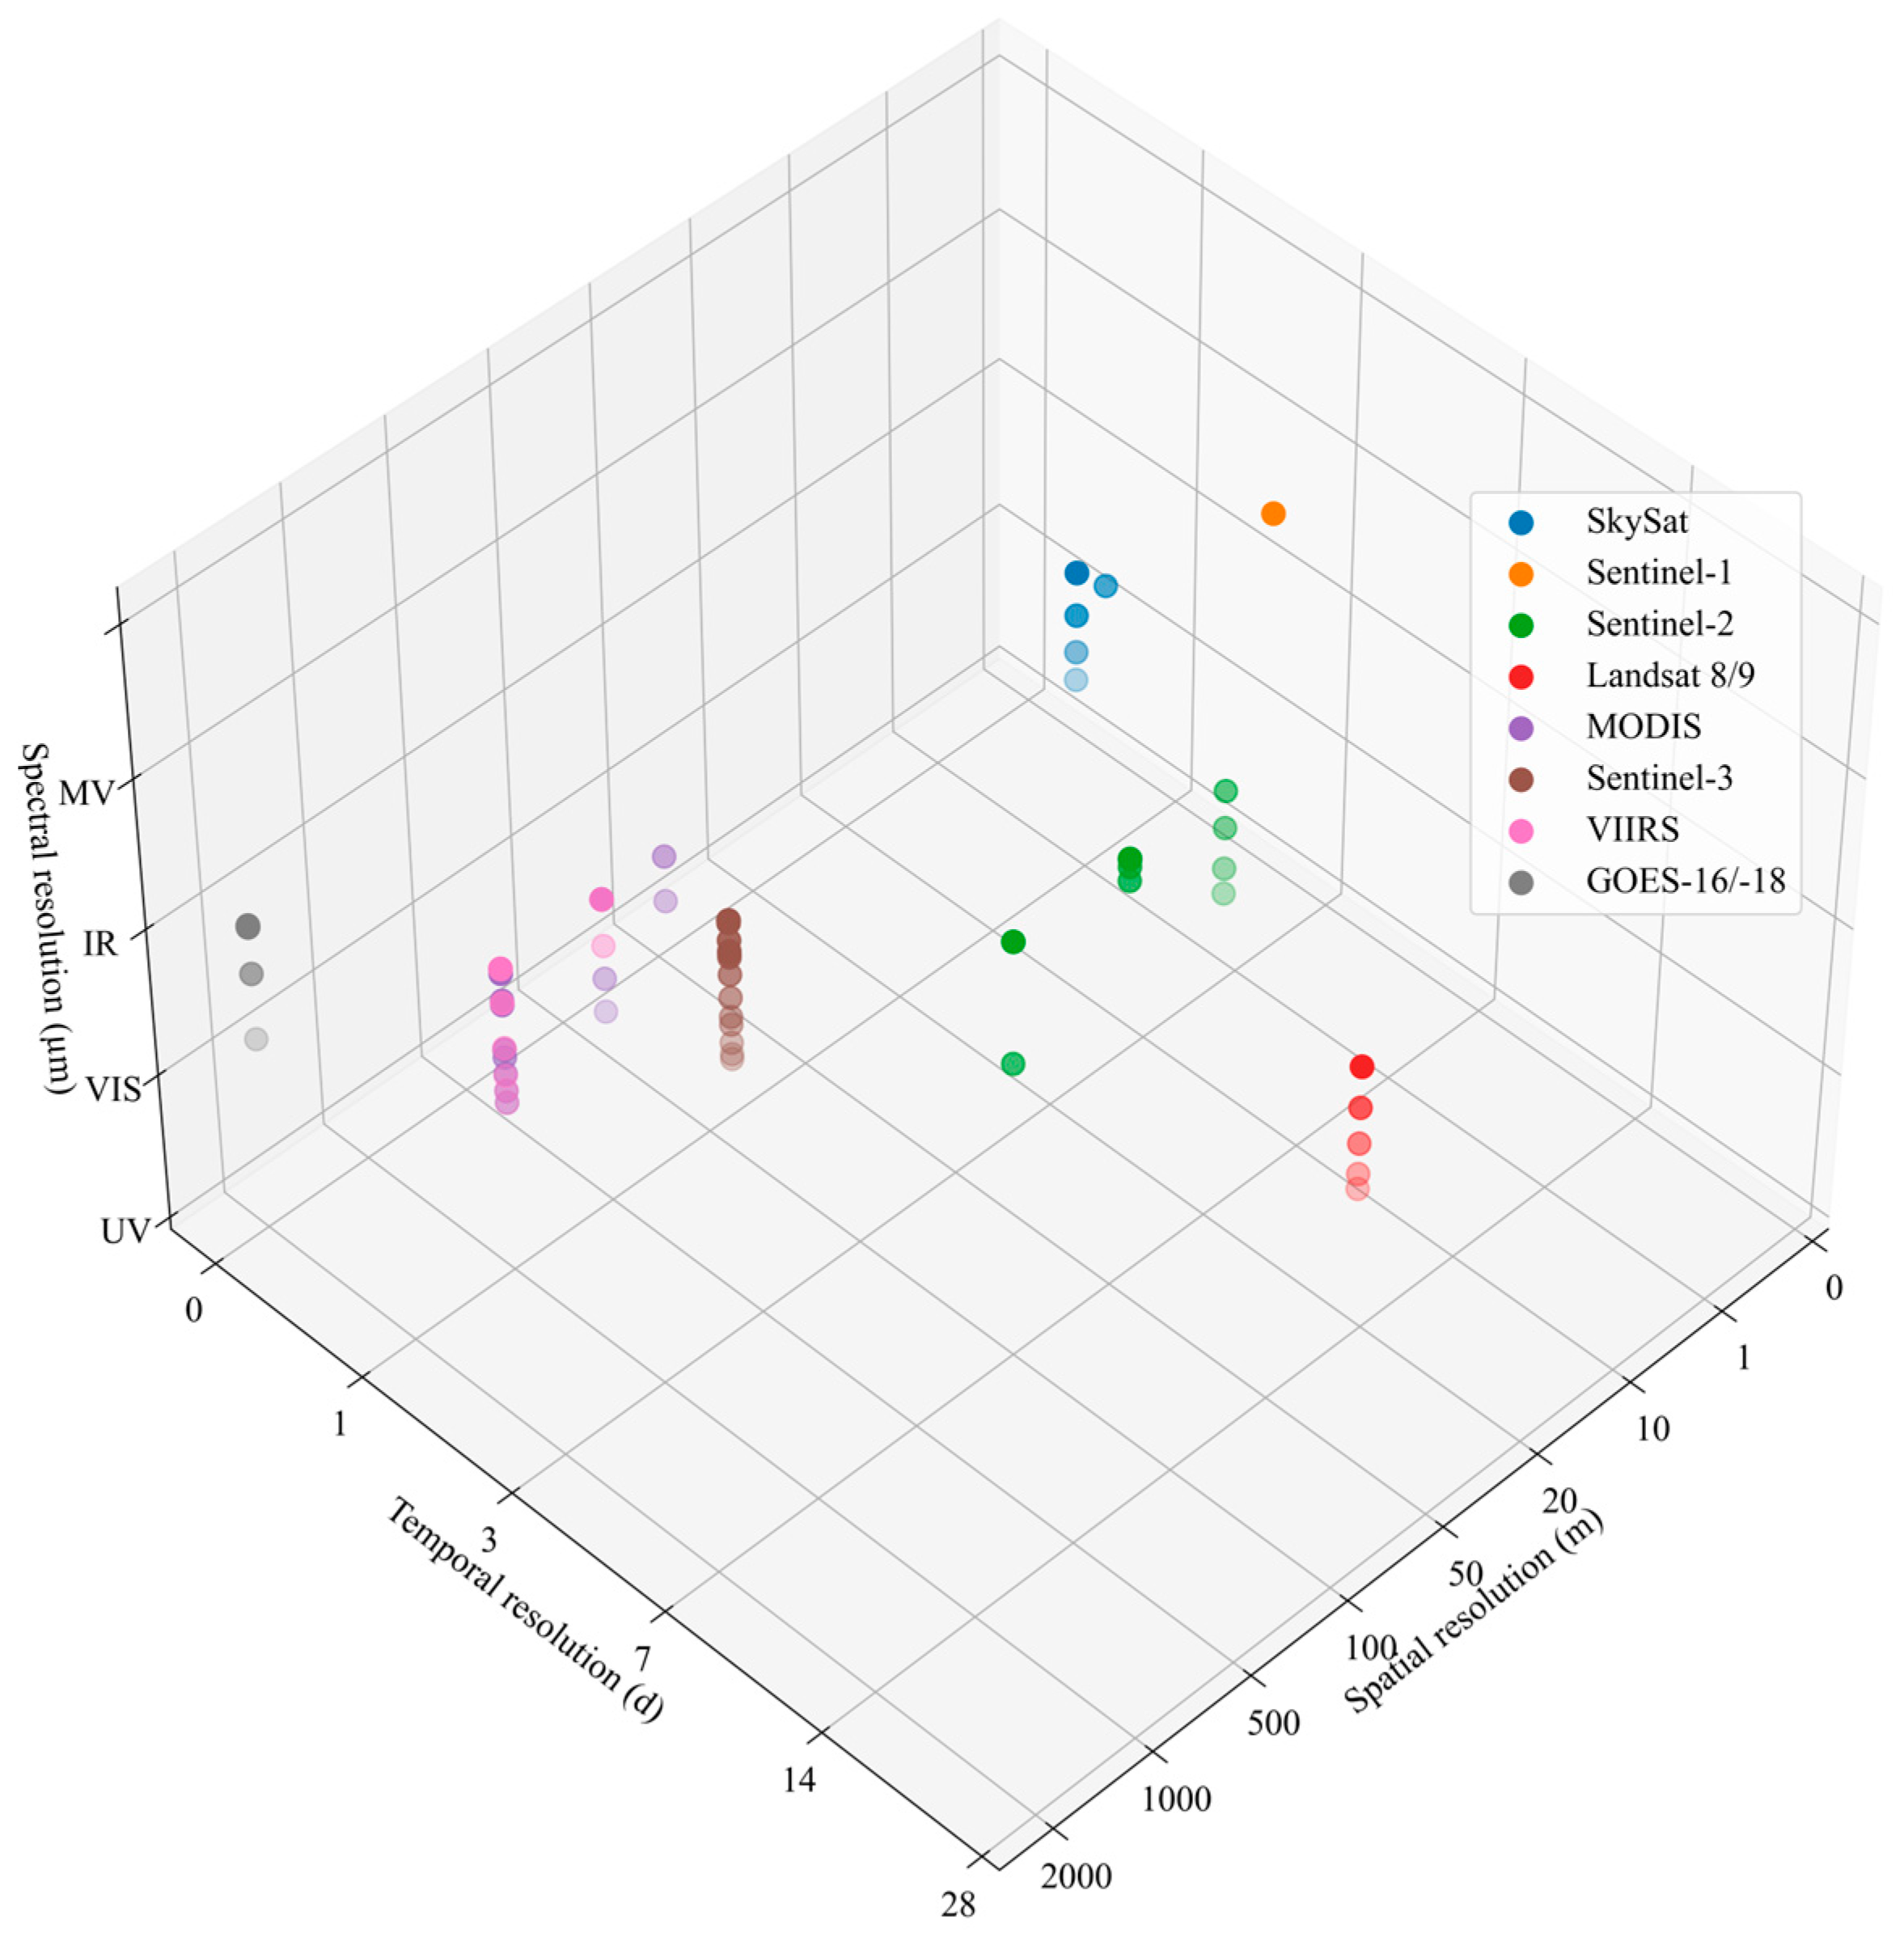
4.1. EO Data: Space-Air Platform Collaboration
4.2. EO Methods: Available for Various Disaster Contexts
5. Conclusions
- Except for the indicators free from the requirements of post-disaster information, 51.8% of the SFDRR indicators could be supported by EO, which demonstrated the huge potential of EO in service to the SFDRR.
- In the TC scenarios, we proposed 11 EVs within four classes. This provided a clear system by which variables could be measured by EO for the SFDRR indicators, which demonstrated the potential to develop EVs outside the established set of SFDRR indicators that may be more amenable to the use of EO-derived data.
- An EO-based framework for the SFDRR was proposed, with an end-to-end workflow where one can acquire EO data, implement measuring methods, and obtain evaluation results based on an integrated platform on GEE.
- Future work with space-air collaborative EO data and universal EO methods oriented to the EO-based framework and the SFDRR is expected. For example, more EO data from airborne platforms would be available for the framework, and artificial intelligence models with disaster big data and knowledge would be integrated into the framework.
Author Contributions
Funding
Data Availability Statement
Acknowledgments
Conflicts of Interest
References
- United Nations (UN). Sendai Framework for Disaster Risk Reduction 2015–2030; UN: New York, NY, USA, 2015. [Google Scholar]
- The Sendai Framework and the SDGs. Available online: https://www.undrr.org/implementing-sendai-framework/sf-and-sdgs (accessed on 9 March 2023).
- Lucatello, S.; Alcántara-Ayala, I. Addressing the Interplay of the Sendai Framework with Sustainable Development Goals in Latin America and the Caribbean: Moving Forward or Going Backwards? Disaster Prev. Manag. 2022. [Google Scholar] [CrossRef]
- Salvacion, A.R. Measuring Spatial Accessibility of Healthcare Facilities in Marinduque, Philippines. ISPRS Int. J. Geo-Inf. 2022, 11, 516. [Google Scholar] [CrossRef]
- Gidda, S.B.; Padmavati, R.V.V.; Mulongoy, J. Sustainable Seas: Overdue SDG Target Could Be Met This Year. Nature 2022, 605, 619. [Google Scholar] [CrossRef]
- UN General Assembly (UNGA). Report of the Open-Ended Intergovernmental Expert Working Group on Indicators and Terminology Relating to Disaster Risk Eduction; UNGA: New York, NY, USA, 2016. [Google Scholar]
- United Nations for Disaster Risk Reduction (UNISDR). Technical Guidance for Monitoring and Reporting on Progress in Achieving the Global Targets of the Sendai Framework for Disaster Risk Reduction; UNISDR: New York, NY, USA, 2017. [Google Scholar]
- Zaidi, R.Z. Beyond the Sendai Indicators: Application of a Cascading Risk Lens for the Improvement of Loss Data Indicators for Slow-Onset Hazards and Small-Scale Disasters. Int. J. Disaster Risk Reduct. 2018, 30, 306–314. [Google Scholar] [CrossRef]
- Ciullo, A.; Strobl, E.; Meiler, S.; Martius, O.; Bresch, D.N. Increasing Countries’ Financial Resilience through Global Catastrophe Risk Pooling. Nat. Commun. 2023, 14, 922. [Google Scholar] [CrossRef] [PubMed]
- United Nations (UN). Sendai Framework Data Readiness Review 2017—Global Summary Report; UN: New York, NY, USA, 2017. [Google Scholar]
- Feng, X.; Merow, C.; Liu, Z.; Park, D.S.; Roehrdanz, P.R.; Maitner, B.; Newman, E.A.; Boyle, B.L.; Lien, A.; Burger, J.R. How Deregulation, Drought and Increasing Fire Impact Amazonian Biodiversity. Nature 2021, 597, 516–521. [Google Scholar] [CrossRef] [PubMed]
- DeVries, B.; Huang, C.; Armston, J.; Huang, W.; Jones, J.W.; Lang, M.W. Rapid and Robust Monitoring of Flood Events Using Sentinel-1 and Landsat Data on the Google Earth Engine. Remote Sens. Environ. 2020, 240, 111664. [Google Scholar] [CrossRef]
- Tellman, B.; Sullivan, J.A.; Kuhn, C.; Kettner, A.J.; Doyle, C.S.; Brakenridge, G.R.; Erickson, T.A.; Slayback, D.A. Satellite Imaging Reveals Increased Proportion of Population Exposed to Floods. Nature 2021, 596, 80–86. [Google Scholar] [CrossRef]
- Wang, L.; Chang, M.; Le, J.; Xiang, L.; Ni, Z. Two Multi-Temporal Datasets to Track Debris Flow after the 2008 Wenchuan Earthquake. Sci. Data 2022, 9, 525. [Google Scholar] [CrossRef]
- Koshimura, S.; Moya, L.; Mas, E.; Bai, Y. Tsunami Damage Detection with Remote Sensing: A Review. Geosciences 2020, 10, 177. [Google Scholar] [CrossRef]
- Virtriana, R.; Harto, A.B.; Atmaja, F.W.; Meilano, I.; Fauzan, K.N.; Anggraini, T.S.; Ihsan, K.T.N.; Mustika, F.C.; Suminar, W. Machine Learning Remote Sensing Using the Random Forest Classifier to Detect the Building Damage Caused by the Anak Krakatau Volcano Tsunami. Geomat. Nat. Hazards Risk 2023, 14, 28–51. [Google Scholar] [CrossRef]
- Maly, E.; Suppasri, A. The Sendai Framework for Disaster Risk Reduction at Five: Lessons from the 2011 Great East Japan Earthquake and Tsunami. Int. J. Disaster Risk Sci. 2020, 11, 167–178. [Google Scholar] [CrossRef] [Green Version]
- Chmutina, K.; von Meding, J.; Sandoval, V.; Boyland, M.; Forino, G.; Cheek, W.; Williams, D.A.; Gonzalez-Muzzio, C.; Tomassi, I.; Páez, H.; et al. What We Measure Matters: The Case of the Missing Development Data in Sendai Framework for Disaster Risk Reduction Monitoring. Int. J. Disaster Risk Sci. 2021, 12, 779–789. [Google Scholar] [CrossRef]
- Fauzi, A.I.; Azizah, N.; Yati, E.; Atmojo, A.T.; Rohman, A.; Putra, R.; Rahadianto, M.A.E.; Ramadhanti, D.; Ardani, N.H.; Robbani, B.F. Potential Loss of Ecosystem Service Value Due to Vessel Activity Expansion in Indonesian Marine Protected Areas. ISPRS Int. J. Geo-Inf. 2023, 12, 75. [Google Scholar] [CrossRef]
- GEO Community Activity—Earth Observation and Copernicus in Support of Sendai Monitoring. Available online: https://www.earthobservations.org/documents/gwp20_22/EO4SENDAI-MONITORING.pdf (accessed on 27 March 2023).
- ESCAP. Sharing Space-Based Information: Procedural Guidelines for Disaster Emergency Response in ASEAN Countries; ESCAP: Bangkok, Thailand, 2017. [Google Scholar]
- Asian and Pacific Centre for the Development of Disaster Information Management (UNESCAP-APDIM). Guideline on Monitoring and Reporting the Impact of Sand and Dust Storms through the Sendai Framework Monitoring; UNESCAP-APDIM: Bangkok, Thailand, 2020. [Google Scholar]
- Masó, J.; Serral, I.; Domingo-Marimon, C.; Zabala, A. Earth Observations for Sustainable Development Goals Monitoring Based on Essential Variables and Driver-Pressure-State-Impact-Response Indicators. Int. J. Digit. Earth 2020, 13, 217–235. [Google Scholar] [CrossRef] [Green Version]
- Urrutia II, J.M.; Scheffczyk, K.; Riembauer, G.; Mendoza, J.; Yanez, D.; Jímenez, S.; Ramírez, A.; Acosta, M.; Argüello, J.; Huerta, B. A Validated Geospatial Model Approach for Monitoring Progress of the Sendai Framework: The Example of People Affected in Agriculture Due to Flooding in Ecuador. Prog. Disaster Sci. 2022, 15, 100233. [Google Scholar] [CrossRef]
- Ghaffarian, S.; Emtehani, S. Monitoring Urban Deprived Areas with Remote Sensing and Machine Learning in Case of Disaster Recovery. Climate 2021, 9, 58. [Google Scholar] [CrossRef]
- Anderson, K.; Ryan, B.; Sonntag, W.; Kavvada, A.; Friedl, L. Earth Observation in Service of the 2030 Agenda for Sustainable Development. Geo-Spat. Inf. Sci. 2017, 20, 77–96. [Google Scholar] [CrossRef]
- Giuliani, G.; Egger, E.; Italiano, J.; Poussin, C.; Richard, J.-P.; Chatenoux, B. Essential Variables for Environmental Monitoring: What Are the Possible Contributions of Earth Observation Data Cubes? Data 2020, 5, 100. [Google Scholar] [CrossRef]
- Lehmann, A.; Mazzetti, P.; Santoro, M.; Nativi, S.; Maso, J.; Serral, I.; Spengler, D.; Niamir, A.; Lacroix, P.; Ambrosone, M. Essential Earth Observation Variables for High-Level Multi-Scale Indicators and Policies. Environ. Sci. Policy 2022, 131, 105–117. [Google Scholar] [CrossRef]
- Lehmann, A.; Masò, J.; Nativi, S.; Giuliani, G. Towards Integrated Essential Variables for Sustainability. Int. J. Digit. Earth 2020, 13, 158–165. [Google Scholar] [CrossRef]
- Andries, A.; Morse, S.; Murphy, R.; Lynch, J.; Woolliams, E.; Fonweban, J. Translation of Earth Observation Data into Sustainable Development Indicators: An Analytical Framework. Sustain. Dev. 2019, 27, 366–376. [Google Scholar] [CrossRef] [Green Version]
- Allen, C.; Smith, M.; Rabiee, M.; Dahmm, H. A Review of Scientific Advancements in Datasets Derived from Big Data for Monitoring the Sustainable Development Goals. Sustain. Sci. 2021, 16, 1701–1716. [Google Scholar] [CrossRef]
- Shi, P. Disaster Risk Science; Springer: Berlin/Heidelberg, Germany, 2019; ISBN 9811366896. [Google Scholar]
- Cui, S.; Yin, Y.; Wang, D.; Li, Z.; Wang, Y. A Stacking-Based Ensemble Learning Method for Earthquake Casualty Prediction. Appl. Soft Comput. 2020, 101, 107038. [Google Scholar] [CrossRef]
- Li, B.; Gong, A.; Zeng, T.; Bao, W.; Xu, C.; Huang, Z. A Zoning Earthquake Casualty Prediction Model Based on Machine Learning. Remote Sens. 2021, 14, 30. [Google Scholar] [CrossRef]
- Gorelick, N.; Hancher, M.; Dixon, M.; Ilyushchenko, S.; Thau, D.; Moore, R. Google Earth Engine: Planetary-Scale Geospatial Analysis for Everyone. Remote Sens. Environ. 2017, 202, 18–27. [Google Scholar] [CrossRef]
- Whitcraft, A.K.; Becker-Reshef, I.; Killough, B.D.; Justice, C.O. Meeting Earth Observation Requirements for Global Agricultural Monitoring: An Evaluation of the Revisit Capabilities of Current and Planned Moderate Resolution Optical Earth Observing Missions. Remote Sens. 2015, 7, 1482–1503. [Google Scholar] [CrossRef] [Green Version]
- Helleis, M.; Wieland, M.; Krullikowski, C.; Martinis, S.; Plank, S. Sentinel-1-Based Water and Flood Mapping: Benchmarking Convolutional Neural Networks against an Operational Rule-Based Processing Chain. IEEE J. Sel. Top. Appl. Earth Obs. Remote Sens. 2022, 15, 2023–2036. [Google Scholar] [CrossRef]
- Lu, X.; Yu, H.; Yang, X.; Li, X. Estimating Tropical Cyclone Size in the Northwestern Pacific from Geostationary Satellite Infrared Images. Remote Sens. 2017, 9, 728. [Google Scholar] [CrossRef] [Green Version]
- Fang, W.; Guo, C.; Han, Y.; Qing, R. Impact of Tropical Cyclone Avoidance on Fishing Vessel Activity over Coastal China Based on Automatic Identification System Data during 2013–2018. Int. J. Disaster Risk Sci. 2022, 13, 561–576. [Google Scholar] [CrossRef]
- Li, B.; Gong, A.; Chen, Z.; Pan, X.; Li, L.; Li, J.; Bao, W. An Object-Oriented Method for Extracting Single-Object Aquaculture Ponds from 10 m Resolution Sentinel-2 Images on Google Earth Engine. Remote Sens. 2023, 15, 856. [Google Scholar] [CrossRef]
- Charrua, A.B.; Padmanaban, R.; Cabral, P.; Bandeira, S.; Romeiras, M.M. Impacts of the Tropical Cyclone Idai in Mozambique: A Multi-Temporal Landsat Satellite Imagery Analysis. Remote Sens. 2021, 13, 201. [Google Scholar] [CrossRef]
- Wang, Z.; Wei, C.; Liu, X.; Zhu, L.; Yang, Q.; Wang, Q.; Zhang, Q.; Meng, Y. Object-Based Change Detection for Vegetation Disturbance and Recovery Using Landsat Time Series. GIScience Remote Sens. 2022, 59, 1706–1721. [Google Scholar] [CrossRef]
- Handwerger, A.L.; Jones, S.Y.; Huang, M.H.; Amatya, P.; Kerner, H.R.; Kirschbaum, D.B. Rapid Landslide Identification Using Synthetic Aperture Radar Amplitude Change Detection on the Google Earth Engine. Nat. Hazards Earth Syst. Sci. 2020, 2020, 1–24. [Google Scholar] [CrossRef]
- Malmgren-Hansen, D.; Sohnesen, T.; Fisker, P.; Baez, J. Sentinel-1 Change Detection Analysis for Cyclone Damage Assessment in Urban Environments. Remote Sens. 2020, 12, 2409. [Google Scholar] [CrossRef]
- Gruenhagen, L.; Juergens, C. Multitemporal Change Detection Analysis in an Urbanized Environment Based upon Sentinel-1 Data. Remote Sens. 2022, 14, 1043. [Google Scholar] [CrossRef]
- Hildmann, H.; Kovacs, E. Using Unmanned Aerial Vehicles (UAVs) as Mobile Sensing Platforms (MSPs) for Disaster Response, Civil Security and Public Safety. Drones 2019, 3, 59. [Google Scholar] [CrossRef] [Green Version]
- Wan, Y.; Zhong, Y.; Ma, A.; Zhang, L. An Accurate UAV 3-D Path Planning Method for Disaster Emergency Response Based on an Improved Multiobjective Swarm Intelligence Algorithm. IEEE Trans. Cybern. 2022, 53, 2658–2671. [Google Scholar] [CrossRef]
- Wang, Y.; Su, Z.; Xu, Q.; Li, R.; Luan, T.H.; Wang, P. A Secure and Intelligent Data Sharing Scheme for UAV-Assisted Disaster Rescue. IEEEACM Trans. Netw. 2023, 1–17. [Google Scholar] [CrossRef]


| Tier | Definition | Example |
|---|---|---|
| Tier I | Independent indicator directly supported by EO, that is, by inputting EO data as well as other sources of basic data into the evaluation method, the value of the indicator can be obtained. | Indicator B-3a: Number of dwellings/houses damaged attributed to disasters |
| Tier II | Compound indicator that are indirectly supported by EO, that is, it needs to be calculated through the use of independent indicators, basic data, and specific algorithms provided by the UNDRR [22]. | Indicator D-1: Damage to critical infrastructure attributed to disasters |
| Tier III | Indicator cannot be supported by EO, that is, post-disaster data and information need to be collected by such means as filed surveys rather than by EO. | Indicator B-2: Number of injured or ill people attributed to disasters |
| Tier IV | Indicator that does not need to be supported by EO, that is, data and information acquirement and indicator evaluation can be completed before the disaster, and no post-disaster evaluation work is needed. | Indicator G-1: Number of countries that have multi-hazard early warning systems |
| DEFs | DIFs 1 | Influences on DABs |
|---|---|---|
| Ocean | T-W-S | Disruption of productive activities |
| Coast | T-W | Hit by strong winds |
| T-W-S | Hit by water flows | |
| T-W-S-F | Flooded by seawater | |
| T-R-F | Flooded | |
| Plain | T-W | Hit by strong winds |
| T-R-F | Flooded | |
| Mountain land | T-R-F | Flooded |
| T-R-F-L | Hit by debris flow |
Disclaimer/Publisher’s Note: The statements, opinions and data contained in all publications are solely those of the individual author(s) and contributor(s) and not of MDPI and/or the editor(s). MDPI and/or the editor(s) disclaim responsibility for any injury to people or property resulting from any ideas, methods, instructions or products referred to in the content. |
© 2023 by the authors. Licensee MDPI, Basel, Switzerland. This article is an open access article distributed under the terms and conditions of the Creative Commons Attribution (CC BY) license (https://creativecommons.org/licenses/by/4.0/).
Share and Cite
Li, B.; Gong, A.; Liu, L.; Li, J.; Li, J.; Li, L.; Pan, X.; Chen, Z. An Earth Observation Framework in Service of the Sendai Framework for Disaster Risk Reduction 2015–2030. ISPRS Int. J. Geo-Inf. 2023, 12, 232. https://doi.org/10.3390/ijgi12060232
Li B, Gong A, Liu L, Li J, Li J, Li L, Pan X, Chen Z. An Earth Observation Framework in Service of the Sendai Framework for Disaster Risk Reduction 2015–2030. ISPRS International Journal of Geo-Information. 2023; 12(6):232. https://doi.org/10.3390/ijgi12060232
Chicago/Turabian StyleLi, Boyi, Adu Gong, Longfei Liu, Jing Li, Jinglin Li, Lingling Li, Xiang Pan, and Zikun Chen. 2023. "An Earth Observation Framework in Service of the Sendai Framework for Disaster Risk Reduction 2015–2030" ISPRS International Journal of Geo-Information 12, no. 6: 232. https://doi.org/10.3390/ijgi12060232