

Context-Aware Point-of-Interest Recommendation Based on Similar User Clustering and Tensor Factorization

Abstract
:1. Introduction
- We define a user activity model and a user similarity model that can integrate contextual information of users’ check-in behavior to calculate user activity and user similarity;
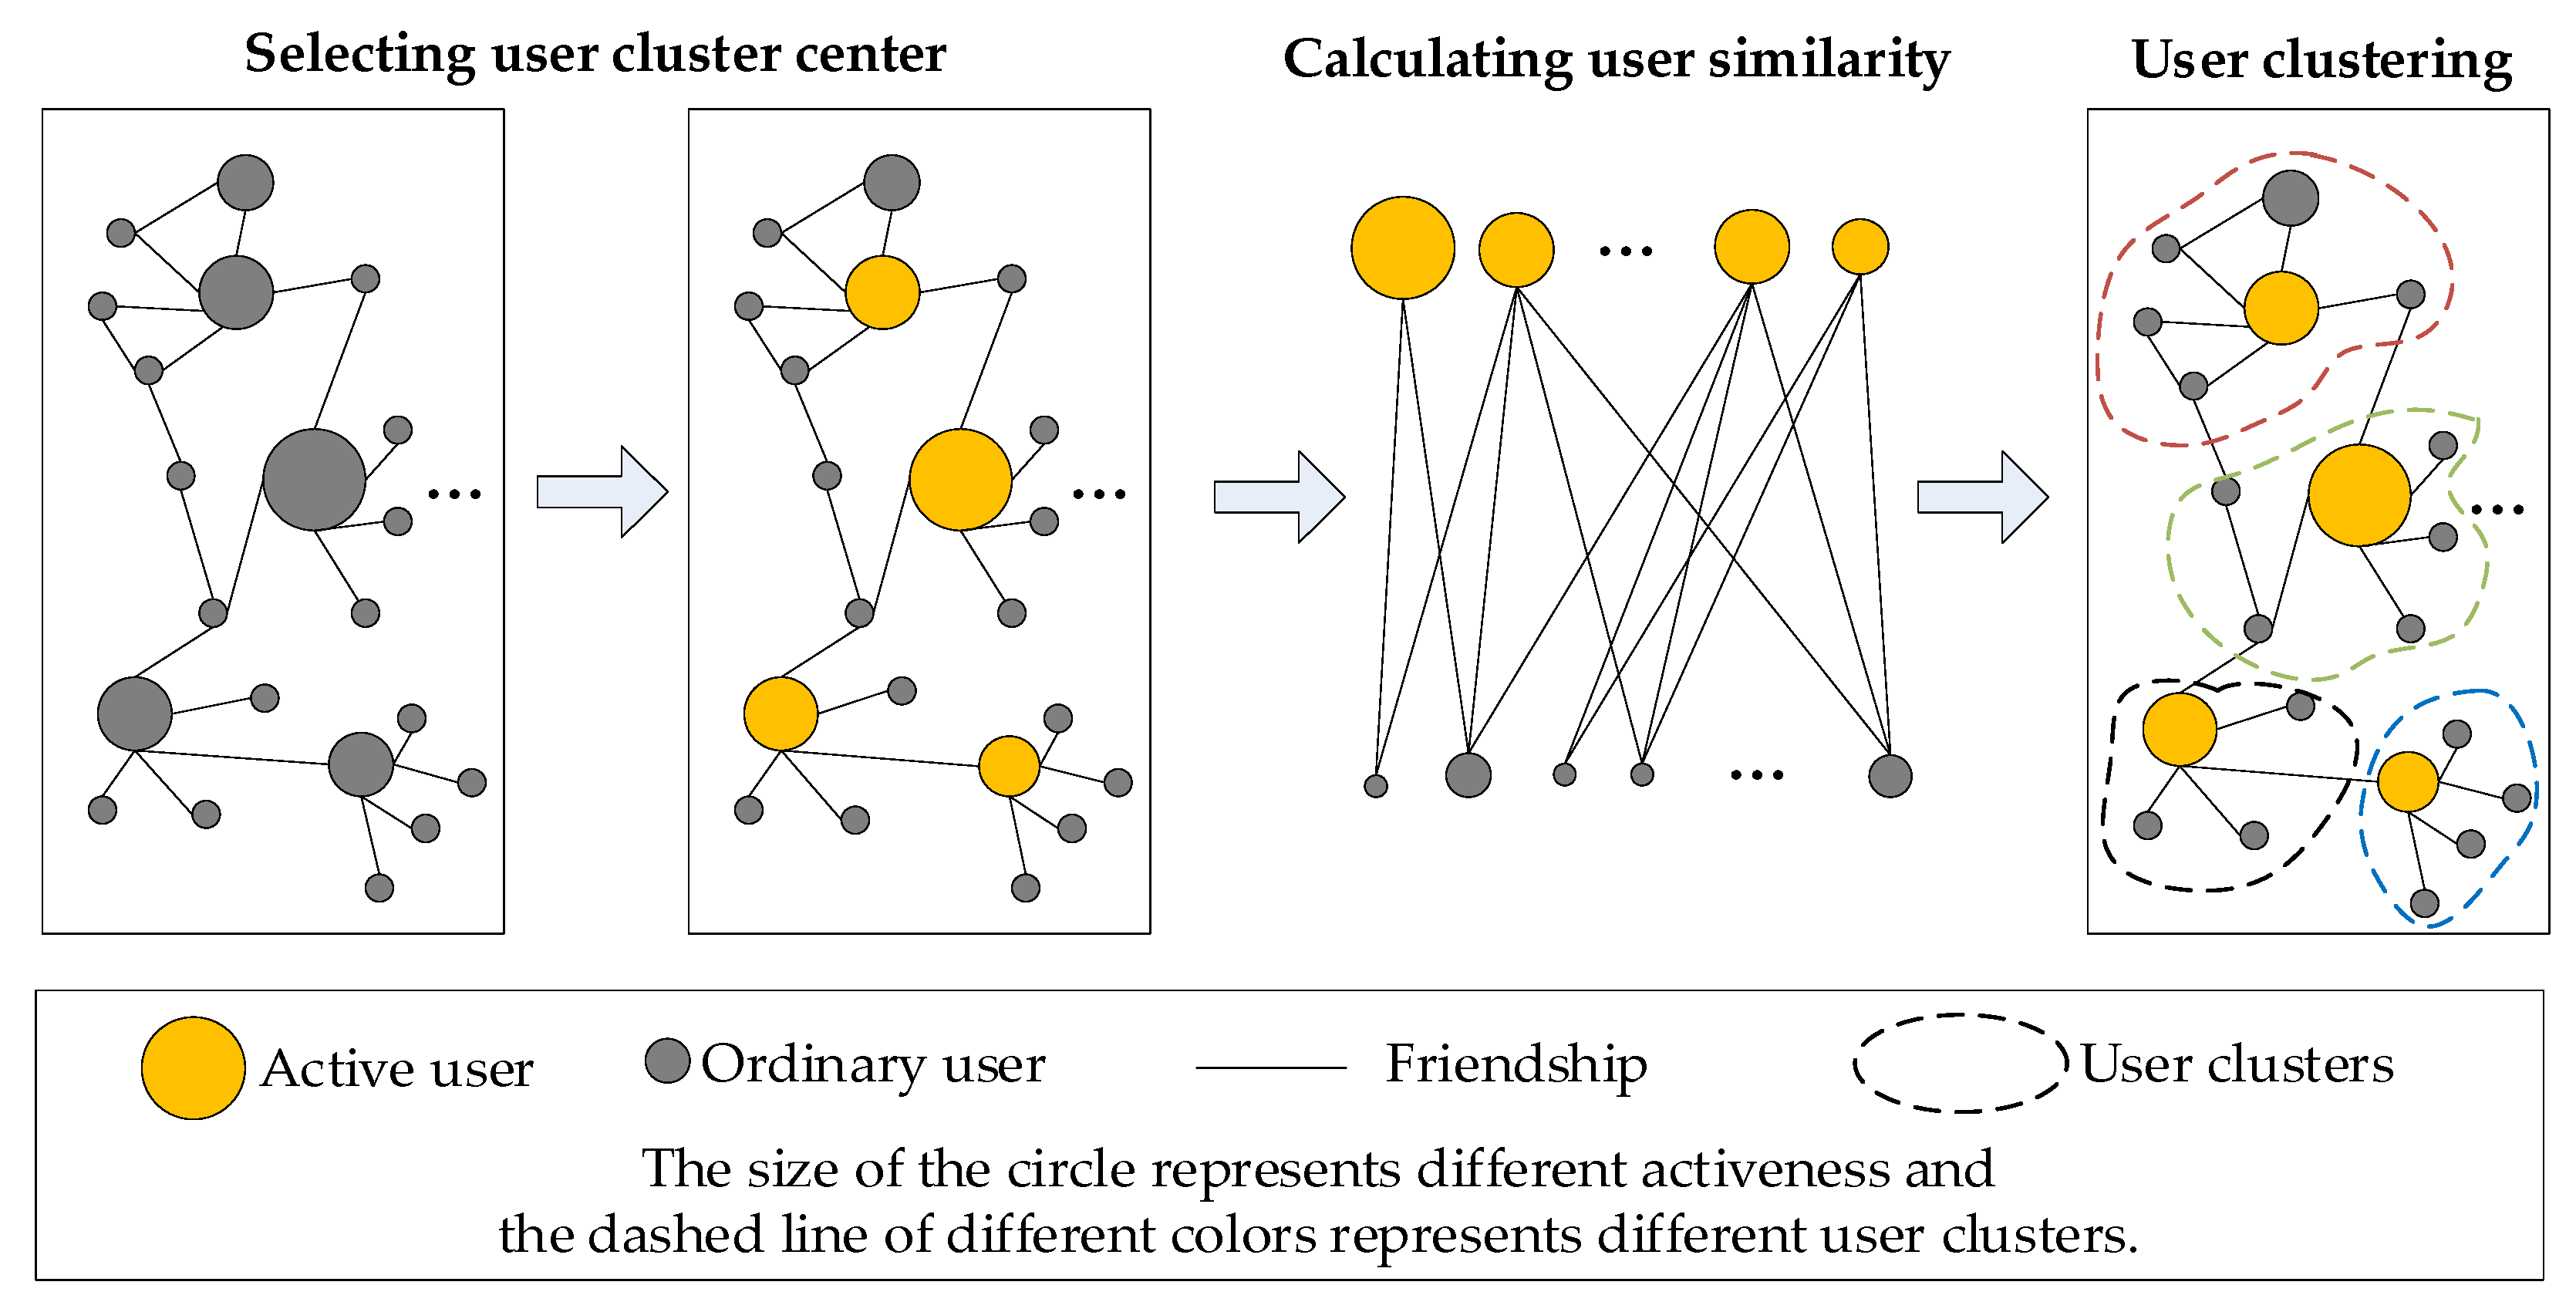
- A similar user clustering method based on user activity and user similarity is presented to select the most influential active users as clustering centers based on user activity and to cluster users into several similar user clusters according to user similarity;
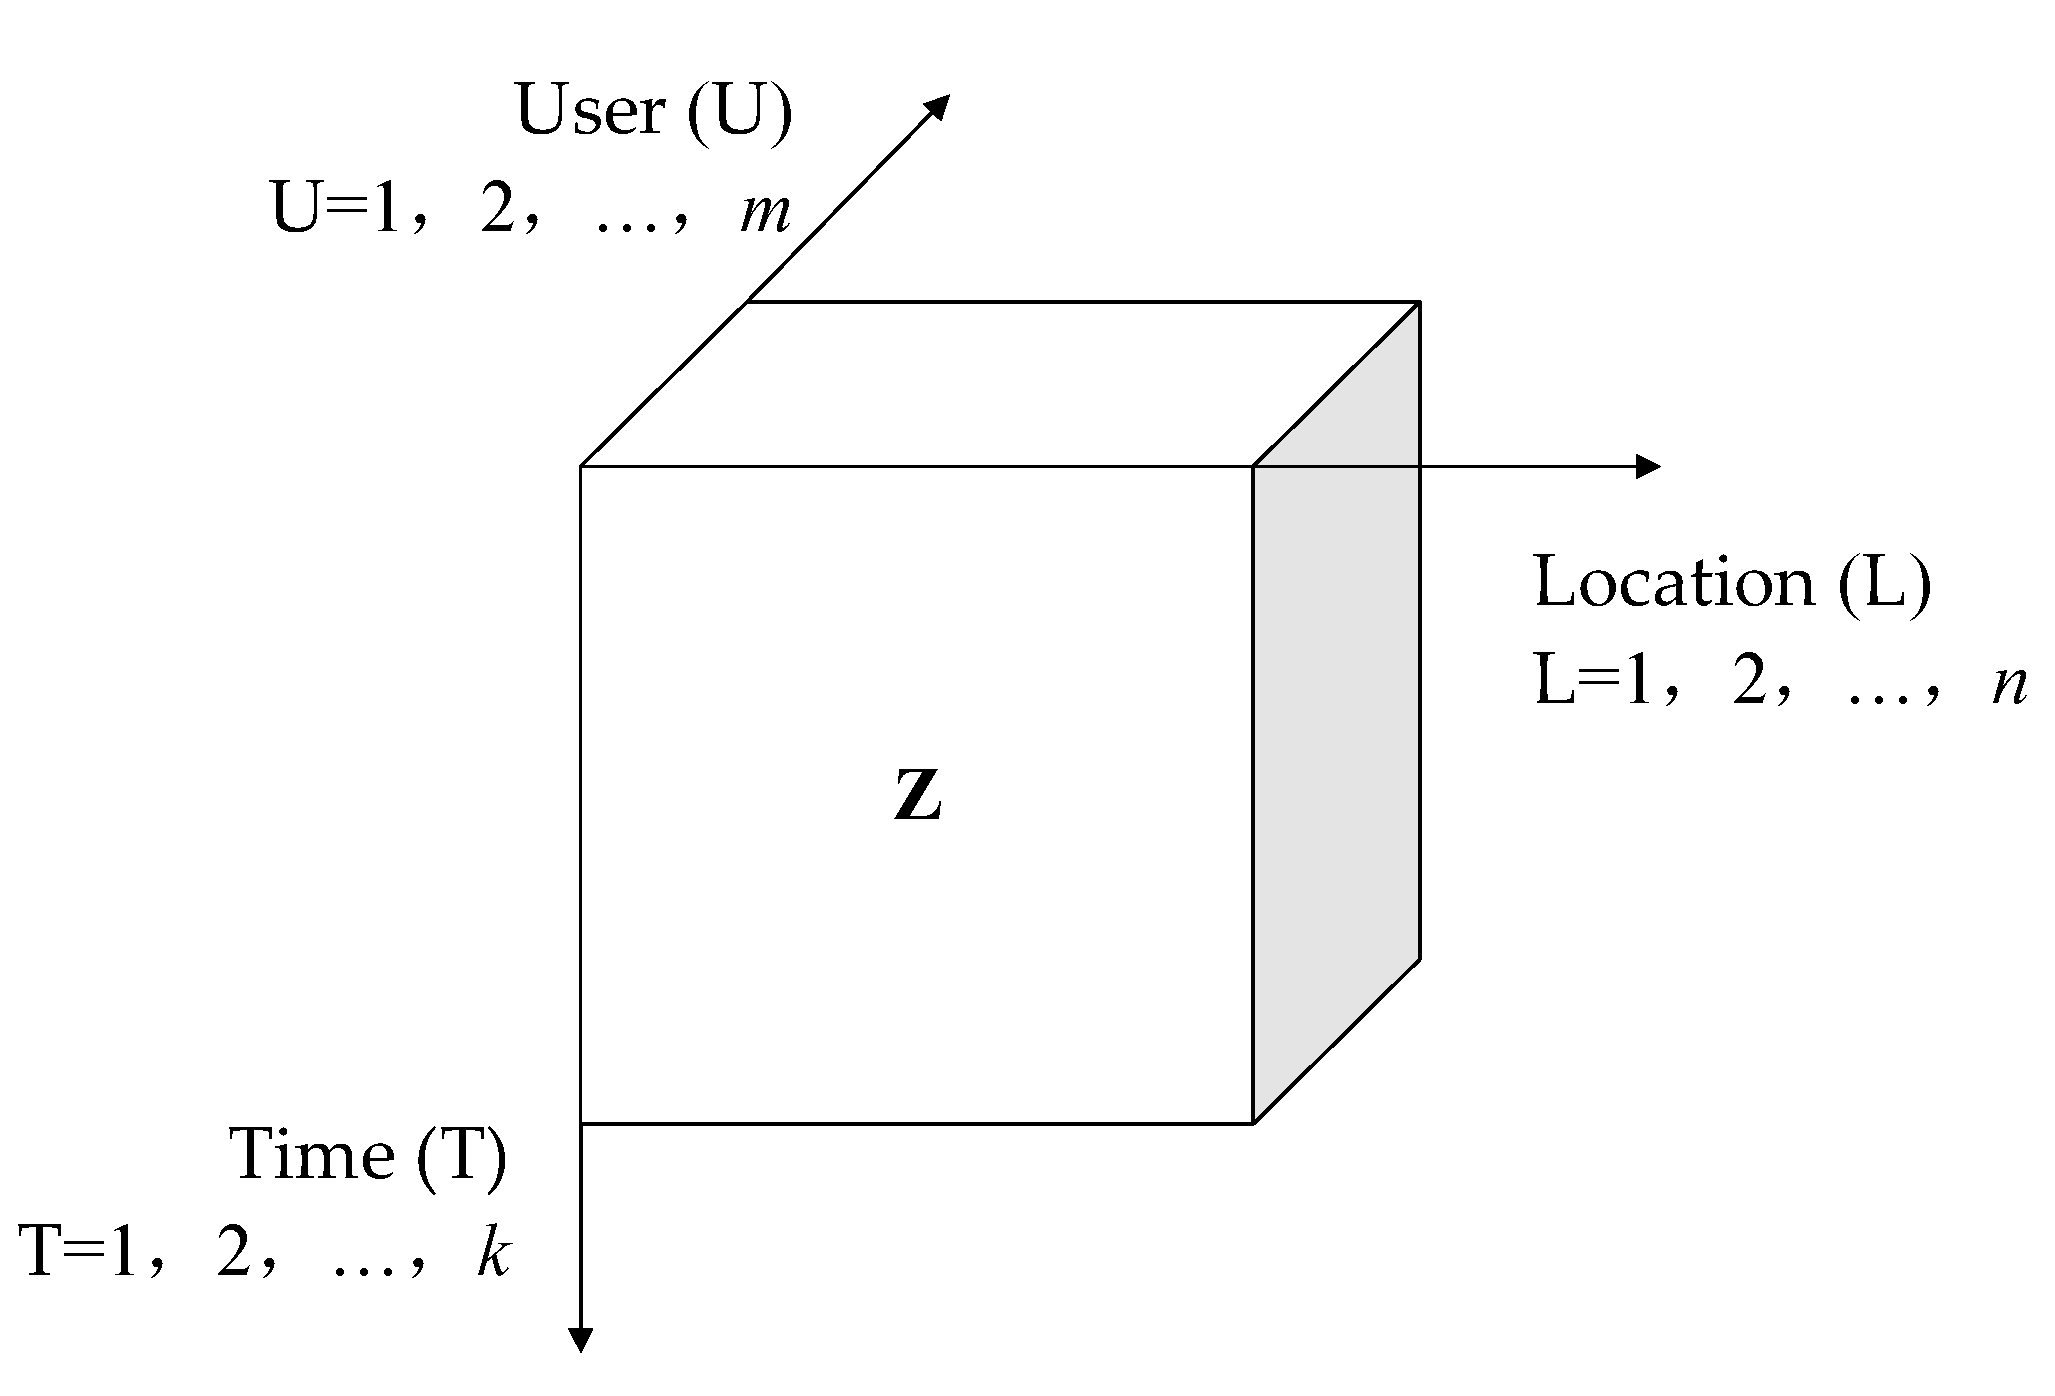
- A U-L-T tensor that incorporates contextual information using user activity, POI popularity, and time slot popularity as the eigenvalues in the U, L, and T dimensions, which improves the integration of contextual information, is presented;
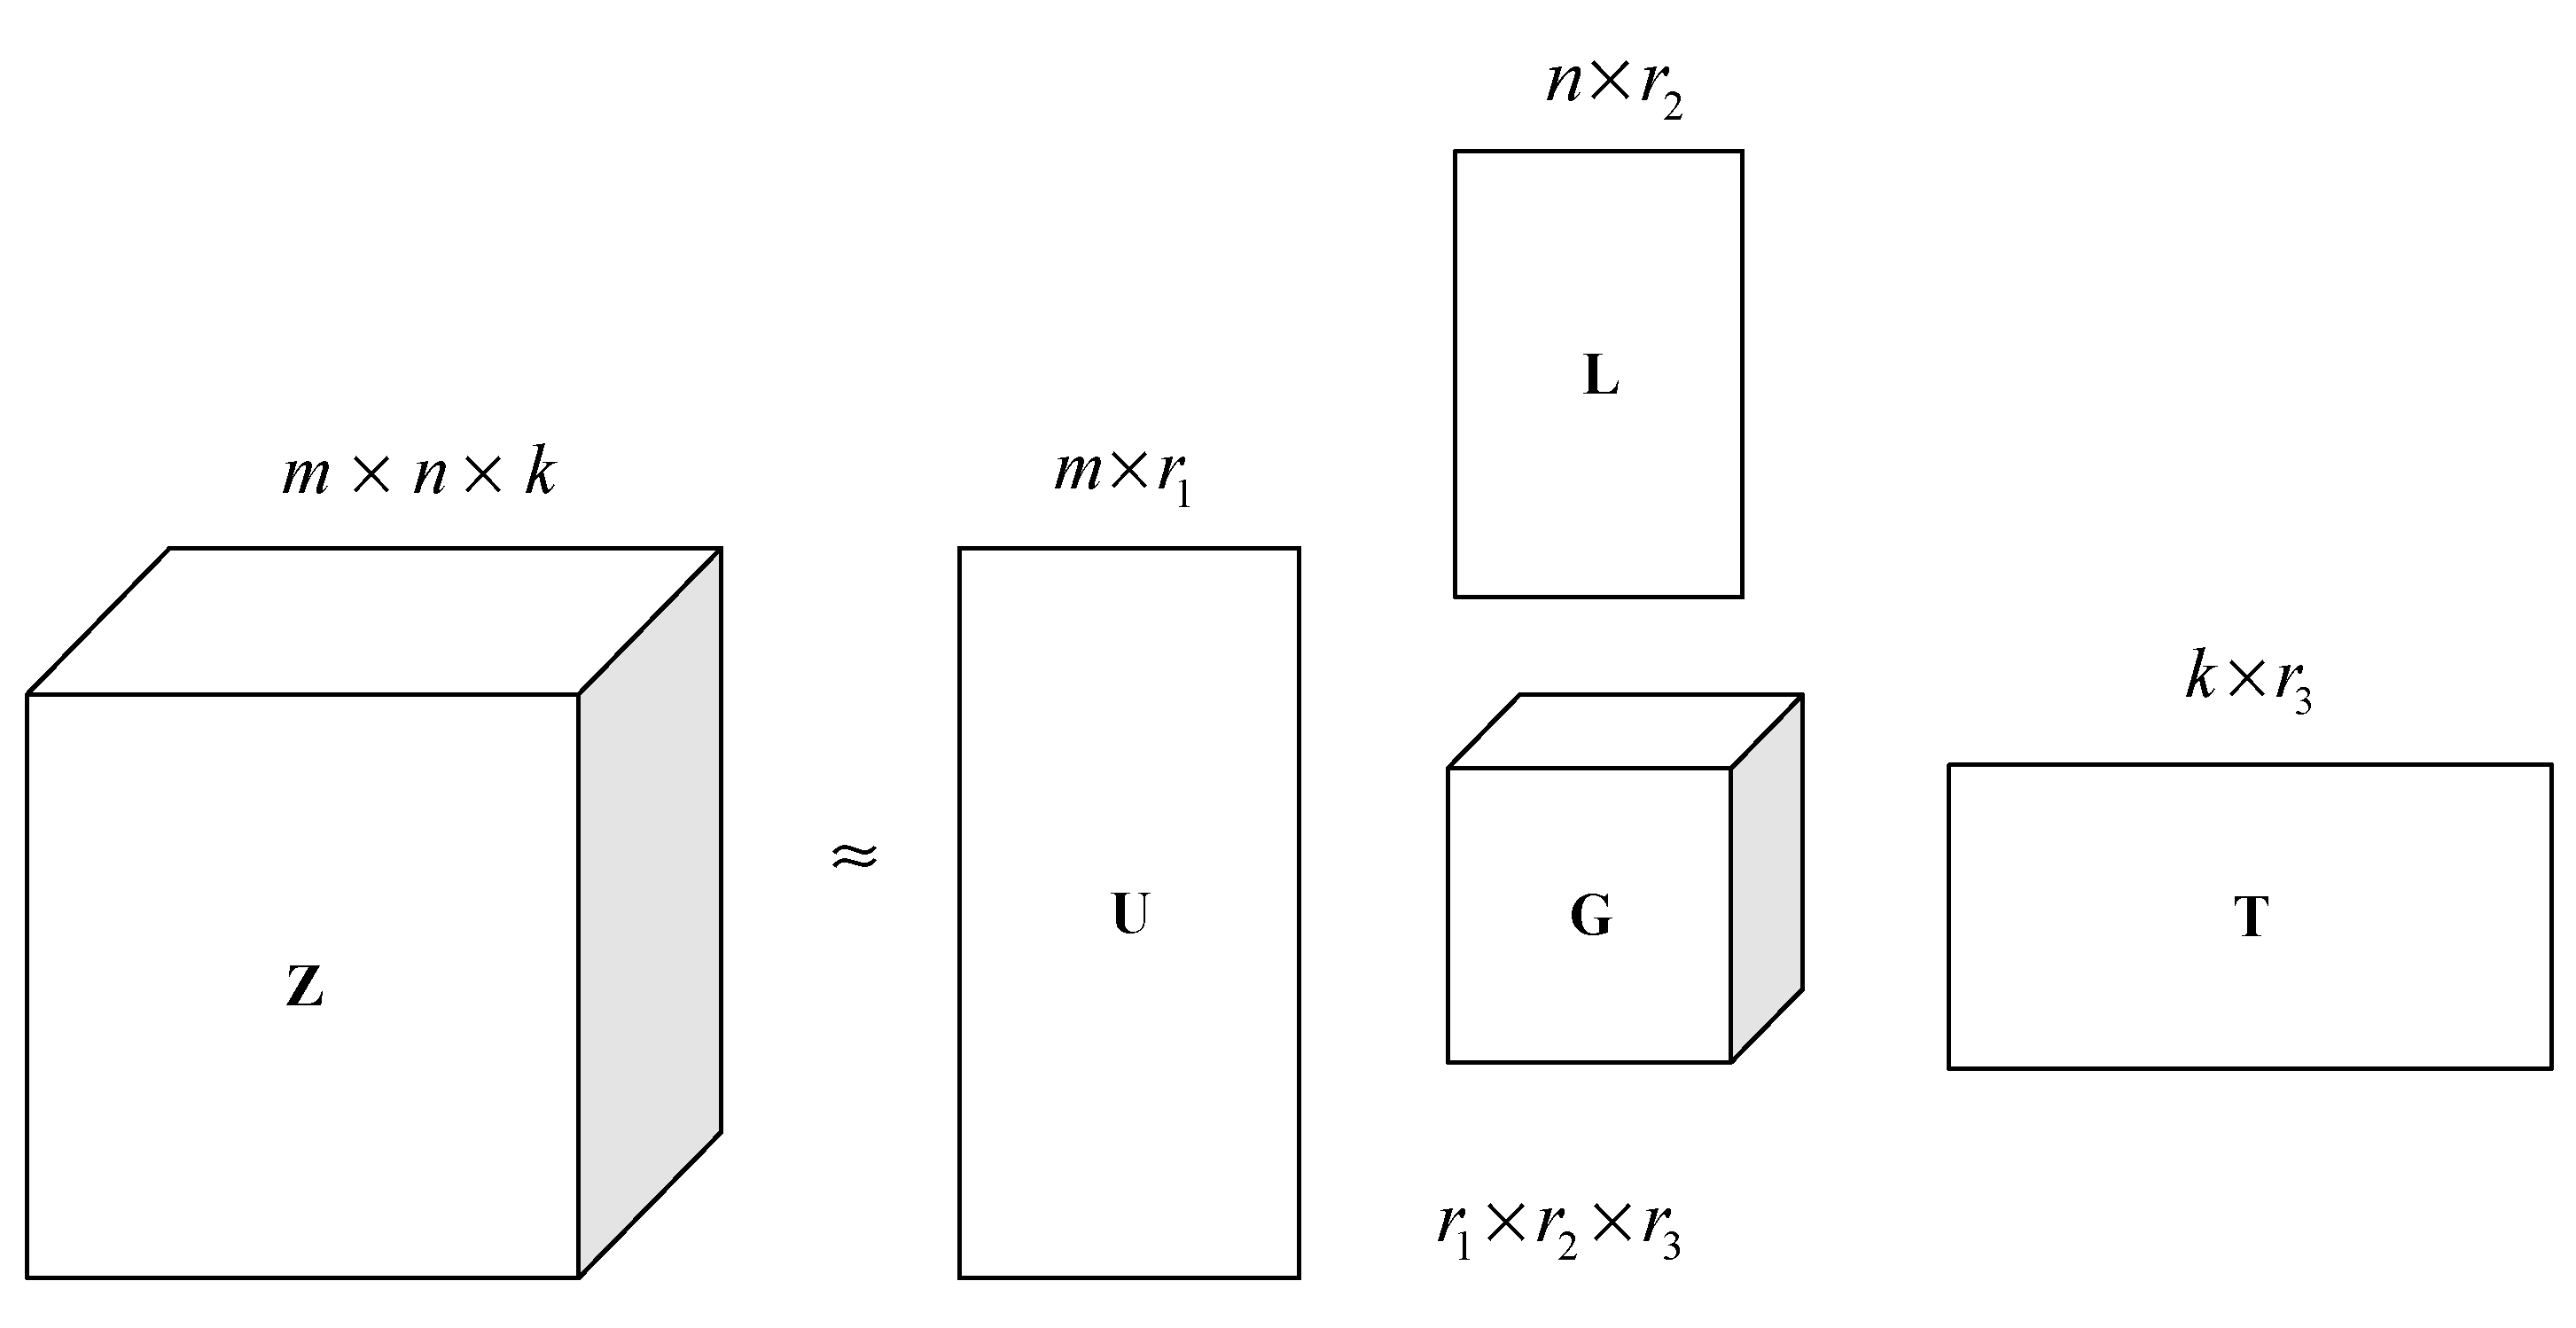
- The CULT-TF recommendation method based on tensor factorization, which decreases the complexity of the matrix-integrating rich contextual information by clustering similar users, clustering POIs into regions of interest (ROIs), and encoding check-in timestamps to time slots, to realize the reduction of the U, L, and T dimension, respectively, is proposed. In this way, CULT-TF reduces the complexity of the recommendation matrix while integrating the richness of the contextual information.
2. Related Work
2.1. POI Recommendation Based on Geographical Influence
2.2. POI Recommendation Based on Temporal Influence
2.3. POI Recommendation Based on Social Influence
2.4. POI Recommendation Based on Text Context Influence
2.5. POI Recommendation Based on Multiple-Context Information
3. Overview
3.1. Similar User Clustering
3.2. U-L-T Tensor Modeling
3.3. Tensor Factorization
4. The Proposed CULT-TF Method
4.1. Similar User Clustering Based on User Similarity
4.1.1. User Activity Model
4.1.2. User Similarity Model
4.2. U-L-T Tensor Modeling with the Integration of Contextual Information
4.3. TOP-N POIs Based on Tensor Factorization
5. Experiments
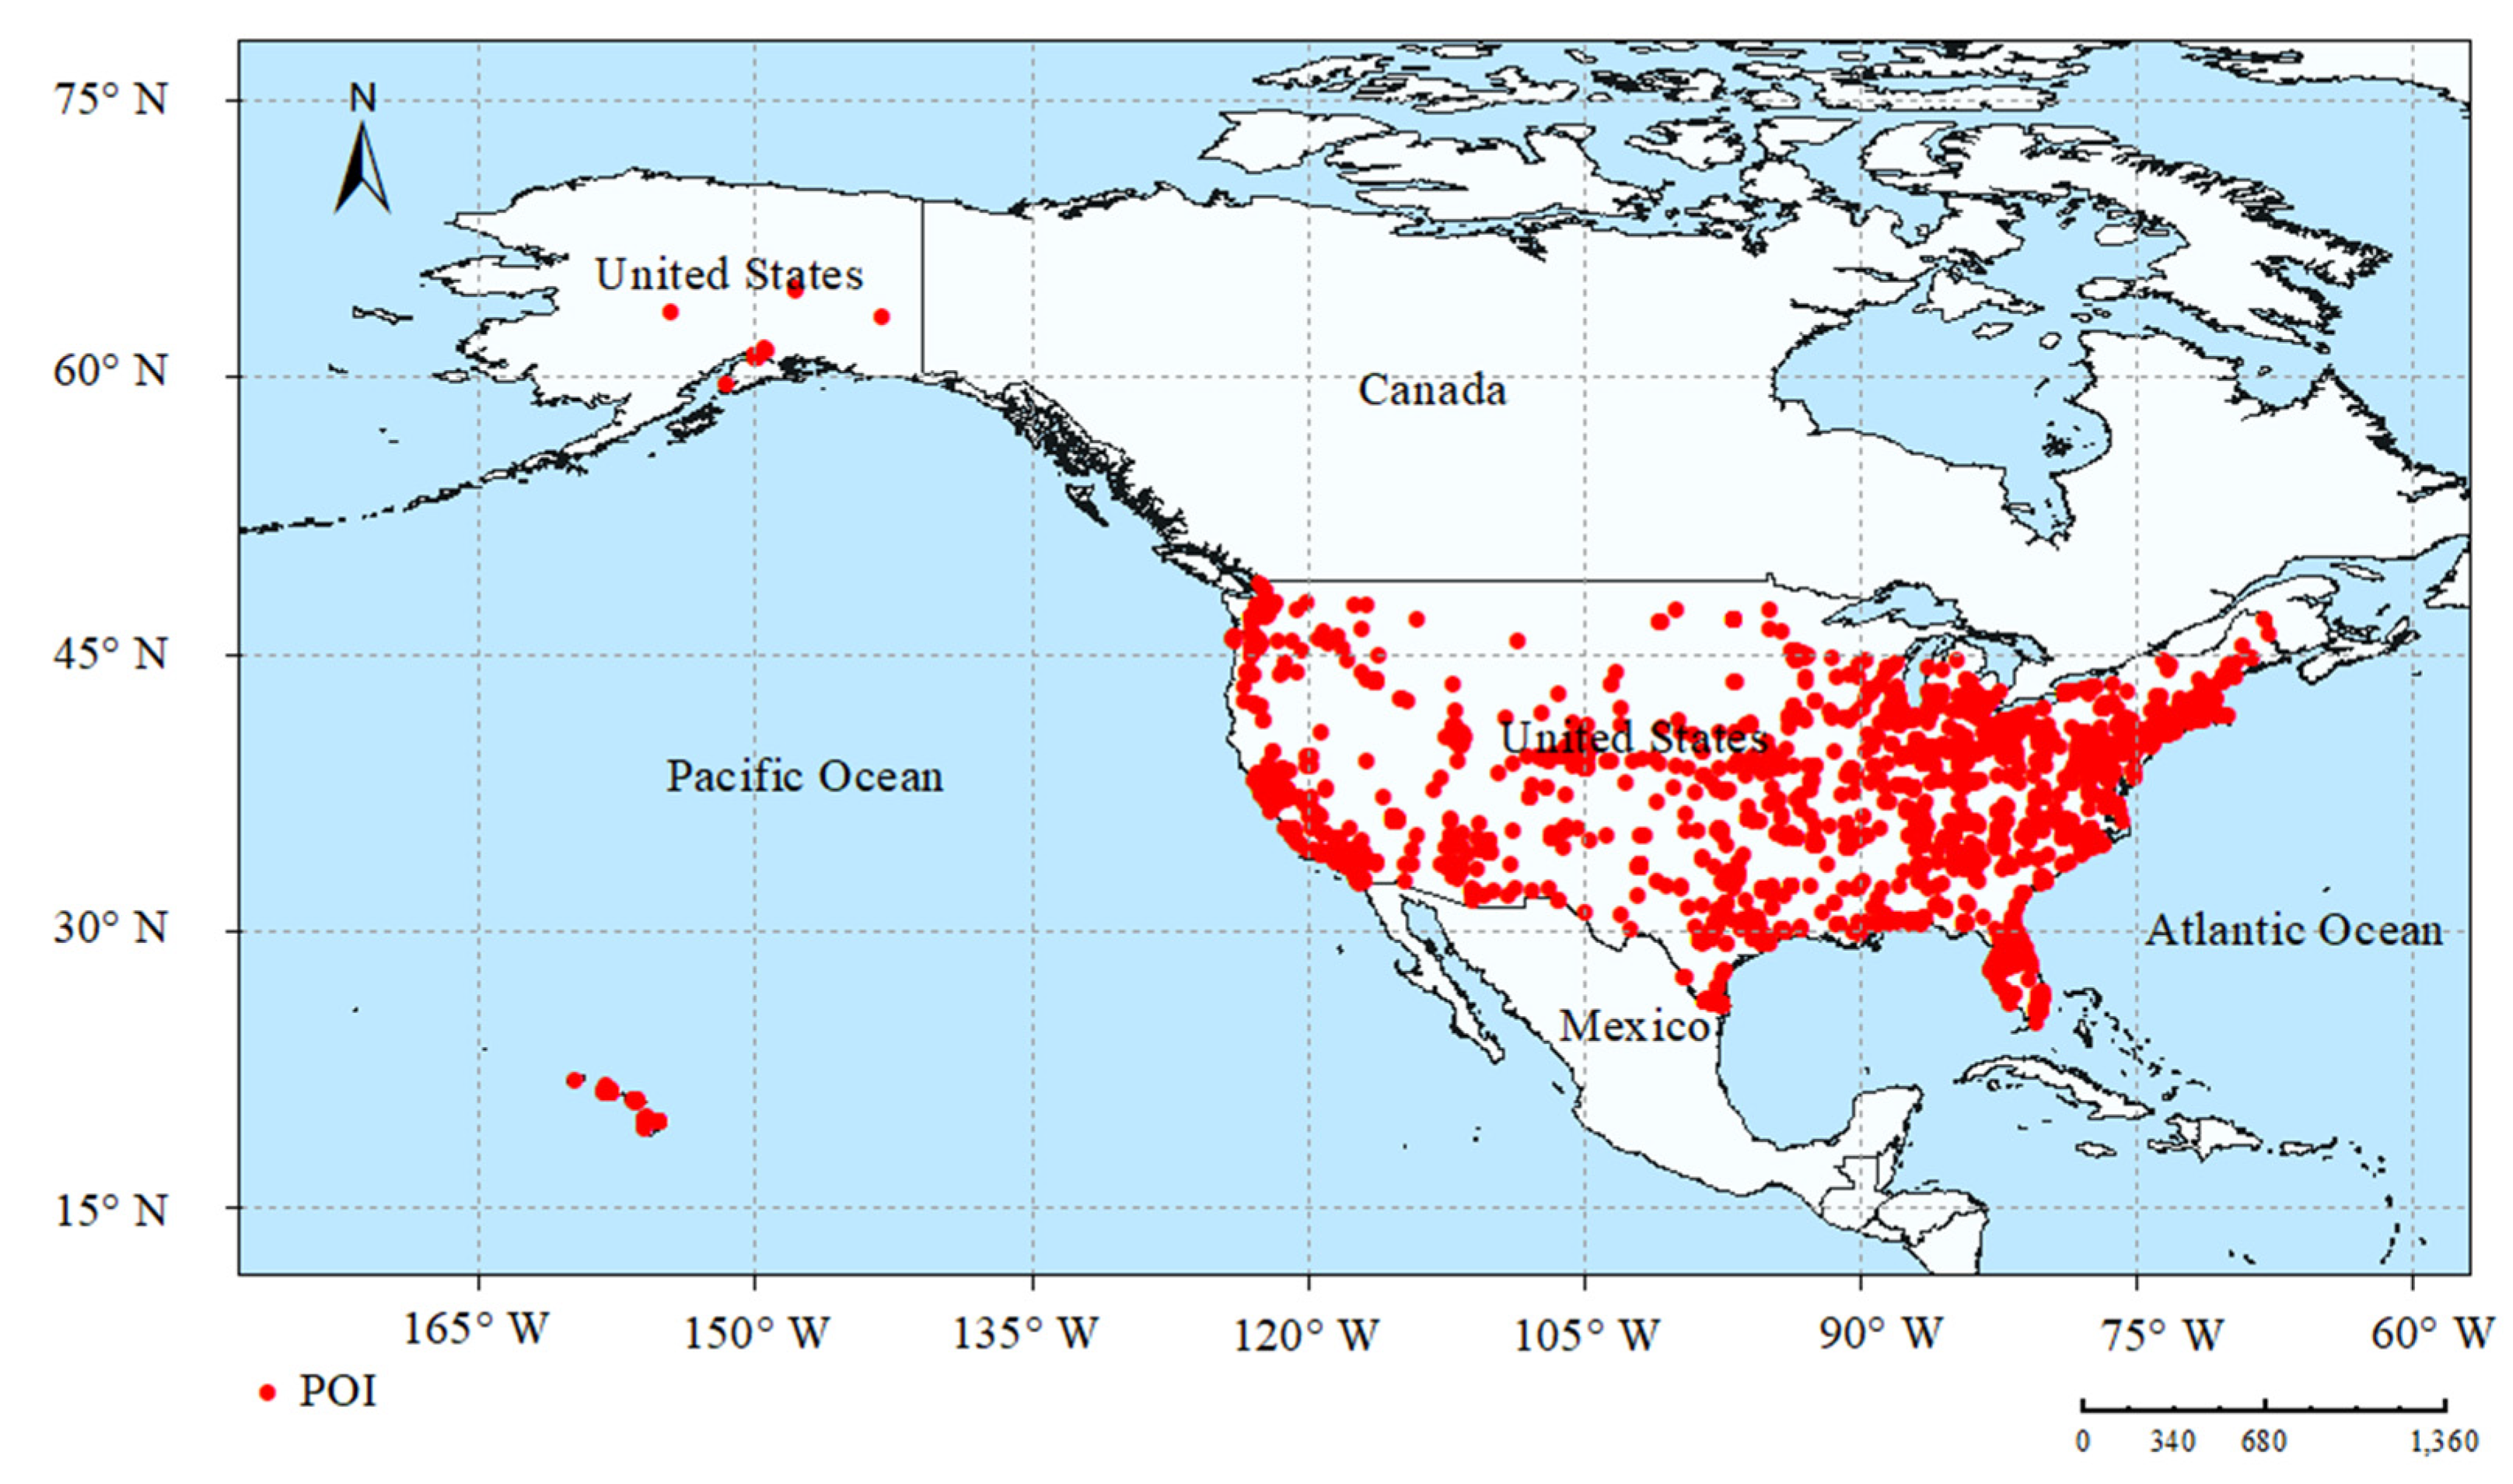
5.1. Datasets
5.2. Evaluation Metrics
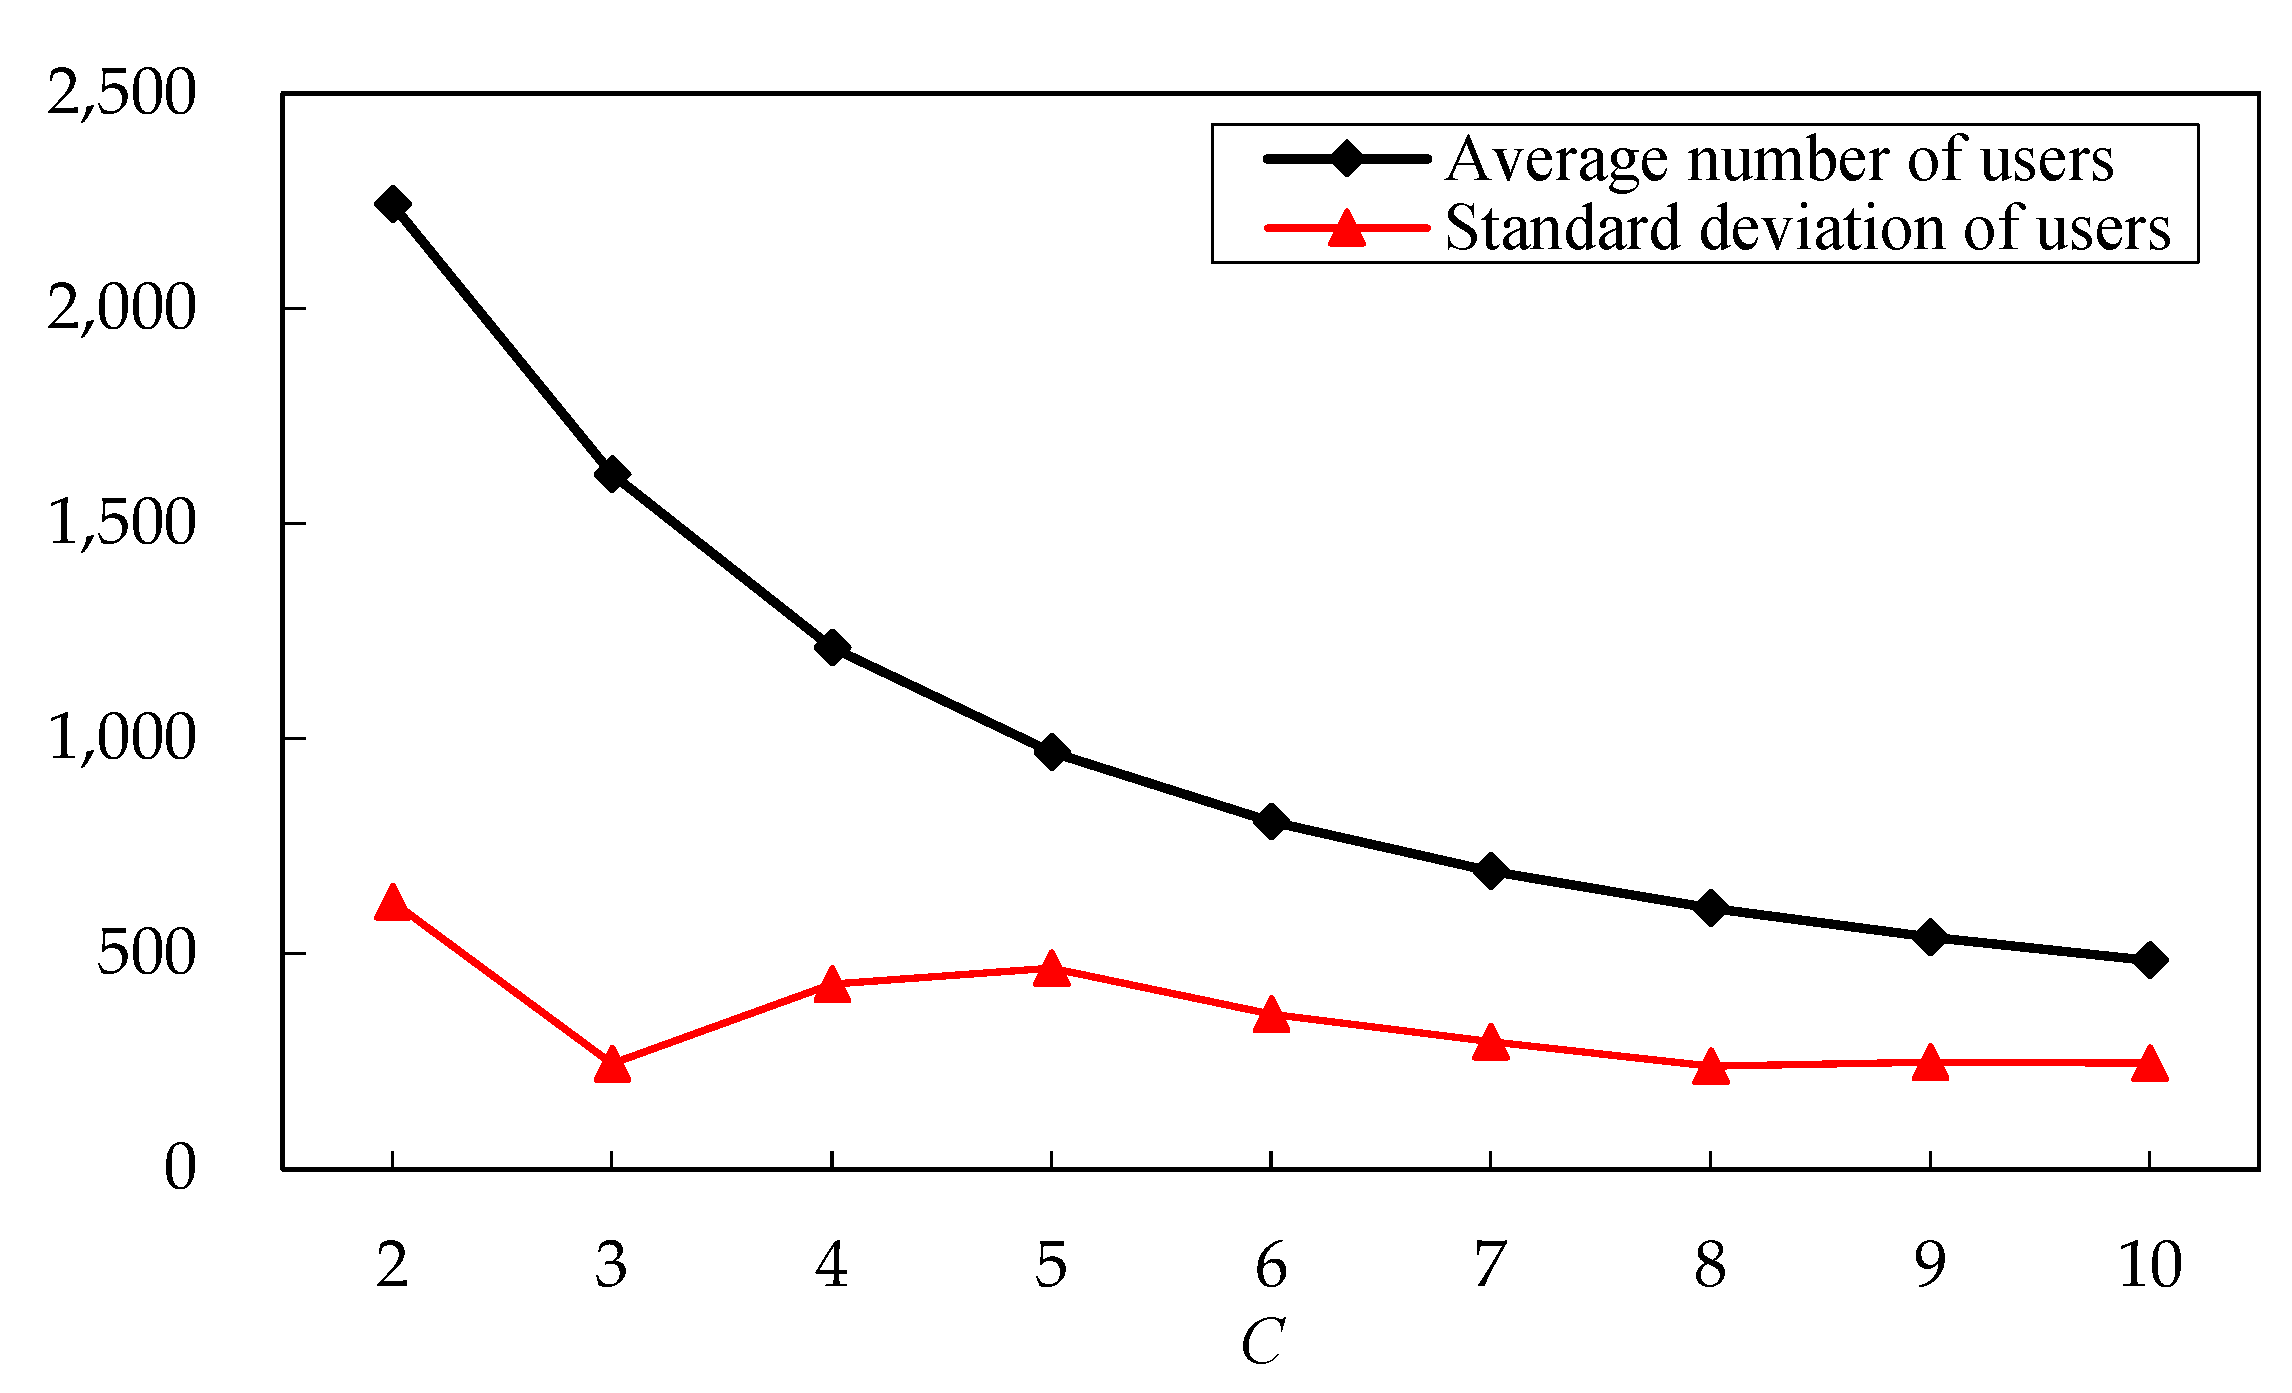
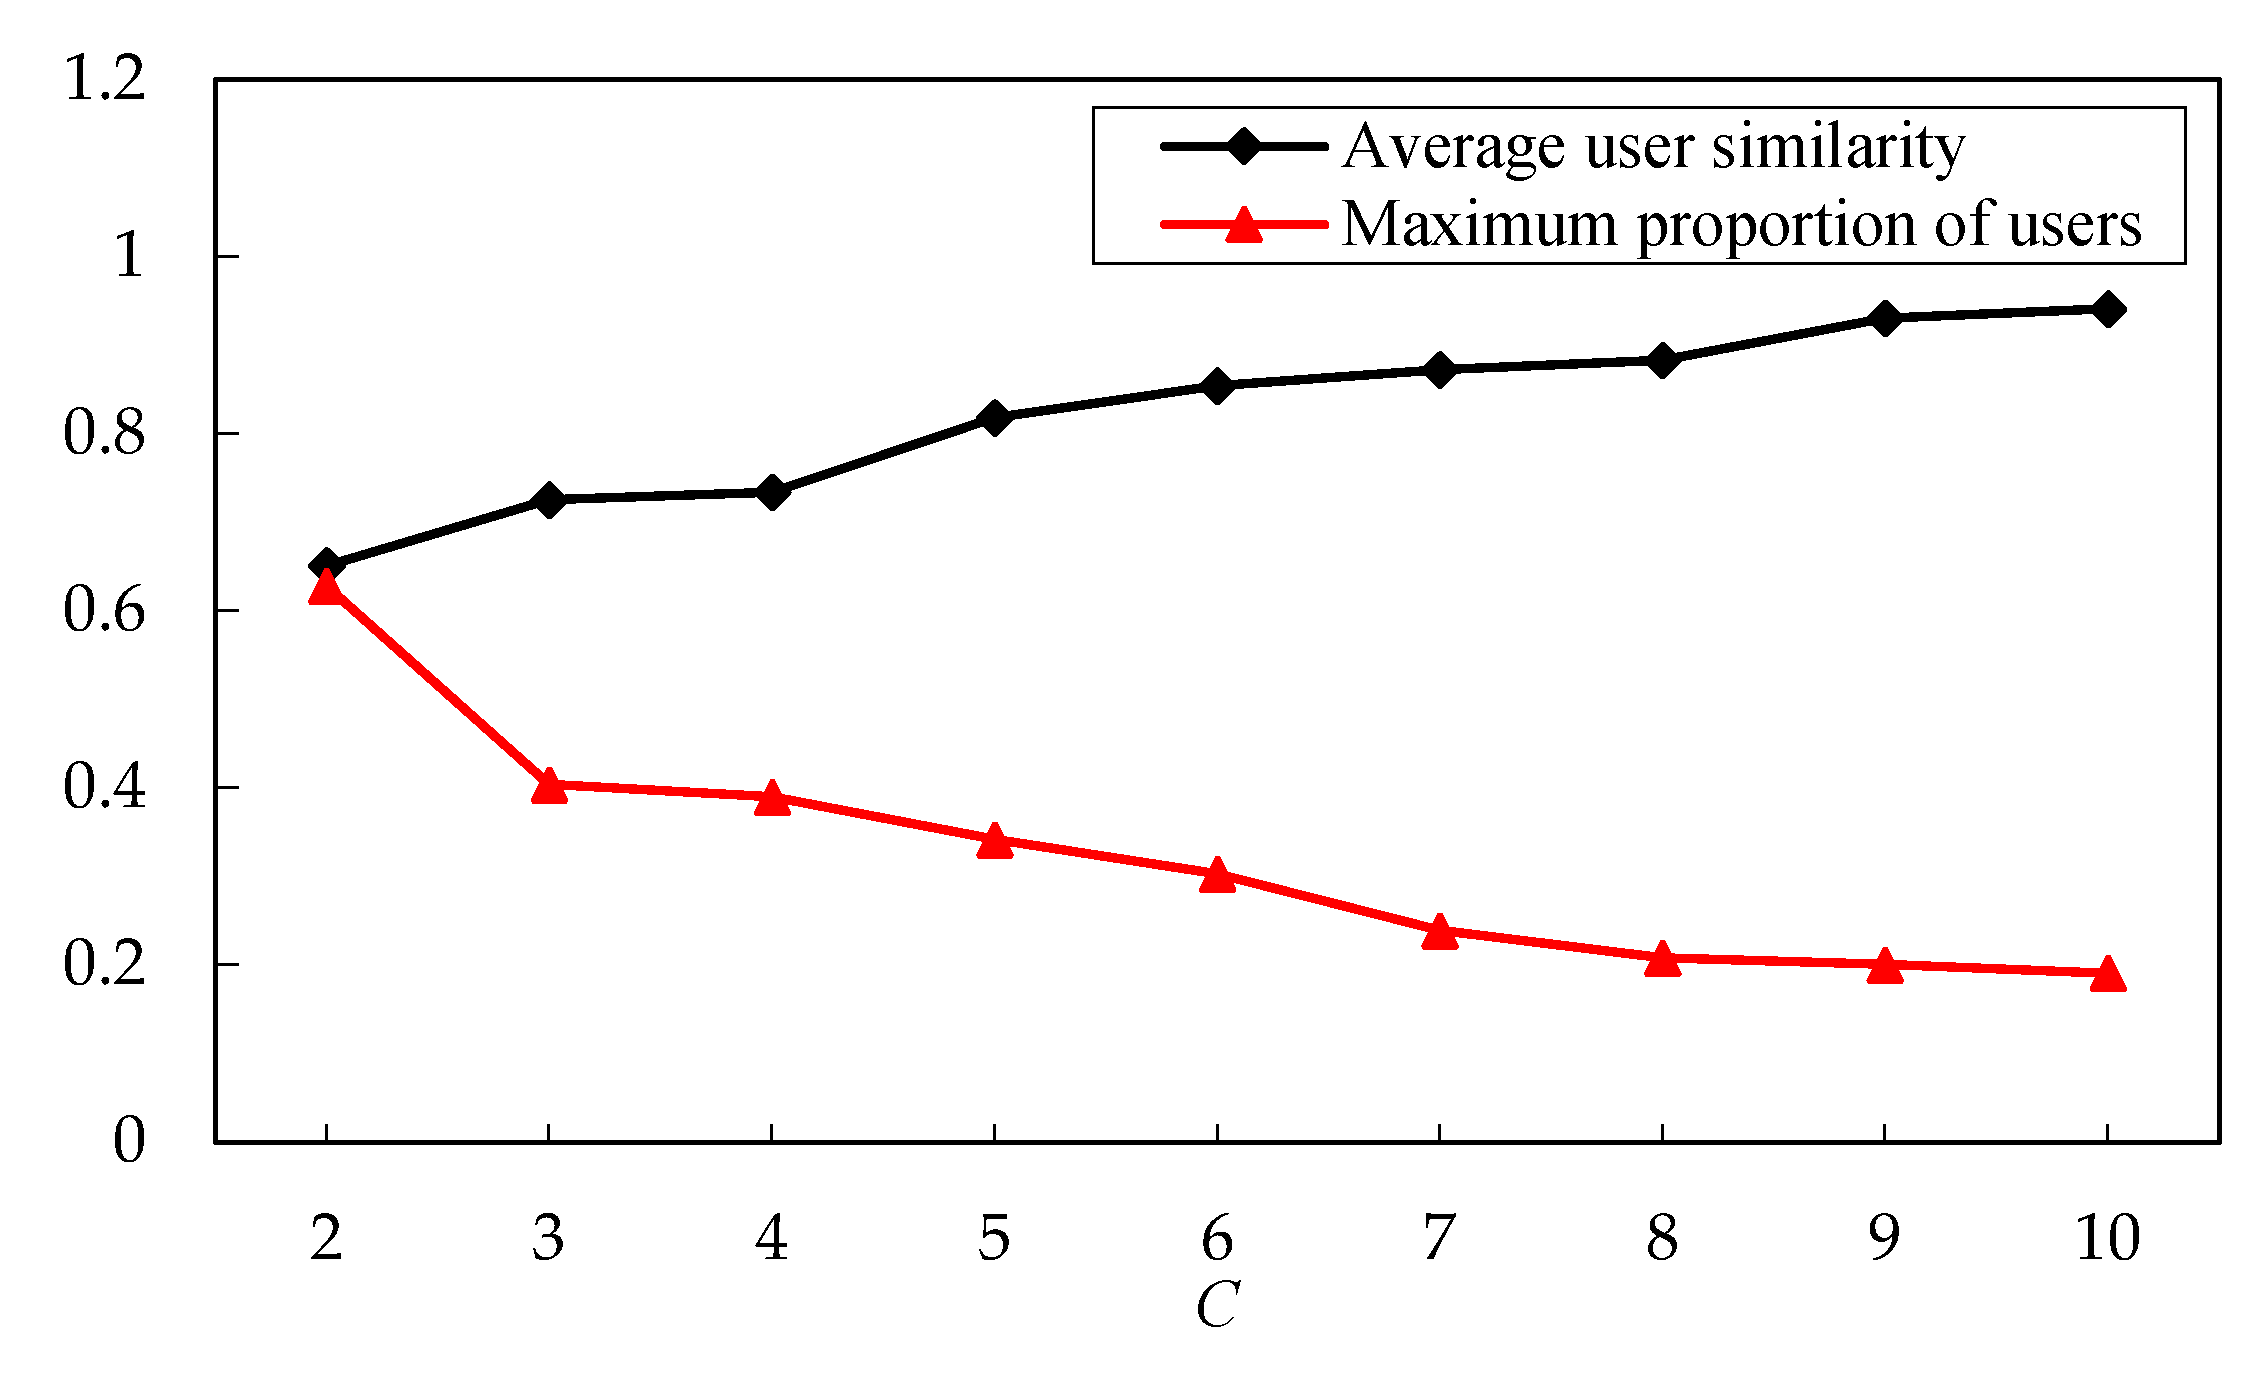
5.3. Clustering Parameter Analysis
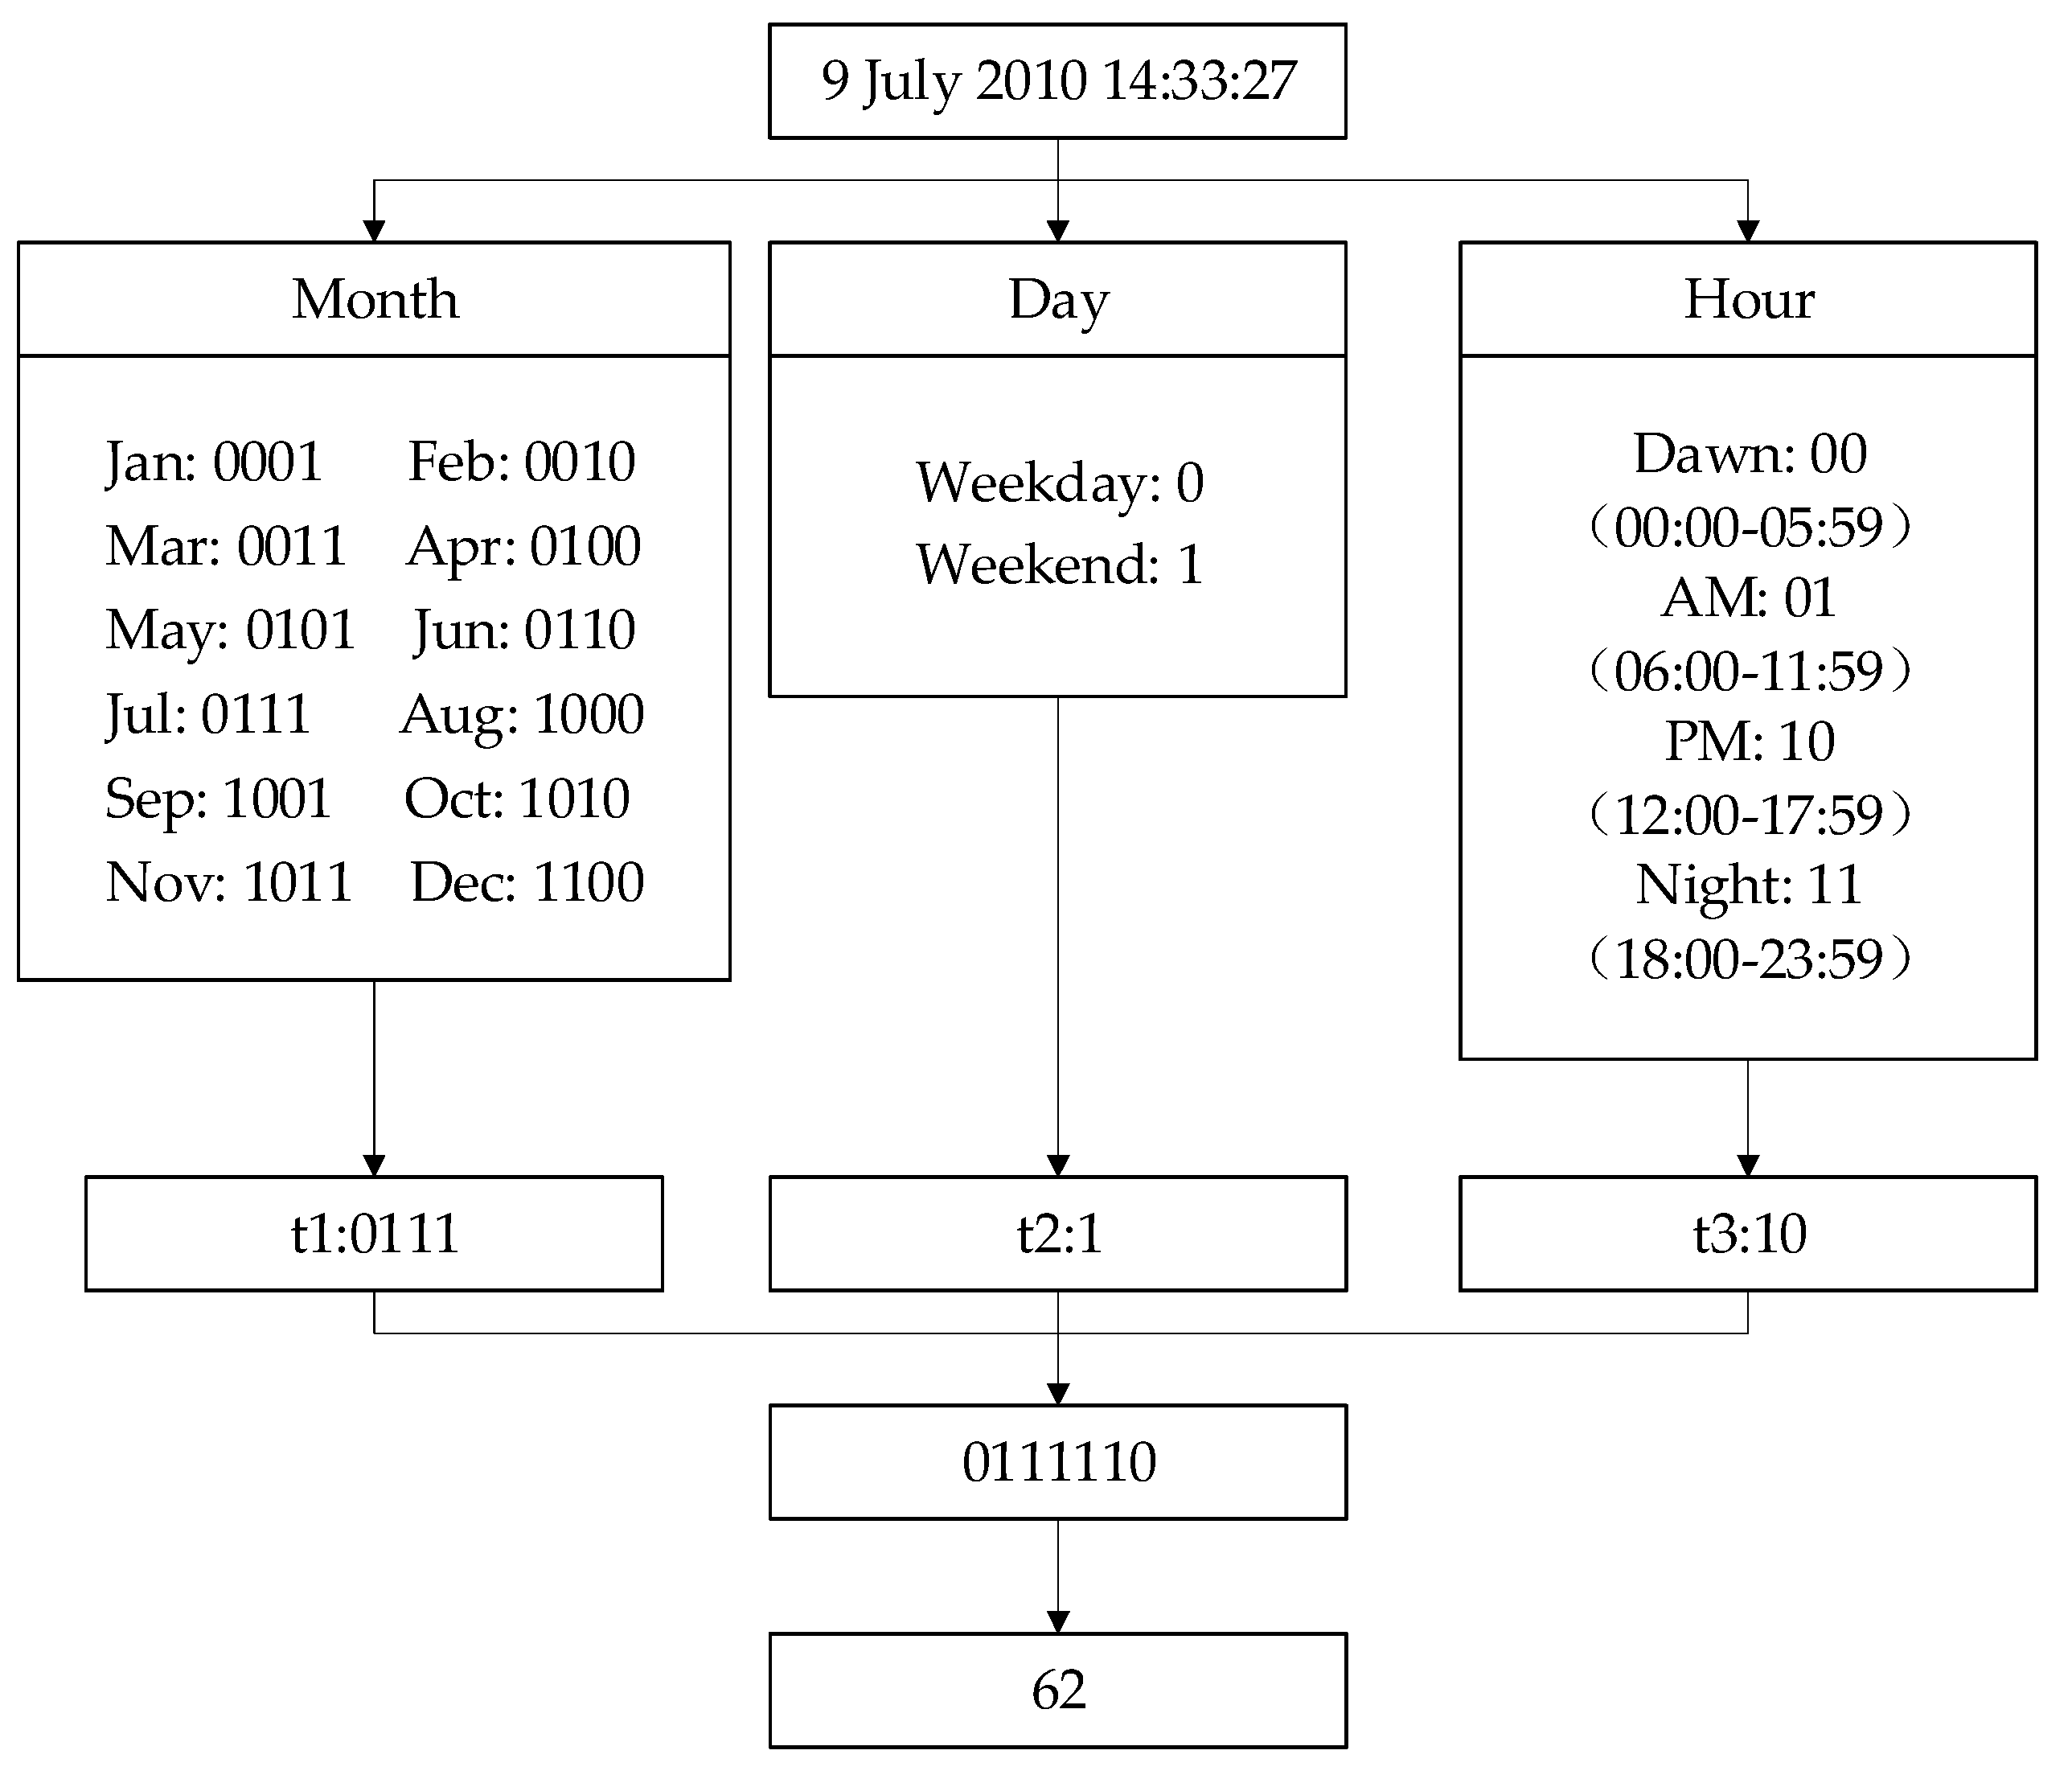
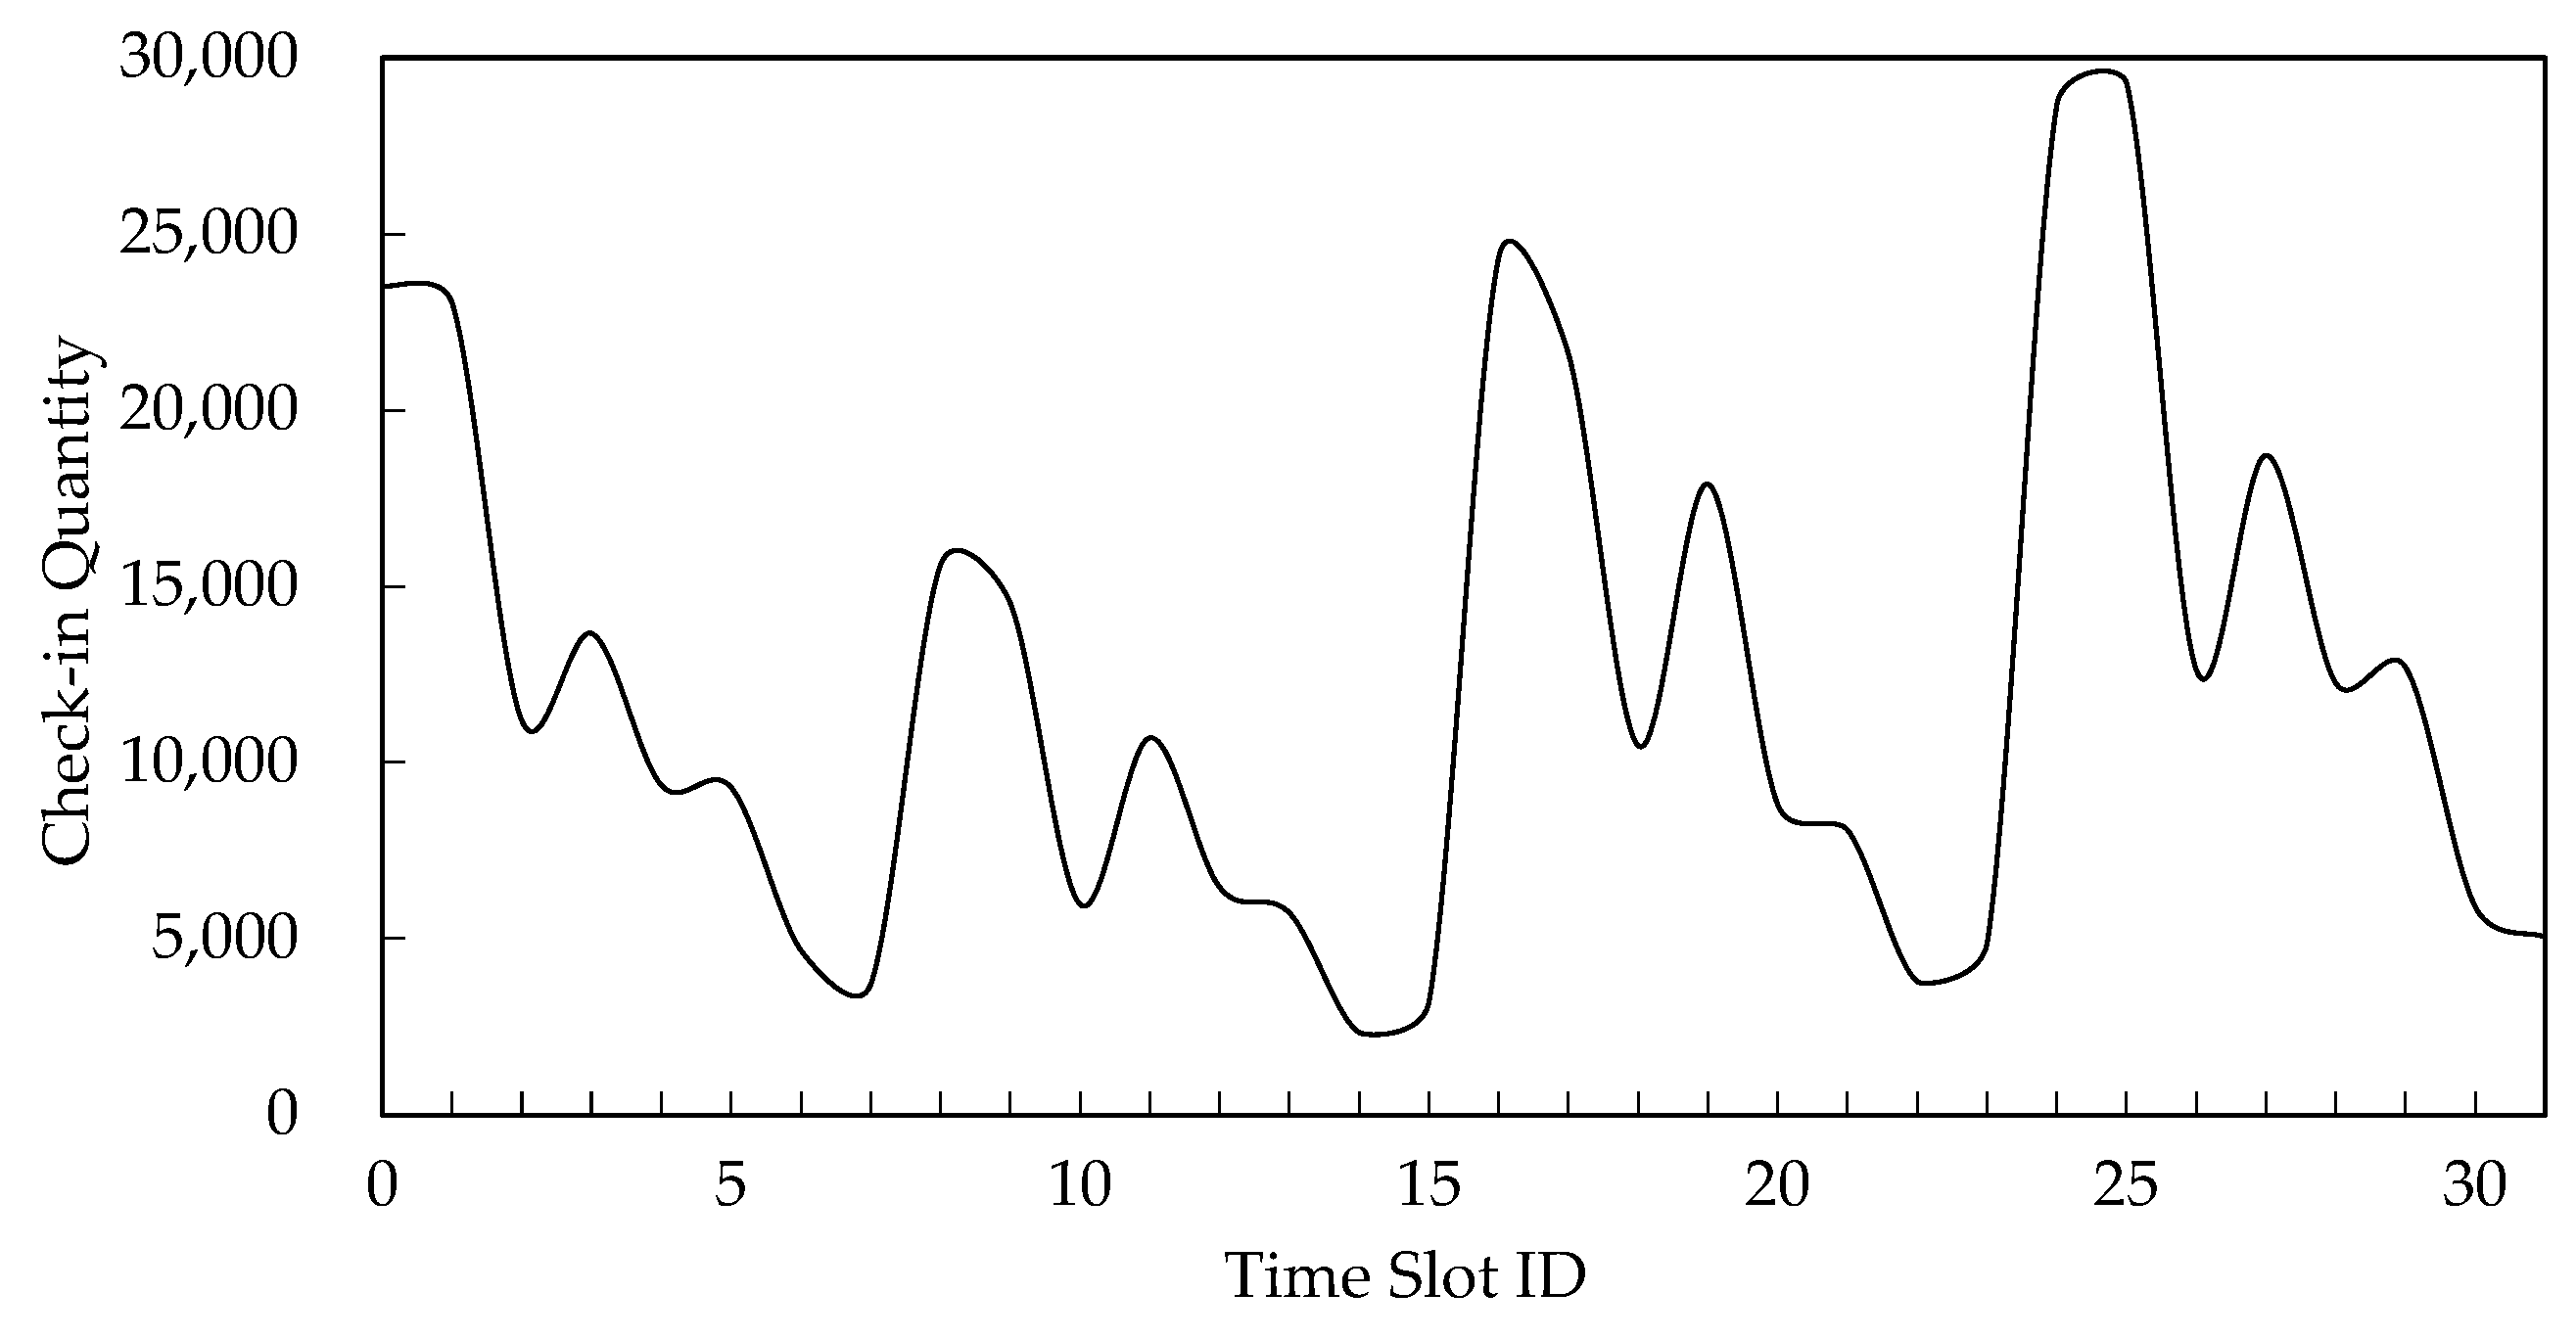
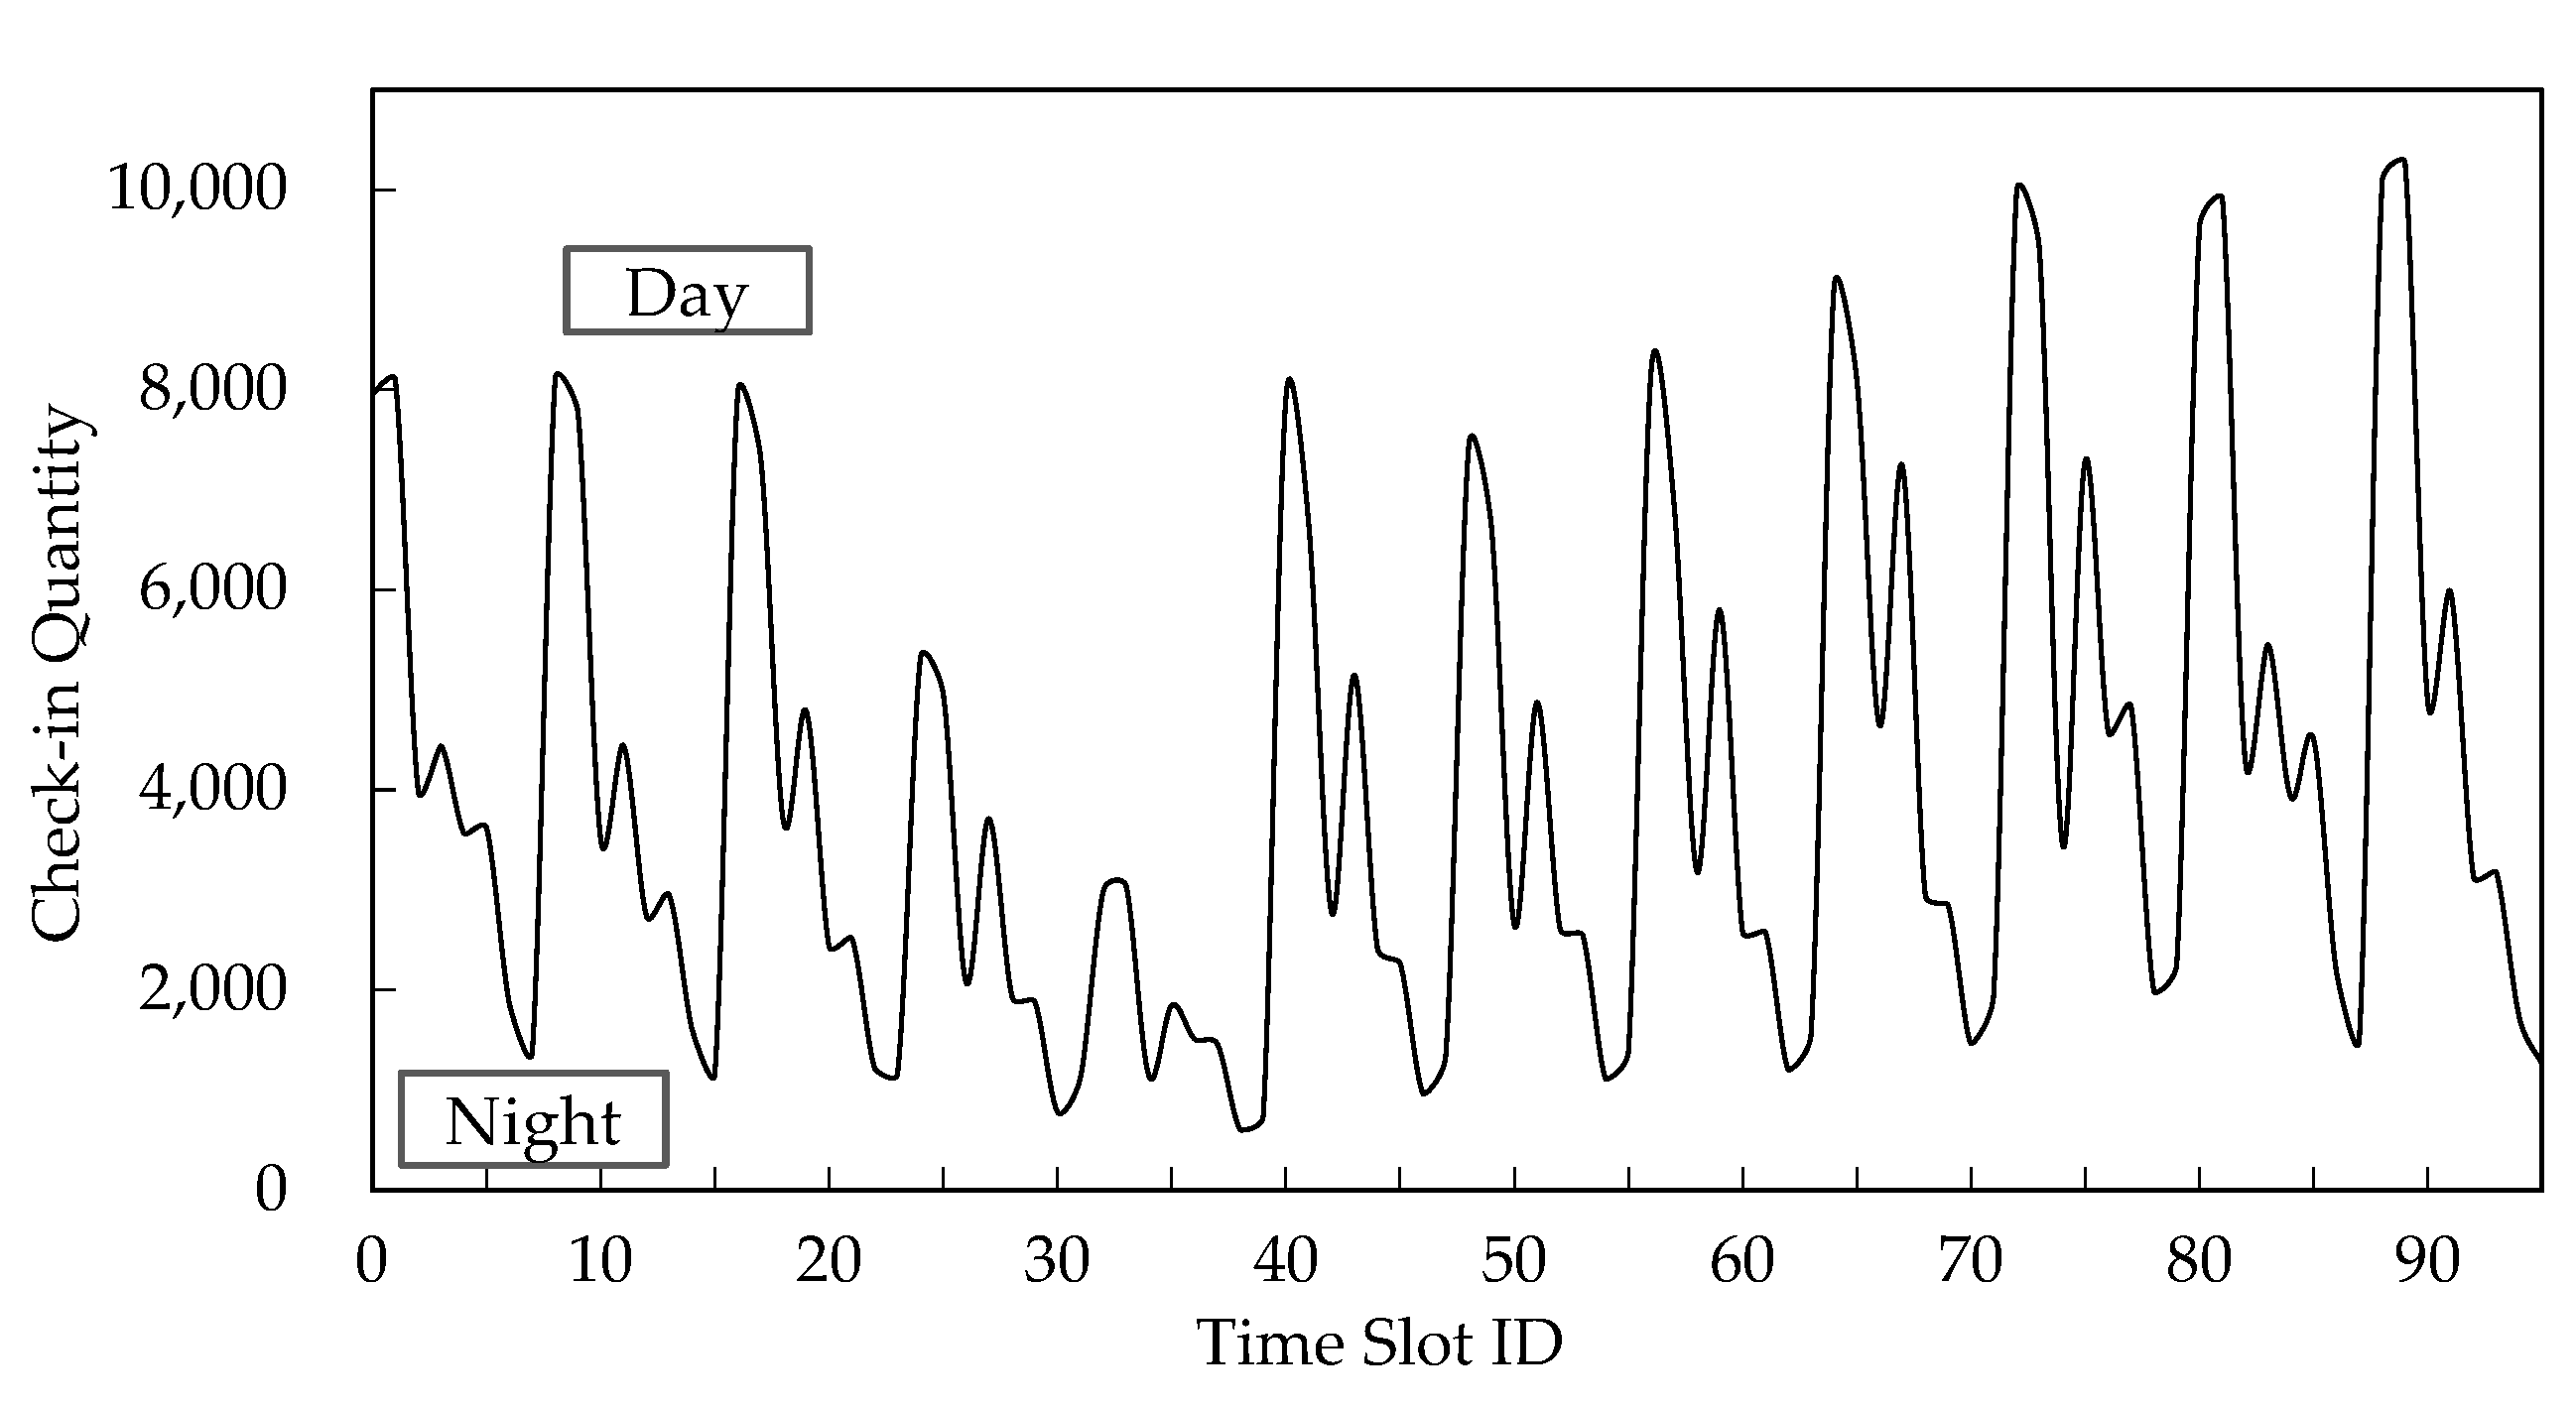
5.4. Time Slot Analysis
5.5. Experimental Results and Analysis
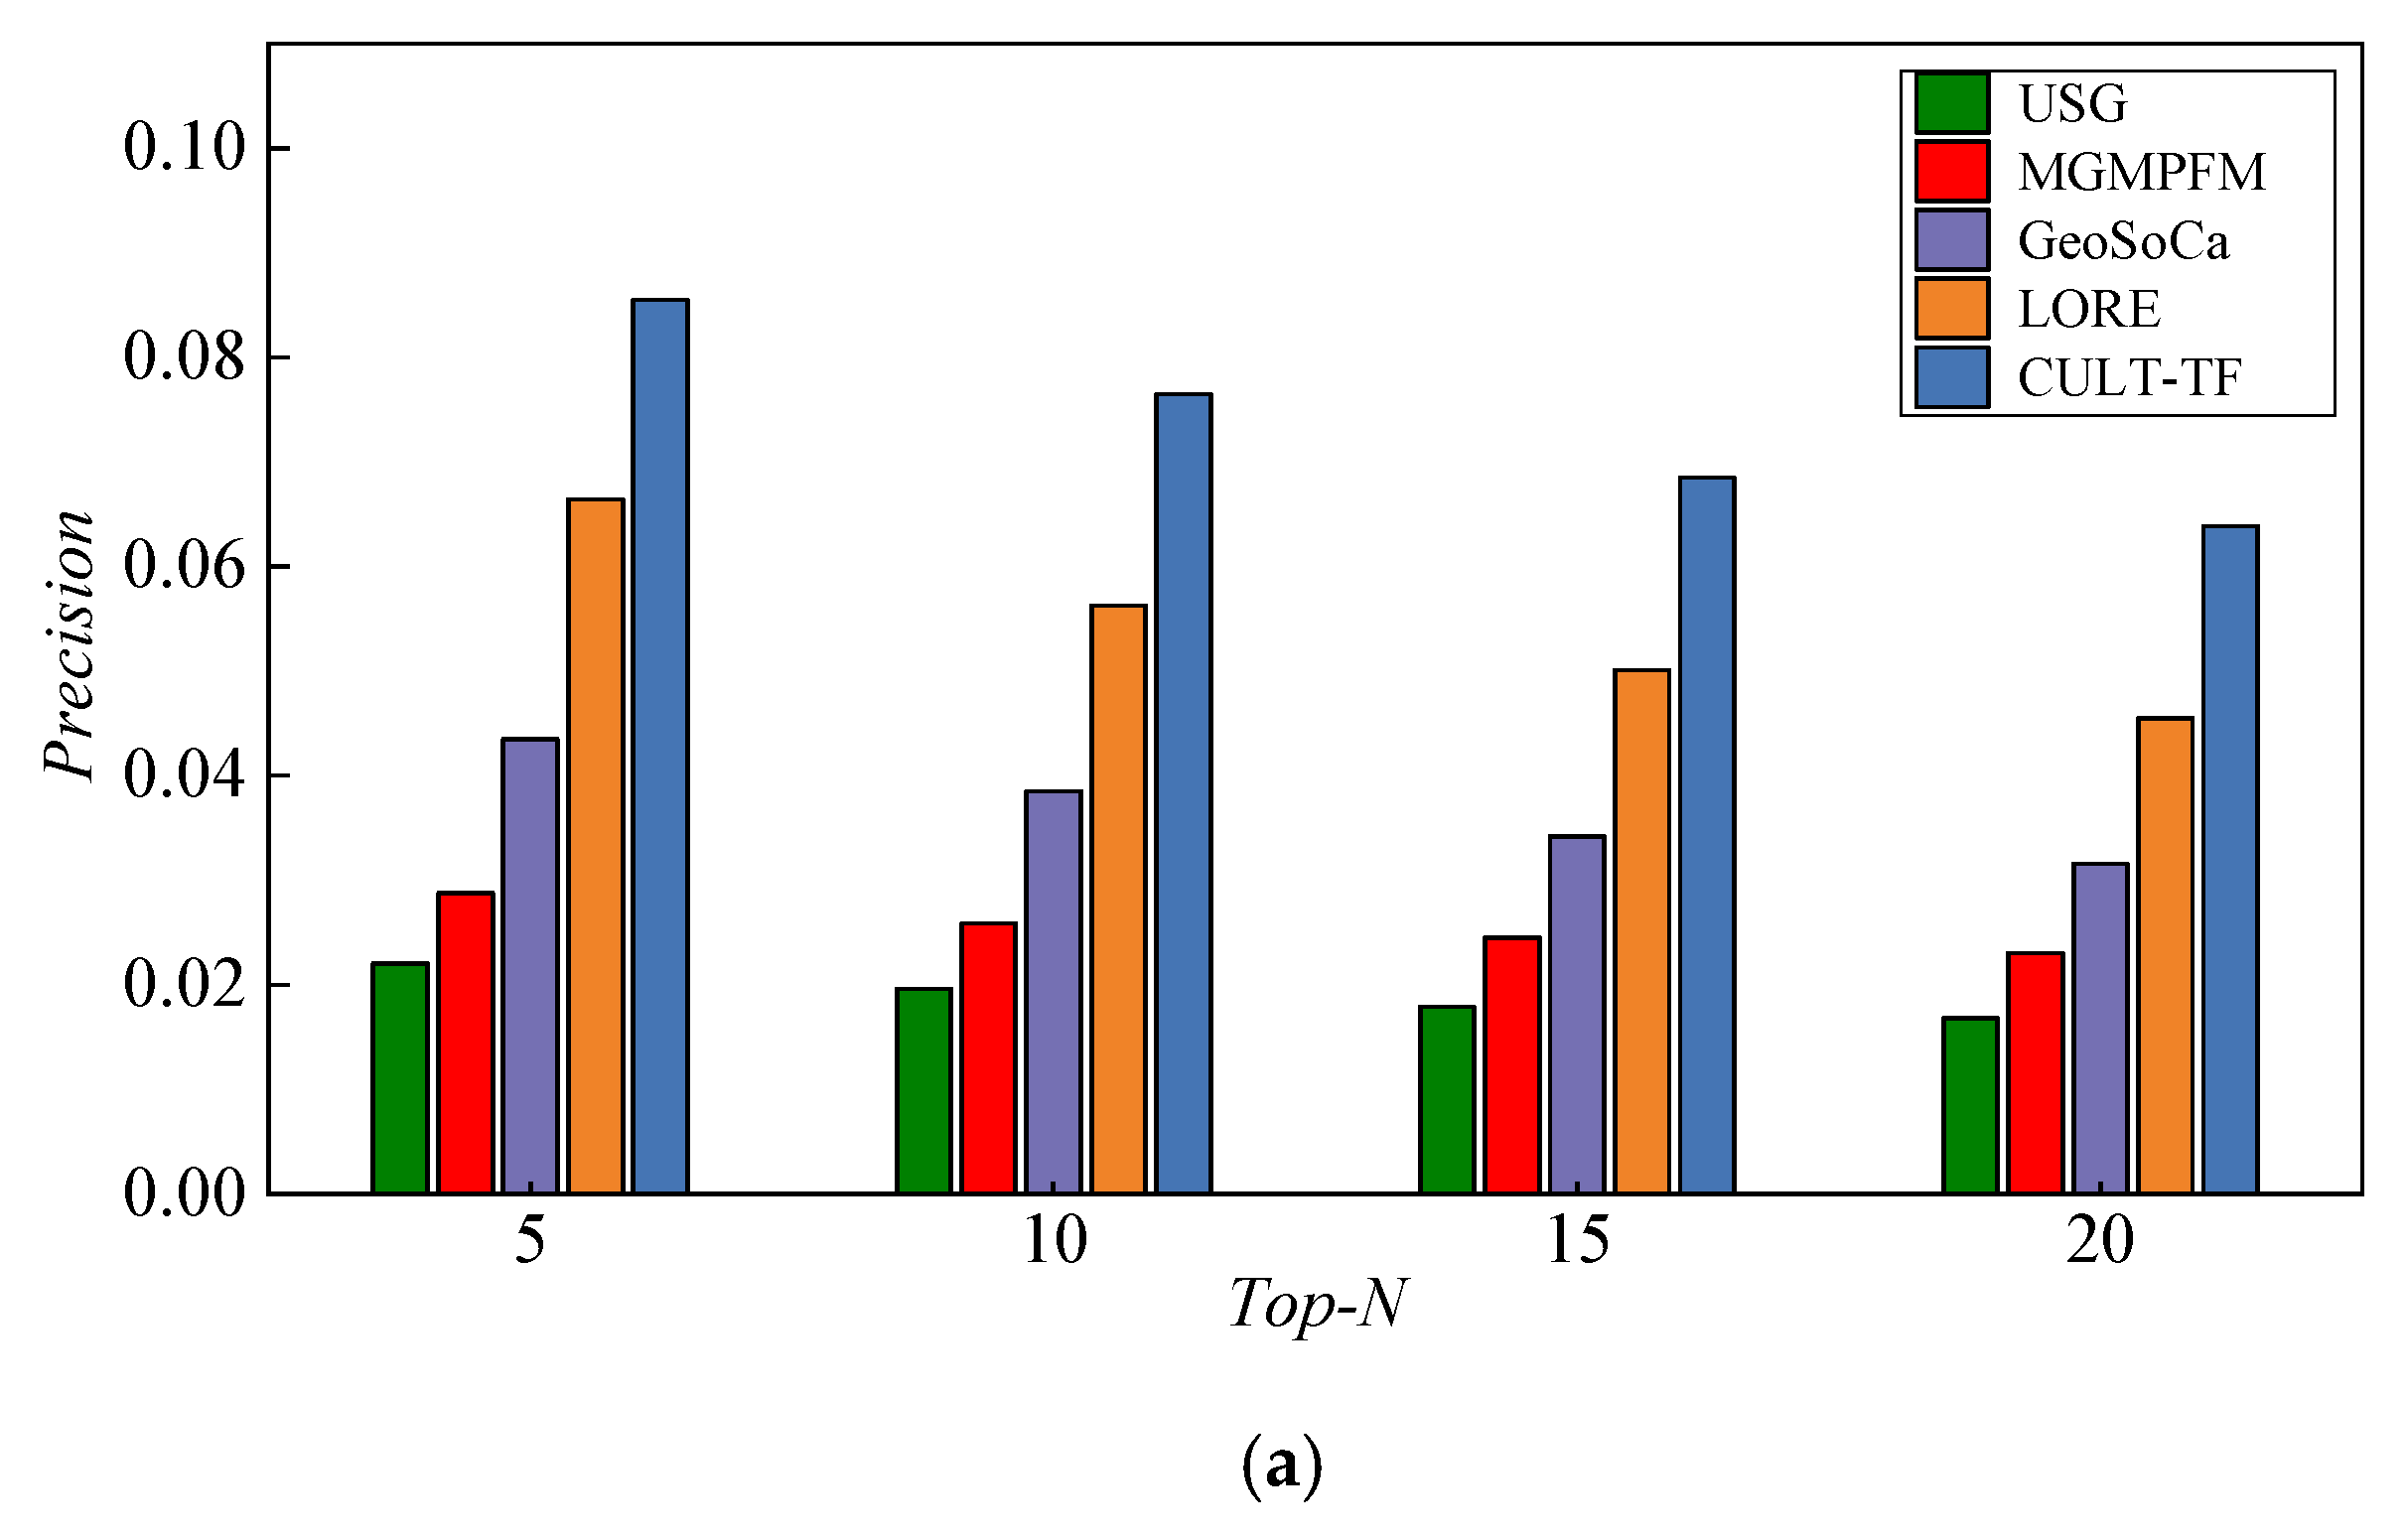
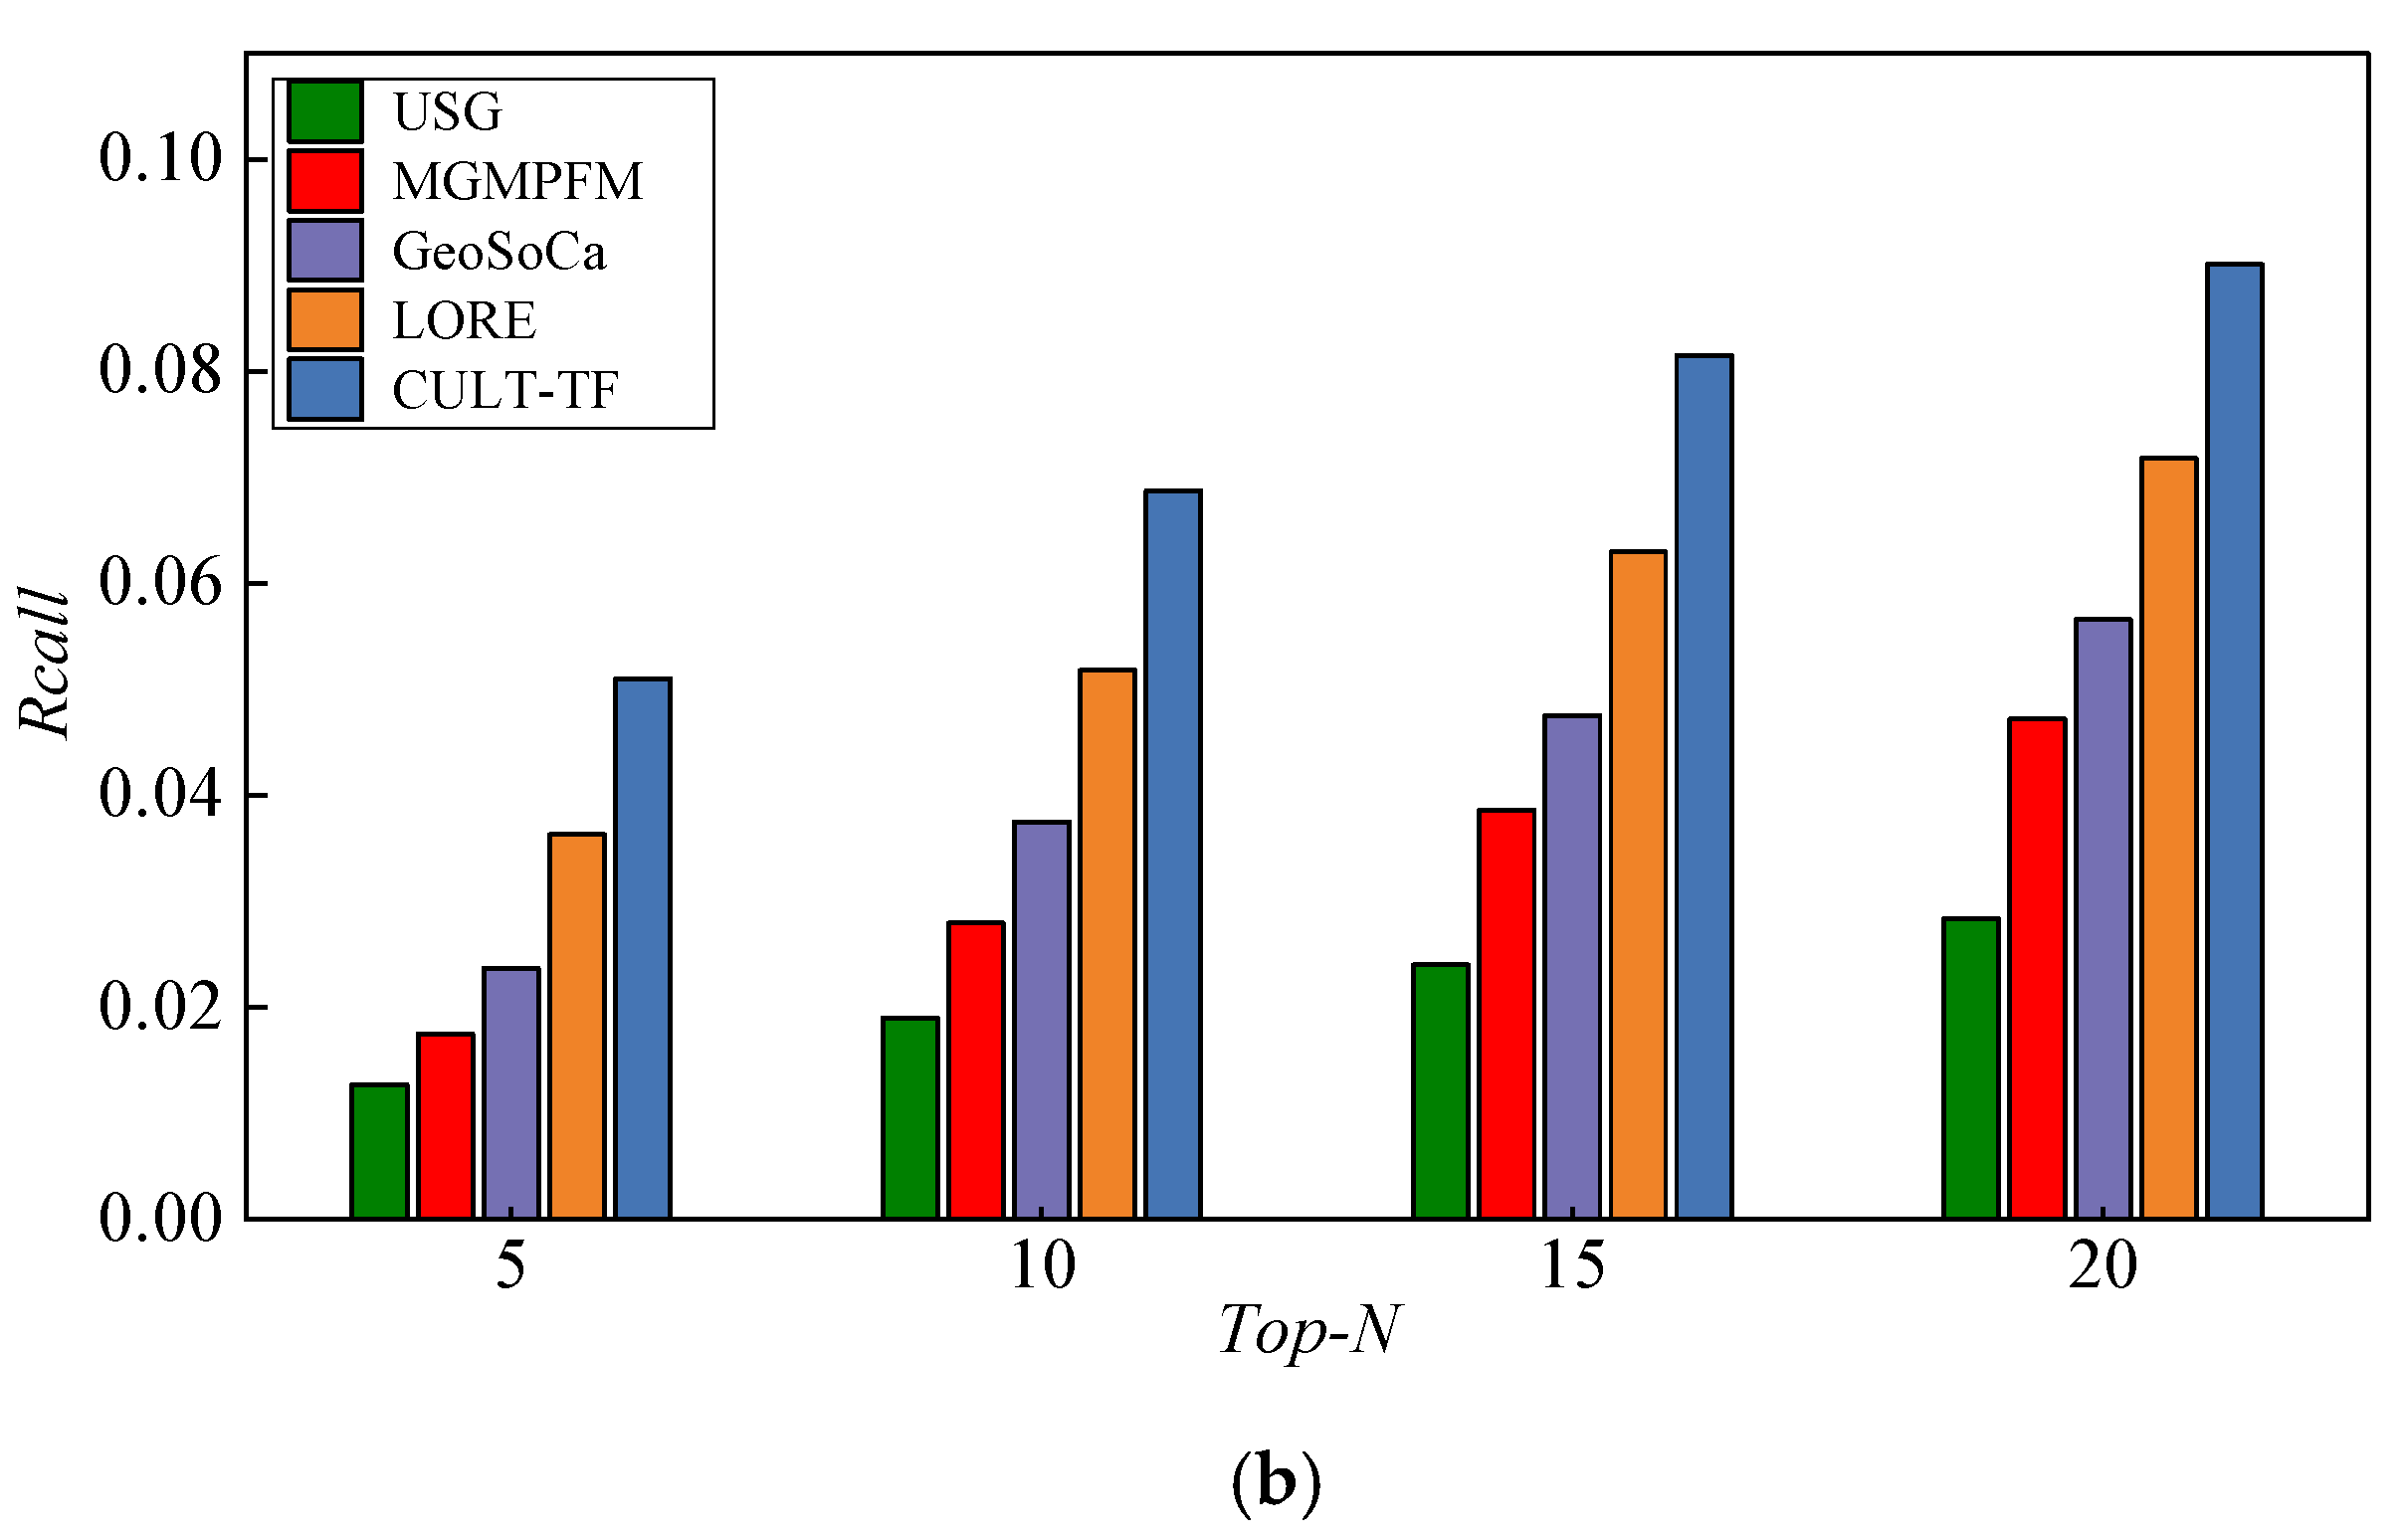
- USG [15]: USG is a collaborative recommendation method based on the geographical influence that models the geographical clustering phenomenon by means of a naive Bayesian approach and integrates social influence;
- MGMPFM [17]: MGMPFM is a POI recommendation method based on matrix factorization that models the geographical influence of users’ check-in behavior based on a multicenter Gaussian model (MGM) and fuses social and geographical influence into a matrix factorization framework;
- GeoSoCa [36]: GeoSoCa is a POI recommendation method that exploits geographical correlations, social correlations, and category correlations among users and POIs;
- LORE [28]: LORE is a location recommendation method with sequential influence based on an additive Markov chain (AMC), which integrates sequential influence with geographical influence and social influence into a unified location recommendation framework.
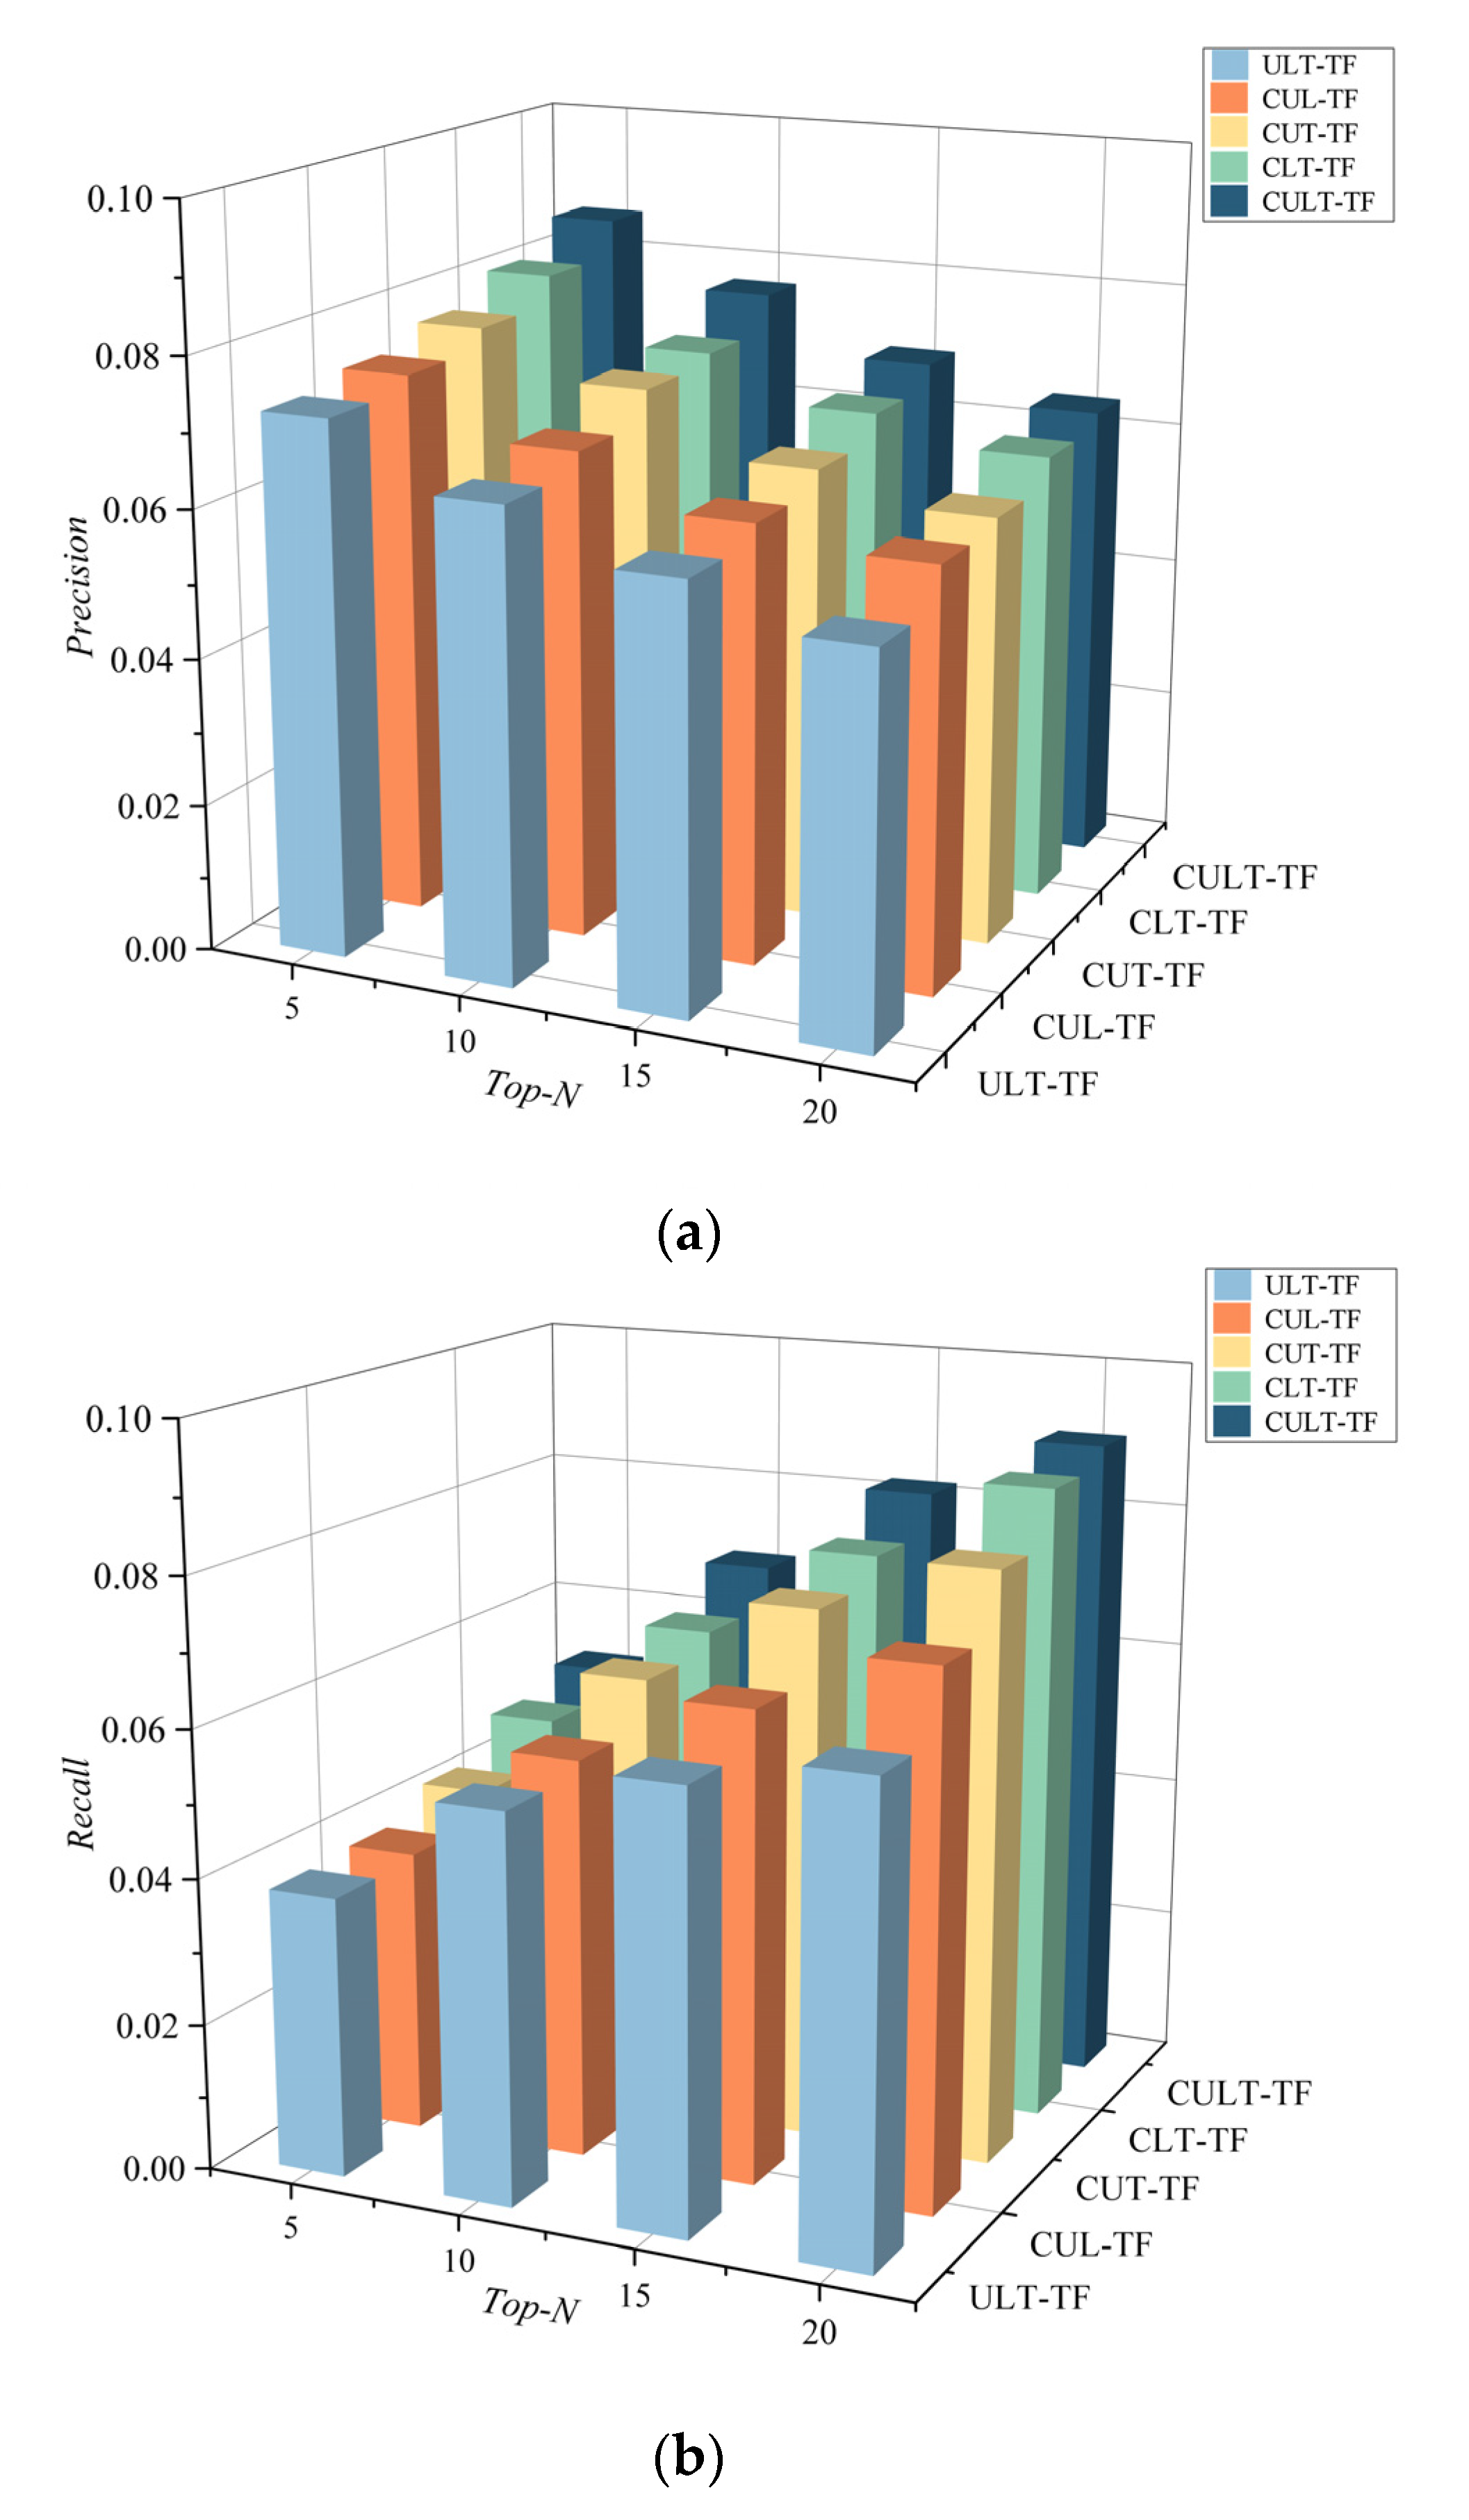
- ULT-TF: This is a recommended method based on CULT-TF that does not conduct similar user clustering, i.e., it does not consider the influence of similar users;
- CLT-TF: This is a simplified version of CULT-TF in terms of the U dimension, which does not introduce the U dimensional eigenvalue “user activity”;
- CUT-TF: This is a simplified version of CULT-TF in terms of the L dimension, which does not introduce the L dimensional eigenvalue “POI popularity”;
- CUL-TF: CUL-TF is a simplified version of CULT-TF in terms of the T dimension, which does not introduce the T dimensional eigenvalue “time slot popularity.”
6. Discussion
7. Conclusions and Future Work
Author Contributions
Funding
Data Availability Statement
Conflicts of Interest
References
- Liao, G.; Jiang, S.; Zhou, Z.H.; Wan, C.X. POI Recommendation of Location-Based Social Networks Using Tensor Factorization. In Proceedings of the 19th IEEE International Conference on Mobile Data Management (MDM), Aalborg, Denmark, 25–28 June 2018; pp. 116–124. [Google Scholar]
- Li, Z.; Huang, X.; Yuan, K. Survey of research on point-of-interest recommendation methods based on location-based social networks. Appl. Res. Comput. 2022, 39, 3211–3219. [Google Scholar]
- Liu, Y.; Pham, T.; Cong, G. An experimental evaluation of point-of-interest recommendation in location-based social networks. Proc. VLDB Endow. 2017, 10, 1010–1021. [Google Scholar] [CrossRef]
- Xu, S.; Fu, X.; Cao, J.; Liu, B.; Wang, Z. Survey on user location prediction based on geo-social networking data. World Wide Web. 2020, 23, 1621–1664. [Google Scholar] [CrossRef]
- Lian, D.; Zhao, C.; Xie, X.; Sun, G.Z.; Chen, E.H.; Rui, Y. GeoMF: Joint geographical modeling and matrix factorization for point-of-interest recommendation. In Proceedings of the 20th ACM SIGKDD International Conference on Knowledge Discovery and Data Mining, New York, NY, USA, 24–27 August 2014; pp. 831–840. [Google Scholar]
- Huang, J.; Tong, Z.; Feng, Z. Geographical POI recommendation for Internet of Things: A federated learning approach using matrix factorization. Int. J. Commun. Syst. 2022, 2022, e5161. [Google Scholar] [CrossRef]
- Rahmani, H.A.; Aliannejadi, M.; Ahmadian, S.; Baratchi, M.; Afsharchi, M.; Crestani, F. LGLMF: Local geographical based logistic matrix factorization model for POI recommendation. In Proceedings of the 15th Asia Information Retrieval Societies Conference, Hong Kong, China, 7–9 November 2019; pp. 66–78. [Google Scholar]
- Ying, Y.; Chen, L.; Chen, G. A temporal-aware POI recommendation system using context-aware tensor decomposition and weighted HITS. Neurocomputing 2017, 242, 195–205. [Google Scholar] [CrossRef]
- Ren, X.Y.; Song, M.N.; Song, J.D. Point-of-Interest recommendation based on the user check-in behavior. Chin. J. Comput. 2017, 40, 28–51. [Google Scholar]
- Li, X.; Jiang, M.; Hong, H.; Liao, L. A time-aware personalized point-of-interest recommendation via high-order tensor factorization. ACM T. Inform. Syst. 2017, 35, 1–23. [Google Scholar] [CrossRef]
- Yao, L.; Sheng, Q.Z.; Qin, Y.; Wang, X.; Shemshadi, A.; He, Q. Context-aware point-of-interest recommendation using tensor factorization with social regularization. In Proceedings of the 38th International ACM SIGIR Conference on Research and Development in Information Retrieval, Santiago, Chile, 9–13 August 2015; pp. 1007–1010. [Google Scholar]
- Luan, W.; Liu, G.; Jiang, C. Collaborative tensor factorization and its application in POI recommendation. In Proceedings of the IEEE 13th International Conference on Networking, Sensing, and Control, Mexico City, Mexico, 28–30 April 2016; pp. 1–6. [Google Scholar]
- Xing, S.; Liu, F.; Zhao, X.; Li, T. Points-of-interest recommendation based on convolution matrix factorization. Appl. Intell. 2018, 48, 2458–2469. [Google Scholar] [CrossRef]
- Zhou, X.; Tian, J.; Peng, J.; Su, M. A Smart Tourism Recommendation Algorithm Based on Cellular Geospatial Clustering and Multivariate Weighted Collaborative Filtering. ISPRS Int. J. Geo-Inf. 2021, 10, 628. [Google Scholar] [CrossRef]
- Ye, M.; Yin, P.; Lee, W.C.; Lee, D.L. Exploiting geographical influence for collaborative point-of-interest recommendation. In Proceedings of the 34th International ACM SIGIR Conference on Research and Development in Information Retrieval, Beijing, China, 24–28 July 2011; pp. 325–334. [Google Scholar]
- Maroulis, S.; Boutsis, I.; Kalogeraki, V. Context-aware point of interest recommendation using tensor factorization. In Proceedings of the IEEE International Conference on Big Data, Washington, DC, USA, 5–8 December 2016; pp. 963–968. [Google Scholar]
- Cheng, C.; Yang, H.; King, I.; Lyu, M. Fused matrix factorization with geographical and social influence in location-based social networks. In Proceedings of the AAAI Conference on Artificial Intelligence, Toronto, Canada, 22–26 July 2012; pp. 17–23. [Google Scholar]
- Zhai, X.; Zheng, W.; Xiao, Y.; Liu, K. Point-of-interest recommendation system based on deepwalk and tensor decomposition. In Proceedings of the IEEE 25th International Conference on Computer Supported Cooperative Work in Design, Hangzhou, China, 4–6 May 2022; pp. 867–872. [Google Scholar]
- Karatzoglou, A.; Amatriain, X.; Baltrunas, L.; Oliver, N. Multiverse recommendation: N-dimensional tensor factorization for context-aware collaborative filtering. In Proceedings of the Fourth ACM Conference on Recommender Systems, Barcelona, Spain, 26–30 September 2010; pp. 79–86. [Google Scholar]
- Jean-Benoit, G.; Talel, A.; Hubert, N. POI Recommendation: Towards Fused Matrix Factorization with Geographical and Temporal Influences. In Proceedings of the 9th ACM Conference on Recommender Systems, Vienna, Austria, 16–20 September 2015; pp. 301–304. [Google Scholar]
- Lu, J.; Wu, D.; Mao, M. Recommender system application developments: A survey. Decis. Support Syst. 2015, 74, 12–32. [Google Scholar] [CrossRef]
- Tobler, W.R. A computer movie simulating urban growth in the detroit region. Econ. Geogr. 1970, 46, 234–240. [Google Scholar] [CrossRef]
- Rahmani, H.; Aliannejadi, M.; Baratchi, M. Joint geographical and temporal modeling based on matrix factorization for point-of-interest recommendation. In Proceedings of the 42th European Conference on IR Research, Lisbon, Portugal, 14–17 April 2020; pp. 205–219. [Google Scholar]
- Luan, W.; Liu, G.; Jiang, C.; Qi, L. Partition-based collaborative tensor factorization for POI recommendation. IEEE/CAA J. Autom. Sin. 2017, 4, 437–446. [Google Scholar] [CrossRef]
- Jiao, X.; Xiao, Y.; Zheng, W.; Wang, H.; Jin, Y. R2SIGTP: A novel real-time recommendation system with integration of geography and temporal preference for next point-of-interest. In Proceedings of the World Wide Web Conference, New York, NY, USA, 13–17 May 2019; pp. 3560–3563. [Google Scholar]
- Ren, X.Y.; Song, M.; Haihong, E.; Song, J. Context-aware probabilistic matrix factorization modeling for point-of-interest recommendation. Neurocomputing 2017, 241, 38–55. [Google Scholar] [CrossRef]
- Liu, Y.; Pei, A.; Wang, F.; Yang, Y.; Zhang, X.; Wang, H.; Dai, H.; Qi, L.; Ma, R. An attention-based category aware GRU model for the next POl recommendation. Int. J. Intell. Syst. 2021, 36, 3174–3189. [Google Scholar] [CrossRef]
- Zhang, J.D.; Chow, C.Y. Spatiotemporal sequential influence modeling for location recommendations: A gravity-based approach. ACM Trans. Intel. Syst. Tec. 2015, 7, 11–25. [Google Scholar] [CrossRef]
- Zhao, S.; King, I.; Lyu, M.R. Aggregated temporal tensor factorization model for point-of-interest recommendation. Neural Process. Lett. 2018, 47, 975–992. [Google Scholar] [CrossRef]
- Zhang, J.D.; Chow, C.Y.; Li, Z. iGeoRec: A personalized and efficient geographical location recommendation framework. IEEE T. Serv. Comput. 2015, 8, 701–714. [Google Scholar] [CrossRef]
- Zhu, J.; Wang, C.; Guo, X.; Ming, Q.; Li, J.; Liu, Y. Friend and POI recommendation based on social trust cluster in location-based social networks. EURASIP J. Wirel. Comm. 2019, 2019, 89. [Google Scholar] [CrossRef] [Green Version]
- Gao, H.; Tang, J.; Hu, X.; Liu, H. Exploring temporal effects for location recommendation on location-based social networks. In Proceedings of the Seventh ACM Conference on Recommender Systems, Hong Kong, China, 12–16 October 2013; pp. 93–100. [Google Scholar]
- Ye, M.; Shou, D.; Lee, W.C.; Yin, P.; Janowicz, K. On the semantic annotation of places in location-based social networks. In Proceedings of the ACM SIGKDD International Conference on Knowledge Discovery and Data Mining, San Diego, CA, USA, 21–24 August 2011; pp. 520–528. [Google Scholar]
- Pennacchiotti, M.; Gurumurthy, S. Investigating topic models for social media user recommendation. In Proceedings of the 20th International Conference on World Wide Web, Hyderabad, India, 28 March–1 April 2011; pp. 101–102. [Google Scholar]
- Li, H.; Hong, R.; Wu, Z. A spatial-temporal probabilistic matrix factorization model for point-of-interest recommendation. In Proceedings of the 2016 SIAM International Conference on Data Mining, Miami, FL, USA, 5–7 May 2016; pp. 117–125. [Google Scholar]
- Zhang, J.; Chow, C.Y. GeoSoCa: Exploiting Geographical, Social and Categorical Correlations for Point-of-Interest Recommendations. In Proceedings of the 38th International ACM SIGIR Conference on Research and Development in Information Retrieval, Santiago, Chile, 9–13 August 2015; pp. 443–452. [Google Scholar]
- Fang, J.F.; Meng, X.F. POl recommendation based on LBSN and multi-graph fusion. Act. Geo. Cart. Sinica. 2022, 51, 739–749. [Google Scholar]
- Tucker, L. Some mathematical notes on three-mode factor analysis. Psychometrika 1966, 31, 279–311. [Google Scholar] [CrossRef]
- Zhao, S.; Zhao, T.; Yang, H.; Lyu, M.; King, I. STELLAR: Spatial-temporal latent ranking for successive point-of-interest recommendation. In Proceedings of the Thirtieth AAAI Conference on Artificial Intelligence, Phoenix, AZ, USA, 12–17 February 2016; pp. 315–321. [Google Scholar]
- Liu., B.; Xiong, H. Point-of-Interest recommendation in location based social networks with topic and location awareness. In Proceedings of the 2013 SIAM International Conference on Data Mining, Austin, TX, USA, 2–4 May 2013; pp. 396–404. [Google Scholar]
- Macqueen, J. Classification and Analysis of Multivariate Observations. In 5th Berkeley Symposium on Mathematical Statistics and Probability, Los Angeles, CA, USA; University of California Press: Berkeley, CA, USA; pp. 281–297.
- Wang, X.; Liu, Y.; Zhou, X.; Wang, X.; Leng, Z. A Point-of-Interest Recommendation Method Exploiting Sequential, Category and Geographical Influence. ISPRS Int. J. Geo-Inf. 2022, 11, 80. [Google Scholar] [CrossRef]


| Notation | Description |
|---|---|
| user set | |
| POI set | |
| time slot set | |
| the user, with user ID , | |
| the location, with POI ID , | |
| the time slot, with time slot type ID , | |
| the friend set of the user | |
| the POI set checked in by the user | |
| the time slot set checked in by the user | |
| the set of users checking in at a location | |
| the set of users checking in at a time slot | |
| the number of user check-ins | |
| the number of all user check-ins at the location | |
| the number of all user check-ins at the time slot | |
| the friend set of user | |
| the set of time slot types for user check-ins at the location | |
| the set of POIs for user check-ins during the time slot |
| Description | Statistics |
|---|---|
| Time Range | 1 October 2009–30 September 2010 |
| Geographic Range | 19.27° N–71.29° N 67.84° W–159.67° W |
| Number of Users | 4844 |
| Number of POIs | 7685 |
| Number of Social Relations | 186,071 |
| Number of Check-ins | 388,148 |
| Ranking | User ID | User Activity | Ranking | User ID | User Activity |
|---|---|---|---|---|---|
| 1 | 1863 | 1.000000 | 6 | 620 | 0.608652 |
| 2 | 1864 | 0.822594 | 7 | 0 | 0.483306 |
| 3 | 143 | 0.808769 | 8 | 1302 | 0.468147 |
| 4 | 2149 | 0.732460 | 9 | 212 | 0.414451 |
| 5 | 35 | 0.623615 | 10 | 208 | 0.385934 |
| Cluster No. | User ID of Cluster Center | User Similarity of Cluster |
|---|---|---|
| 1 | 1863 | 1.00592 |
| 2 | 1864 | 0.72074 |
| 3 | 143 | 0.90315 |
| 4 | 2149 | 0.86348 |
| 5 | 35 | 0.81491 |
| 6 | 620 | 0.90564 |
| 7 | 0 | 0.89310 |
| Metrics | USG | MGMPFM | GeoSoCa | LORE | CULT-TF |
|---|---|---|---|---|---|
| Precision@5 | 0.0220 | 0.0288 | 0.0435 | 0.0664 | 0.0855 |
| Recall@5 | 0.0127 | 0.0175 | 0.0237 | 0.0363 | 0.0510 |
| Precision@10 | 0.0196 | 0.0259 | 0.0385 | 0.0563 | 0.0765 |
| Recall@10 | 0.0190 | 0.0280 | 0.0375 | 0.0518 | 0.0687 |
| Precision@15 | 0.0179 | 0.0245 | 0.0342 | 0.0501 | 0.0685 |
| Recall@15 | 0.0240 | 0.0386 | 0.0475 | 0.0630 | 0.0815 |
| Precision@20 Recall@20 | 0.0168 | 0.0230 | 0.0316 | 0.0455 | 0.0639 |
| 0.0284 | 0.0472 | 0.0566 | 0.0718 | 0.0901 |
| Metrics | ULT-TF | CUL-TF | CUT-TF | CLT-TF | CULT-TF |
|---|---|---|---|---|---|
| Precision@5 | 0.0726 | 0.0742 | 0.0768 | 0.0807 | 0.0855 |
| Recall@5 | 0.0382 | 0.0387 | 0.0424 | 0.0478 | 0.0510 |
| Precision@10 | 0.0641 | 0.0665 | 0.0706 | 0.0717 | 0.0765 |
| Recall@10 | 0.0530 | 0.0546 | 0.0609 | 0.0634 | 0.0687 |
| Precision@15 | 0.0576 | 0.0597 | 0.0622 | 0.0656 | 0.0685 |
| Recall@15 | 0.0593 | 0.0641 | 0.0730 | 0.0763 | 0.0815 |
| Precision@20 Recall@20 | 0.0522 | 0.0573 | 0.0584 | 0.0620 | 0.0639 |
| 0.0634 | 0.0723 | 0.0804 | 0.0875 | 0.0901 |
Disclaimer/Publisher’s Note: The statements, opinions and data contained in all publications are solely those of the individual author(s) and contributor(s) and not of MDPI and/or the editor(s). MDPI and/or the editor(s) disclaim responsibility for any injury to people or property resulting from any ideas, methods, instructions or products referred to in the content. |
© 2023 by the authors. Licensee MDPI, Basel, Switzerland. This article is an open access article distributed under the terms and conditions of the Creative Commons Attribution (CC BY) license (https://creativecommons.org/licenses/by/4.0/).
Share and Cite
Zhou, Y.; Zhou, K.; Chen, S. Context-Aware Point-of-Interest Recommendation Based on Similar User Clustering and Tensor Factorization. ISPRS Int. J. Geo-Inf. 2023, 12, 145. https://doi.org/10.3390/ijgi12040145
Zhou Y, Zhou K, Chen S. Context-Aware Point-of-Interest Recommendation Based on Similar User Clustering and Tensor Factorization. ISPRS International Journal of Geo-Information. 2023; 12(4):145. https://doi.org/10.3390/ijgi12040145
Chicago/Turabian StyleZhou, Yan, Kaixuan Zhou, and Shuaixian Chen. 2023. "Context-Aware Point-of-Interest Recommendation Based on Similar User Clustering and Tensor Factorization" ISPRS International Journal of Geo-Information 12, no. 4: 145. https://doi.org/10.3390/ijgi12040145