Article

Measuring and Mapping Physical Activity Disparity (PAD) Index Based on Physical Activity Environment for Children

1
Department of Geography, University of Georgia, Athens, GA 30602, USA
2
Department of Health Policy & Management, University of Georgia, Athens, GA 30606, USA
*
Author to whom correspondence should be addressed.
ISPRS Int. J. Geo-Inf. 2023, 12(3), 134; https://doi.org/10.3390/ijgi12030134
Submission received: 20 January 2023 / Revised: 8 March 2023 / Accepted: 15 March 2023 / Published: 21 March 2023

Abstract

:
Physical activity (PA) plays a vital role in children’s physical and mental health. The built, natural, and socio-demographic environmental variables affect children’s PA behaviors in various ways. However, few studies focus on systematically measuring the environmental spatiality to enhance PA research. We propose a Physical activity Access Disparity (PAD) index for children. This study aims to design, test, and apply an integrated approach to the children’s PAD index. We adopt five dimensions of “access” to healthcare to measure the children’s PAD index for the United States (US) and the state of Georgia at the county level. The PAD index sorts 18 environmental measures with 23 variables into accessibility, availability, accommodation, affordability, and acceptability (5 As) for children’s PA. We use the self-organizing map (SOM) method to measure how the 5 As affect the PAD index values. According to the result, the children’s PAD index’s ranking normalizes from 0 to 1 and identifies “play oases” to “play deserts” in the US and Georgia using diverse 5 As combinations. The children’s PAD index shows Low disparity in the north and coastal region and High disparity in Deep South states in the US. Moreover, the PAD index shows Low disparity and High disparity in the north and south of Georgia. The PAD index provides a valuable tool for researchers and policymakers to analyze disparity in children’s “access” to the PA environment. The flexible parameters and the weighing scheme also extend the method’s generality and allow users to customize the PAD index based on local preferences and conditions.

1. Introduction

The lack of physical activity (PA) has become one of the leading risk factors for chronic health conditions, and preventable deaths in the United States (US) and the world [1,2]. Particularly among children (under 18) [3], PA is associated with a positive effect on overall health. Benefits include improved attention and memory, strengthened bones, strong muscles, endurance, reduced obesity, and more [4]. According to WHO [1], three-fourths of children globally have PA rates lower than recommended. These statistics demonstrate the need to study the determinants of low rates of PA. Numerous studies have suggested that investigating the association between the environment and PA could guide intervention strategies to improve PA among children [5,6,7].
Environmental factors affect children’s engagement in PA [8,9]. Such factors can be classified as built, socio-demographic, and natural environmental factors. For instance, Brownson [8] categorized features in the built environment that influence PA into five domains: functional, safety, aesthetic, destination, and other. These environmental variables have been widely discussed individually in literature related to children’s access to the PA environment, such as the availability of park features, accessible recreation facilities, free open space, and neighborhood safety [7,8,9,10,11]. However, few papers have examined the relationship between multiple measurements of PA environment and children’s access to PA opportunities. For example, a park includes features such as park accessibility, availability, free vs. paid access, park safety, and park aesthetics and more to explain how these features affect the PA environment of the park and access to PA opportunities among children. Several park attributes establish the accessibility and usability of the park, and, in turn, attributes of PA determine children’s access to PA opportunities [11,12]. Furthermore, the PA environment differs across various geographical levels, such as county, state, and region. There is also a need for analysis to expand to various locations. This study tries to fill the gap in the current literature by creating a comprehensive multi-dimensional access framework for children’s PA environmental variables among different geographical levels. We adopt five measures of access, namely availability, accessibility, affordability, accommodation, and acceptability (commonly referred to as the 5 As of access) and Geographic Information System (GIS) methods to design and build a children’s Physical Activity Disparity (PAD) index for the US. We then demonstrate the feasibility of the children’s PAD index framework to adapt to a finer geographical level, such as states in the case of US, based on data availability and state policy priorities.
Our research questions are: What is the range of “play oases” to “play deserts” in the US and Georgia followed by the 5 As framework? How do the 5 As, individually or in combination, impact the physical activity disparity? The present study is structured as follows: Section 2 provides the background of the PA environment for children and the 5 As’ concept to develop the children’s PAD index. Section 3 describes our data analysis methodology, which encompasses data collection, the design of the PAD index for children, and the application of the Self-Organization Map to classify the PAD index. Section 4 presents a summary of the findings from our study. Section 5 offers a discussion of the contributions of the PAD index and suggestions for future research. Finally, in Section 6, we provide a conclusion to the article. The List of acronyms is in Table S1.

2. Background

2.1. Children’s PA Environment

The PA environment is a space where PA occurs, such as green spaces, health clubs, sidewalks, and trails [13]. Many works of literature commonly focus on PA behaviors. For instance, Pontin et al. [14] used a smartphone app to gain new insights into the socio-demographic variation in PA behaviors; Mitchell [15] indicated that the natural environmental variable affects human PA to produce mental health benefits. Such behavior is not only limited to behavior but also depends on the PA environment [13,16]. The environmental variables are even more important in the context of children’s PA as they have restricted access and must be accompanied by an adult. Therefore, the PA environment that children have access to is an essential predictor of children’s PA behavior [17]. For example, Flaes et al. [18] conducted a study that indicated that access to a better quality park environment increased PA (i.e., energy expenditure) among children. Improved access to PA environment (e.g., walkability, playability, accessibility, and safety) among children is a vital strategy to influence children’s health outcomes [19].

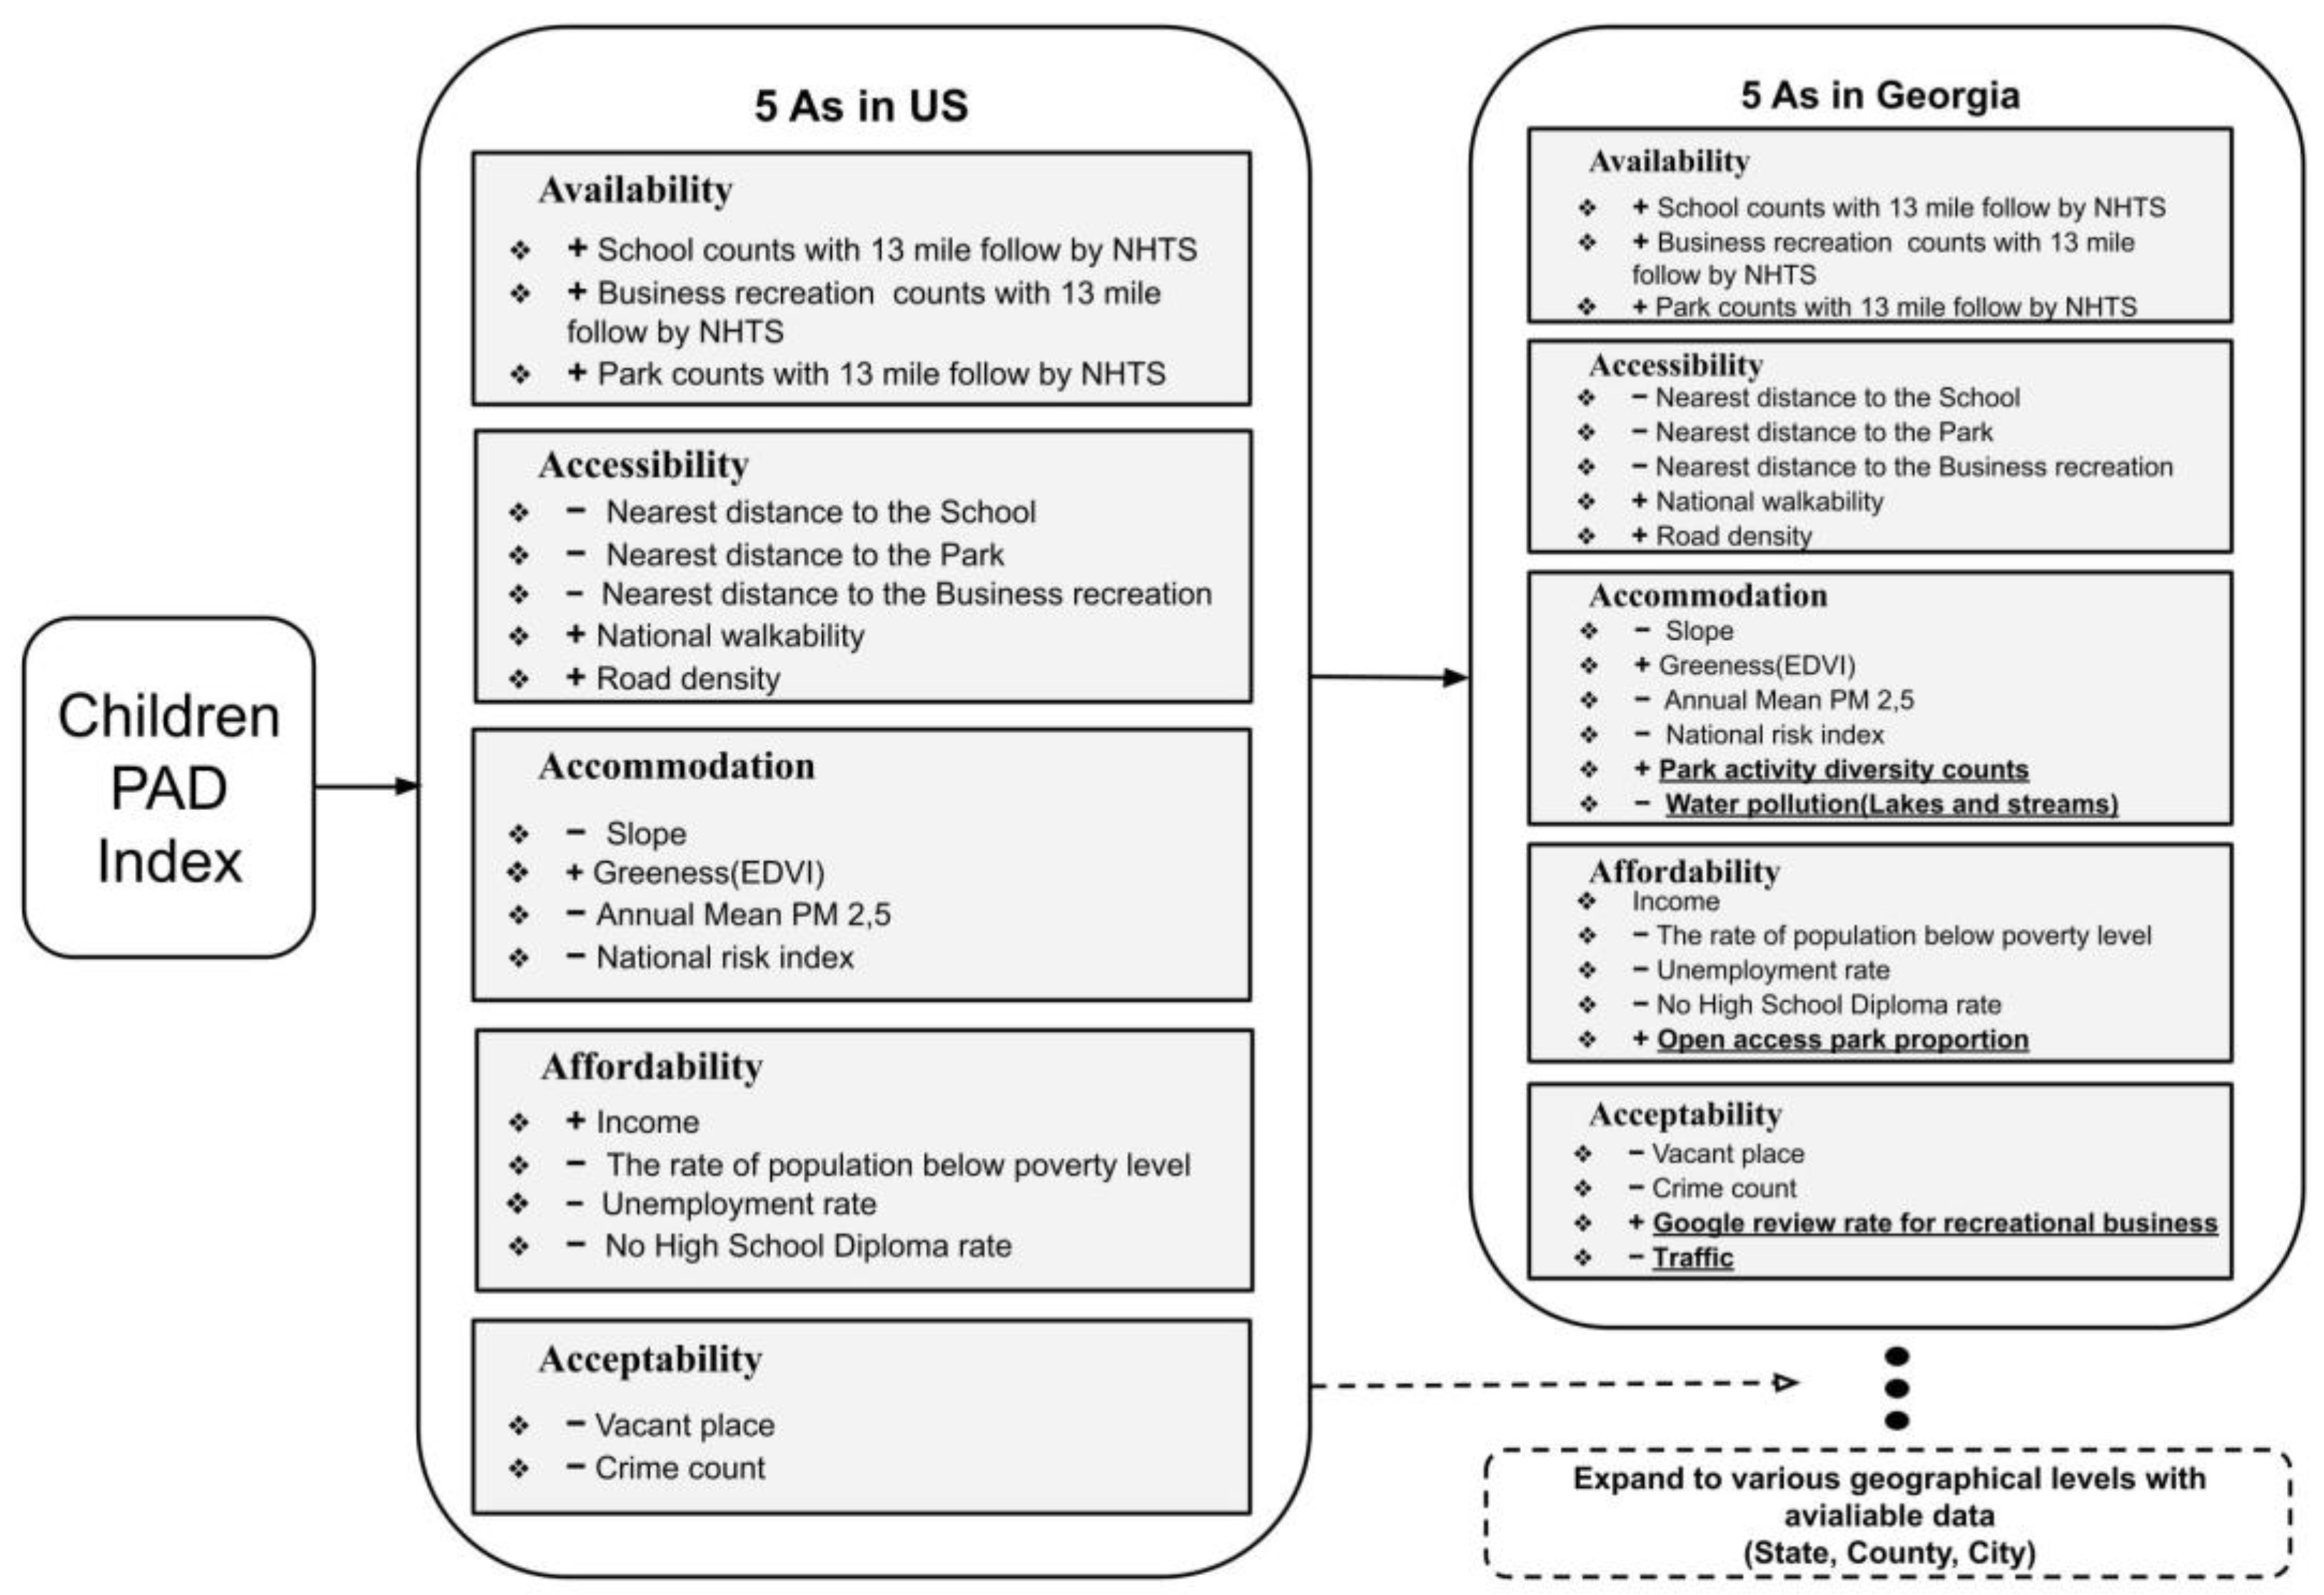
2.2. The 5 As of Access to Children PA Environment

Penchansky and Thomas [20] proposed the 5 As of the access concept to study the degree of fit between characteristics of healthcare supply and population demand. The supply and demand characteristics include objective characteristics such as count, socio-demographics, and transportation, and subjective characteristics such as people’s attitudes or relationships. Penchansky and Thomas grouped those characteristics into five dimensions of access: Availability, Accessibility, Accommodation, Affordability, and Acceptability [20]. Availability measures the supply of services in relation to demand. Accessibility highlights the geographical linkage between supply and demand, considering travel distance, time, and cost. Accommodation refers to the supply of resources organized to meet the demand preferences, including the waiting time or application procedures. Affordability measures the demand, the population’s ability to afford the available supply of resources or insurance coverage. Acceptability also reflects demand in terms of the population’s attitude towards the supply, such as gender, culture, and ethnicity [21,22].
We adopt the 5 As’ concept in this paper for the PA supply to represent what the environment and society can offer in terms of children’s PA, and its counterpart is the children’s demand for PA. The availability and accessibility of PA facilities support the opportunities for children’s PA [23]. Low poverty levels and income tend to impact people’s access to free open space [24]. Steep hills decrease the frequency of outdoor activity [10], and so do safety concerns for outdoor activity and active transportation [25]. Therefore, there is a need to illustrate the 5 As’ framework for children’s PA [26]. With the 5 As’ multi-dimensional framework, environmental variables could be remeasured to fit the framework which added a new insight into PA environmental research.

3. Data and Method

3.1. Designing a Children’s PAD Index

For the development of the children’s PAD index, we collected several potential PA measures from built, natural, and socio-demographic environments and classified characteristics of measures, which are referred to as variables, into the 5 A dimensions. The measurement was based on the variable with Multi-Criteria Evaluation (MCE) to calculate the PAD index [27]. We design and present the children’s nationwide PAD at the county level for US. To show the flexibility and customization in building the PAD index, we collected environmental measures statewide in Georgia (GA) and demonstrated the flexibility of the 5 As in designing the PAD index at a regional level. Lastly, we analyzed how 5 As influence the level of the PAD index by using the self-organizing map (SOM) method.

3.2. Environment Measures Selection

To identify the potential environmental measures within the PAD index, we reviewed the literature using keyword combinations of “children”, “adolescents”, “physical activity”, “recreation”, “built environment”, “socio-demographic” and “natural environment”. Ten review articles focused on one or more elements of children’s PA environmental measures [7,8,28,29,30,31,32,33,34,35]. According to the literature and data availability, we chose 15 measures (No. 1–7, 10–13, and 15–18 in Table 1) for the national analysis and 18 measures (No. 1–18 in Table 1) for the state (GA) analysis, as listed in Table 1. Some measures have more than one variable. For example, the park variable (No. 7 in Table 1) includes park count, nearest distance to the park, open access park proportion, and park activity diversity (see Section 3.3 for the explanation of the measures under each of the 5 As’ domains). The study proceeded with 18 variables (in 15 measures) for the national analysis and 23 variables (in 18 measures) for the state analysis (Figure 1). The five additional variables indicate the variables that were available only at the state (GA) level.

3.3. Environmental Measures’ Variables for 5 As in the US and Georgia

For all the variables we included in the 5 As calculation, we aggregated and averaged them to the county level.
Variables of Availability: Availability defines the adequacy of the PA supply. The counts of business recreations, schools, and parks were defined as the PA supply with a positive direction. A larger supply count value for these three variables means higher availability (Figure 1). We used 13 miles (20.9 km), the average travel distance to recreation destinations for both the US and Georgia, according to the National Household Travel Survey’s [50] recreation travel distance mode sample, to define the area for the PA supply count. We created 13-mile Euclidean distance buffers, which calculated the direct distance from the central points of each block group polygon and calculated the PA supply count within each buffer. Then, the PA supply counts of block groups were aggregated to obtain the mean value at the county level. Finally, the population-adjusted PA supply per 1000 children was calculated to generate the Availability index in the US and Georgia.
Variables of Accessibility: Accessibility demonstrates the population’s trip toward the available PA supply. The accessibility variables included the nearest distance to PA supply, walkability, and road density. The nearest distance to a business recreation, school, and park indicated that a shorter distance between the population location, as the block group centroid, and PA supply’s location showed higher accessibility. Higher walkability and higher road density show higher accessibility. Therefore, these five variables were calculated to generate the Accessibility index in the US and Georgia.
Variables of Accommodation: Accommodation indicates how the PA supply accommodates the children in the objective circumstances. Our study defined the index from the environmental aspect to see whether the PA environmental conditions, such as nature characteristics (river and mountain), facilities, and amenities accommodate children’s demands. The four measures, slope, greenness (normalized difference vegetation index; NDVI), air pollution, and National Risk Index (NRI) were collected and reclassified at the county level. Higher values of the slope, NRI, and annual mean PM2.5 indicated a lower accommodation, and higher greenness values indicated a higher accommodation. These four variables were used to generate the Accommodation index in the US. In Georgia, we added two more variables, i.e., water pollution and park facility diversity, to analyze the Accommodation index of Georgia.
Variables of Affordability: Affordability demonstrates the affordability of the PA supply. Here, we included the variables that define the socioeconomic status of children that directly affects the demand for PA. It includes the household income, poverty level (being below the 10.5 percent national poverty level in the 2019 US Census standard), unemployment rate, and no high school diploma rate. Higher income indicated higher affordability. Below-poverty-level rate, unemployment rate, and no high school diploma rate indicated low affordability. These four variables were used to generate the Affordability index in the US. In Georgia, we added the public park rate for all parks as high affordability for the expense characteristics of the supply to analyze the Affordability index of Georgia.
Variables of Acceptability: Acceptability shows the attitude towards the safety and usability of the PA supply. Our study explained it as the children’s or guardians’ accepted environment for the children to play within comfortably and safely. Crime and vacant lot counts within each county are used to measure the Acceptability index in the US. A higher count indicates lower acceptability. In Georgia, the traffic data and average rate of Google Maps reviews for the business recreation supplies were added to the Acceptability index of Georgia.

3.4. As Index Measurement

To design the children’s PAD index, we classified the variables of the environmental variables into 5 As (Figure 1). The Increase (+) or Decrease (−) signs illustrate the variables’ contribution to the PAD index. To avoid a calculation error, we followed the contribution direction in Figure 1 to transform “(−)” to “(+)”. For example, a higher slope is a barrier to PA access. With the transformation, the “increase” of the slope variable value (i.e., lower slope) facilitates the PA access. The variable underlined and bolded in Figure 1 indicates the new environmental variables considered at the Georgia level. Next, we ranked counties within the US and Georgia to map and integrate the 5 As index and to develop the Children’s PAD index.
The variables’ and 5 As indexes’ ranking were normalized from 0 to 1 (min–max normalization) and then used to determine the PAD index. We used the weighted sum model from MCE [27,51] to calculate the 5 As indexes separately by the same weight of each variable within it. Next, the PAD index was a combination of 5 As indexes with the same weight of each A to generate the PAD index (Equation (1)):
P A D   i n d e x = 1 ( w 1 × Availability index ) + ( w 2 × Accessibility index ) + ( w 3 × Accommodation index ) + ( w 4 × Affordability index ) + ( w 5 × Acceptability index )
where w1 to w5 are the weights applied to each one of the 5 As. We use equal weights in this study, with w1 = w2 = w3 = w4 = w5 = 0.2 and w1 + w2 + w3 + w4 + w5 = 1. However, it can be customized to varied weights, as long as the sum of weights is 1.
To analyze the variables in each of the 5 As, we added the environmental variables of each of the 5 As to customize Equation (1), and Equation (2) demonstrates the variables’ processing within the 5 As.
P A D   i n d e x = 1 i = 1 N = 5 w i j = 1 m x i j w j
where i and wi refer to the label of an A and its weight (i = 1 to 5). The variables xij and wj refer to an environmental variable in Ai following the assignment of measures and its weight in Figure 1; The variable m refers to the number of environmental variables in Ai (Figure 1). Higher 5 As’ combination values mean better “access”, and therefore, lower values in the PAD index, which offers a more welcoming and low-disparity PA environment for children.
Last, each county’s 5 As and PAD indexes were classified into three qualitative categories, Low, Average and High, using the quantile classification. To analyze the effect of the 5 As in the PAD index, we created a wind-rose visualization to show the 5 As distribution for the example counties.

3.5. Self-Organizing Map (SOM)

The Self-organizing map (SOM) is an unsupervised artificial neural network method for clustering and visualizing multivariable datasets. It reduces and analyzes a large dataset of a high dimension to a low dimension while retaining the data samples’ internal association and pattern. We used the SOM to cluster the 5 As ranking and evaluate how those influence the children’s PAD index in Georgia. We used the elbow method to determine the optimal number of clusters in the SOM [52]. The Elbow method computes the squared sum (within a cluster sum of squares) of the distance between the cluster’s centroid and the sample point within the cluster based on the number of clusters [52]. Generally, a cluster with a small sum of squares is more compact than a cluster with a large sum of squares. In this study, we chose 4 clusters to analyze how 5 As vary in the PAD index (Supplementary Figure S1).
To cluster the 5 As indexes in Georgia counties, we used the kohonen package [53] in R. The algorithm to produce an SOM from 5 As can be summarized as follows [54,55]:
  • The 5 As were considered as five-dimensional within each county as an input vector (5 × 159 matrix for 5 As and 159 counties) in an “input space”.
  • Due to the elbow method, four-node weight vectors were randomly put in the space.
  • The Euclidean distance was used to calculate the best matching unit (BMU), which is the smallest distance between the node weight vectors and the input vector.
  • Update the node weight vectors and nodes’ neighborhood with the BMU by pulling them closer to the input vector.
    w v s + 1 = w v s + θ u , v , s · a s · D t w v s
    where s is the current iteration, v is the node weight vector, u is the best-matching unit (BMU), θ(u,v,s) is the neighborhood function from BMU, a(s) is the learning rate, and D(t) is the input data vector.
  • Repeat steps 3 and 4 for N iterations.
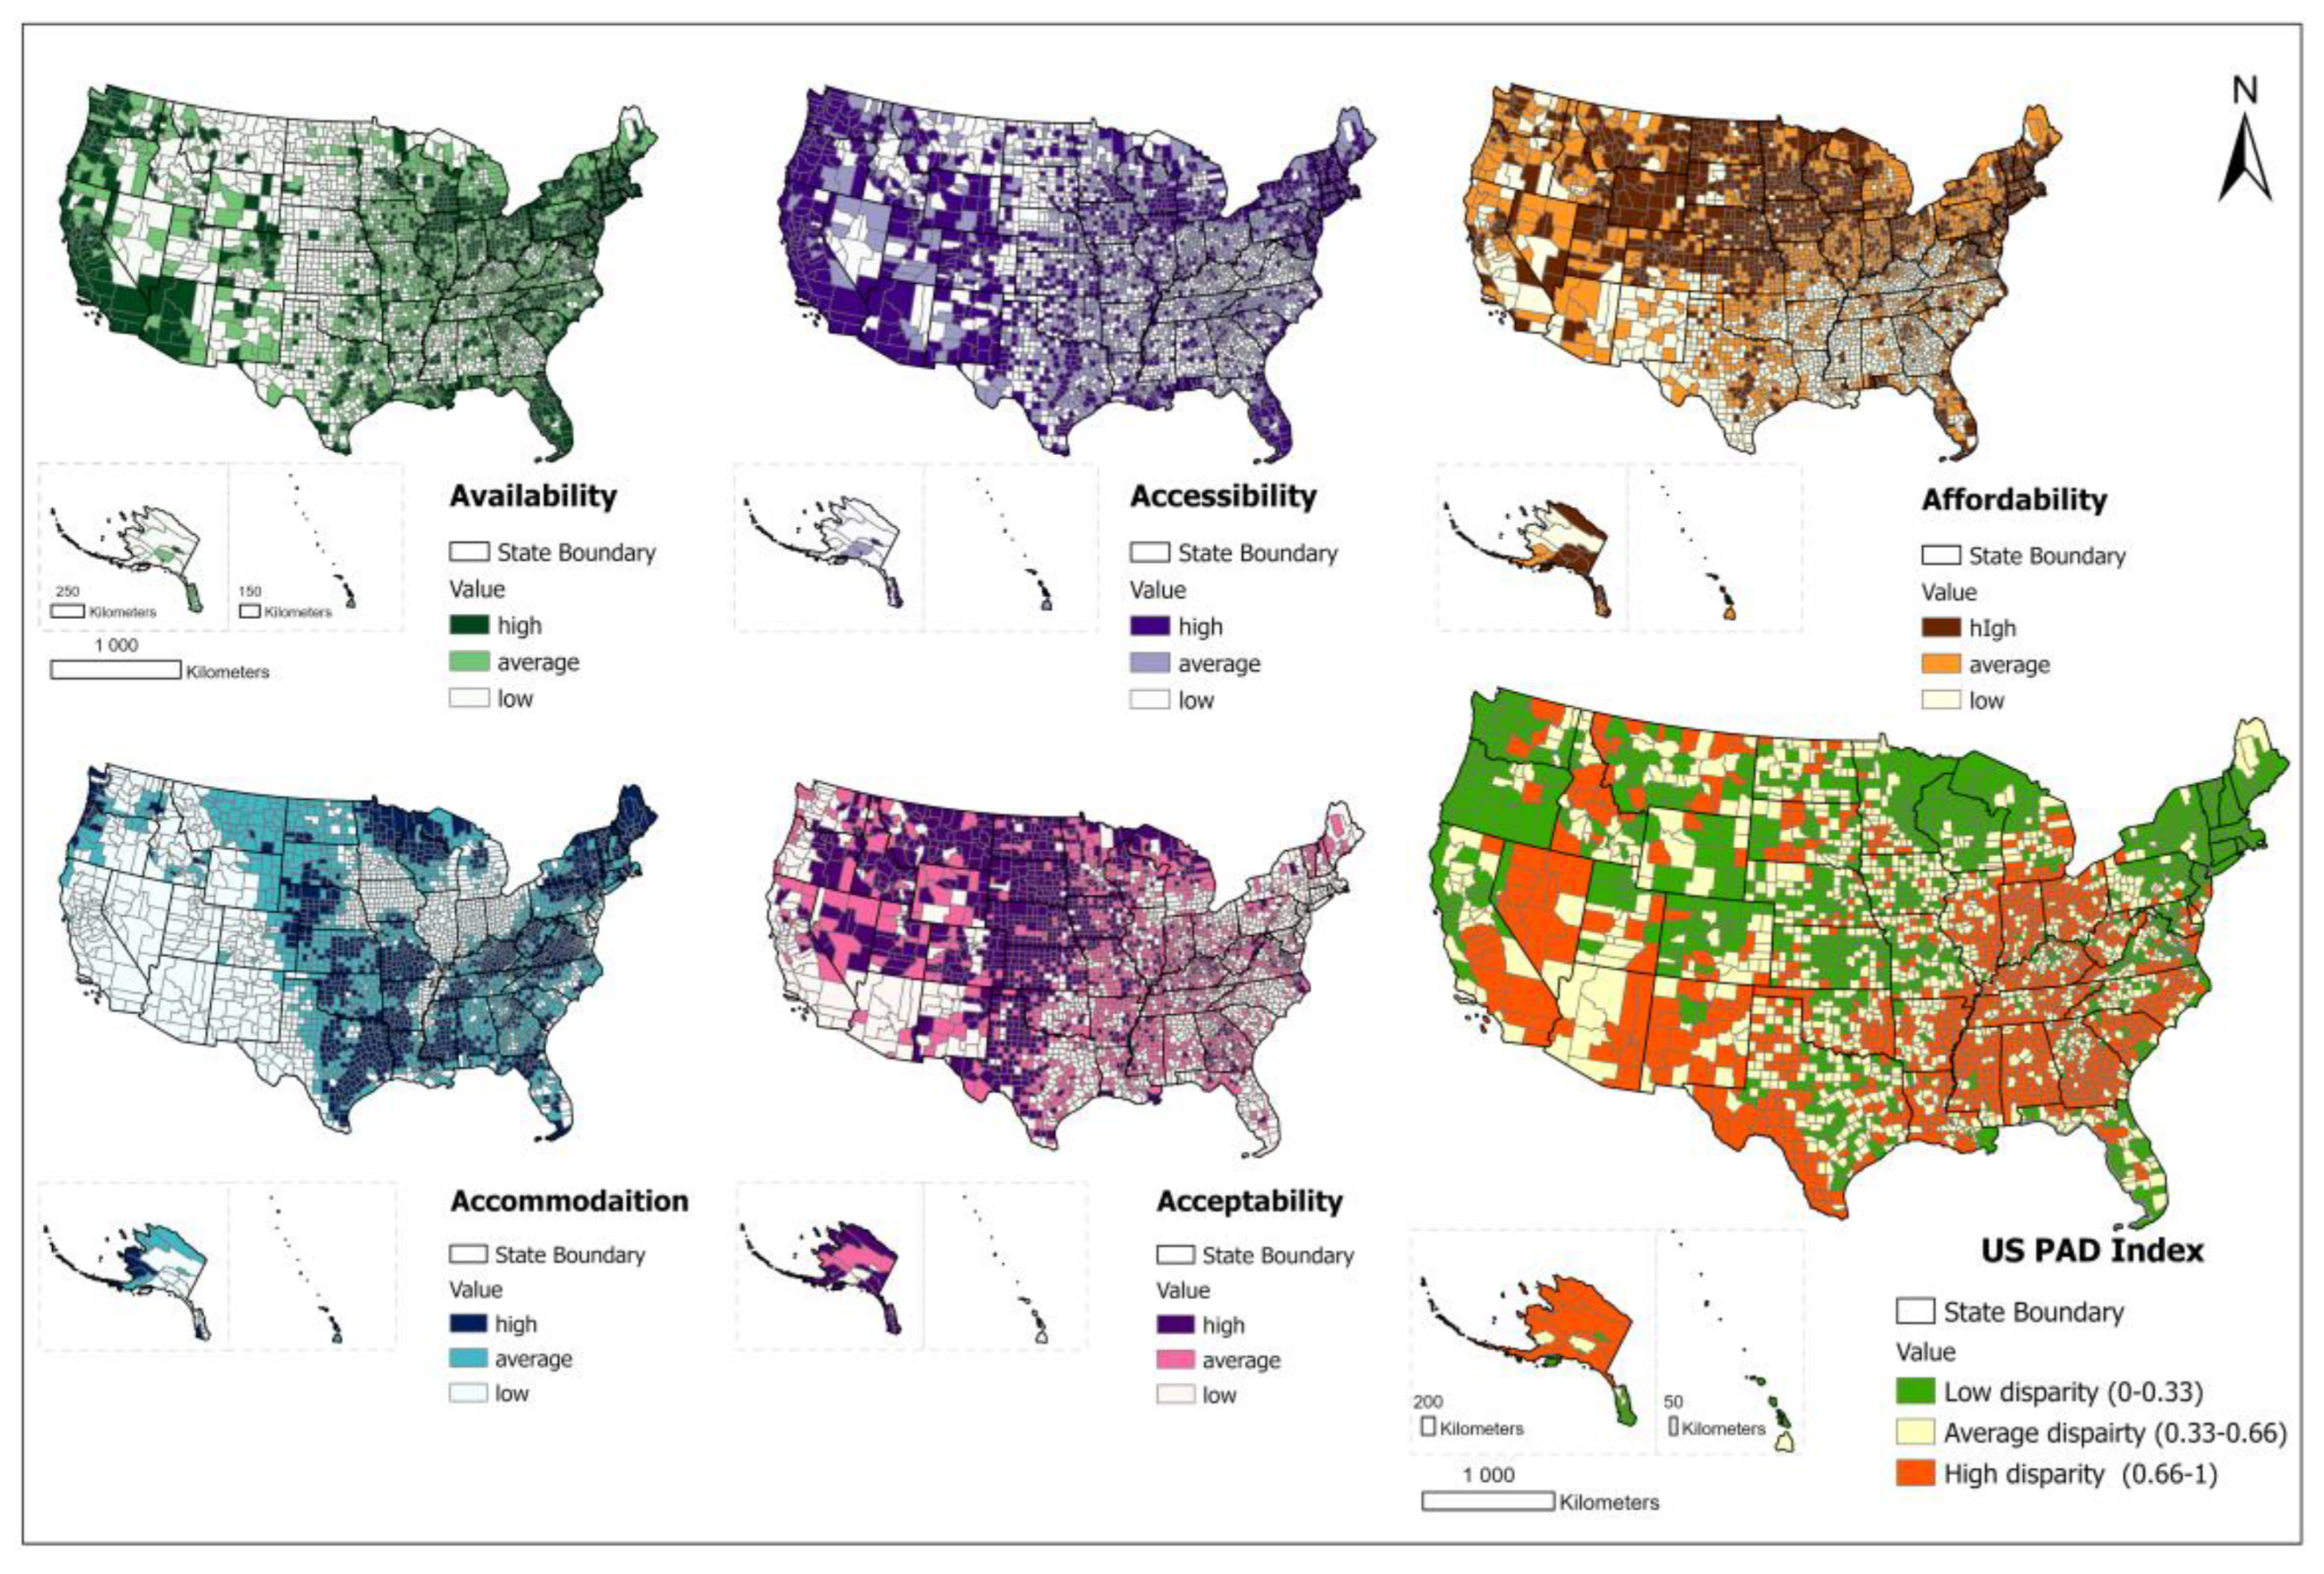
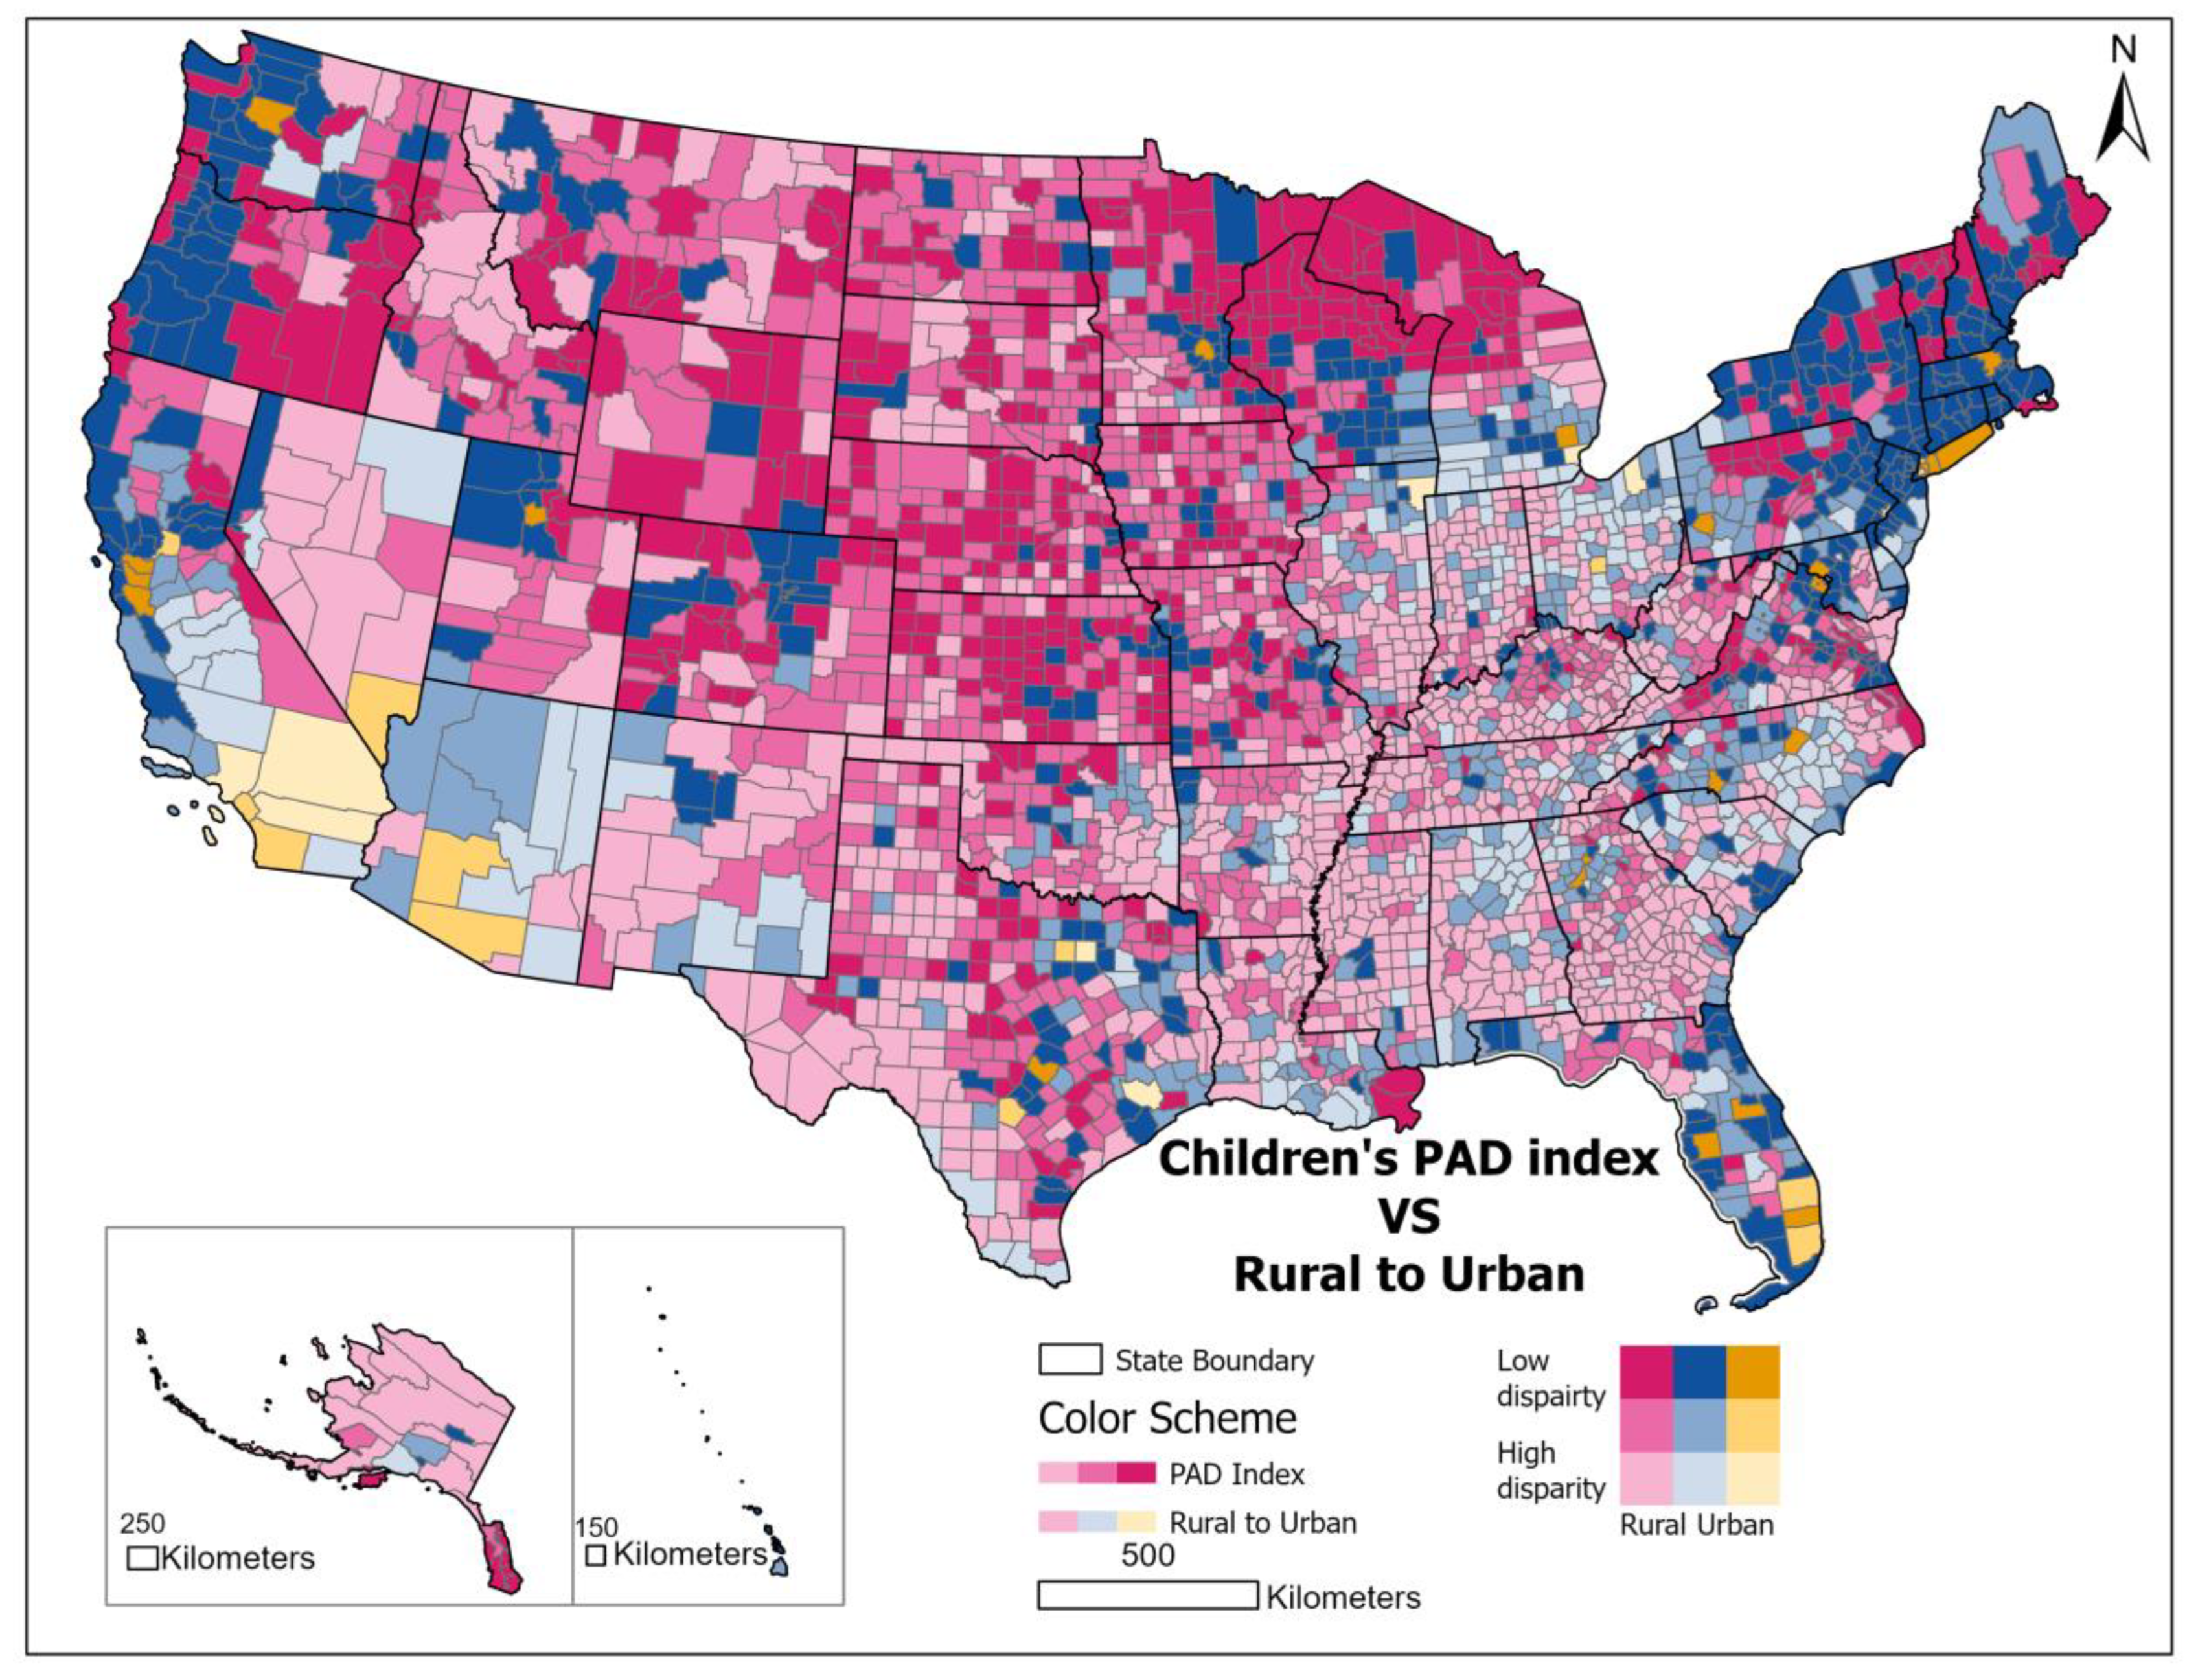
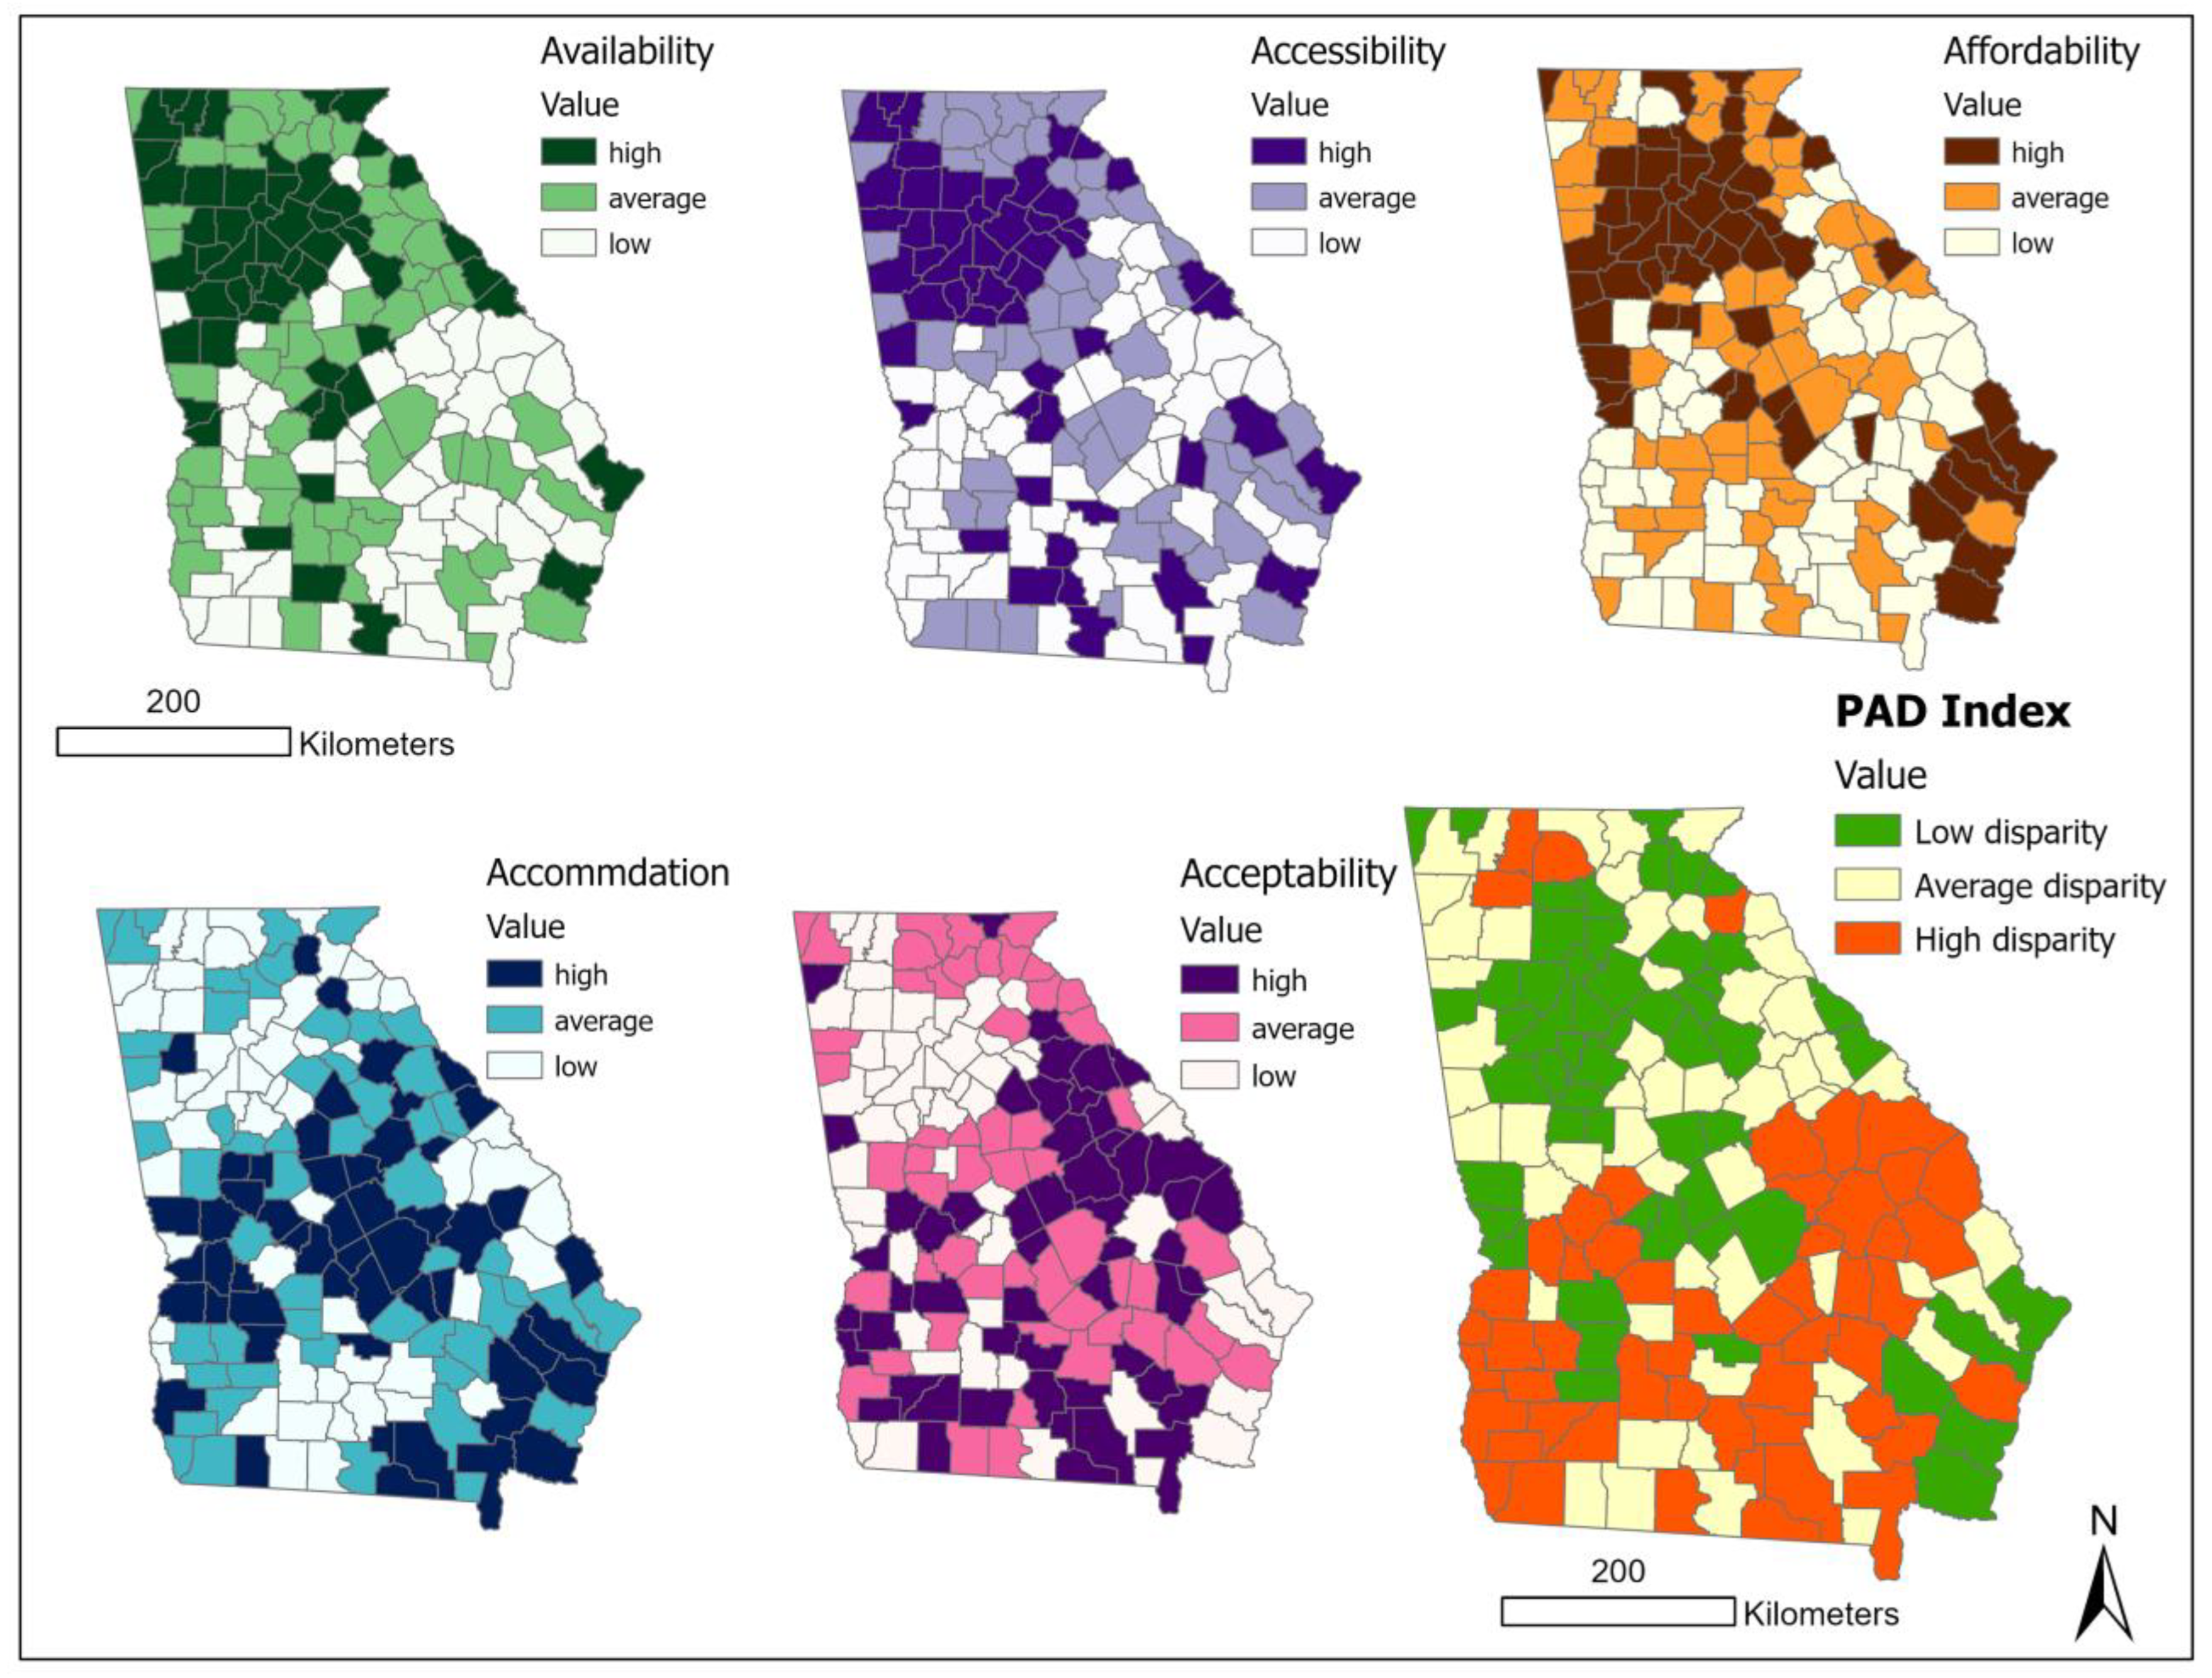
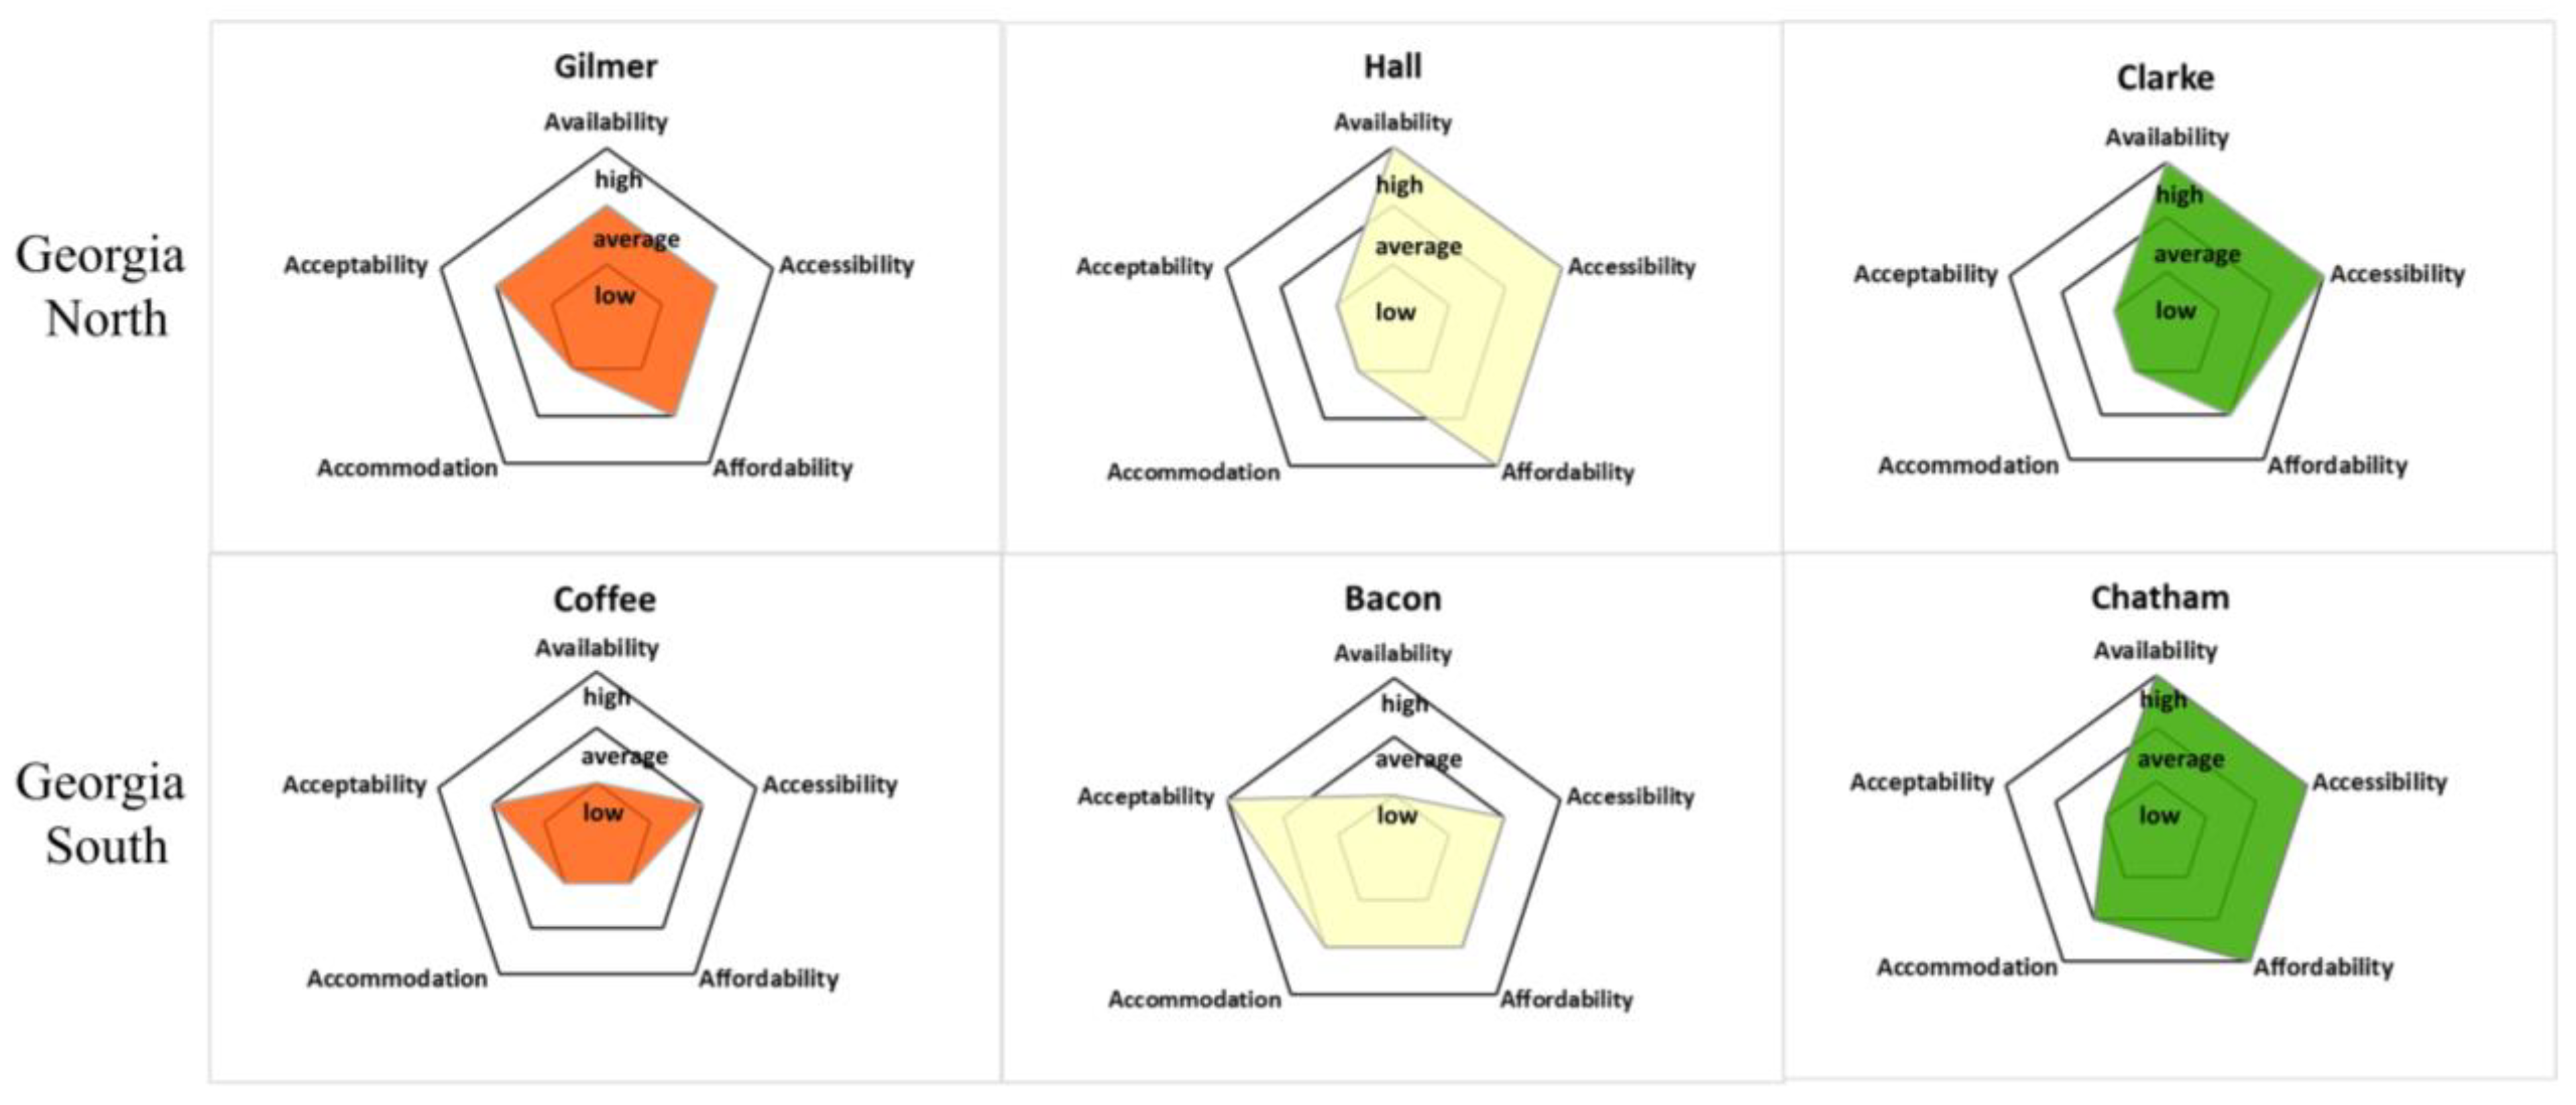
The results were visualized in one line that showed the links between nodes and distribution by clusters. The county cluster is mapped in ArcGIS Pro to offer geographic reference.

4. Result

Figure 2 shows the US’s 5 As indexes and children’s PAD index at the county level. The 5 A “access” values from low to high shows the suitability of the physical activity environment for children from low to high from the 5 A dimensions. The PAD index value from Low to High shows the disparity of PA environment for children from Low to High. We used the US Census region and Division Map to explain the regional results (Supplementary Figure S2) [56]. The PA supply showed high availability in the divisions and subdivisions of Pacific, East North Central, Middle Atlantic, and West Florida. The low availability PA supply was shown on the edge of the West North Central, Mountain, and West South-Central Divisions. In the accessibility index, high values were in the Pacific and East North Central divisions; low accessibility was in the Eastern Center region. For the affordability index, high values were clustered in the northern US; and lower affordability values were clustered in the southern US. High accommodation values were in the South and Northeast, and low accommodation values were in the Pacific, Mountain, and East North Central divisions. High acceptability occurred in the West and Midwest divisions, and low values in the South Mountain, South and Middle Atlantic, and East South-Central divisions. In the overall children’s PAD index, the High disparity values were in Wyoming, Oregon, Wisconsin, Washington, Oregon, and New England Division; and the low PAD value were in the Deep South states and Mountain Division. Moreover, the children’s PAD index could interact with other geographical classifications. Figure 3 shows the PAD index interacting with urban-to-rural classification by a bivariate choropleth map. The rural areas have the most High-disparity PAD areas; they were clustering in the East North Central, East South Central, South Atlantic, and West South-Central divisions. In urban and suburban areas, the High disparity areas were in southern California, southern Arizona, and the East North Central Division.
Figure 4 shows Georgia counties’ 5 As Indexes and the children’s PAD index. Compared to the US children’s PAD index, Georgia’s indexes included more variables (details in Figure 1) in the PAD calculation. The overall pattern of Georgia children’s PAD index is similar to that of the US (Figure 2), showing high PAD values in the south. Only minor differences were observed when zooming into some geographic areas. Three of the 5 As, availability, accessibility, and affordability, showed roughly the same spatial distribution patterns. In these three As indexes, the high value counties clustered in Atlanta and its surrounding area, and the low values clustered in the South of Georgia. However, accommodation and acceptability indexes revealed an inverse pattern compared to the other three. The counties with high values were in the South of Georgia, and those with low values were in the Atlanta area. For the PAD index in Georgia, counties in the Atlanta and Coastal regions had Low disparity values indicated by the children’s PAD index. However, some counties in Northeast Atlanta and most counties in South Georgia demonstrated High disparity in the children’s PAD index.
Figure 5 used wind-rose maps to show the children’s PAD index measurement (5 As as five directions) with low, average, and high (from center to edge) of example counties in North Georgia–Gilmer, Hall, and Clarke; and South Georgia–Coffee, Bacon, and Chatham. There is a geographic variance of the 5 As value distribution between Georgia’s South and North counties. Those counties with an Average or High value on the children’s PAD index had at least one high value in one of 5 As. Gilmer County in North Georgia had a Low children’s PAD index value, one low value, and no high value in the 5 As. Coffee County in South Georgia had a Low children’s PAD index value, with three low values and no high values in the 5 As. This variance indicates that the 5 As impact varies by county. This variance led to further analysis to see how the 5 As distribute in each county.
To further understand how the combinations of 5 As influence the children’s PAD index, we use the SOM method to analyze the Georgia counties into 4 clusters (Figure 6). This SOM result shows four combinations of 5 As in Georgia counties. Counties in the brown cluster showed a high value in availability, accessibility, and affordability, and a low value in accommodation and acceptability. Counties in the light-blue cluster showed a high value accommodation and average in the other four As. Counties in the blue cluster indicated an average value in acceptability and low in the other four As. Counties in the dark blue cluster indicated a high value in accommodation and acceptability and a low value in the other three As. Comparing the SOM and the children’s PAD index in Figure 6b,c, the brown and light-blue clusters generally matched the Low and Average value counties in the PAD index. The blue and dark blue clusters generally matched High disparity in the children’s PAD index. It shows that the 5 As indexes value has different contribution patterns to address the Low disparity in the PAD index. Therefore, the SOM result of 5 As values could explain what can be improved in the High disparity and what could be maintained and improve Low disparity in the children’s PAD index.

5. Discussion

5.1. Summary Findings

We designed and calculated the children’s PAD index for the US and found regional differences. High PAD counties clustered in the US southeast and southwest (Figure 2). Different 5 As contributed to the High PAD index values in these areas. The low value of 2 As (acceptability and accommodation) and 3 As (acceptability, affordability, and accessibility) in combination contribute to High disparity values in the US southeast and southwest, respectively. The finding in the southeast and southwest region informs the policy and program directions to improve the PA environment in the south. For example, the results show a need to increase the quality of the PA environments in the US southeast and decrease the price for access to the PA environment in the US southwest. Moreover, as shown in Figure 1, there is a need for local governments and researchers to collaboratively analyze the PA disparity on a larger geographical scale (e.g., High disparity of PAD index in the Deep South states). We further explored urbanity–rurality in Figure 3 with the children’s PAD index to indicate how the index interacts with other geographical classifications [57]. Most of the High PAD counties are rural, followed by suburban and urban. Additionally, the High PAD rural and urban counties were clustered in the south and west US.
The children’s PAD index can also analyze the in-state PA disparity. Some states indicated a significant spatial disparity of the PAD index within the state, such as California, Texas, and Georgia. Here, we selected Georgia (Figure 5) as the case study to show the geographic variance of the children’s PAD index with the 5 As indicators. The dominating ‘A’ influencing the children’s PAD index is different between North and South Georgia, especially the low PAD index (Figure 5 and Figure 6). The SOM result indicated that the High children PAD index counties have two combinations of the 5 As. One is an average value in the acceptability index, and the other 4 As are low values; another is a high value in the accommodation and acceptability indexes and low in the other 3 As. Different A dimensions need to be prioritized to improve the local PA disparity to improve the children’s PAD. Given the interaction and association between the 5 As and the children’s PAD index, we can strategically change the accommodation (water quality, air pollution), accessibility (shorten the distance to park), availability (increase the recreational places), and affordability (increase open space) in the Coastal region of Georgia, and increase accessibility, availability, and affordability in Southwest Georgia.

5.2. Data Collection for Children’s PAD Index

The data collection process to develop the Children’s PAD index is an important procedure for this study. Previous studies have explored the influence of various environmental factors on children’s physical activity, built environments [58,59], natural environments [60], and socio-demographic environments [14], either separately or in combination. However, to design and analyze the index effectively, a comprehensive framework is necessary. Existing frameworks such as the Social Vulnerability Index [61], County Health Ranking [62], or National Walkability Index [38] have integrated data related to the topics they aim to investigate. Our study involves the concept and framework from those indexes to build the children’s PAD index. We collected the environmental measures from the three environment classifications, as suggested by the previous literature. Then, the different variables of the environmental measures were separated and illustrated diverse spatial outcomes in the 5 As dimensions. For example, we have considered not only the physical places that may impact children’s physical activity, such as parks and recreational centers, but also the psychological factors, including people’s attitudes towards these places with the Google Maps review rate. Our approach provides a comprehensive framework that enables a more nuanced and holistic understanding of the environmental factors and the data collection aspects for the future children’s physical activity’s study.

5.3. PAD Index Contributions and Future Work

This study designed and created the first Physical activity Access Disparity (PAD) index in children to analyze the PA environment suitability. Evidence from a series of studies suggested that children’s PA studies should consider built, socio-demographic, and natural environmental factors [14,59,63]. We adopted GIS measurements and the 5 As of “access” conceptual framework to integrate those factors to build a multi-dimensional children’s PAD index [20,26]. Combining the 5 As indexes within the children’s PAD index introduces the degree of fit between the PA supply and children population demand. This index provides a new perspective on children’s PA research to use the 5 As guideline to study the children’s PA environment and help policymakers estimate the type of improvement for the PA environment. For example, the index could be of use for parents, school administration, park and recreation department, or the American Association of Sports Medicine, to figure out where and how to enhance, improve, and promote children’s physical activity. Furthermore, with the availability of environmental variables on a local scale, this framework is flexible for a more refined analysis.
Lastly, besides the previous access studies [26], we clarify the concept of accommodation and acceptability in PA access. In our study, the accommodation dimension is objectively based on the PA environment aspect to identify how the PA environment or supply facilities accommodate the population. For example, people living with low greenness and high air pollution are associated with an increased risk of mortality, and these areas are not environmentally suitable for people to live in [35]. The acceptability dimension is according to the demand population’s subjective attitude to the PA environment or facilities to define the PA supplies. It shows the safety level for children and parents to feel comfortable playing in the neighborhood due to the road traffic, crime, and vacant places [64,65].

5.4. Limitations

The main limitation of the children’s PAD index is the data availability issue and secondary data usage. Based on the literature review, we collected data from the different databases that might impact the PA environment to build the children’s PAD index. It might still not include all the possible environmental variables due to no available data at a large geographical scale level and outdated data. However, we can add more variables for future research, followed by the flexibility of the 5 As framework. For instance, we add more environmental variables to the Georgia PAD index based on the available data than the US PAD index. The second limitation is validated for the children’s PAD Index. The index treated the weighted environmental variables and 5 As equally in designing the index. Future studies should weigh the variables from the advice of children, guardians, policymakers, and academics.

6. Conclusions

Access to PA among children has demonstrated contributions to the overall health of children. Recently, the prevalence of physical inactivity has been increasing globally, and this is concerning particularly among children due to its consequences over the course of life [1]. We propose a comprehensive public health surveillance tool to improve children’s physical activity environment disparity using existing data. Our approach adopted the GIS method and the 5 As “access” concept to design and build the children’s PAD index. It analyzes the geographical disparity of environmental variables in access to children’s PA. The PAD index identifies “play oases” and “play deserts” for children in US and Georgia. It offers researchers and policymakers guidance to focus on the urgent area with High PAD index and analyze the 5 As situation within it to improve the PA disparity situation. Moreover, with this PAD index framework’s flexible parameter-setting and weighting scheme, future work could be adapted to fit local priorities and policy/program context.

Supplementary Materials

The following supporting information can be downloaded at: https://www.mdpi.com/article/10.3390/ijgi12030134/s1, Figure S1: Within Cluster Sum of Squares result; Figure S2: Census Regions and Divisions of the United States (Census, 2021); Table S1: List of acronyms.

Author Contributions

Conceptualization, Lan Mu, Jue Yang and Janani Rajbhandari-Thapa; methodology, Lan Mu and Jue Yang; formal analysis, Jue Yang; validation, Lan Mu, Jue Yang and Janani Rajbhandari-Thapa; software, Jue Yang; writing—original draft preparation, Jue Yang and Lan Mu; writing—review and editing, Jue Yang, Lan Mu and Janani Rajbhandari-Thapa; visualization, Jue Yang Funding acquisition, Lan Mu and Janani Rajbhandari-Thapa. All authors have read and agreed to the published version of the manuscript.

Funding

Partially funded by UGA President’s Interdisciplinary Seed Grant Program Impact of the School and Surrounding Environment on Implementation of Georgia’s Statewide Childhood Obesity Policy.

Data Availability Statement

All data available is in the Supplementary Materials reference.

Conflicts of Interest

The authors declare no conflict of interest.

References

  1. WHO. Physical Activity. Available online: https://www.who.int/news-room/fact-sheets/detail/physical-activity (accessed on 2 October 2022).
  2. CDC. Lack of Physical Activity. Available online: https://www.cdc.gov/chronicdisease/resources/publications/factsheets/physical-activity.htm#:~:text=Low%20levels%20of%20physical%20activity,annually%20in%20health%20care%20costs (accessed on 15 May 2022).
  3. UN. Convention on the Rights of the Child. United Nations Treaty Ser. 1989, 1577, 1–23. [Google Scholar]
  4. CDC. Benefits of Physical Activity. Available online: https://www.cdc.gov/physicalactivity/basics/pa-health/index.htm (accessed on 2 May 2022).
  5. Sallis, J.F.; Glanz, K. The role of built environments in physical activity, eating, and obesity in childhood. Future Child. 2006, 16, 89–108. [Google Scholar]
  6. Kosowan, L.; Shannon, S.; Rothney, J.; Halas, G.; Enns, J.; Holmqvist, M.; Wener, P.; Goertzen, L.; Katz, A. Informing the Physical Activity Evaluation Framework: A Scoping Review of Reviews. Am. J. Health Promot. 2022, 36, 340–366. [Google Scholar]
  7. Smith, M.; Mavoa, S.; Ikeda, E.; Hasanzadeh, K.; Zhao, J.; Rinne, T.E.; Donnellan, N.; Kyttä, M.; Cui, J. Associations between Children’s Physical Activity and Neighborhood Environments Using GIS: A Secondary Analysis from a Systematic Scoping Review. Int. J. Environ. Res. Public Health 2022, 19, 1033. [Google Scholar] [CrossRef]
  8. Brownson, R.C.; Hoehner, C.M.; Day, K.; Forsyth, A.; Sallis, J.F. Measuring the built environment for physical activity: State of the science. Am. J. Prev. Med. 2009, 36, S99–S123.e112. [Google Scholar]
  9. Witten, K.; Pearce, J.; Day, P. Neighbourhood Destination Accessibility Index: A GIS tool for measuring infrastructure support for neighbourhood physical activity. Environ. Plan. A 2011, 43, 205–223. [Google Scholar] [CrossRef]
  10. McGinn, A.P.; Evenson, K.R.; Herring, A.H.; Huston, S.L. The relationship between leisure, walking, and transportation activity with the natural environment. Health Place 2007, 13, 588–602. [Google Scholar] [CrossRef] [PubMed]
  11. Edwards, N.; Hooper, P.; Knuiman, M.; Foster, S.; Giles-Corti, B. Associations between park features and adolescent park use for physical activity. Int. J. Behav. Nutr. Phys. Act. 2015, 12, 21. [Google Scholar]
  12. Molina-García, J.; Menescardi, C.; Estevan, I.; Queralt, A. Associations between Park and Playground Availability and Proximity and Children’s Physical Activity and Body Mass Index: The BEACH Study. Int. J. Environ. Res. Public Health 2022, 19, 250. [Google Scholar] [CrossRef]
  13. Sallis, J.F. Measuring physical activity environments: A brief history. Am. J. Prev. Med. 2009, 36, S86–S92. [Google Scholar] [CrossRef] [PubMed] [Green Version]
  14. Pontin, F.; Lomax, N.; Clarke, G.; Morris, M.A. Socio-demographic determinants of physical activity and app usage from smartphone data. Soc. Sci. Med. 2021, 284, 114235. [Google Scholar] [PubMed]
  15. Mitchell, R. Is physical activity in natural environments better for mental health than physical activity in other environments? Soc. Sci. Med. 2013, 91, 130–134. [Google Scholar] [PubMed]
  16. Pendergrast, C.; Miles, S.; Choe, Y.; Errett, N. Fitness, Parks, and Active Transportation Organizations Support Community Recovery and Physical Activity After Disasters; Syracuse University Lerner Center for Public Health Promotion: Syracuse, NY, USA, 2022. [Google Scholar]
  17. Alliott, O.; Ryan, M.; Fairbrother, H.; Van Sluijs, E. Do adolescents’ experiences of the barriers to and facilitators of physical activity differ by socioeconomic position? A systematic review of qualitative evidence. Obes. Rev. 2022, 23, e13374. [Google Scholar] [PubMed]
  18. Flaes, S.A.B.; Chinapaw, M.J.; Koolhaas, C.M.; van Mechelen, W.; Verhagen, E.A. More children more active: Tailored playgrounds positively affect physical activity levels amongst youth. J. Sci. Med. Sport 2016, 19, 250–254. [Google Scholar]
  19. Cain, K.L.; Salmon, J.; Conway, T.L.; Cerin, E.; Hinckson, E.; Mitáš, J.; Schipperijn, J.; Frank, L.D.; Anjana, R.M.; Barnett, A. International Physical Activity and Built Environment Study of adolescents: IPEN Adolescent design, protocol and measures. BMJ Open 2021, 11, e046636. [Google Scholar]
  20. Penchansky, R.; Thomas, J.W. The concept of access: Definition and relationship to consumer satisfaction. Med. Care 1981, 19, 127–140. [Google Scholar] [CrossRef]
  21. Cromley, E.K.; McLafferty, S.L. GIS and Public Health; Guilford Press: New York, NY, USA, 2011. [Google Scholar]
  22. Yang, J.; Mao, L. Understanding temporal change of spatial accessibility to healthcare: An analytic framework for local factor impacts. Health Place 2018, 51, 118–124. [Google Scholar]
  23. Perez, D.; Thalken, J.K.; Ughelu, N.E.; Knight, C.J.; Massey, W.V. Nowhere to go: Parents’ descriptions of children’s physical activity during a global pandemic. Front. Public Health 2021, 9, 642932. [Google Scholar]
  24. Li, X.; Zhang, C.; Li, W.; Kuzovkina, Y.A.; Weiner, D. Who lives in greener neighborhoods? The distribution of street greenery and its association with residents’ socioeconomic conditions in Hartford, Connecticut, USA. Urban For. Urban Green. 2015, 14, 751–759. [Google Scholar]
  25. Page, A.S.; Cooper, A.R.; Griew, P.; Jago, R. Independent mobility, perceptions of the built environment and children’s participation in play, active travel and structured exercise and sport: The PEACH Project. Int. J. Behav. Nutr. Phys. Act. 2010, 7, 17. [Google Scholar]
  26. Butler, E.N.; Ambs, A.M.; Reedy, J.; Bowles, H.R. Identifying GIS measures of the physical activity built environment through a review of the literature. J. Phys. Act. Health 2011, 8, S91–S97. [Google Scholar] [CrossRef] [Green Version]
  27. Shashank, A.; Schuurman, N.; Copley, R.; Lear, S. Creation of a rough runnability index using an affordance-based framework. Environ. Plan. B Urban Anal. City Sci. 2021, 49, 321–334. [Google Scholar] [CrossRef]
  28. Mitra, R.; Buliung, R.N. Exploring differences in school travel mode choice behaviour between children and youth. Transp. Policy 2015, 42, 4–11. [Google Scholar] [CrossRef]
  29. Panter, J.R.; Jones, A.P.; Van Sluijs, E.M. Environmental determinants of active travel in youth: A review and framework for future research. Int. J. Behav. Nutr. Phys. Act. 2008, 5, 34. [Google Scholar] [CrossRef]
  30. Davison, K.K.; Lawson, C.T. Do attributes in the physical environment influence children’s physical activity? A review of the literature. Int. J. Behav. Nutr. Phys. Act. 2006, 3, 19. [Google Scholar] [CrossRef] [PubMed] [Green Version]
  31. Ding, D.; Sallis, J.F.; Kerr, J.; Lee, S.; Rosenberg, D.E. Neighborhood environment and physical activity among youth: A review. Am. J. Prev. Med. 2011, 41, 442–455. [Google Scholar] [CrossRef] [PubMed]
  32. McCrorie, P.R.; Fenton, C.; Ellaway, A. Combining GPS, GIS, and accelerometry to explore the physical activity and environment relationship in children and young people-a review. Int. J. Behav. Nutr. Phys. Act. 2014, 11, 93. [Google Scholar] [CrossRef] [Green Version]
  33. Malacarne, D.; Handakas, E.; Robinson, O.; Pineda, E.; Saez, M.; Chatzi, L.; Fecht, D. The built environment as determinant of childhood obesity: A systematic literature review. Obes. Rev. 2022, 23, e13385. [Google Scholar] [CrossRef]
  34. McGrath, L.J.; Hopkins, W.G.; Hinckson, E.A. Associations of objectively measured built-environment attributes with youth moderate–vigorous physical activity: A systematic review and meta-analysis. Sport. Med. 2015, 45, 841–865. [Google Scholar] [CrossRef]
  35. Coleman, C.J.; Yeager, R.A.; Pond, Z.A.; Riggs, D.W.; Bhatnagar, A.; Pope, C.A., III. Mortality risk associated with greenness, air pollution, and physical activity in a representative US cohort. Sci. Total Environ. 2022, 824, 153848. [Google Scholar] [CrossRef]
  36. SafeGraph. SafeGraph POI. Available online: https://www.safegraph.com (accessed on 15 December 2021).
  37. NCES. School Attendance Boundary Survey (SABS). Available online: https://nces.ed.gov/programs/edge/SABS (accessed on 4 May 2021).
  38. USEPA. National Walkability Index. Available online: https://www.epa.gov/smartgrowth/smart-location-mapping (accessed on 12 December 2021).
  39. ESRI. USA Road Density. Available online: https://www.arcgis.com/home/item.html?id=64a95b092457466388f09136e331ff09 (accessed on 10 January 2022).
  40. USFBI. Uniform Crime Reporting Program Data: Arrests by Age, Sex, and Race, United States. 2016. Available online: https://www.icpsr.umich.edu/web/NACJD/studies/37057 (accessed on 10 January 2022).
  41. USCensus. TIGER/Line with Selected Demographic and Economic Data. Available online: https://www.census.gov/geographies/mapping-files/time-series/geo/tiger-data.html (accessed on 20 December 2021).
  42. GDPR. Georgia Parks Edition. Available online: http://www.mapcollaborator.org/georgia/ (accessed on 20 December 2021).
  43. Google. Google Maps API. Available online: https://developers.google.com/maps (accessed on 15 February 2021).
  44. GDOT. Traffic Analysis & Data Application. Available online: https://www.dot.ga.gov/GDOT/Pages/RoadTrafficData.aspx (accessed on 15 January 2022).
  45. USGS. North America Elevation 1-Kilometer Resolution Raster. 2007. Available online: https://www.sciencebase.gov/catalog/item/4fb5495ee4b04cb937751d6d (accessed on 23 May 2022).
  46. EARTHDATA. MODIS/Terra Vegetation Indices Monthly L3 Global 1 km SIN Grid V061. Available online: https://search.earthdata.nasa.gov/search (accessed on 18 January 2022).
  47. USEPA. Air Quality—Cities and Counties. Available online: https://www.epa.gov/air-trends/air-quality-cities-and-counties (accessed on 30 January 2022).
  48. FEMA. National Risk Index. Available online: https://www.fema.gov/flood-maps/products-tools/national-risk-index (accessed on 25 January 2022).
  49. GAEPD. Water Quality in Georgia Report. Available online: https://epd.georgia.gov/geographic-information-systems-gis-databases-and-documentation (accessed on 25 January 2022).
  50. NHTS. National Household Travel Survey. Available online: https://nhts.ornl.gov/2017 (accessed on 23 May 2022).
  51. Greene, R.; Devillers, R.; Luther, J.E.; Eddy, B.G. GIS-based multiple-criteria decision analysis. Geogr. Compass. 2011, 5, 412–432. [Google Scholar] [CrossRef]
  52. Oh, Y.; Kim, Y. A resource recommendation method based on dynamic cluster analysis of application characteristics. Clust. Comput. 2019, 22, 175–184. [Google Scholar] [CrossRef]
  53. Wehrens, R.; Buydens, L.M. Self-and super-organizing maps in R: The Kohonen package. J. Stat. Softw. 2007, 21, 1–19. [Google Scholar] [CrossRef] [Green Version]
  54. Simon, H. Neural Networks: A Comprehensive Foundation; Prentice Hall: Hoboken, NJ, USA, 1999. [Google Scholar]
  55. Lynn, S. Self-Organising Maps for Customer Segmentation Using R. Available online: https://www.shanelynn.ie/self-organising-maps-for-customer-segmentation-using-r/ (accessed on 6 October 2022).
  56. Census. 2010 Census Regions and Divisions of the United States. Available online: https://www2.census.gov/geo/pdfs/maps-data/maps/reference/us_regdiv.pdf (accessed on 14 October 2022).
  57. Martin, S.L.; Kirkner, G.J.; Mayo, K.; Matthews, C.E.; Durstine, J.L.; Hebert, J.R. Urban, rural, and regional variations in physical activity. J. Rural. Health 2005, 21, 239–244. [Google Scholar] [CrossRef]
  58. Wang, X.; Liu, Y.; Zhu, C.; Yao, Y.; Helbich, M. Associations between the streetscape built environment and walking to school among primary schoolchildren in Beijing, China. J. Transp. Geogr. 2022, 99, 103303. [Google Scholar] [CrossRef]
  59. Wang, Y.; Liu, Y.; Song, S.; Gittelsohn, J.; Ouellette, M.; Ma, Y.; Wen, D. Individual, parental and built environmental features as influencing factors of active travel to school in northeast China: Findings from a cross-sectional study. BMJ Open 2022, 12, e047816. [Google Scholar] [CrossRef]
  60. Squillacioti, G.; Carsin, A.-E.; Bellisario, V.; Bono, R.; Garcia-Aymerich, J. Multisite greenness exposure and oxidative stress in children. The potential mediating role of physical activity. Environ. Res. 2022, 209, 112857. [Google Scholar] [CrossRef]
  61. CDC. CDC/ATSDR Social Vulnerability Index (SVI). Available online: https://www.atsdr.cdc.gov/placeandhealth/svi/index.html (accessed on 6 March 2023).
  62. UWPHI. County Health Rankings & Roadmaps. Available online: https://www.countyhealthrankings.org/ (accessed on 6 March 2023).
  63. Wicks, C.; Barton, J.; Orbell, S.; Andrews, L. Psychological benefits of outdoor physical activity in natural versus urban environments: A systematic review and meta-analysis of experimental studies. Appl. Psychol. Health Well-Being 2022, 14, 1037–1061. [Google Scholar] [CrossRef]
  64. Huertas-Delgado, F.J.; Queralt, A.; Chillón, P.; Molina-García, J. Associations between parental reasons for choosing a neighborhood and adolescents’ physical activity and commuting behaviors. J. Transp. Health 2022, 24, 101259. [Google Scholar] [CrossRef]
  65. Brussoni, M.; Gibbons, R.; Gray, C.; Ishikawa, T.; Sandseter, E.B.H.; Bienenstock, A.; Chabot, G.; Fuselli, P.; Herrington, S.; Janssen, I. What is the relationship between risky outdoor play and health in children? A systematic review. Int. J. Environ. Res. Public Health 2015, 12, 6423–6454. [Google Scholar] [CrossRef]
Figure 1. The variable distribution of 5 As for Children’s PAD indexes in the US and Georgia.
Ijgi 12 00134 g001
Figure 2. The 5 As and Children’s PAD index in the US.
Ijgi 12 00134 g002
Figure 3. Children’s PAD index vs. Rural to Urban classification in a bivariate choropleth map.
Ijgi 12 00134 g003
Figure 4. The 5 As and Children’s PAD index in Georgia.
Ijgi 12 00134 g004
Figure 5. The 5 As distribution example counties in Georgia North (Gilmer, Hall, and Clarke) and South (Coffee, Bacon, and Chatham).
Ijgi 12 00134 g005
Figure 6. The SOM clusters compare to children’s PAD index: (a) the cluster of 5 As ranking in Georgia counties, (b) SOM-cluster membership by county Georgia, (c) children PAD index by county in Georgia.
Ijgi 12 00134 g006
Table 1. Environmental measures description.
No.MeasuresData SourceDescription
Built Environment
1Business
Recreation
Safegraph [36]The total count of the following NAICS business locations refers to the business recreation points related to the children’s activity.
The business locations include Recreational and Vacation Camps; Fitness and Recreational Sports Centers; All Other Amusement and Recreation Industries; Zoos and Botanical Gardens; Amusement and Theme Parks; Sports and Recreation Instruction (under education); Museums; Amusement Arcades; and Historical Sites.
2SchoolNational Center for Education Statistics [37]Public Elementary, Middle, and High Schools locations
3National walkability IndexUS Environmental Protection Agency [38]National Walkability Index score
To determine the walkability scores, the intersection density, land use mix, and proximity to transit were integrated into the score calculation.
4Road densityArcGIS Online [39]Roads, highways, bike trails, and footpaths.
5Crime RateUnited States Department of Justice [40]Uniform Crime Reporting Program Data
6Vacant placeCensus American Community Survey (ACS) [41]Vacant housing units
7ParkArcGIS OnlinePublic parks, gardens, and forest polygons
Georgia Department of Parks & Recreation (GDPR) [42]Park points with a set of 13 core activities desired and park status by GDPR
8Business
Review Rate
Google Maps reviews [43]Average Google map review Rate for Business Recreation point
9TrafficGeorgia Department of Transportation (GDOT) [44]GDOT Traffic count point
Natural Environment
10SlopeUS Geological Survey [45]North America elevation 1 km resolution raster
11Greenness (NDVI)MOD13A2 Version 6 [46]The average NDVI raster from 2021 May to 2021 October
12Air pollution
(PM 2.5)
US Environmental Protection Agency [47]PM 2.5: the values shown are the highest among the sites in each county and the weighted annual mean concentration.
13National Risk IndexFederal Emergency Management Agency [48]The index illustrates the US communities most at risk for 18 natural hazards at the county level. It includes avalanches, coastal flooding, cold wave, drought, earthquake, hail, heatwaves, hurricanes, ice storms, landslides, lightning, riverine flooding, strong wind, tornado, tsunami, volcanic eruption activity, wildfires, and winter weather.
14Water
pollution
Environmental Protection Division of Georgia (GA) [49]Water pollution point (Water pollution categories: 4a, 4b, 4c, 5 and 5R)
Socio-demographic Environment
15IncomeCensus ACS [41]Household income
16Below
Poverty
Census ACS [41]Population below the poverty level
17Unemployment RateCensus ACS [41]Unemployment rate
18No High School
Diploma
Census ACS [41]Completion or high school which is equivalent to the not completing post-secondary non tertiary education according to the international standard of education
Disclaimer/Publisher’s Note: The statements, opinions and data contained in all publications are solely those of the individual author(s) and contributor(s) and not of MDPI and/or the editor(s). MDPI and/or the editor(s) disclaim responsibility for any injury to people or property resulting from any ideas, methods, instructions or products referred to in the content.

