
An AR Map Virtual–Real Fusion Method Based on Element Recognition
1
School of Information and Communication Engineering, Beijing Information Science and Technology University, Beijing 100101, China
2
Key Laboratory of Information and Communication Systems, Ministry of Information Industry, Beijing Information Science and Technology University, Beijing 100101, China
ISPRS Int. J. Geo-Inf. 2023, 12(3), 126; https://doi.org/10.3390/ijgi12030126
Submission received: 24 January 2023
/
Revised: 8 March 2023
/
Accepted: 11 March 2023
/
Published: 14 March 2023
Abstract
:The application of AR to explore augmented map representation has become a research hotspot due to the growing application of AR in maps and geographic information in addition to the rising demand for automated map interpretation. Taking the AR map as the research object, this paper focuses on AR map tracking and registration and the virtual–real fusion method based on element recognition. It strives to establish a new geographic information visualization interface and application model. AR technology is applied to the augmented representation of 2D planar maps. A step-by-step identification and extraction method of unmarked map elements are designed and proposed based on the analysis of the characteristics of planar map elements. This method combines the spatial and attribute characteristics of point-like elements and line-like elements, extracts the color, geometric features, and spatial distribution of map elements through computer vision methods, and completes the identification and automatic extraction of map elements. The multi-target image recognition and extraction method based on template and contour matching, and the line element recognition and extraction method based on color space and area growth are introduced in detail. Then, 3D tracking and registration is used to realize the unmarked tracking and registration of planar map element images, and the AR map virtual–real fusion algorithm is proposed. The experimental results and results of an analysis of stepwise identification and extraction of unmarked map elements and map virtual–real fusion reveal that the stepwise identification of unmarked map elements and map model virtual–real fusion studied in this paper is effective. Through the analysis of map element step-by-step recognition efficiency and recognition rate, it is proved that the element step-by-step method in this paper is fast, its recognition efficiency meets the AR real-time requirements, and its recognition accuracy is high.
1. Introduction
Augmented reality (AR) is a human–machine interaction technology that integrates virtual information with real-world information. It uses terminal devices, intelligent recognition, real-time tracking and registration, and other technical means to superimpose various models on computers, text, and other virtual information on the real world for humans to achieve an experience beyond reality by perceiving and interacting [1,2,3].
With the continuous development of AR in recent years, AR representation of geographic information has been made possible [4,5,6]. The application of AR to map information visualization and the generation of AR maps results in maps that transcend the traditional expression of two-dimensional topographic maps and three-dimensional virtual models, provide a rich human–machine interaction interface and enhance the intuitive interpretation of map information and the multidimensional representation of embedded spatial information [3,7].
The application of AR to explore augmented map representation has become a research hotspot due to the growing application of AR in maps and geographic information [8,9,10] in addition to the rising demand for automated map interpretation [7,8].
Based on 2D topographic maps in real scenes, AR maps superimpose virtual augmented information onto topographic maps and display it in real-time. In addition, they seamlessly integrate map world information with virtual world information and quickly and intuitively decode information that is difficult to discern and understand on the map [11,12]. Through the identification of signs, elements, or other special objects, the parsed model and information are matched to the real scene for map augmentation expression, featuring rich information, strong interactivity, and realistic images. It can realize map augmentation information interpretation and description anytime and anywhere in a new interactive experience. AR maps provide support for the automated interpretation of traditional 2D planar maps and enhance the interactive perception of spatial information and the multidimensional dynamic visual description of the real world.
The main contributions of this study are as follows:
- (1)
- This study proves the feasibility of using an automatic identification and extraction method of unmarked map elements to implement augmented reality map applications. Most of the previous AR studies focused on tags that replaced virtual models rather than unmarked map elements, lacking flexibility and automation.
- (2)
- The author designs and proposes a new step-by-step identification and extraction method for unmarked map elements. This method combines the spatial and attribute characteristics of point-like elements and line-like elements, extracts the color, geometric features, and spatial distribution of map elements through computer vision methods, and completes the identification and automatic extraction of map elements. This method changes marker mode in traditional AR for the point-like and line elements in planar maps. With the characteristics of being flexible, accurate, and universal, it can automatically identify and extract multi-type and multi-objective elements from the maps.
- (3)
- A virtual–real fusion algorithm of augmented reality map and virtual model is proposed. The algorithm with certain universality realizes step-by-step identification and extraction for unmarked map elements, 3D tracking and registration, and the seamless integration of the real scene and the virtual model.
- (4)
- Through experiments, such as identification of unmarked map elements and virtual–real fusion and results analysis, it is shown that the step-by-step identification and extraction method for unmarked map elements proposed in this paper is effective. The AR map virtual–real fusion algorithm can extract virtual models corresponding to map elements and seamlessly integrate them with the real scene. The virtual models are displayed accurately and stably so as to achieve the effect of expression enhancement. Through efficiency and recognition rate analysis of step-by-step identification of unmarked map elements, it is illustrated that the step-by-step identification and extraction method for unmarked map elements proposed in this paper is effective, with higher identification efficiency meeting the real-time requirements and a higher accuracy rate. Compared with classical methods, the proposed method improves the recognition efficiency and recognition rate of point-like elements and line elements in the map.
2. Related Research
An AR system determines the position and orientation of the 3D virtual model to be added in the real scene. This process is called tracking and registration, and it is one of the core problems that AR technology needs to resolve. AR requires identifying a specific target in a real scene and then aligning it with the virtual model in 3D space and determining the mapping relationship of the virtual model in different coordinate spaces [13]. According to the different registration methods, tracking and registration can be divided into sensor hardware-based tracking [14] and registration and computer vision-based tracking and registration [15]. Computer vision-based tracking and registration can be divided into markerless tracking and marked tracking, whereby markerless tracking focuses on the automatic recognition and tracking and registration of specific research targets, which are difficult to study at present.
In the study of AR maps, markerless tracking and registration involves a combination of steps such as automatic map object recognition, coordinate space mapping, and virtual–real fusion. In markerless tracking and registration, cameras in computing devices are usually used to capture images of specific targets in the real environment and track the target locations; then, pattern recognition techniques are used to identify the specific targets, thus enabling the determination of target locations and directions. Finally, virtual models or information such as 3D landmarks and rivers are overlaid and displayed on paper maps [7,10,11] and then integrated and displayed together to form augmented maps [4,5,12]. Users can interact with the map in any way they see fit and make queries. While there have been studies on markerless tracking and registration methods, most of them apply to a small range of simple scenes. Moreover, these methods can only track and register a small number of scenes and their features. In addition, they are generally used only for the recognition, analysis, and tracking and registration of specific objects [8]; they lack generality and universality. In addition, semantic description and location characteristics are not tracked and registered. Presently, few studies have been conducted on generic markerless AR for map spatial elements.
The markerless tracking and registration method usually works on the natural features of objects in a scene. It mainly uses image-matching algorithms to achieve image segmentation and matching based on natural features such as feature points [16], contours [17], textures [18], and color boundaries [19] in real scenes or images to be matched. Therefore, image matching is key to the success and accuracy of tracking and registration. Currently, the SIFT [20], SURF [21], ORB [22] FREAK [23], and Over-Segmentation [19] algorithm is the most widely used feature point-based image segmentation and matching algorithm in AR; however, feature point-based methods are sensitive to tracking disturbances because of the lack of detailed texture features on an object’s surface. Canny [24], Neural Network [25], Robert [26], and other algorithms are the most widely used feature contour edge detection algorithms in AR, but the edge contour-based method is more sensitive to the complex background and target object occlusion. The above image-matching algorithms are not suitable for AR applications targeting planar maps with different types of elements.
A real-time device tracks the spatial position and pose of an object on a paper map, calculates the coordinates of the object in the camera based on this information, and achieves accurate alignment of position-related information with the paper map screen. The virtual–real registration method of affine transformation considers the spatial mapping relationship among real-world coordinates, camera coordinates, and virtual-world coordinates [27].
After realizing the tracking and registration of map targets, in order to be able to build a natural fusion of virtual and real scenes, an AR system also needs to ensure visual consistency and rationality in the AR environment, superimpose the virtual model or augmented information into a real scene, and perform fusion of the virtual and real worlds. In the AR map virtual–real fusion process [27,28], the occlusion relationship between the virtual model and the map in the real environment, the position, angle, and size of the model display need to be clearly described. Using the results of map target tracking and registration, virtual models and augmented information such as terrain [29], annotation information [5], map symbols [12], and 3DGIS information [9,10,30] are accurately located and merged with planar maps for presentation. This ensures that the virtual models and information appear correctly and naturally on the screen and that the models and the surrounding environment are coordinated with each other. Most of the existing AR map studies display augmented information according to artificial marker locations [4,5]; however, an AR map is oriented to map elements with different types, different contents, and certain generality, which adds difficulty to the virtual–real fusion. Therefore, the types of elements, spatial characteristics, element attributes, and the display and adjustment of virtual models need to be considered in the fusion process.
Taking the AR map as the research object, this paper focuses on AR map tracking and registration and the virtual–real fusion method based on element recognition. It strives to establish a new geographic information visualization interface and application model. A map element tracking and registration method that is suitable for the identification of map elements such as points and lines and has a certain generality is designed and proposed. This study also investigates the automatic recognition and tracking and registration method of map elements and proposes a virtual–real fusion algorithm for unmarked map models. Based on element recognition, the AR map combines the advantages of electronic maps and planar maps and provides a new human–machine interaction and a rich semantic information expression for modern planar map applications.
3. Identification and Extraction of Unmarked Map Elements
According to the spatial morphology and attribute characteristics of various elements in planar maps, this paper designs and implements a method for identification and extraction of unmarked map elements. The method targets point and line map elements, combines the spatial and attribute characteristics of elements, and extracts the color, geometric features, and spatial distribution of map elements through computer vision methods. It also determines the attributes of element types, sizes, and colors, and completes map element identification, aiding in 3D tracking and registration and virtual reality fusion.
3.1. Characterization of Planar Map Elements
Map symbols, which comprise graphics with different shapes, sizes and colors, and texts, are the graphic language for expressing map contents [31]. These map symbols not only show the spatial location, size, quality, and quantity of geographical objects but also visually show the spatial distribution characteristics and interrelationships of geographical objects and their overall regional characteristics.
Point elements of a planar map usually represent small areas or points that cannot be represented on a scale. They are usually significant, representing schools, stations, and so on [32]. Point elements in a planar map are usually identified by points that must be of a specific size and shape and must also be characterized by definite points of orientation and directionality, variations in color, etc. The symbols representing the point elements of a planar map have relatively regular shapes and colors and are mostly geometric in composition; however, they usually have only a locational significance.
The line elements of a planar map usually express things that extend in a line or band, such as roads, rivers, and boundaries [32]. The line elements in a planar map are usually identified by a spatial line, which can express the type, spatial location, distribution, extension form, and length of things by shape and color but not their width. Line elements usually have a tangible or invisible positioning line, which is the skeleton of the underlying structure forming the map object.
According to the geometric form and distribution status of map objects, 2D map symbols can be divided into point, line, and surface symbols. The identification of unmarked map elements studied in this paper is precisely for point and line map elements, which can be targeted for identification and tracking and registration according to the spatial and attribute characteristics of different types of map elements.
3.2. Step-by-Step Identification and Extraction Method for Unmarked Map Elements
The recognition of planar map elements is a key step in the application of markerless AR maps. In this study, the automatic recognition of point and line elements of the planar map is performed by using a multi-target step-by-step recognition method, i.e., the image captured by the camera is judged in real-time. Given the characteristics of different categories of map elements, template matching and image feature extraction are used to extract the point and line elements of the planar map in a step-by-step manner by using color pre-classification, image opening and closing operations, and contour detection.
3.2.1. Multi-Target Point-like Element Recognition and Extraction Based on Template and Contour Matching
Image template matching is a recognition method that retrieves the parts of a complete image that match well with another template image [33]. During template and source image matching, the template regularly slides across the source image to be detected from top to bottom and from left to right. Each time the template slides to a new pixel point, an image region with the same size as the template is truncated from the source image using this pixel point as the top left vertex, and a pixel-level comparison operation is performed with the template. A grayscale image is eventually returned, where each pixel value reflects how well the neighborhood of that pixel matches the template [34]. The matching degree calculation can be done by methods such as the sum of squares difference matching, correlation matching, and correlation coefficient matching. Based on the results of the matching degree calculation, it is determined whether the template and the source image match.
In planar maps, point-like elements of the same category have similar morphologies, and their sizes are relatively small. This study uses a multi-target image recognition and extraction algorithm based on template and contour matching to identify and extract several different types of point-like elements from planar map backgrounds. The algorithm has multi-class and multi-target features, and different effects on the matching degree calculation method also produce different effects.
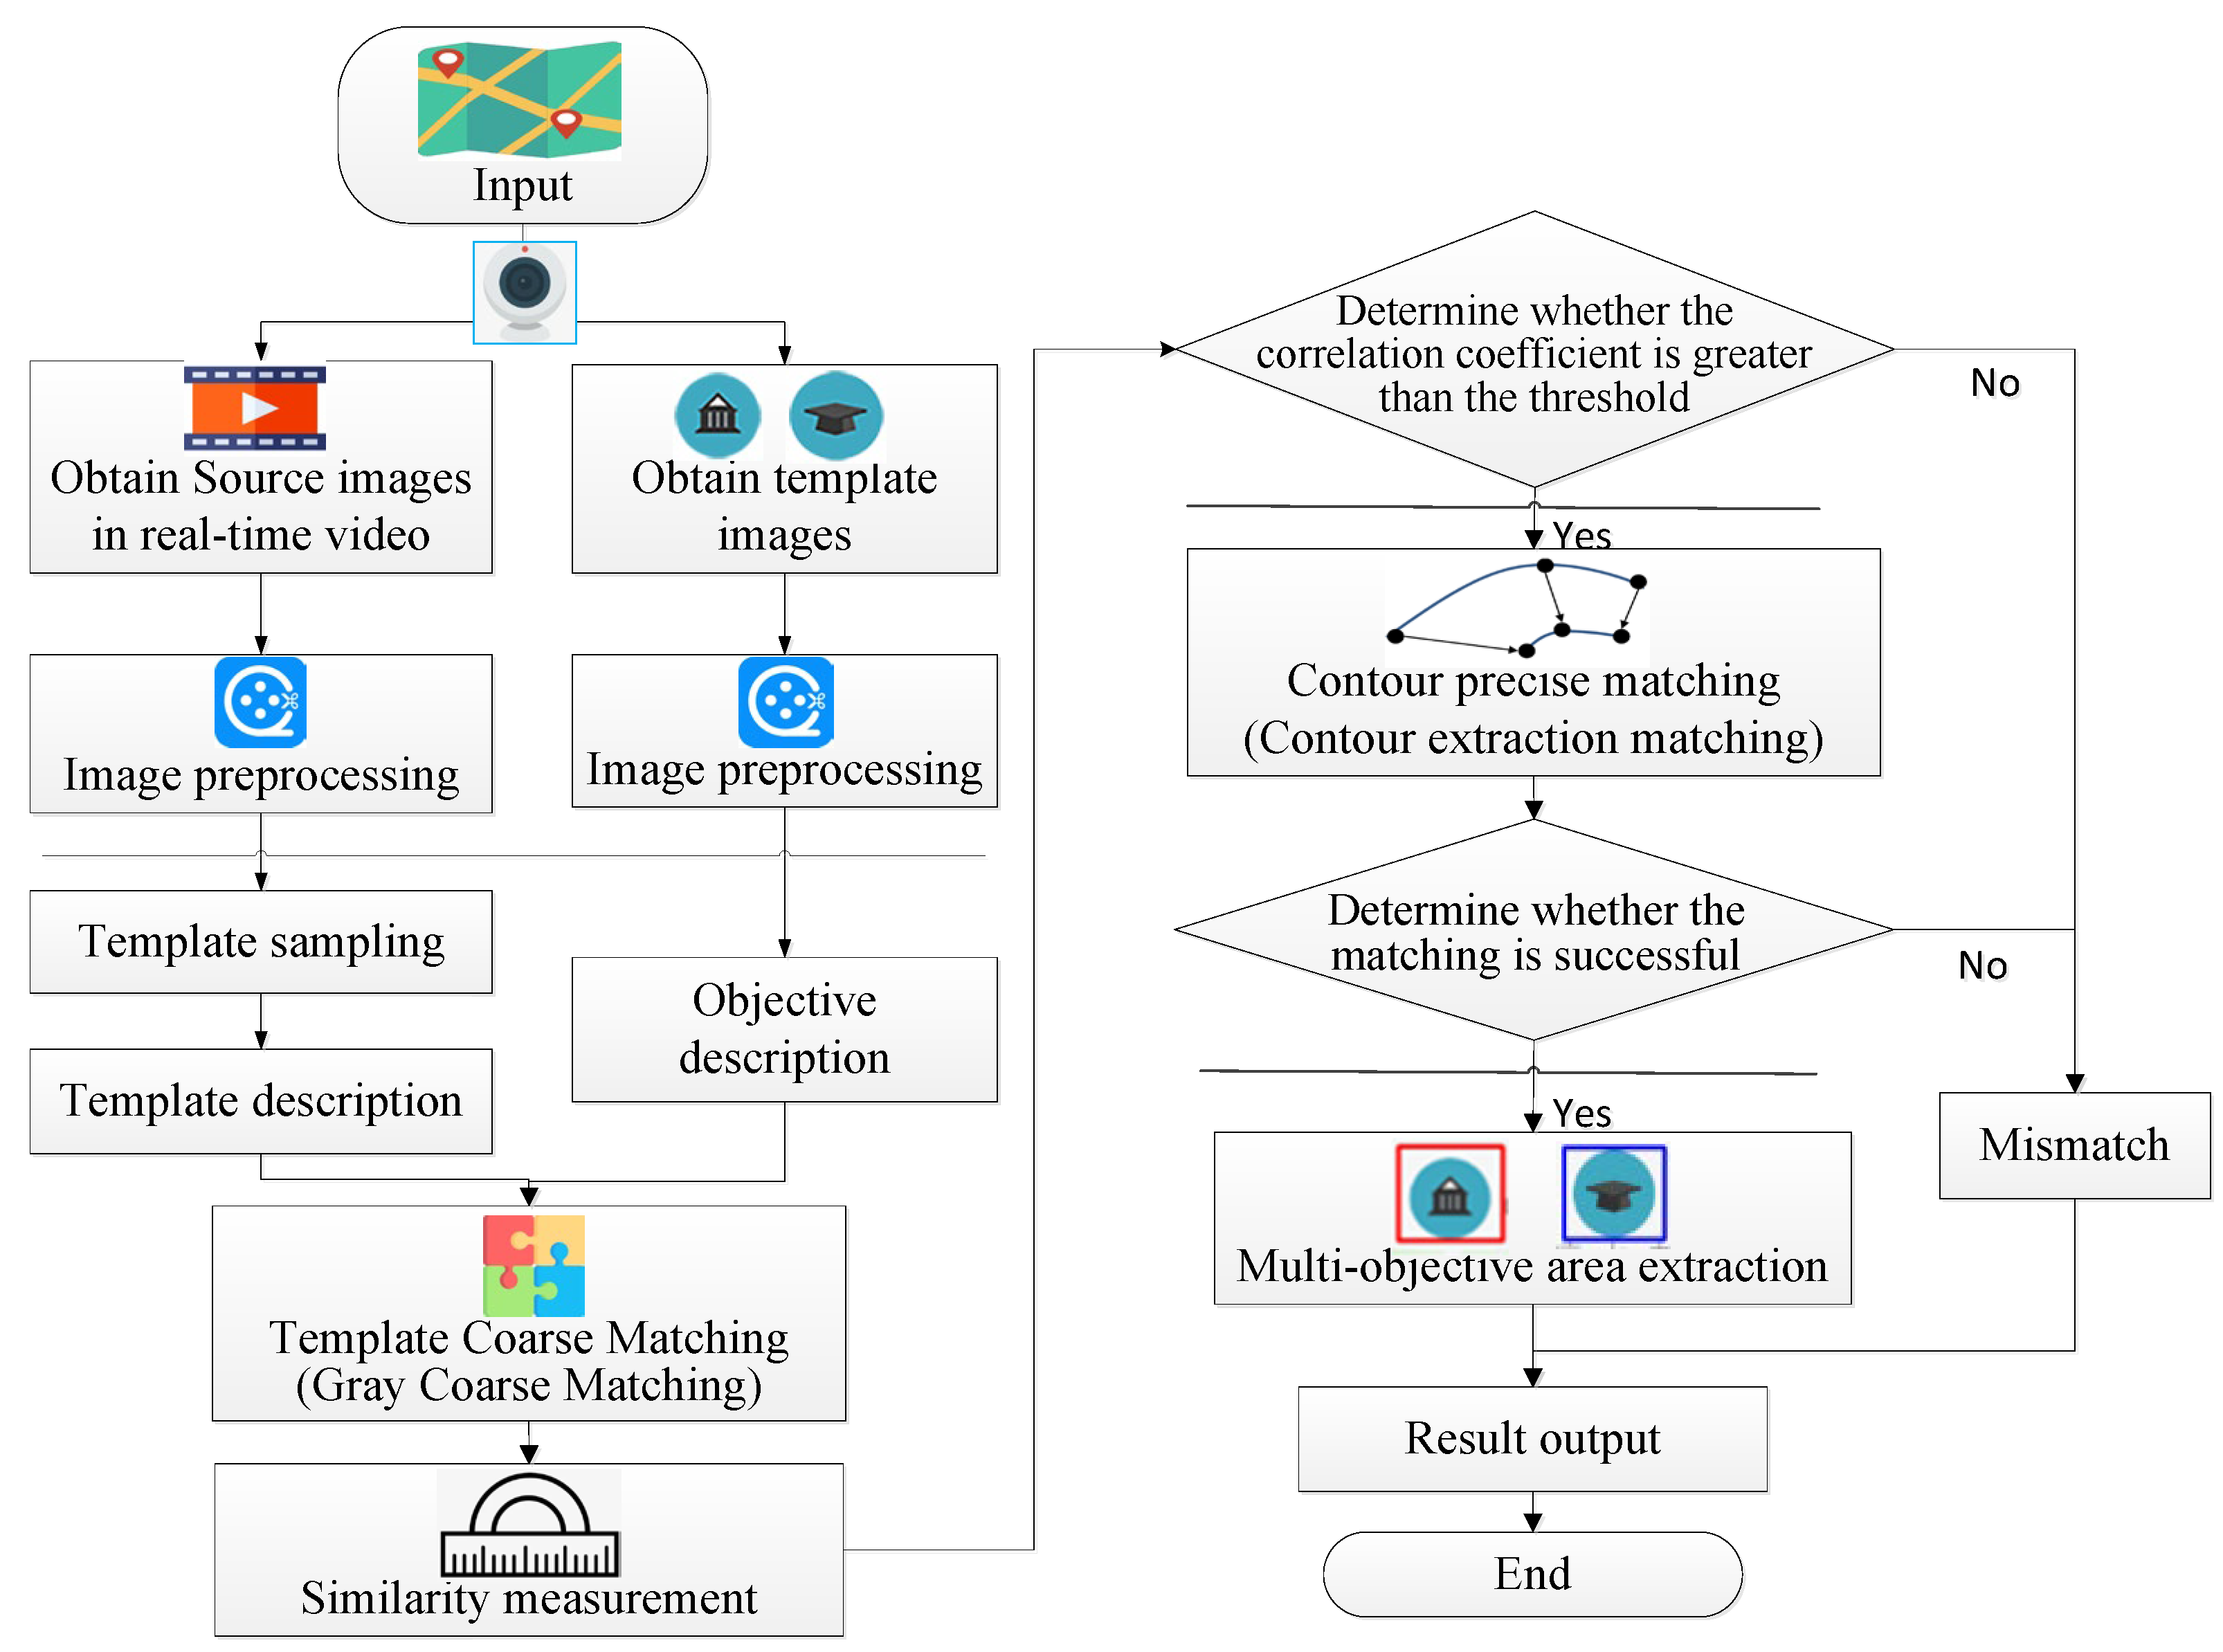
The flow of the image multi-target recognition and extraction algorithm based on template and contour matching in this study is shown in Figure 1.
(1) Image preprocessing.
First, load the source image and the multi-template image and perform image initialization. Acquire information about the attributes, such as template image and source image size, and make the image smooth using Gaussian filtering.
(2) Multi-template coarse matching.
Template matching is a method of finding targets in a specific template in a source image. All possible locations in the image are traversed and compared for similarity to location in the template. When the similarity reaches a threshold, the initial discovery of the target is confirmed. Template matching is used in combination with a recursive algorithm to achieve recognition and extraction oriented to multiple templates and multiple targets.
In template matching, the squared difference matching method is chosen as the evaluation criterion to evaluate the similarity of two images. The squared difference matching (TM_SQDIFF) method uses the sum of squares of individual pixel differences between the image and the template to perform the matching. A match value of 0 is obtained when the match is the best. The worse the match, the larger the match value. The squared difference matching method can be expressed by Equation (1):
where T represents the template image, I represents the image to be matched, and the matching result is denoted by R.
(3) Contour fine matching.
The contour fine matching in this study is a further application of the Canny edge detection method based on multi-template coarse matching [35]. The method is based on the first-order differential operator with two improvements of non-maximal suppression and double thresholding. The use of non-maximum suppression can not only effectively suppress multi-response edges but also improve the localization accuracy of edges. The use of the double-thresholding method can effectively reduce the edge miss detection rate. Canny edge detection consists of the following steps.
Calculate the gradient intensity and direction of the image. The gradient is usually used in images to indicate the degree and direction of change in gray values. Two pixel points with a large difference are judged to be edges, and the change in gray value is maximum at the edges. The gradient values gx(m, n) and gy(m, n) in different directions can be obtained by using the Sobel edge detection operator. The gradient value and gradient direction at a pixel point (m, n) can be calculated by Equation (2):
where G(m, n) is the gradient value at pixel point (m, n), is the gradient value along the axis, and is the gradient value along the y-axis. θ is the gradient direction and I is the image pixel point matrix.
The left and right pixels are tracked along the edge direction using the edge extreme value suppression method. The calculation process requires determining the left and right point positions of the pixel point based on the four directions of the gradient direction of the pixel point determined by the gradient calculation in the previous step. The gradient intensity of the current pixel point is compared with the two pixel points along the positive and negative gradient directions. If the gradient intensity of the current pixel point is greater than the gradient intensity of the other two pixel points, the pixel point is retained as an edge point; or else, the pixel point is suppressed to 0. The edges are detected using a double threshold value. The Max Threshold and the Min Threshold are set, respectively. Values greater than Max Threshold are regarded as edges, while those below Min Threshold are non-edges. For the middle pixel point, if it is adjacent to a pixel point belonging to an edge, it is judged as an edge; otherwise, it is judged as a non-edge.
Calculate the target centroid coordinates. After extraction of the target edges, the X and Y derivatives of the edges and the coordinate information are recorded. Then, the target center point coordinates are calculated by Equations (6) and (7):
where represents the gradient in the horizontal and vertical directions at the ith edge point, respectively. CenterX and CenterY represent the coordinates of the center point, represent the new coordinates of the edge point after coordinate transformation, and n represents the number of edge points found.
(4) Multi-target area extraction.
The target region extraction technique is performed by dividing the image content into different regions based on the difference in pixels between different point-like element symbols according to the need to acquire different point-like element symbols. In order to meet the demand for AR tracking and registration and achieve the extraction of visually focused regions, the multi-target region extraction method segments each target region and background region of the image to complete the extraction of target regions. The extraction process performs multi-target region segmentation and extraction for different point-like element symbols sequentially.
3.2.2. Line Element Identification and Extraction Based on Color Space and Region Growth
Color planar maps contain a large amount of geographic element information, but there are many element types in planar maps, as well as frequent interspersed coverage of line elements and backgrounds, which makes extraction of line elements challenging [36]. In this study, the identification and extraction of lineal elements in planar city maps mainly focused on detecting, matching, and extracting road elements that present lineal distributions in the map.
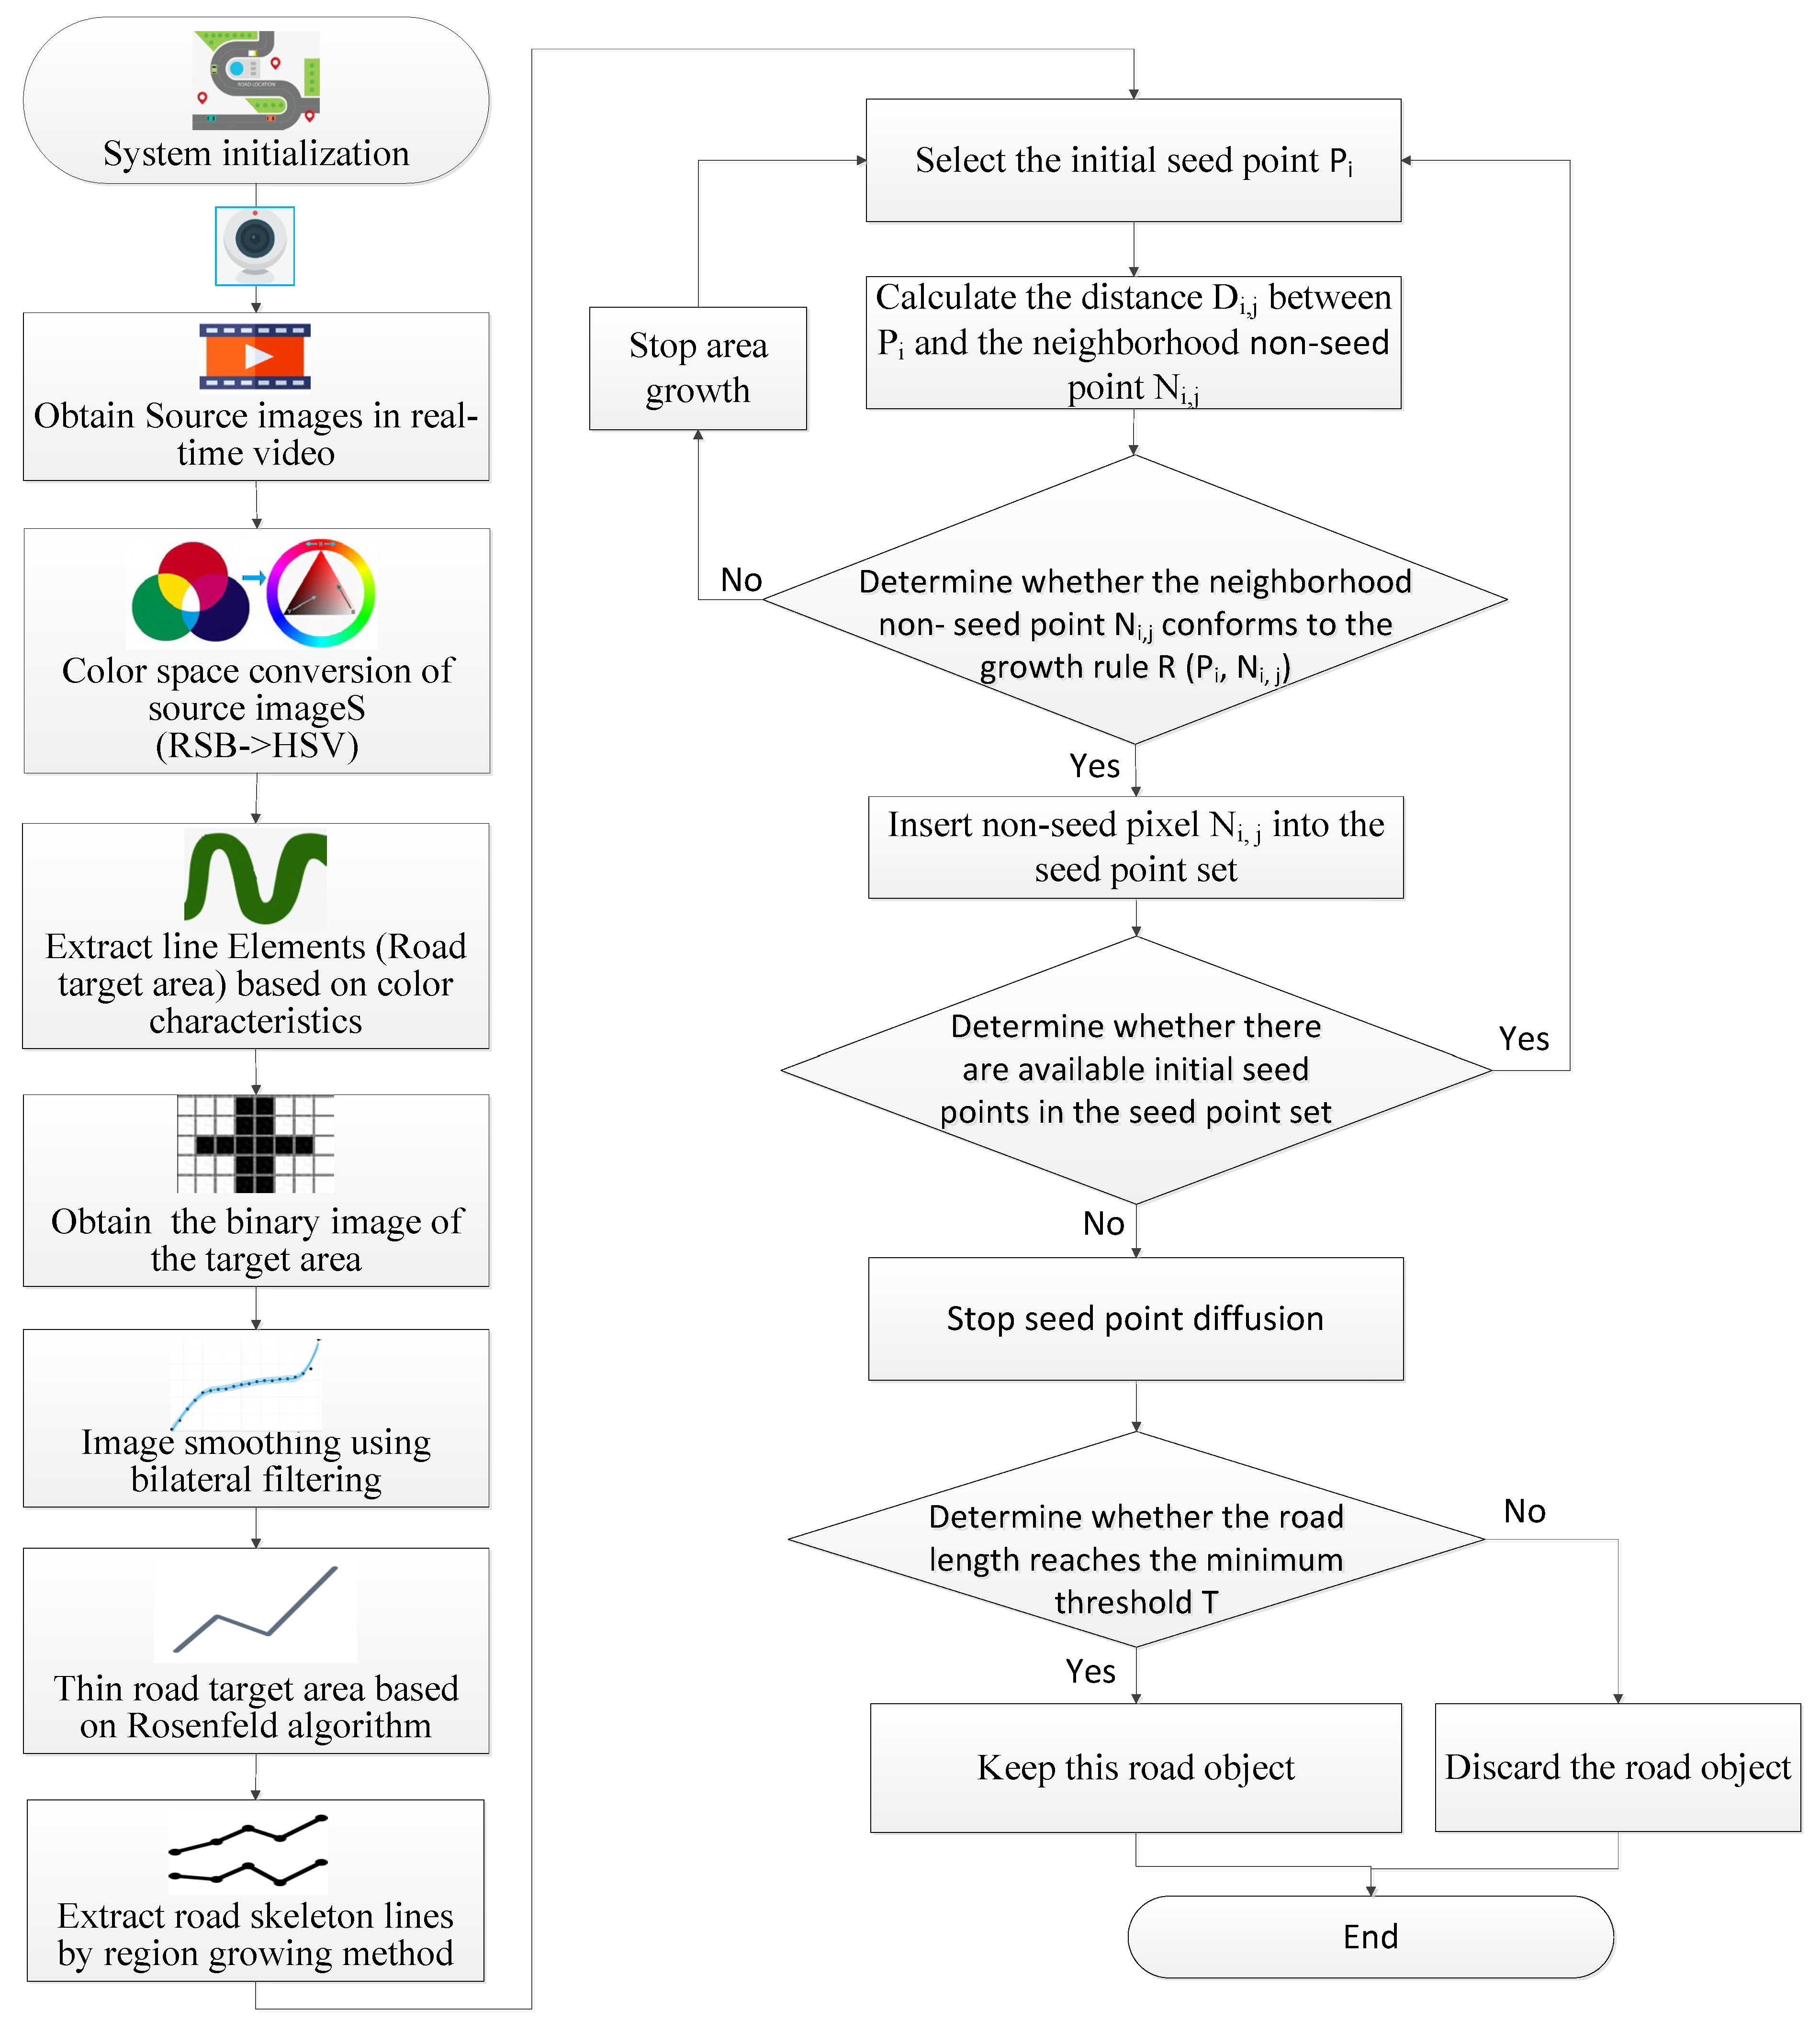
According to the analysis of road elements and background features in the planar city map, different geographic elements have specific colors and large color differences. Therefore, the line elements and backgrounds in the color map can be separated based on color information. For the color and spatial distribution changes of road elements in the planar city map, the lineal elements in the planar map are extracted accurately based on the principle of the area growth and image feature extraction method. The recognition and extraction algorithm of line elements in the planar map is shown in Figure 2.
- (1)
- According to the characteristics of the visual system, the image color space conversion is performed to convert the RGB image to an HSV image to ensure the effect of target extraction [37], and the conversion equation is shown in Equation (10):
- (2)
- Based on the color characteristics of the line elements-roads, the specified color ranges in the planar map are determined, and the associated road target areas are extracted. The color ranges set the corresponding data ranges for hue, saturation, and value, respectively, which are determined by the line elements in the planar map.
- (3)
- The image is converted into a grayscale map, and the grayscale values of the image are used as a basis for segmentation of the binarization to obtain the target binary image.
- (4)
- As the converted image still has some rough edges, it is smoothed using the bilateral filtering method, a non-linear filtering method that is more effective than other methods in preserving the image edges.
- (5)
- Refinement based on the Rosenfeld algorithm [38] for the road target area is performed to complete the road target skeleton line generation preparation.
- (6)
- The road skeleton line is extracted using the area growth method. The initial seed point is set, and any pixel point of the road target area is selected as the seed point.
- (7)
- Using the initial seed point as the starting point, we determine whether the non-seed points in the eight neighborhoods around the seed point meet the growth rule, and if they do, these non-seed points are inserted into the set of seed points. If they do not meet the growth rule, growth is stopped. We then proceed to find new initial seed points.
The road seed region is defined as a set of pixel points, which are denoted as {P1, P2, …, Pn}. The pixel of the jth non-seed point in the neighborhood of the ith (i ∈ [1, n]) seed point Pi in the region is denoted as Ni,j and its growth rule is defined as R (Pi, Ni,j). Assuming that the gray value of the seed point Pi is Gi and the gray value of Ni,j is Gi,j , then the distance between Pi and Ni,j is defined as:
The regional growth rule R(Pi, Ni,j) is defined as:
where T is the threshold value of the growth rule. When Di,j < T, it is determined that Pi and Ni,j satisfy the principle of homogeneity and conform to the growth rule. Their values are set to true. Otherwise, the growth rule sets the judgment result to false.
- (1)
- When there are still initial seed points available in the seed point set, return to step 7. After there are no available initial seed points, seed diffusion is ended. It is then determined whether the extracted road route length reaches the minimum threshold. If it does not satisfy this requirement, it is discarded; otherwise, it is retained.
- (2)
- Target extraction is ended.
4. Three-Dimensional Tracking and Registration of Unmarked Map Elements
Three-dimensional trace registration is essential to realizing the virtual–real fusion of unmarked AR map models. Based on the identification of point and line elements of the plane map, the virtual model and attribute information corresponding to the elements are obtained according to the different map element types and location information that are automatically identified and extracted. The virtual model is accurately positioned on the plane map of the real world to complete the 3D registration.
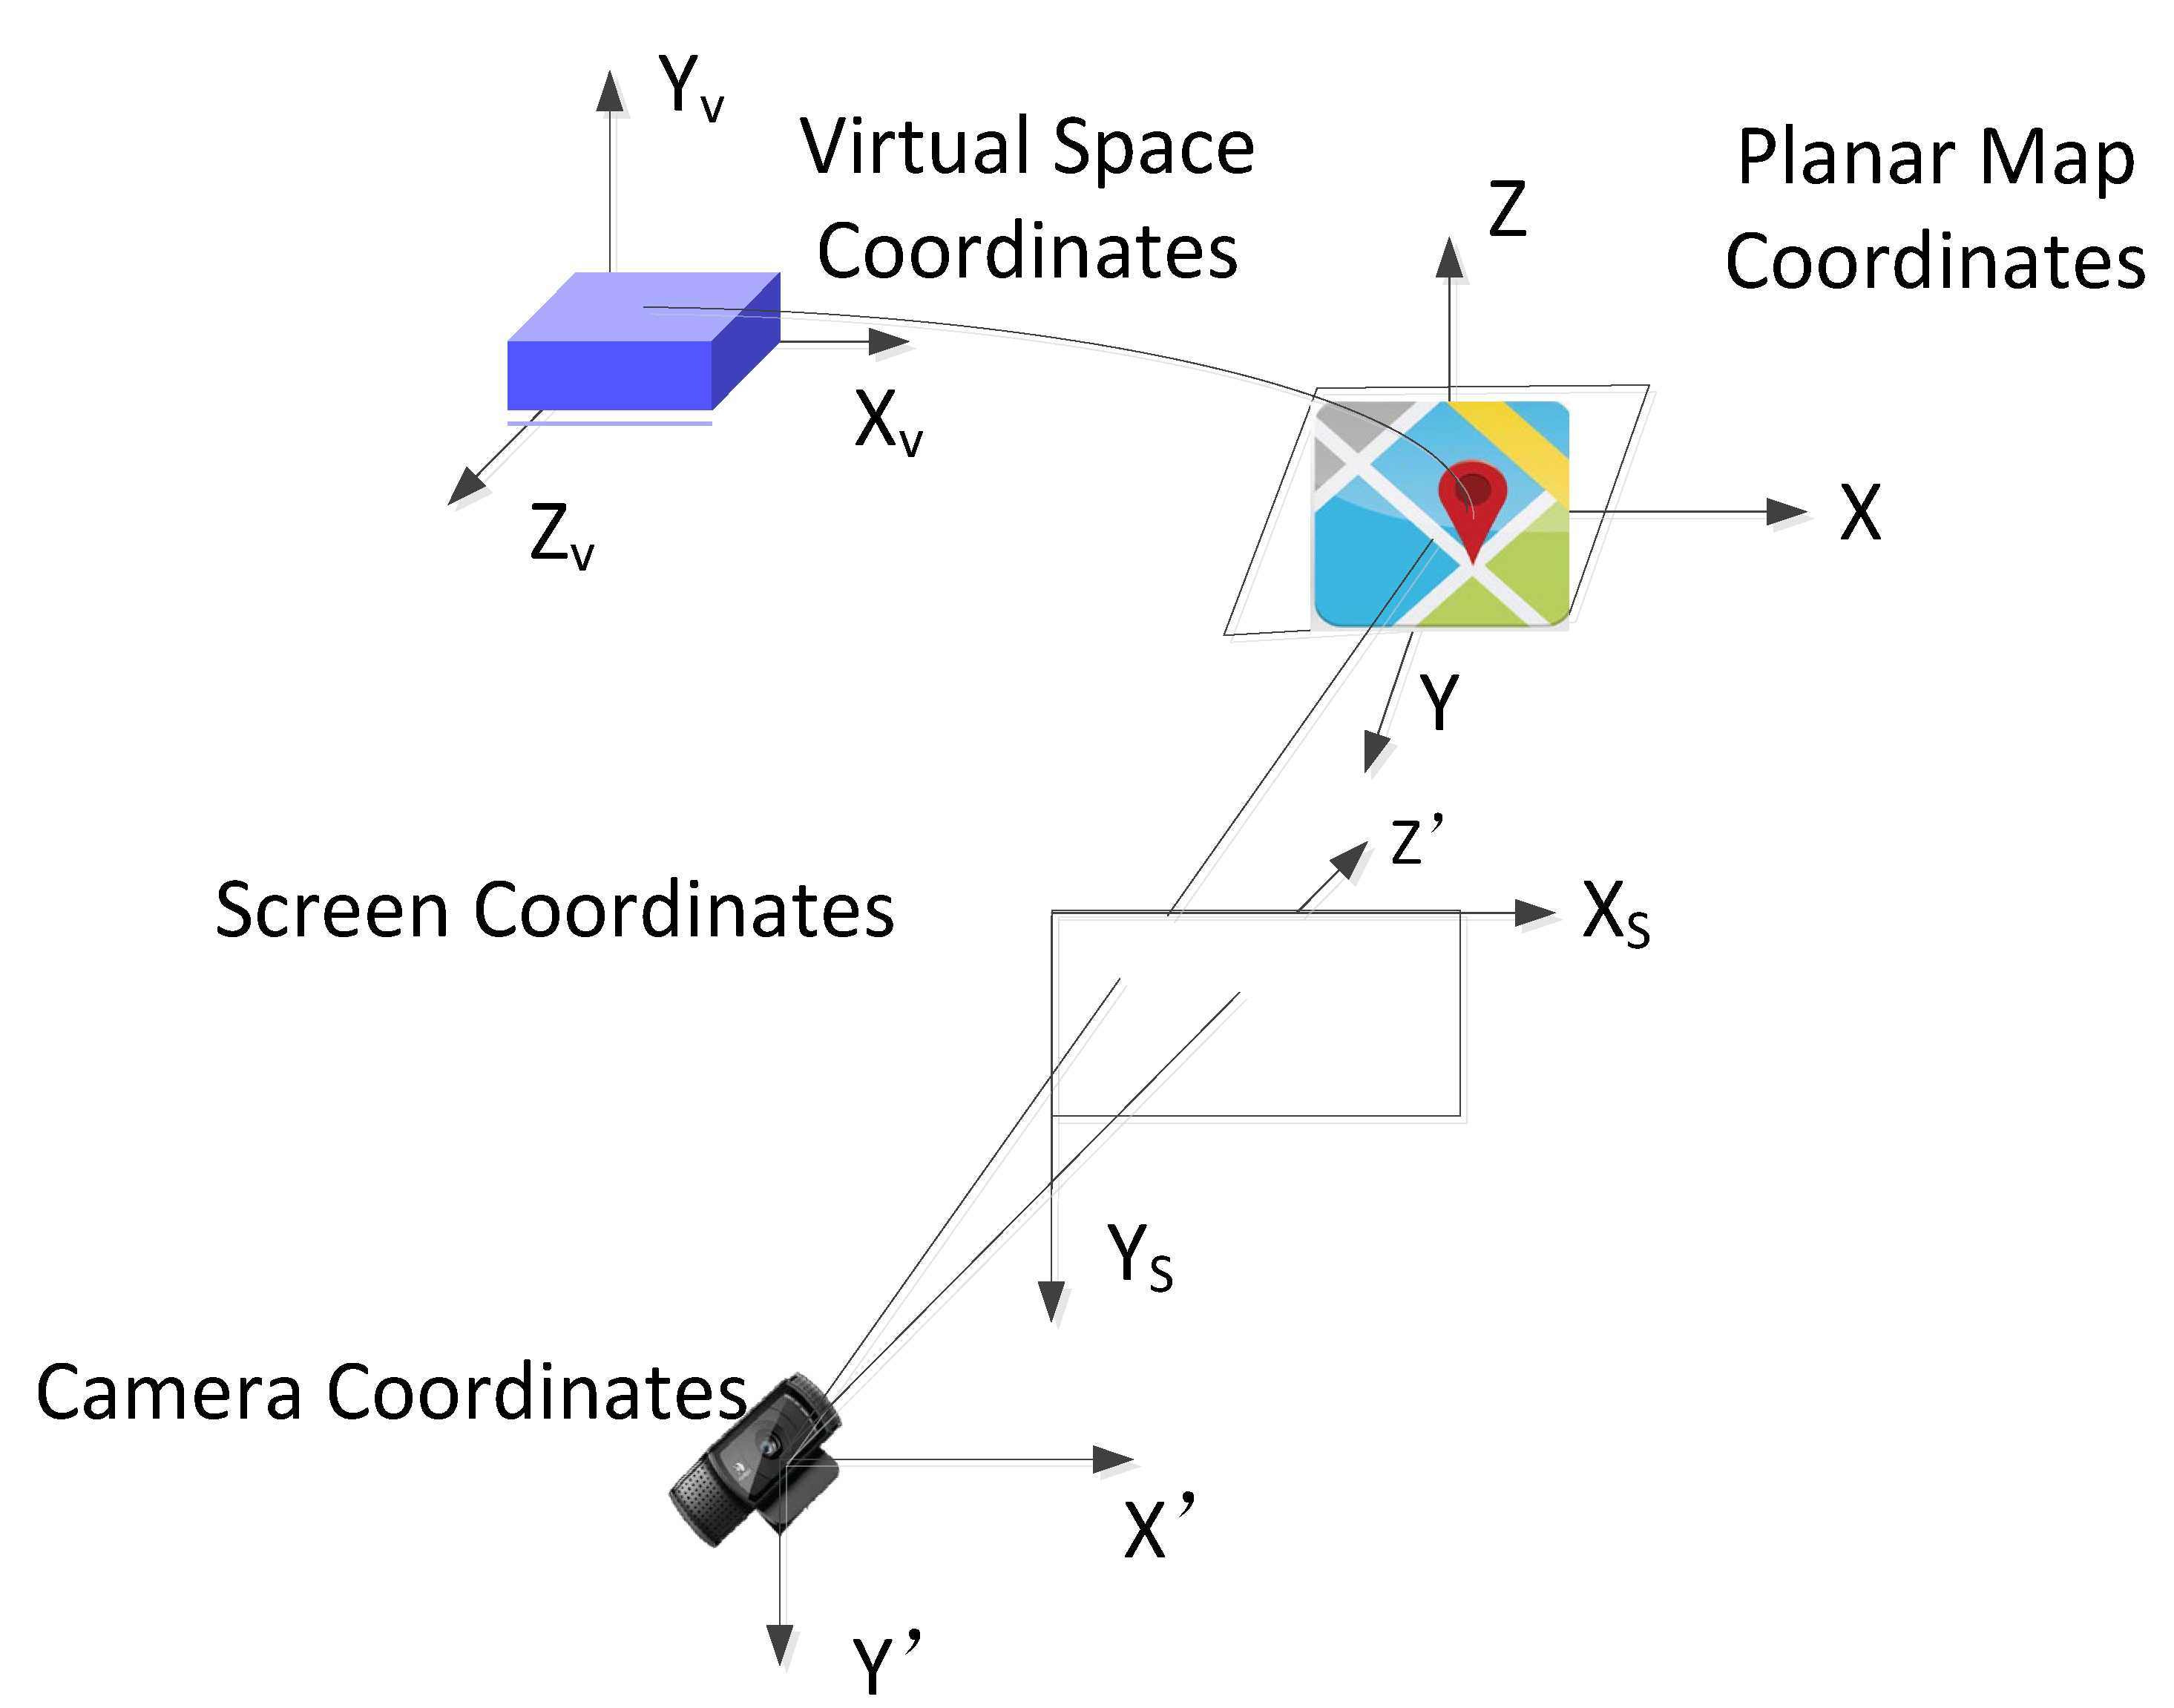
The goal of 3D tracking and registration is to align the real scene with the virtual model in 3D space, unify the four types of coordinate systems, i.e., plane map coordinate system (real space coordinate system), virtual space coordinate system, screen coordinate system, and camera coordinate system, and realize the seamless integration of real scene and virtual information [39]. To achieve 3D registration, it is necessary to obtain real-time data of the real space from the current scene, including camera position, angle, and movement data, and unify four types of coordinate systems. This process is referred to as tracking. The tracking and positioning include the spatial tracking and positioning of the camera and the virtual model in real space. The schematic diagram of 3D tracking and registration is shown in Figure 3.
The tracking and registration technique requires that the target feature points and the contours of the target that are to be enhanced are first retrieved before target tracking is performed. This part of the study is described in Section 3. The following section focuses on the methods for 3D registration. Commonly used tracking and registration techniques mainly include hardware tracker-based methods and computer vision-based methods [15,40]. The latter is chosen in this paper based on the characteristics of AR map applications, which determines the relative position and orientation of the camera to the real-world planar map elements by capturing several image frames in a given real-time video stream and uses a projection transformation to achieve 3D registration.
In order to achieve seamless fusion of the virtual model and the planar map in a real scene, it is necessary to calculate the 3D registration information corresponding to the image frames in the real-time capture video stream, perform projection transformation on the virtual model according to the registration information, and finally fuse the projection transformed virtual model with the real scene. The 3D registration based on computer vision establishes the conversion relationship between a point on the virtual model in 3D space and its corresponding projection point on the plane map in the real scene by calculating the projection coordinates from the virtual model to the image of the real scene. Then, we determine the conversion relationship between four types of coordinate systems: plane map coordinate system, virtual space coordinate system, screen coordinate system, and camera coordinate system [41,42,43]. The 3D registration of the virtual model is performed based on the camera position pose data.
Determining each coordinate system and deriving the transformations therein is the key to 3D registration. It is assumed that the real space coordinate system is and the camera space coordinate system is . As the position and pose of the virtual model in the plane map coordinate system are determined by the corresponding elements on the map, the conversion relationship between the camera coordinate system and the real space coordinate system is shown in Equation (15):
where R is a third-order rotation matrix that is the rotation matrix when rotating the camera coordinate system so that it coincides with the real coordinate system and can be viewed as the sum of the results of rotations about the , , and axes, respectively, with the elements of each column indicating the components to be rotated, as follows:
The matrix represents the translation distance of the camera coordinate system in the world coordinate system along the axis direction. Combining the above analysis, R and T denote the pose and position of the camera, which are translated into the flush coordinate system as shown in Equation (17):
Suppose the coordinate system of a point in virtual space is , there is a transformation relationship between the camera coordinate system and the virtual space coordinate system in perspective geometry, and the initial value of the virtual space coordinate system obtained is:
By converting the camera coordinate system to the flush virtual space coordinate system, the flush coordinate values of the virtual space become:
where f is the focal length. Combining Equations (17) and (19), the conversion relationship between the real space coordinate system and the virtual space coordinate system is obtained as Equation (20):
where K and P are the internal and external parameters of the camera. K is determined by the camera itself and enables the conversion between the camera coordinate system and the screen coordinate system. P is the conversion between the real space coordinate system and the camera coordinate system. R is the rotation matrix, which represents the pose of the camera, and T is the translation matrix, which represents the position of the camera.
The above coordinate transformation does not involve the Scale parameter of the object. However, in order to achieve the effect of seamless integration, the scale of the virtual model needs to be changed to overlay the corresponding virtual model in the real world in the process of virtual–real fusion.
5. AR Map Virtual–Real Fusion Algorithm
It is necessary for virtual reality fusion to determine the correct position, angle, and size of the virtual model display. This ensures that the virtual model has the correct spatial coordinates and occlusion relationship in the real scene and that the display of rationality between them as well as geometry, lighting, and rendering show consistency. It is also necessary to complete the virtual model rendering and fusion to achieve the augmented expression effect [44]. AR map virtual–real fusion uses a terminal to interact naturally in the real environment, superimposes the virtual model and information directly on the real scene, and realizes the 3D augmented expression of point-like and line-like spatial elements in the planar map.
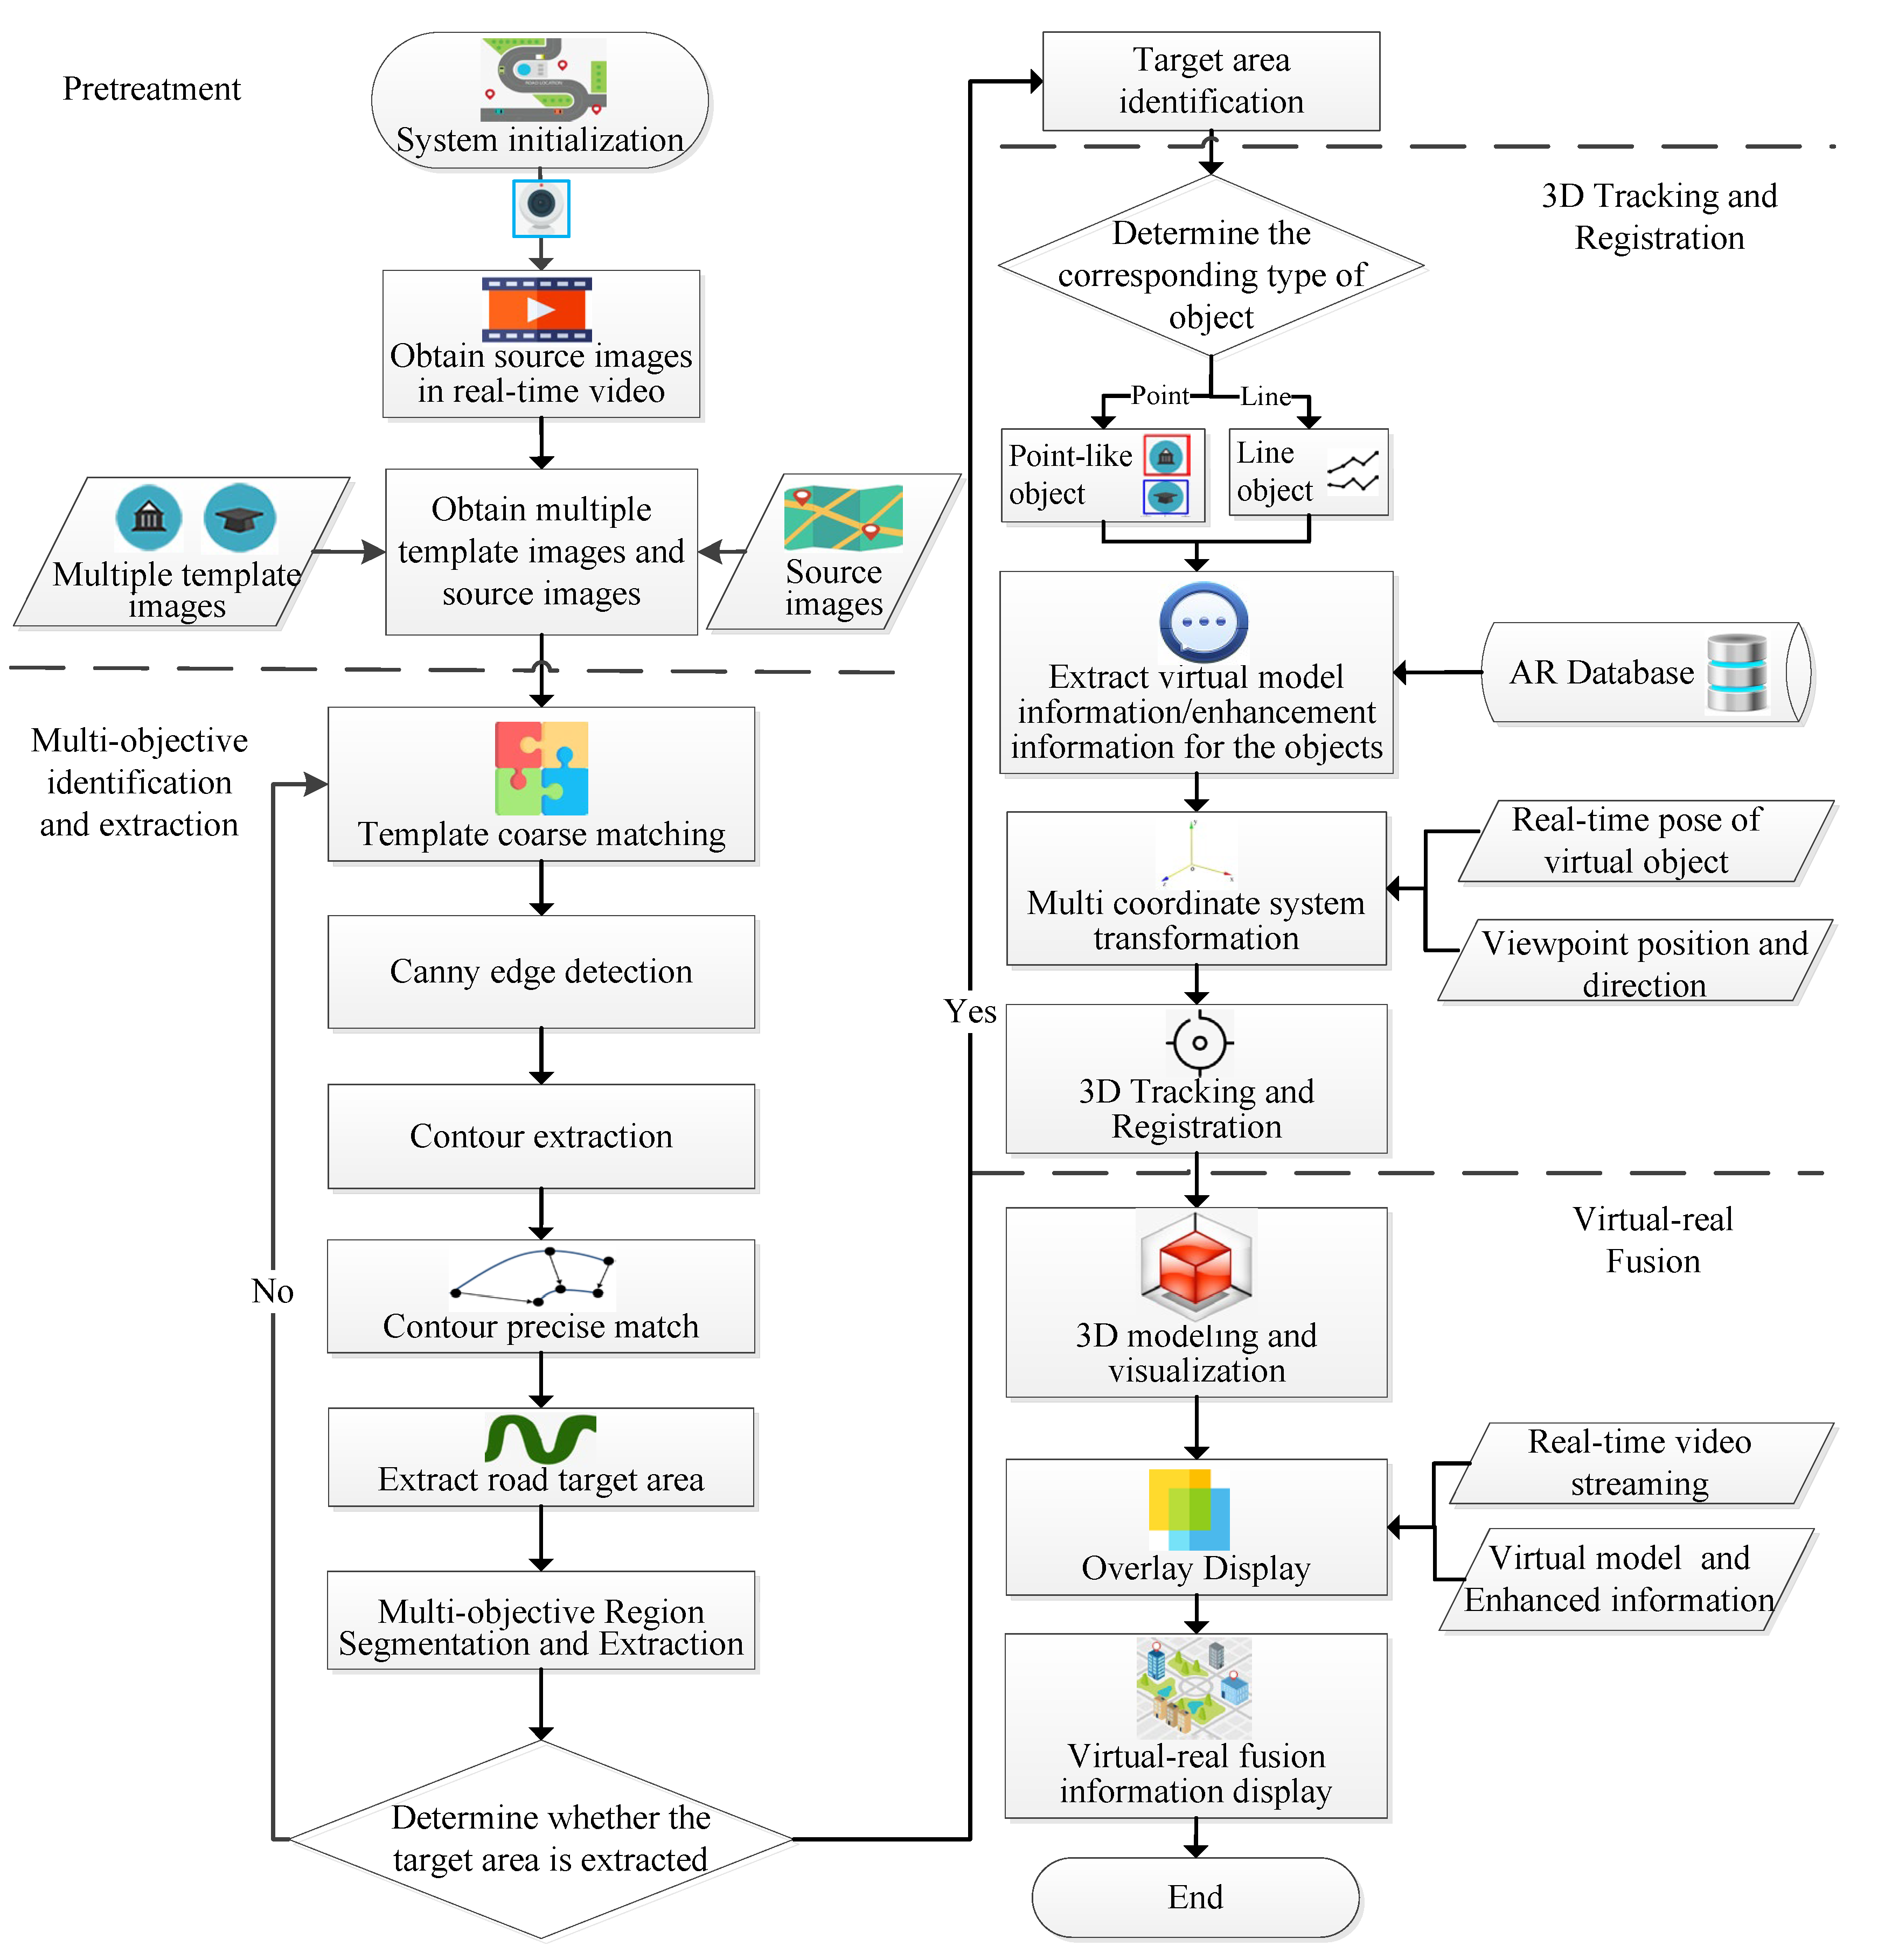
After the aforementioned identification, extraction, and 3D tracking and registration of unmarked map elements, the AR map virtual–real fusion process mainly involves steps such as augmented information acquisition, virtual model modeling, model correction, and fusion display. As shown in Figure 4, the AR map virtual–real fusion algorithm can be divided into three parts. The first part, i.e., unmarked map element identification and extraction, carries out multi-target stepwise identification for different categories of map elements in a real-time video data stream and uses methods such as template matching and image feature extraction to complete the extraction of point elements and line elements in the planar map. The second part obtains and registers the augmented information, acquiring the virtual model and augmented information corresponding to the point and line elements in the background database, and using the real-time position pose line of sight data of the terminal to carry out 3D tracking and registration to achieve seamless integration of real scene and virtual information. The third part constructs the virtual model and fuses the virtual and real information to display. The virtual model is constructed by a 3D modeling method, and the enhanced information is fused to realize the virtual–real fusion and enhanced display.
6. AR Representation Experiments and Analysis of Maps
6.1. Experimental Methods
Based on the foregoing research, an AR map element identification and virtual–real fusion system called ARMap V2.0 was developed, which realized the functions of AR map virtual–real fusion based on element identification. ARMap V2.0 system in this paper uses a ThinkPad P51 workstation as the development platform, with CPU Intel (R) Core (TM) 7820HQ, 64G memory, and integrates a high-definition external camera (8 megapixel, resolution 4096 × 2160) to obtain realistic images. Windows 10 is adopted as the operating system, with Visual C++2017 as the system development tool. Combined with the computer vision development library OpenCV 2.4 [45], the system realized such functions as the identification and extraction of unmarked map elements and 3D tracking and registration of unmarked map elements. The open graphics library OpenGL 4.0 [46] is used for the construction and rendering of 3D modeling and rendering of the system to realize virtual–real fusion.
ARMap V2.0 system mainly includes an identification and extraction module of unmarked map elements, an augmented information acquisition module, a 3D tracking and registration module, and a 3D modeling and virtual–real fusion display module. The identification and extraction module of unmarked map elements can effectively extract point-like and line map elements and then accurately identify map elements in real-time. Through the identified map elements, the 3D tracking and registration module is used to realize the unmarked tracking and registration of planar map element images. The 3D modeling and virtual–real fusion display module is used to build 3D models and obtain augmented information so as to achieve a more accurate virtual–real fusion effect.
In this paper, the area near the North Fourth Ring Middle Road in Beijing is selected as the experimental area. ARMap V2.0 system is used to verify the correctness and effectiveness of the models, methods, and results in the research. The experience of virtual–real fusion of AR map mainly includes identification and extraction of unmarked map elements, 3D tracking and registration of map elements, and AR map virtual–real fusion.
Calibrating the camera is a significant step in the process of AR virtual–real fusion for realizing the conversion between the camera coordinate system and screen coordinate system. For a specific camera, a separate parameter file can be generated by the camera calibration technique so as to obtain a camera’s intrinsic matrix and to restore one-to-one congruent relationship between 3D space and 2D screen in the camera model.
6.2. Step-by-Step Identification and Extraction of Unmarked Map Elements
6.2.1. Point-like Element Identification and Extraction
In the point-like element recognition and extraction experiments, a multi-target image recognition and extraction algorithm with template and contour matching is used to identify and extract several different types of point-like elements. The algorithm has multi-class and multi-target features, and different targets also produce different effects in the matching degree calculation method.
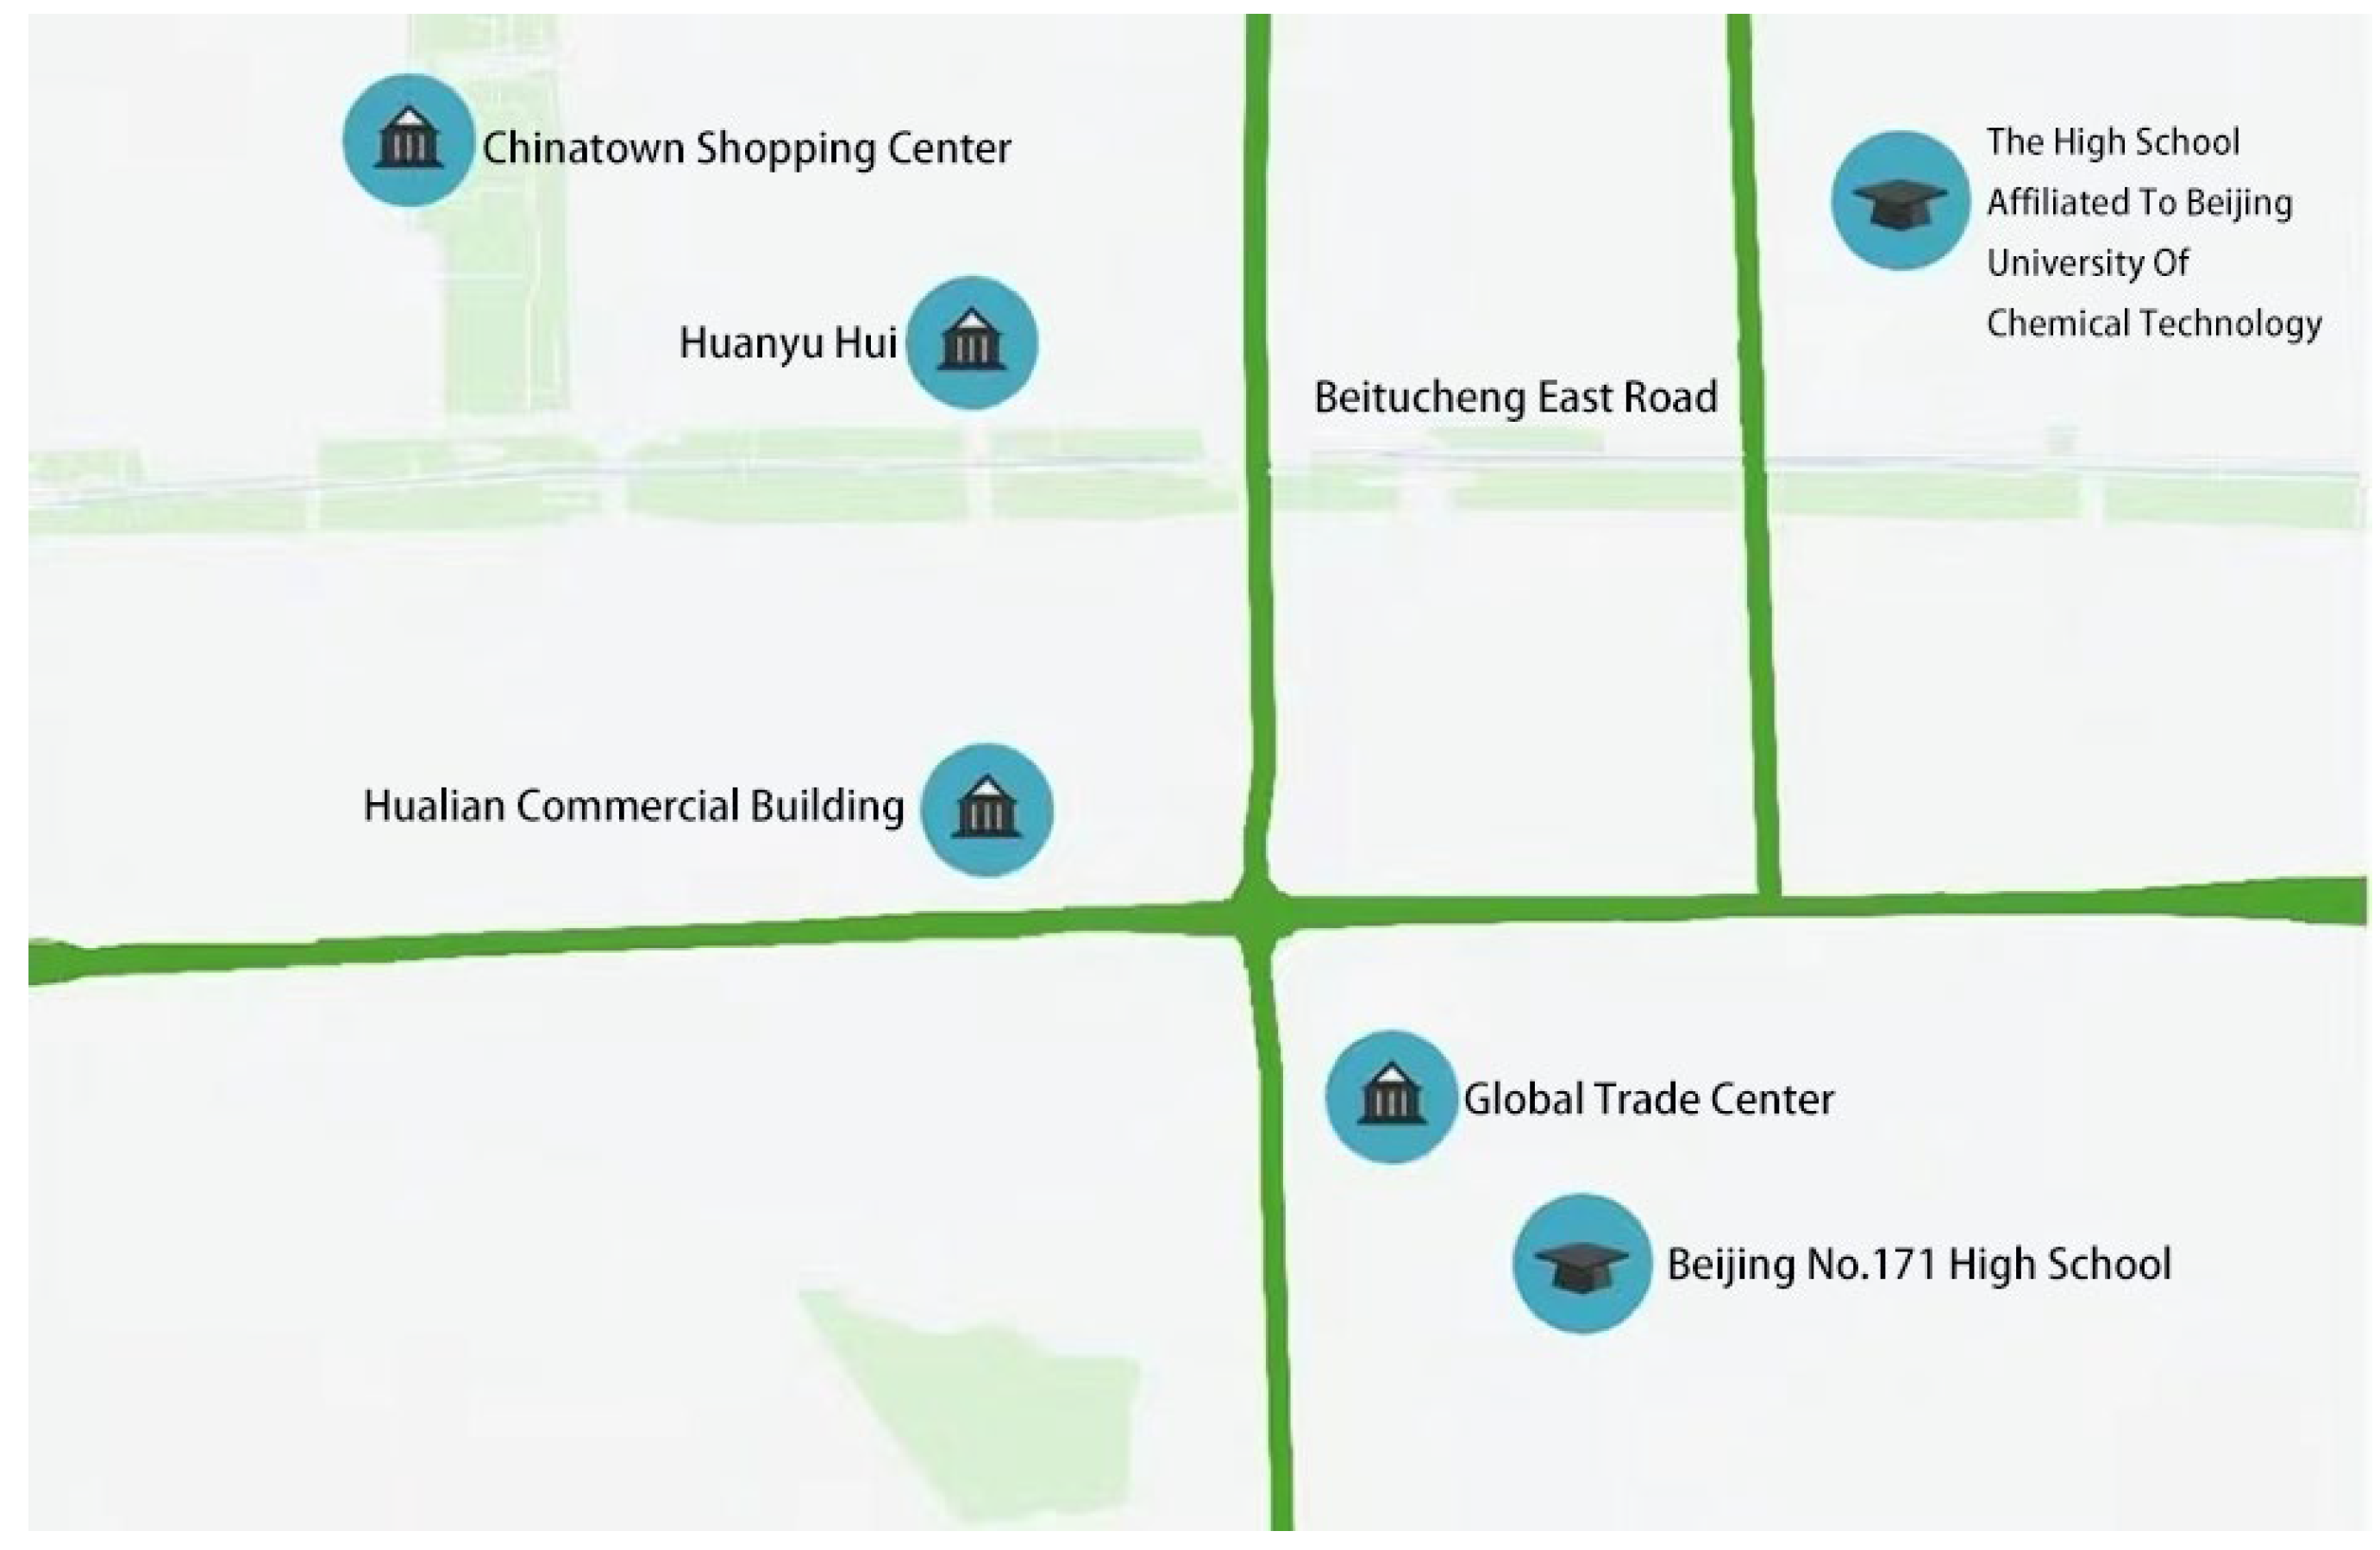
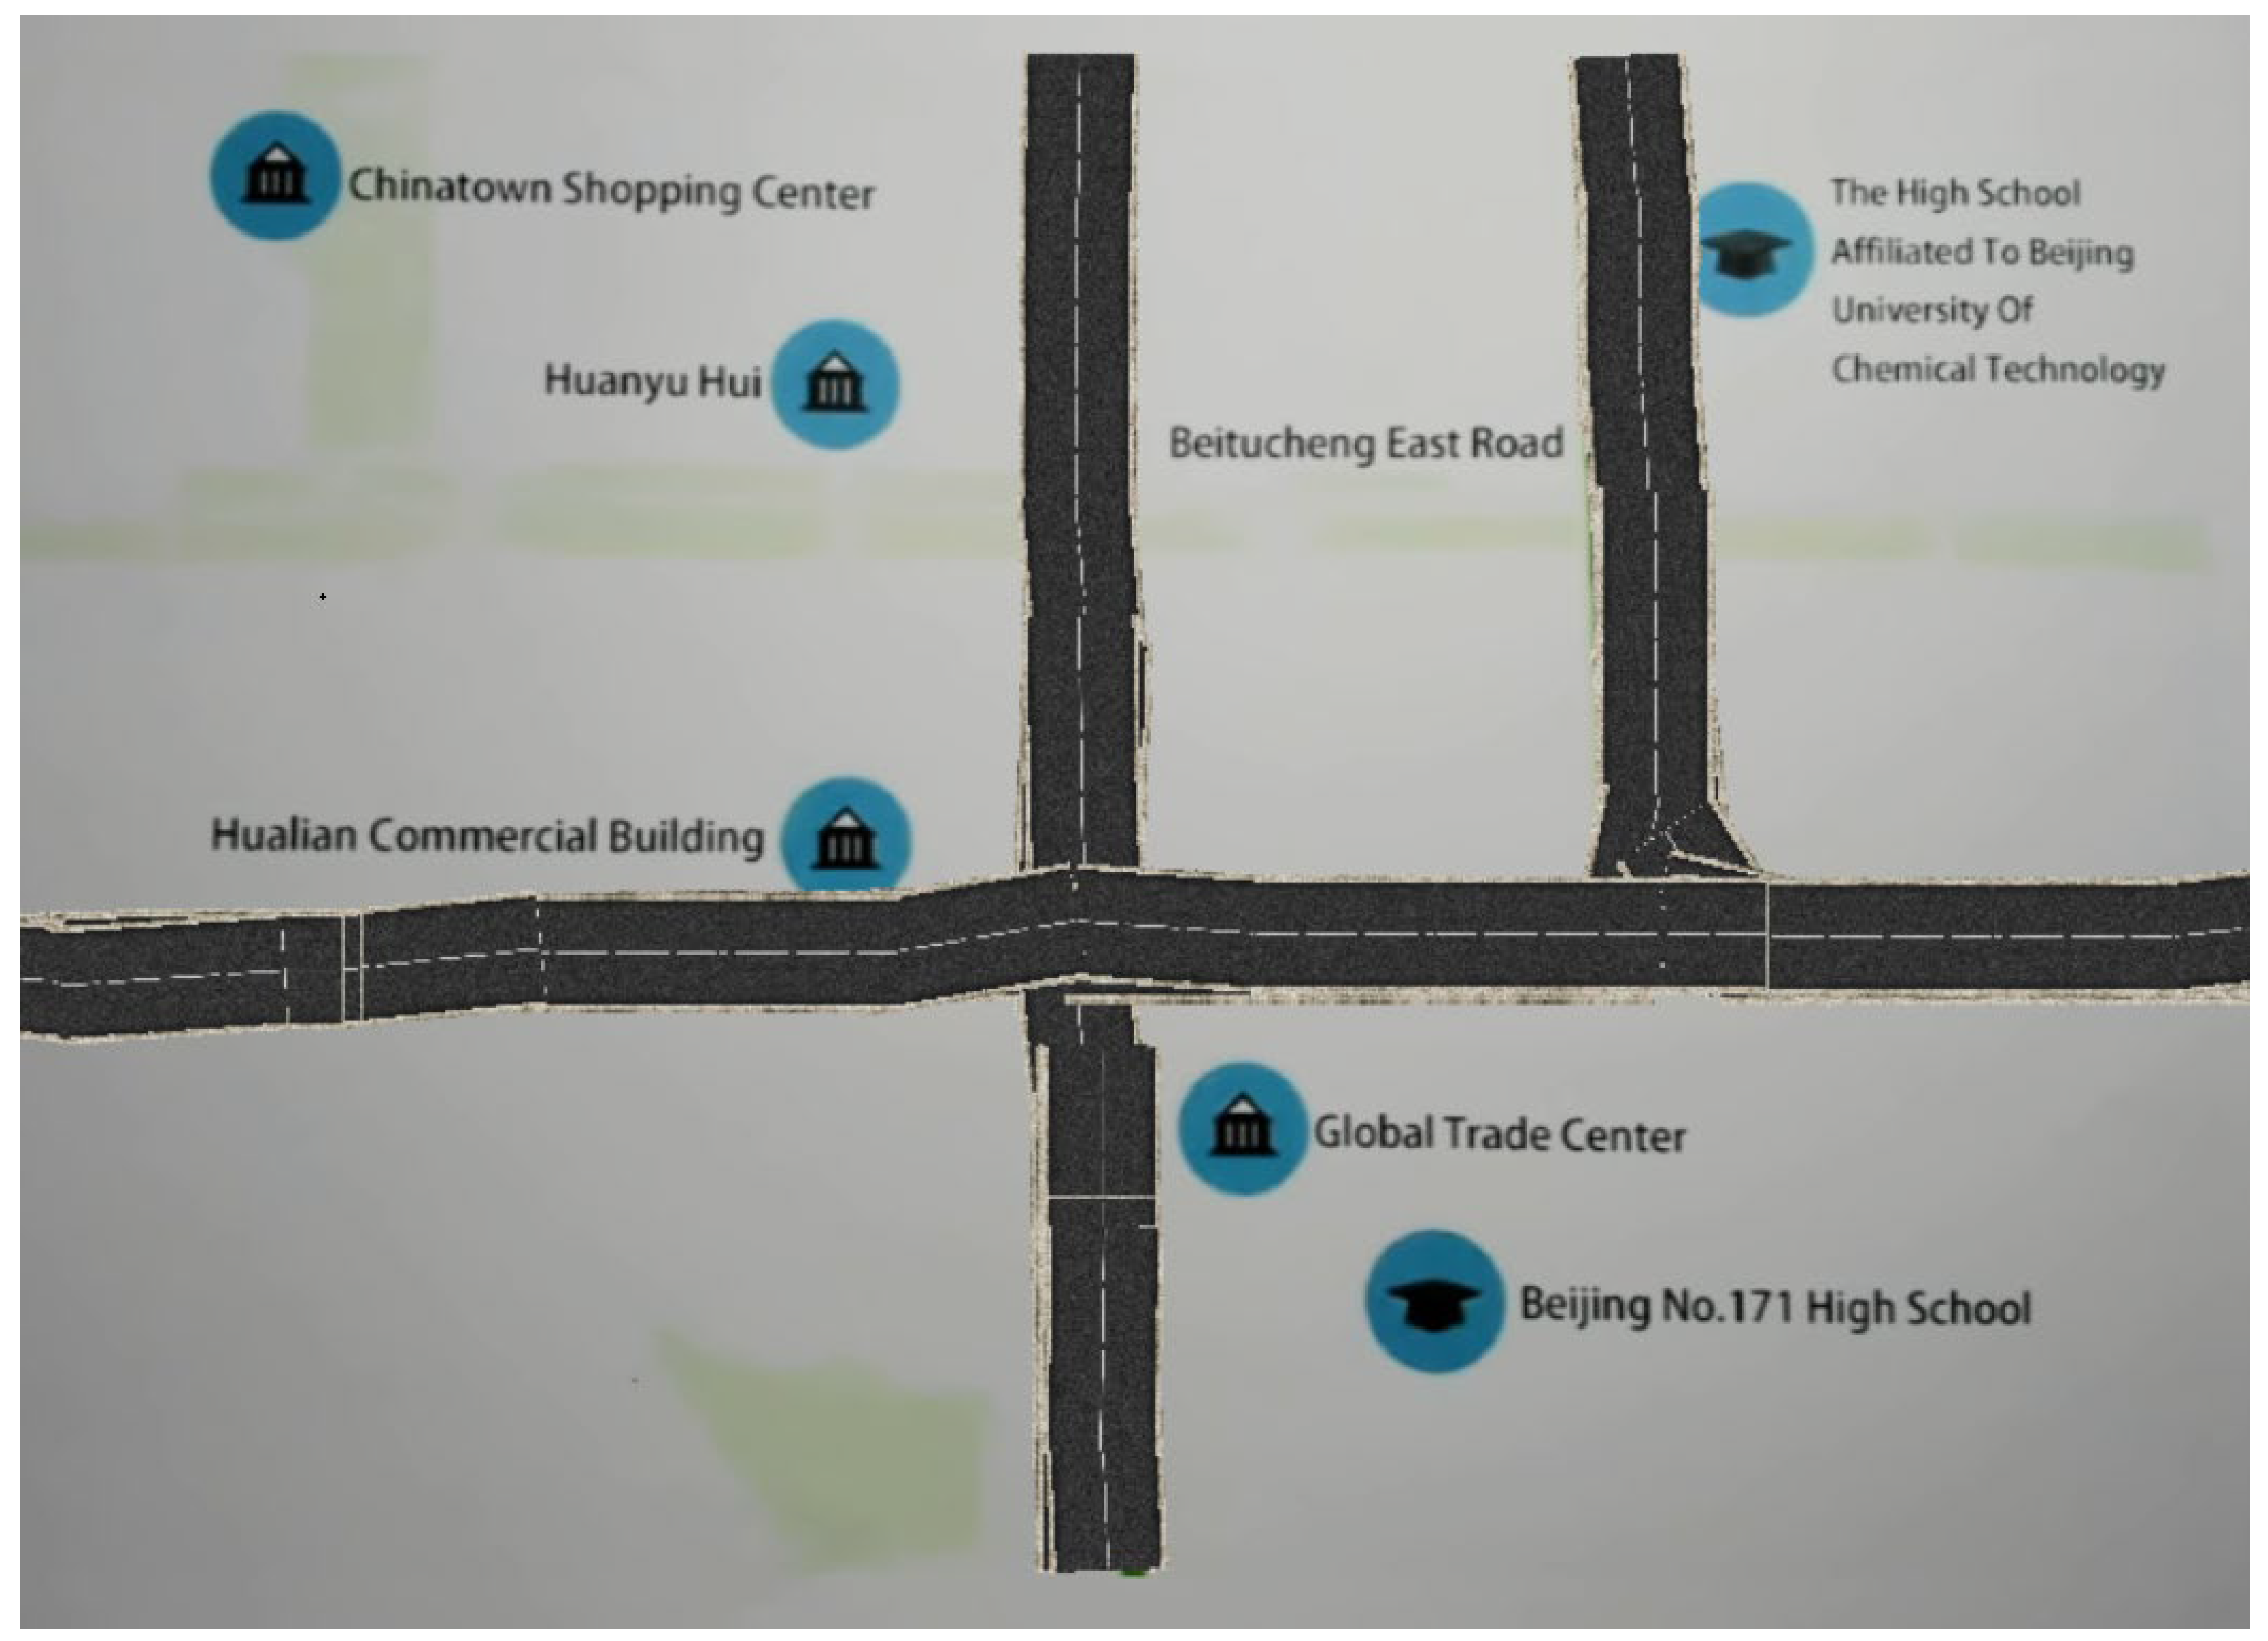
The example planar map in Figure 5 has two types of point elements: one for “commercial buildings” and the other for “educational institutions”. Each point element represents a type of point of interest and is identified by a specific type of legend. The multi-objective image recognition and extraction algorithm identifies the different types of point-like elements from the background of the planar map image and uses the recognition results for image resolution to obtain the point-like element boundary coordinates. As shown in Figure 6, the red box in the figure is the point-like element of a “commercial building” and the blue box is the point-like element of an “educational institution” in the planar map. The algorithm can identify multiple types and targets of point elements at the same time.
6.2.2. Line Element Identification and Extraction
In the line element recognition and extraction experiments, a region-growth-based line element recognition and extraction algorithm is used to recognize and extract line elements at different locations. The algorithm is designed for multi-target line elements of different thicknesses and can automatically identify, refine, and extract line elements accurately according to their positions and poses.
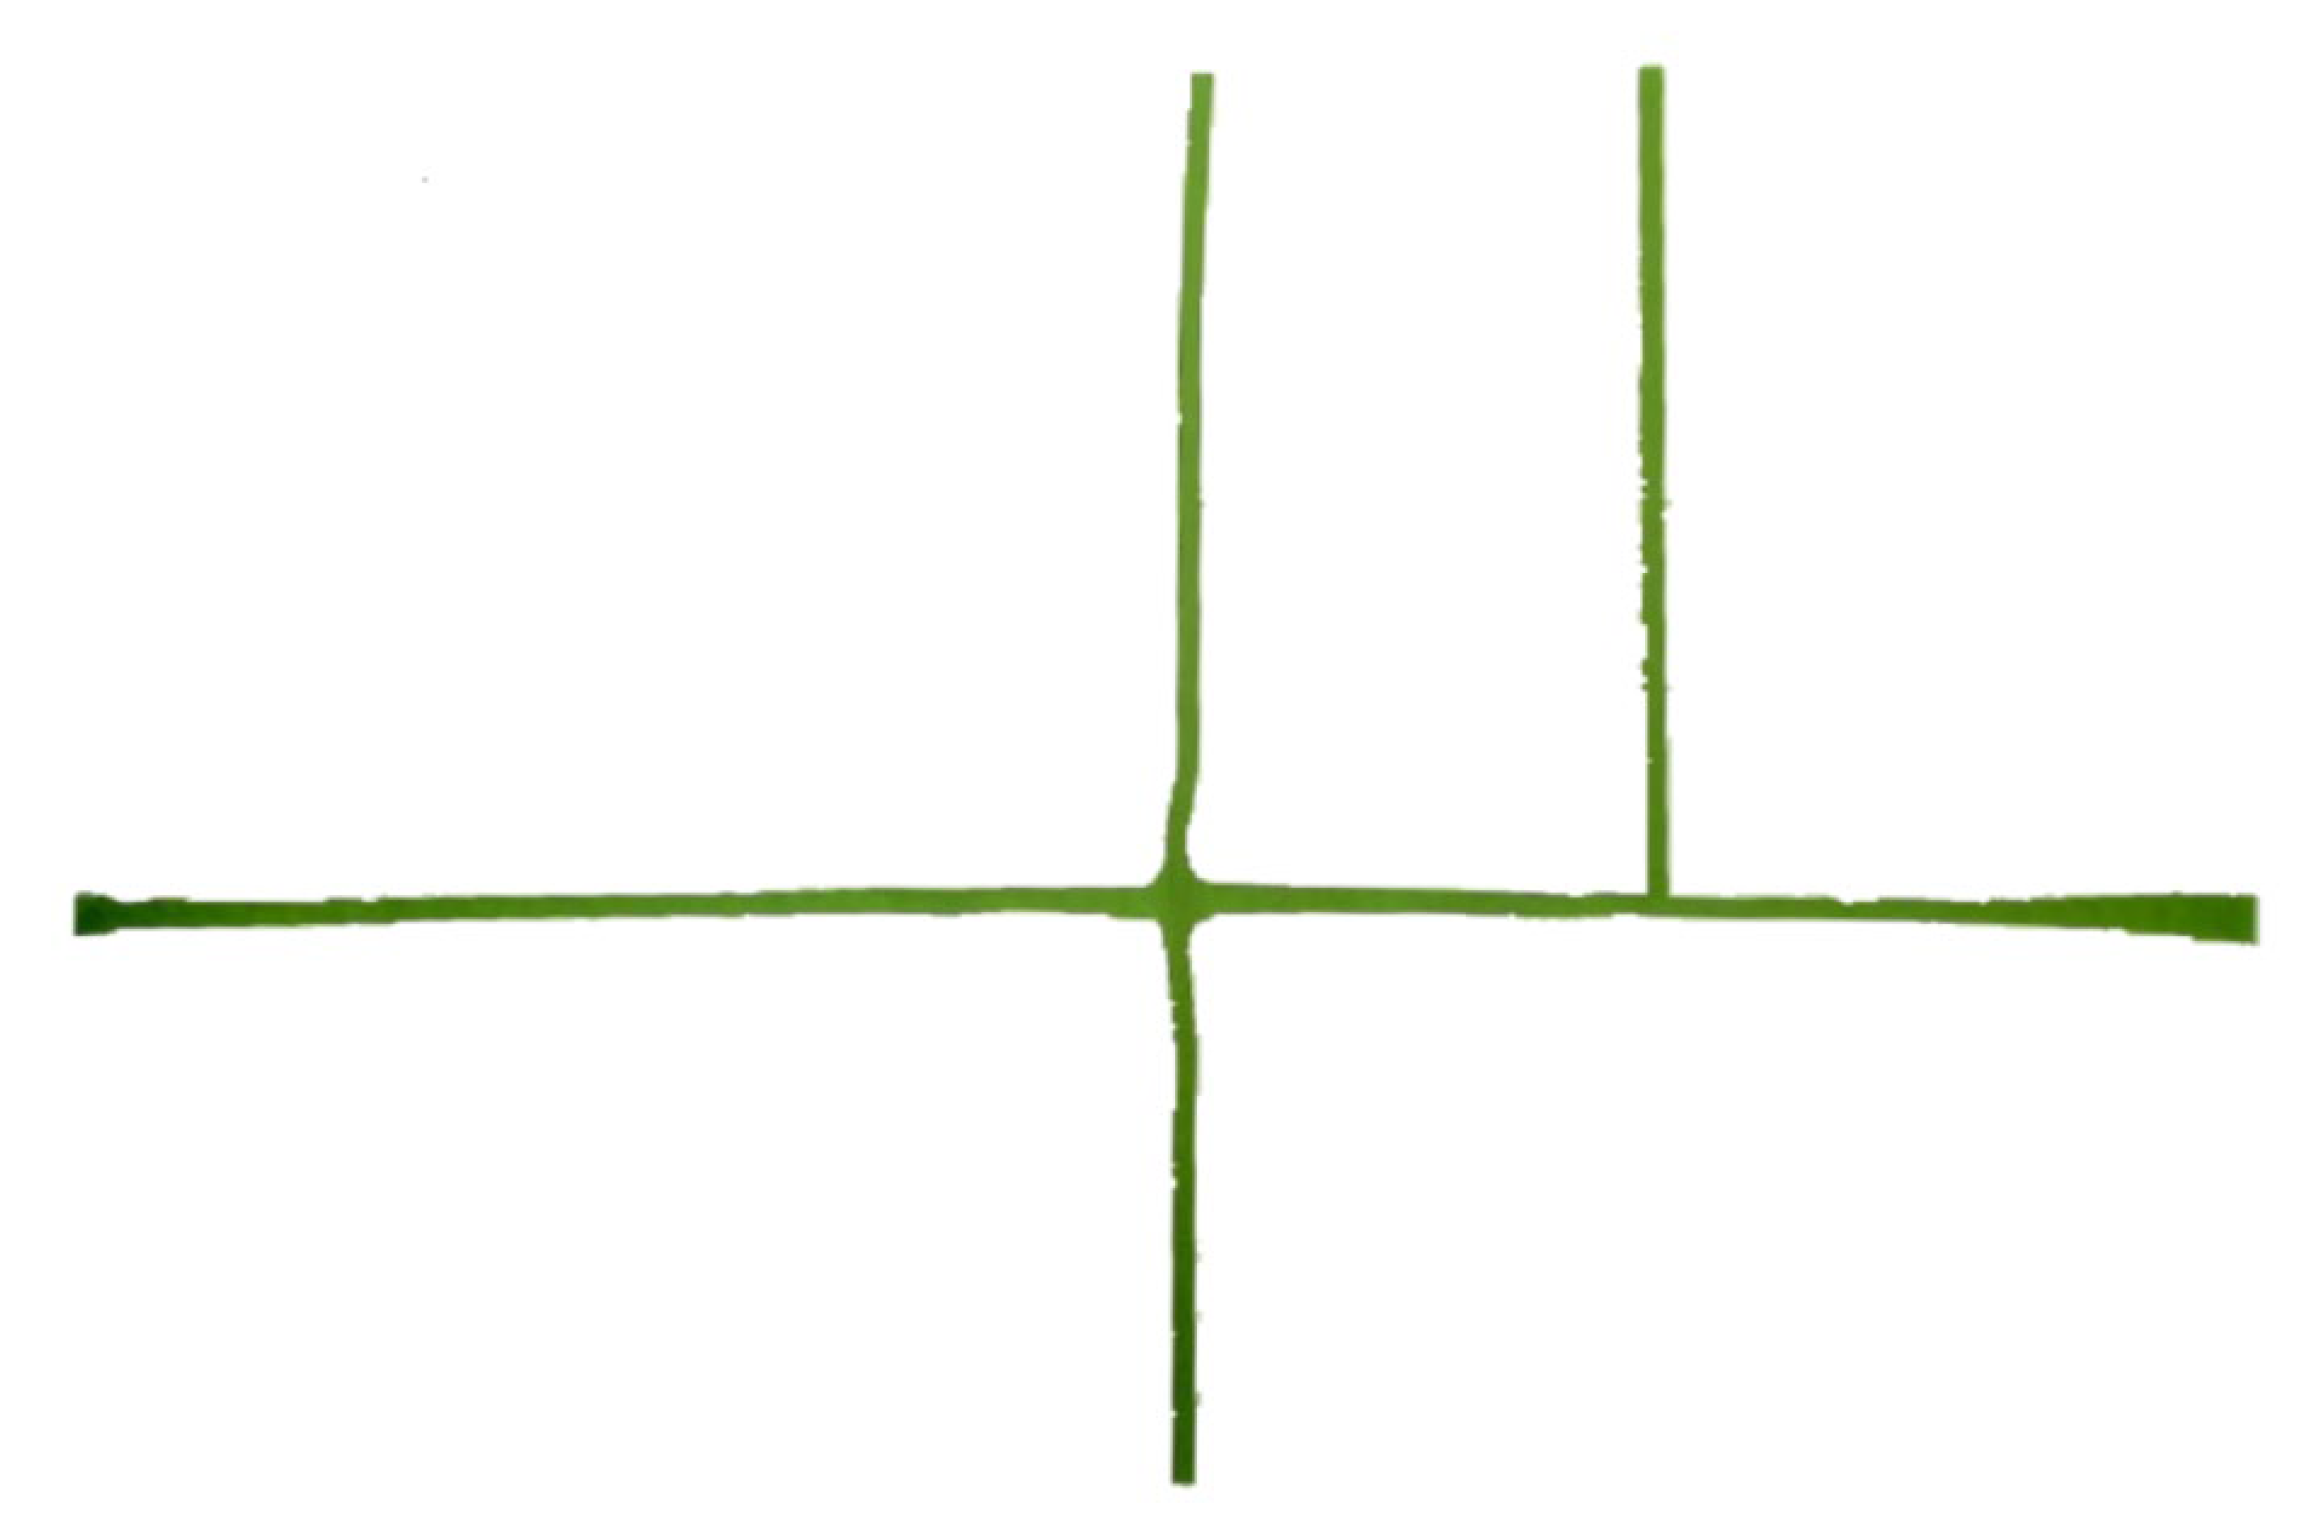
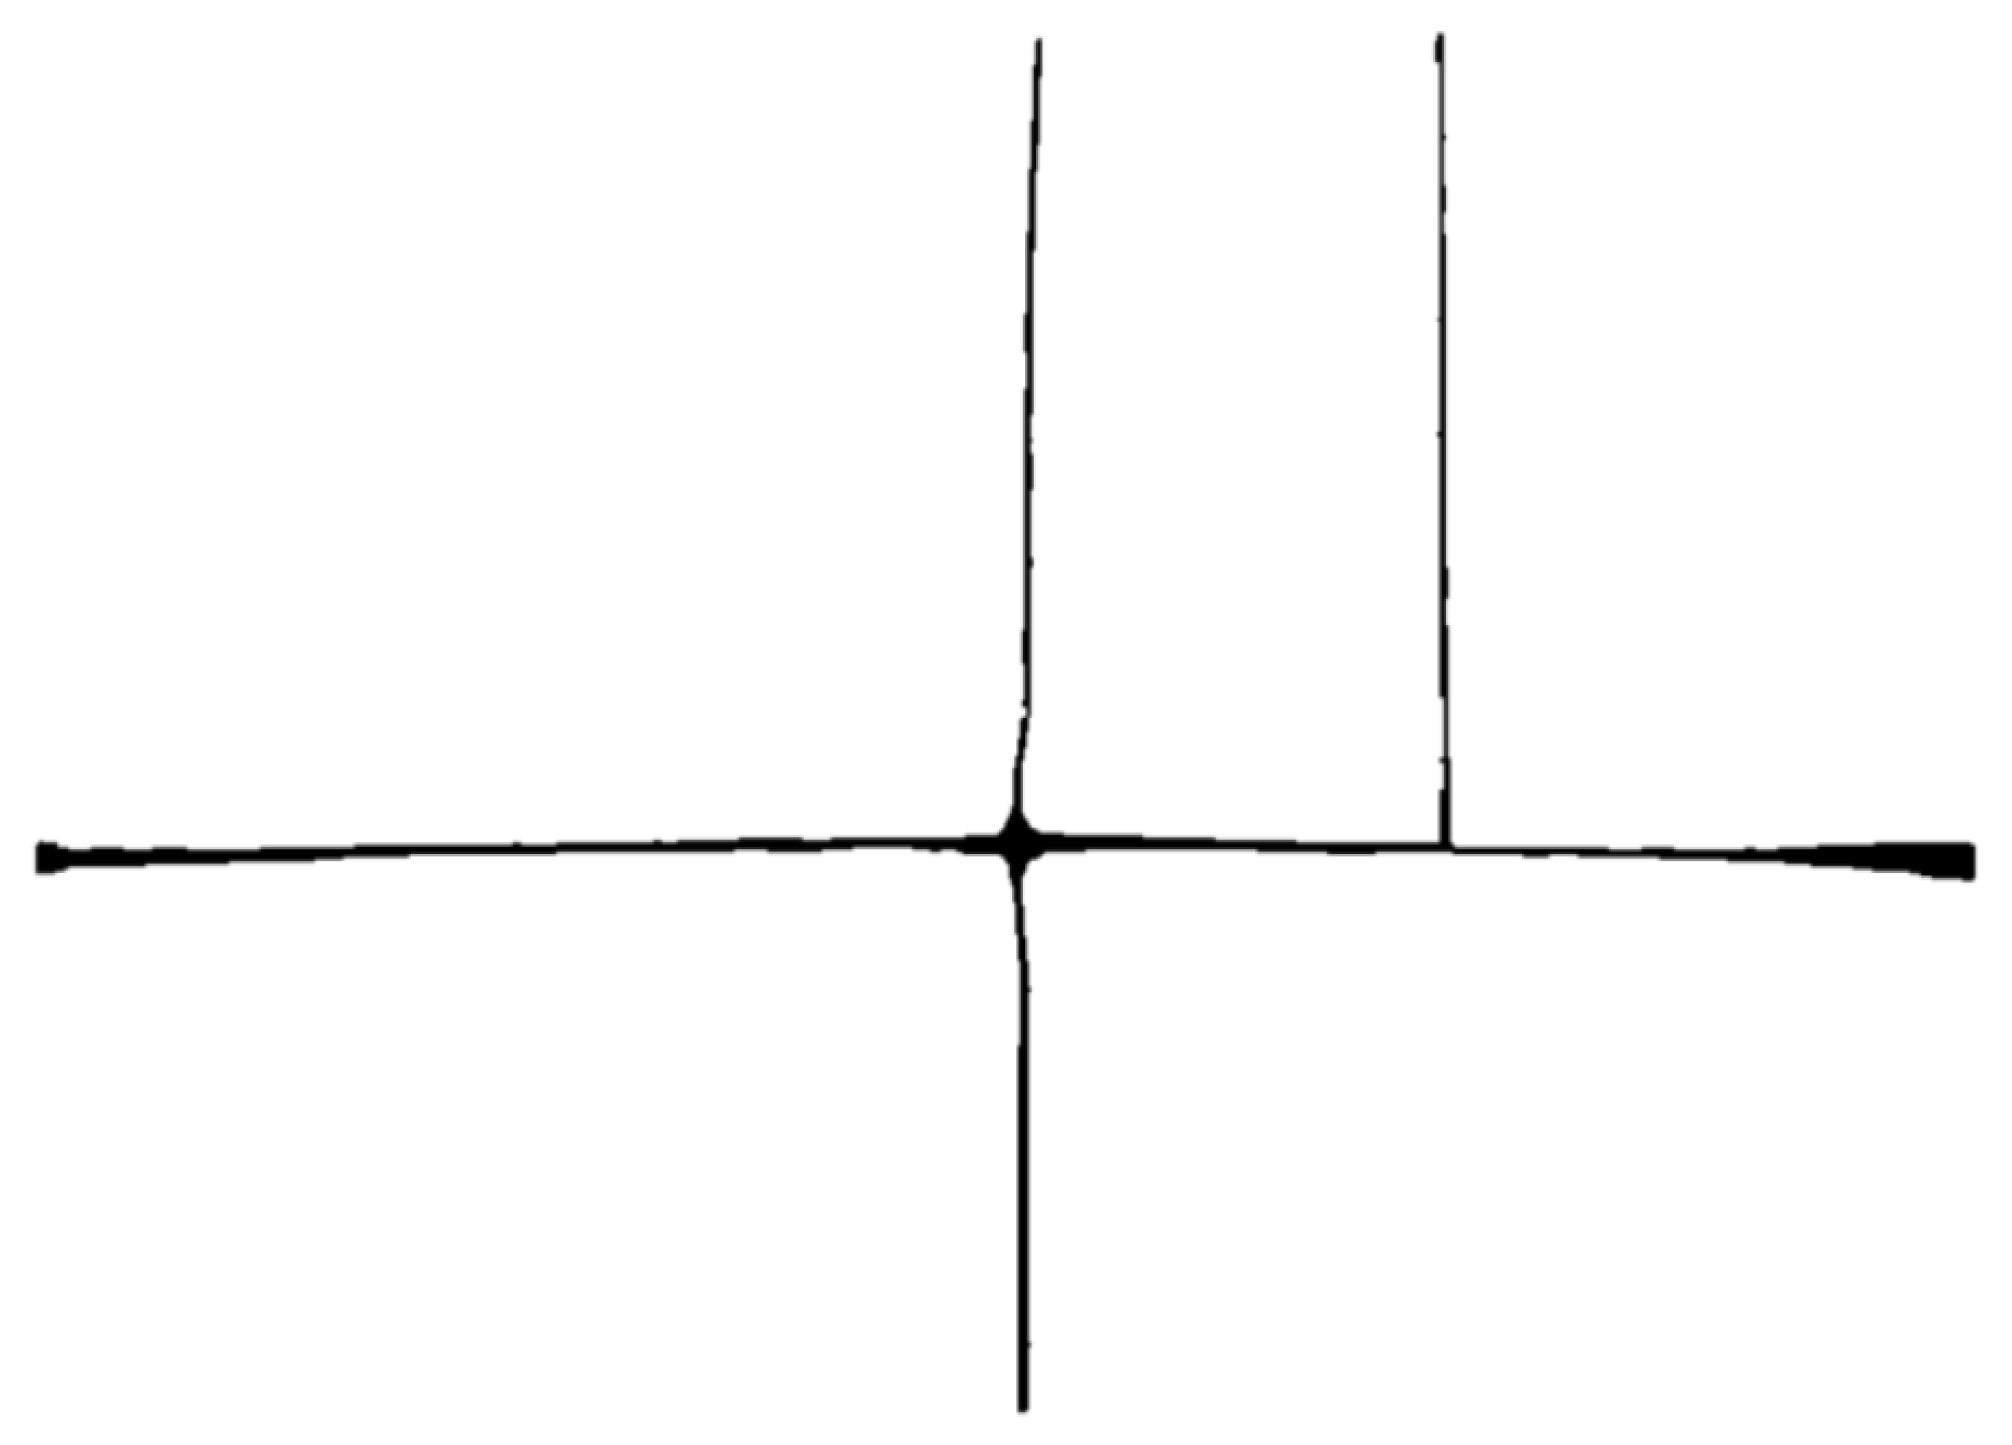
The green lines in Figure 7, which represent a specific target road, are extracted from the road line elements in Figure 5. The line elements in the map are separated from the background based on the color feature of the line element-road, and the associated road target area is extracted. The image is transformed into a grayscale map and binarized, the grayscale image is smoothed using a bilateral filtering method, and the road target area is refined based on the Rosenfeld algorithm. Finally, the road skeleton lines are extracted using the area growth method. As shown in Figure 8, for the color and spatial distribution changes of road elements in the city map, the multi-target line elements in the map are accurately extracted based on the region growth method and the image feature extraction method.
6.3. Virtual–Real Fusion in AR Maps
After the point-like features are automatically identified from the planar map image by using the multi-target recognition method based on template and contour matching, different point-like elements are extracted through image analysis. The element boundary coordinates are extracted, and the virtual model data and enhanced information corresponding to the elements are obtained in the background database. Using the element boundary coordinates, camera line of sight, and view body data, the actual spatial position of the point-like element corresponding to the virtual model is calculated to complete the 3D registration, realizing the seamless integration of the real scene and the virtual model. In addition, we completed the construction of the virtual model through the 3D modeling method and adjusted the position and pose of the virtual model, ensuring that it conforms to the observation perspective to achieve virtual–real integration.
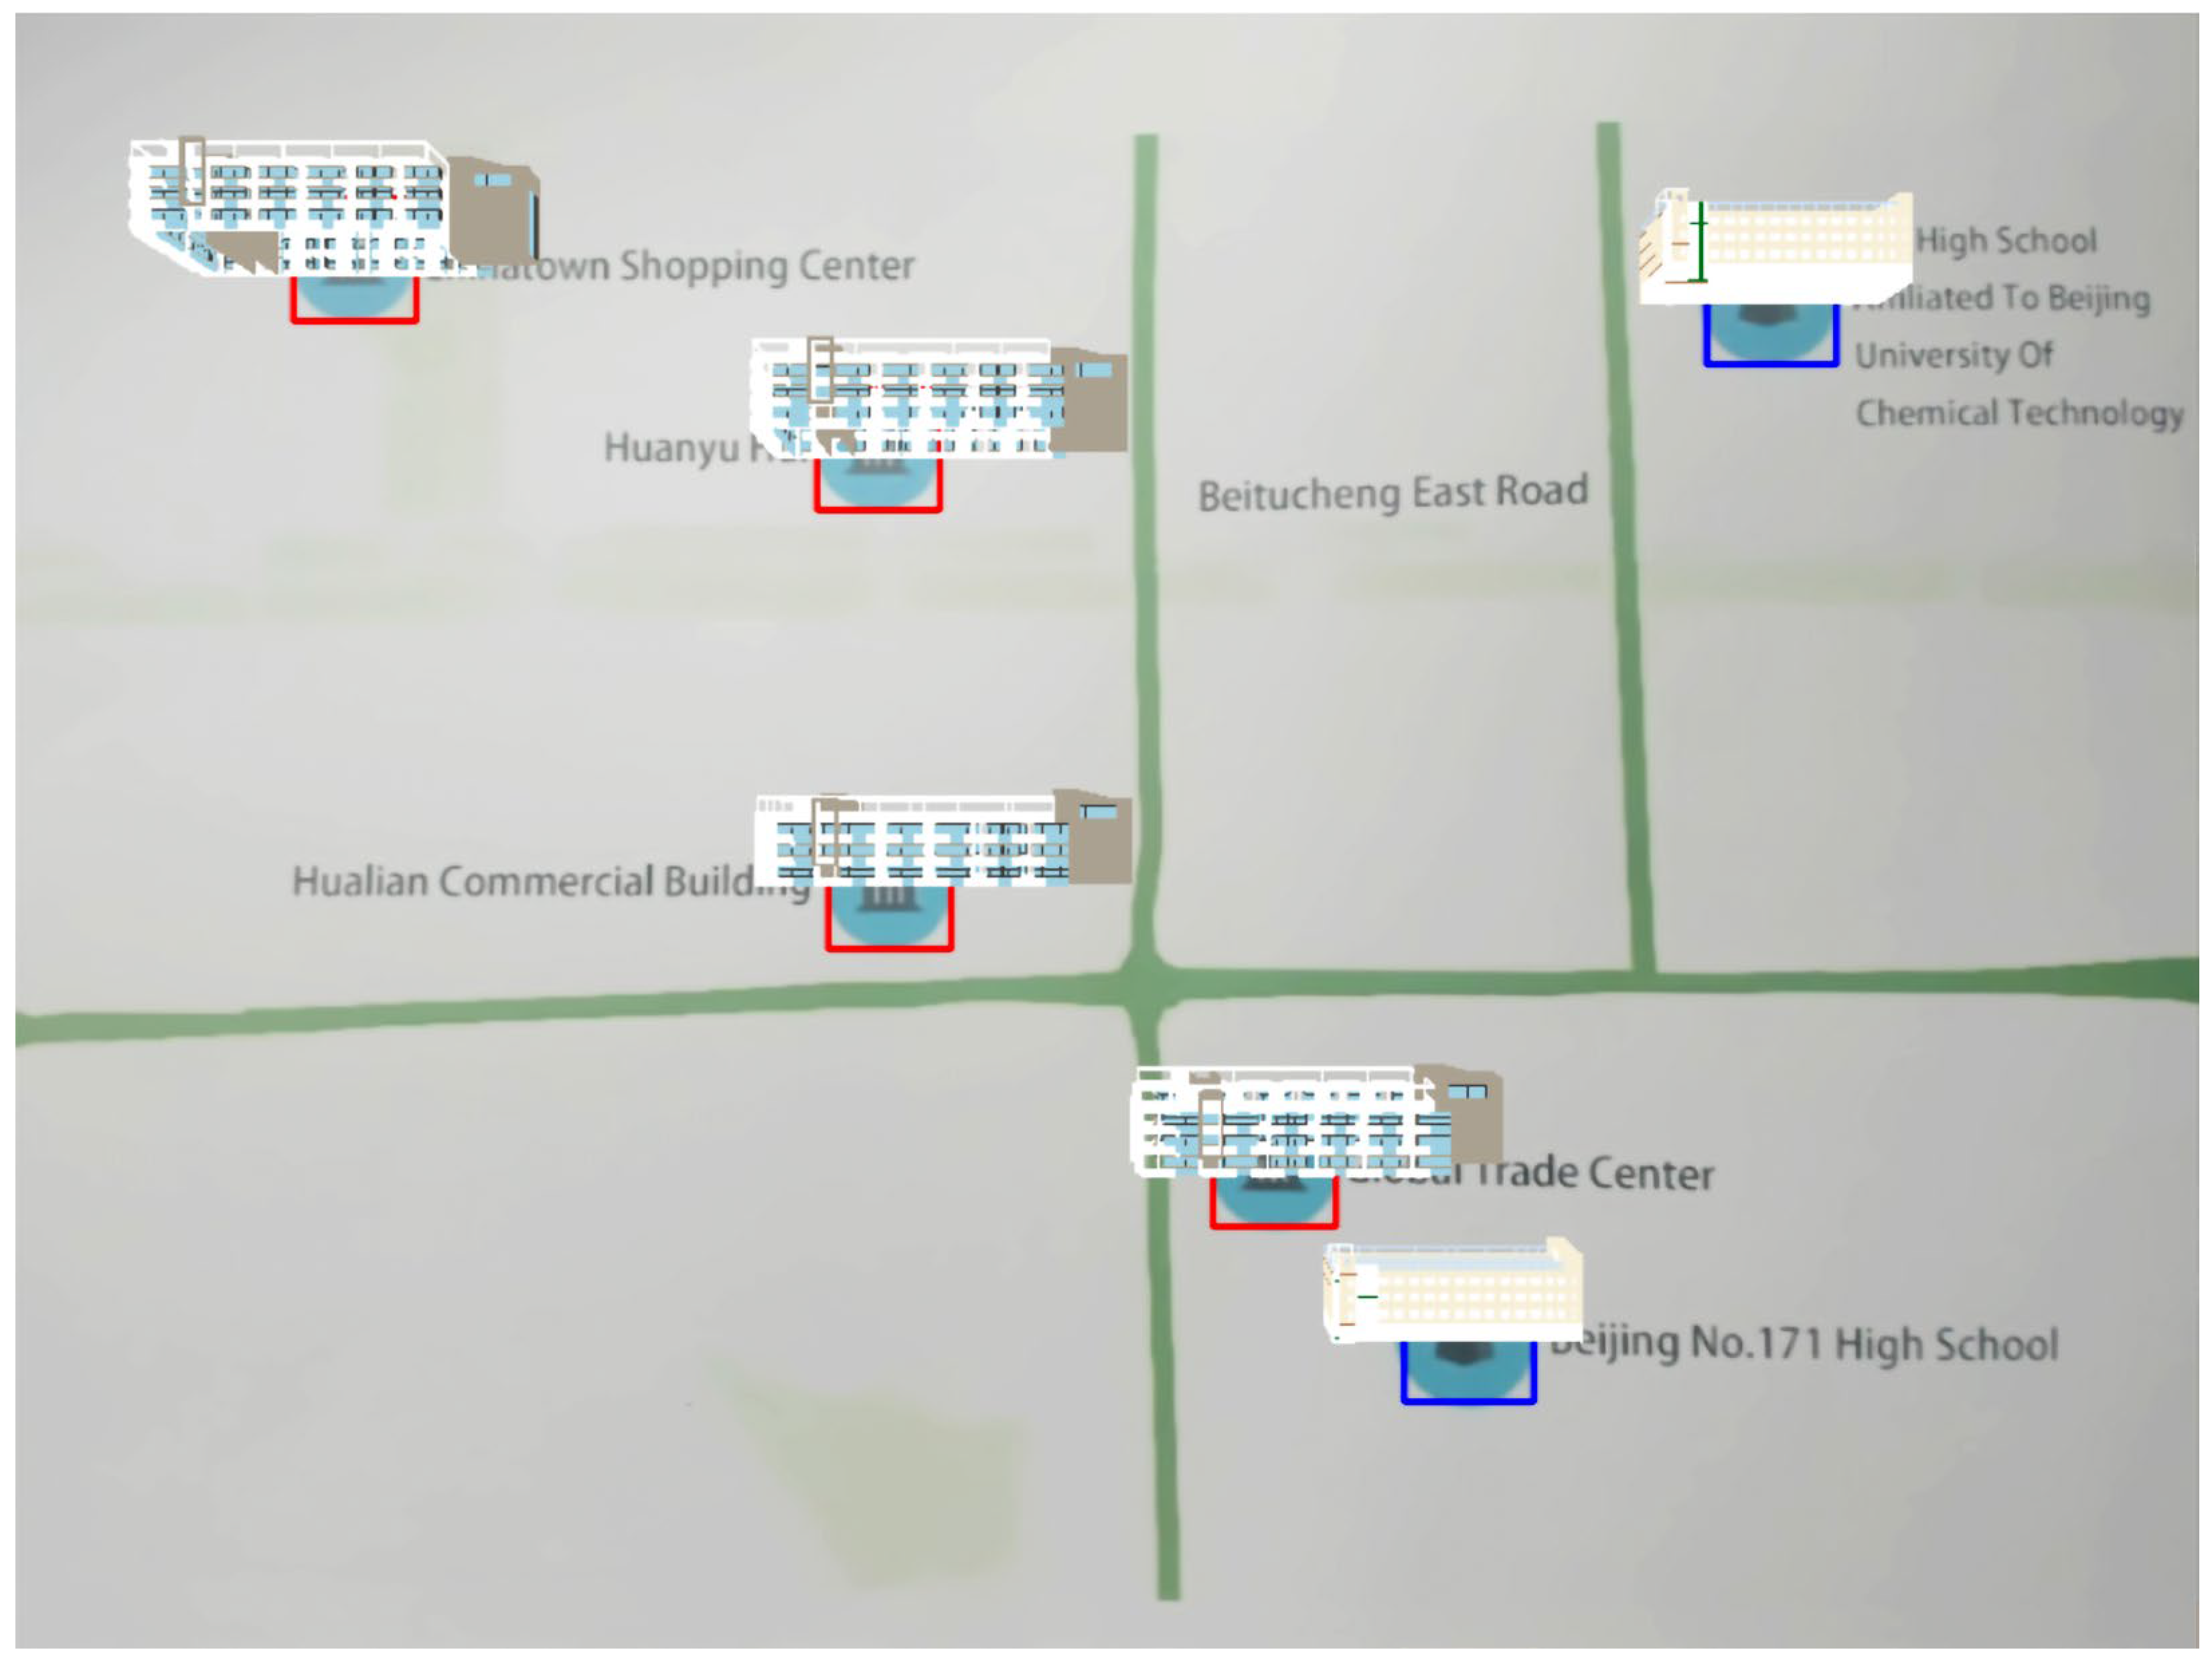
Figure 9 shows the effect of virtual fusion of point-like elements, in which there are two types of point-like elements, representing “commercial building” and “educational institution.” The virtual model is automatically identified and extracted by the ARMap V2.0 system, and the fusion of virtual model and point-like elements is realized.
Different from the virtual–real fusion process of point-like elements, the virtual–real fusion process of linear elements uses the multi-objective automatic algorithm based on color space and region growth to identify linear ground objects from the plane map image according to their color features. It then carries out image binarization, smoothing, bilateral filtering, and refining to generate the linear road target skeleton line. The region growth method was used to extract the road skeleton lines, the end coordinates of different road skeleton lines were obtained by image analysis, and the virtual model data and enhanced information corresponding to the road elements were obtained from the background database. Using the road endpoint coordinates, camera line of sight, and visual data, we can calculate the actual spatial position of the road model corresponding to the linear elements to complete the 3D registration, realizing the seamless integration of the real scene and the road model. On the basis of road model construction, the position and attitude of the model are adjusted to make it conform to the observation perspective and realize the virtual–real integration of linear elements.
Figure 10 shows the effect of virtual–real fusion of line elements obtained using the ARMap V2.0 system. The virtual road model is overlaid on the line elements on the map, and the road model fits closely with the line elements on the map to achieve the effect of virtual–real fusion.
6.4. Experimental Results and Analysis
6.4.1. Validation Analysis of Identification of Unmarked Map Elements and Virtual–Real Fusion
The above experiments are conducted for the point-like and line map elements of different positions and types in planar maps. The multi-target image recognition and extraction algorithm with template and contour matching is used to process map point-like elements. It can identify different types of point-like elements and extract their spatial positions. In addition, the region-growth-based line element recognition and extraction algorithm is used to process map line elements. This algorithm can identify the spatial positions of line elements and extract their skeleton.
Through the experiments of virtual–real fusion of map elements, it can be seen that the identification and extraction method for unmarked map elements of different types can effectively express the features of urban map elements and provide the different map element types, spatial location, and relevant model information.
The method based on computer vision is used to identify and extract spatial elements of the plane map. Using the element boundary coordinates, camera line of sight, and view body data, the actual spatial position of the virtual model corresponding to the map element is calculated to complete the 3D registration, realizing the seamless integration of the real scene and the virtual model.
6.4.2. Efficiency and Recognition Rate Analysis of Step-by-Step Identification of Unmarked Map Elements
To prove the efficiency and recognition rate of step-by-step identification of unmarked map elements, the experiment was conducted under the same background and conditions as the previous experiment, taking virtual-reality fusion in AR maps with multi-type and multi-objective elements as an example.
A total of three groups of experiments were performed, and each group of experiments was performed three times. The identification times, the single mean time for point-like element identification and the single mean time for line element identification as well as the accuracy rate were recorded, respectively. The experimental results are shown in Table 1. The data in the Table 1 represent the average value of three experiments. Parameters t1 (i.e., single mean time for point-like element identification), t2 (i.e., single mean time for line element identification) are recorded in each group of experiments when N (Identification times) is from 10 to 100.
It can be drawn from Table 1 that t1, as the single-time mean time for point-like element identification, is 114.66 ms and t2 is 20.20 ms. The identification speed of different map elements is stable. However, with the increase in identification times, the single mean time for point-like element identification decreases. The single mean time for line element identification is basically stable.
Through comparative experiments, it is found that the single mean time for point-like element identification is 77.2% shorter than that of the SIFT algorithm under the same experimental conditions. Through algorithm analysis, it can be learned that although SIFT is a classical image feature extraction algorithm with a scale-invariant feature, it consumes a lot of computer resources and has low time efficiency, which is not suitable for AR applications with real-time requirements. Compared with the classical region extraction and fast parallel thinning algorithm [47], the single mean time of line element identification is shortened by 36.0%. Through algorithm analysis, it can be learned that the proposed line element identification and extraction method is based on color space conversion, thinning and region growth, etc. This method comprehensively considers color and morphological features, which can meet the real-time requirements of AR. Its efficiency is greatly improved compared with the classical methods.
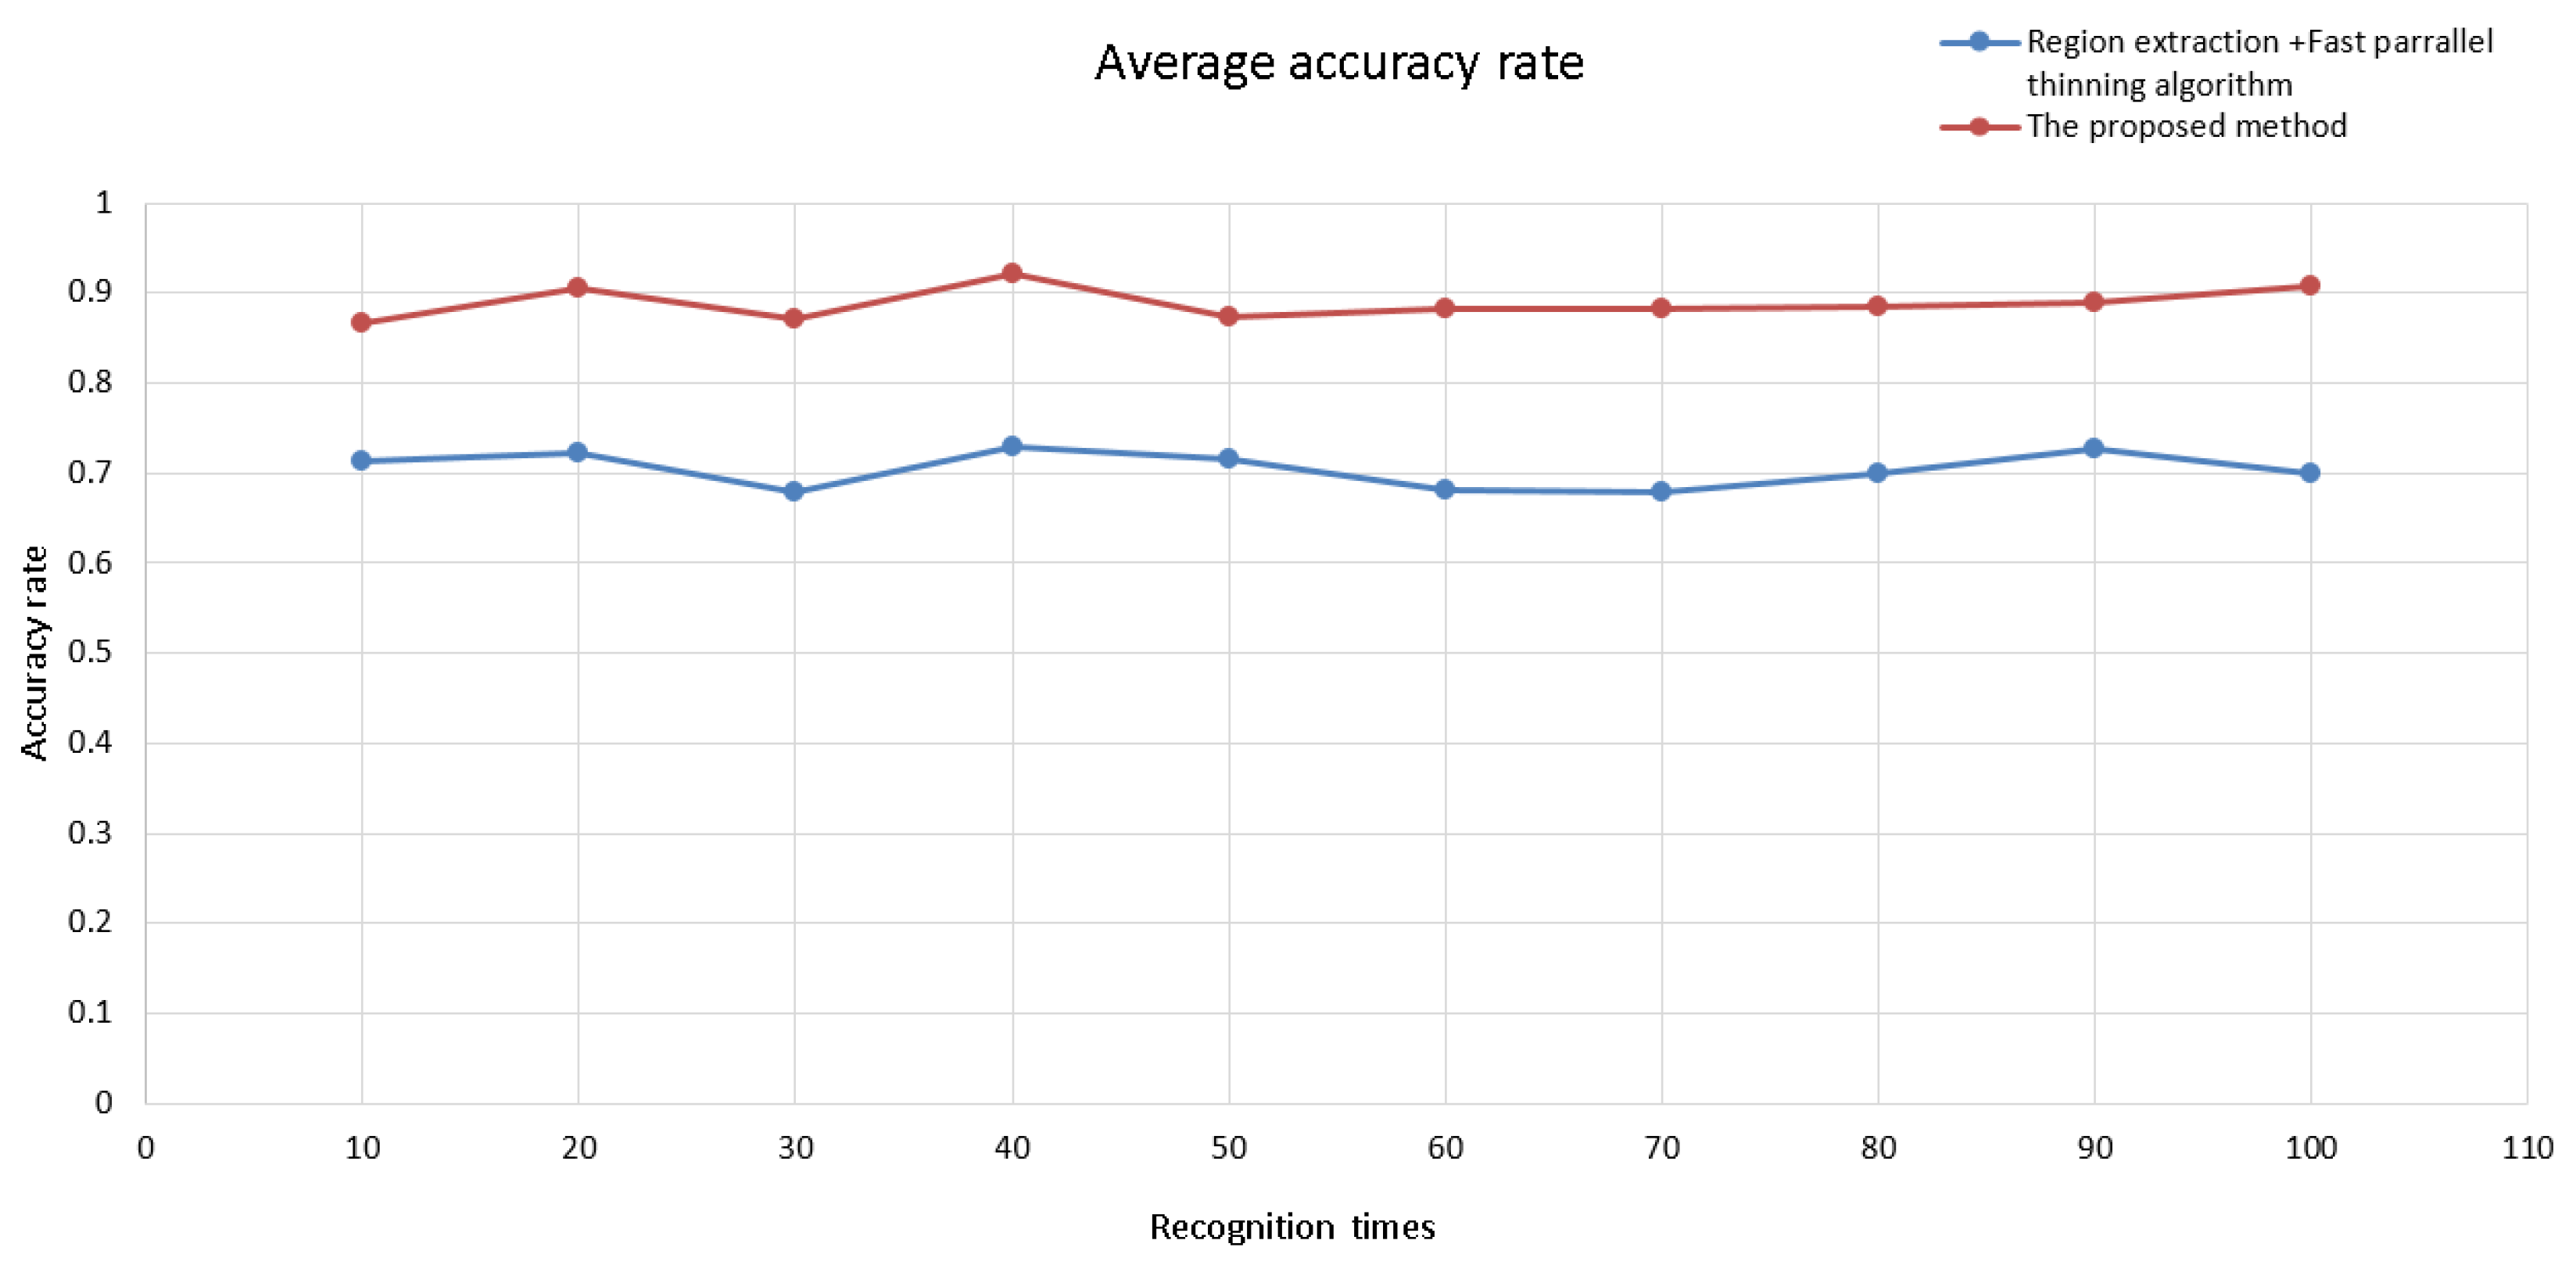
In the three groups of experiments performed in the experimental area, using the proposed multi-target point-like element recognition and extraction method, the point-like elements (including two point-like types, 60 times/group) were all recognized and extracted, and the algorithm ran smoothly. However, in the comparison experiment of point-like element recognition using the SIFT algorithm, the overall recognition rate is only 13.3% due to its poor real-time performance and unstable operation. The line element identification is affected by the line type and width, and its overall accuracy rate in the three groups of experiments is about 90%, as shown in Figure 11. It can be drawn from the data in Table 1 that the proposed method comprehensively considers color and morphological features and has high accuracy under the condition of ensuring the real-time performance of AR. Compared with the classical line element identification algorithm, the accuracy of this method is improved by 19.1%.
The experiments show that the identification speed of the method of AR map virtual–real fusion based on element identification is fast, its identification efficiency meets the real-time requirements of AR, and the identification accuracy can meet the needs of planar map augmented reality applications. Compared with the classical method, the proposed method improves the recognition efficiency and recognition rate of point-like elements and line elements in the map and is effective in multi-type and multi-target detection of AR maps.
6.4.3. Experiment Summary
With Visual Studio 2017 as a development tool, OpenCV 2.4.11 as a computer vision library, and OpenGL 4.0 as a graphics library, the MARMapV2.0 system has been developed to implement the previously proposed identification and extraction of multi-type unmarked map elements, 3D tracking and registration, and AR map virtual–real fusion. The step-by-step identification and extraction experiment of unmarked map elements shows that the proposed method in this paper can effectively identify different types of point-like elements and line elements in the map step by step and extract the spatial location of the elements. The template and contour matching method is used for the point-like element identification and extraction, and the color space and regional growth method is used for the line element identification and extraction. Furthermore, the AR map virtual–real fusion experiments have verified that the proposed fusion method in this paper can perform 3D tracking and registration for point-like elements, line elements and corresponding virtual models, and achieve seamless integration of the real scene and the virtual model, which proves that the method in this paper is effective.
Through the efficiency and recognition rate experiments of step-by-step identification of unmarked map elements, it is illustrated that the step-by-step identification and extraction method for unmarked map elements proposed in this paper is effective, with higher identification efficiency meeting the real-time requirements and higher accuracy rate. Compared with the classical methods, the proposed method improves the recognition efficiency and recognition rate of point-like elements and line elements on the map.
From the experimental results, the step-by-step identification and extraction method of unmarked map elements changes marker mode in traditional AR for the point-like and line elements in planar maps. This method, with the characteristics of being flexible, accurate, and universal, can automatically identify and extract multi-type and multi-objective elements from the maps. The AR map virtual–real fusion algorithm can extract virtual models corresponding to map elements and seamlessly integrate them with the real scene. The virtual models are displayed accurately and stably so as to achieve the effect of expression enhancement.
Other experiments were done on different map media such as paper-printed maps and electronic maps on tablet PC, all of which achieved good results, indicating that the method studied in this paper has certain universality.
7. Conclusions
In this study, AR technology is applied to the augmented representation of 2D planar maps. A step-by-step identification and extraction method of unmarked map elements is designed and proposed based on the analysis of the characteristics of planar map elements. This method combines the spatial and attribute characteristics of point-like elements and line-like elements, extracts the color, geometric features, and spatial distribution of map elements through computer vision methods, and completes the identification and automatic extraction of map elements. The multi-target image recognition and extraction method based on template and contour matching and the line element recognition and extraction method based on color space and area growth are introduced in detail. Then, 3D tracking and registration is used to realize the unmarked tracking and registration of planar map element images, and the AR map virtual–real fusion algorithm is proposed. The experimental results and results of an analysis of stepwise identification and extraction of unmarked map elements and map virtual–real fusion reveal that the stepwise identification of unmarked map elements and map model virtual–real fusion studied in this paper is effective. Through the analysis of map element step-by-step recognition efficiency and recognition rate, it is proved that the element step-by-step method in this paper is fast, its recognition efficiency meets the AR real-time requirements, and its recognition accuracy is high.
Further in-depth research can be conducted on the basis of the results of this study. The recognition and extraction of faceted elements in the planar map is also a challenge, as faceted elements have different shapes and types. In the recognition process, it is necessary to combine multiple sources of data such as color, contour, and graphic attributes to achieve intelligent discrimination, extraction of element boundaries, determination of corresponding models, and attribute information of faceted elements and more accurate AR maps with virtual–real fusion effects.
Funding
This research was funded by National Key R&D Program of China (2018YFC1800203) and The Scientific Research Project of Beijing Educational Committee (KM201811232010).
Data Availability Statement
All data relevant to the study are presented in the article.
Acknowledgments
We would like to thank the anonymous reviewers for their constructive coments that greatly improved the quality of the paper.
Conflicts of Interest
The author declares no conflict of interest.
References
- Peitso, L.E.; Michael, J.B. The promise of interactive shared augmented reality. Computer 2020, 53, 45–52. [Google Scholar] [CrossRef]
- Cools, R.; Han, J.; Simeone, A.L. SelectVisAR: Selective Visualisation of Virtual Environments in Augmented Reality. In Designing Interactive Systems Conference 2021 (DIS ’21); Association for Computing Machinery: New York, NY, USA, 2021; pp. 275–282. [Google Scholar]
- De Lucia, A.; Francese, R.; Passero, I.; Tortora, G. Augmented Reality Mobile Applications: Challenges and Solutions. Recent Pat. Comput. Sci. 2011, 4, 80–90. [Google Scholar] [CrossRef]
- Chatain, J.; Demangeat, M.; Brock, A.M.; Laval, D.; Hachet, M. Exploring input modalities for interacting with augmented paper maps. In Proceedings of the 27th Conference on l’Interaction Homme-Machine, Toulouse, France, 27–30 October 2015; pp. 1–6. [Google Scholar]
- Morrison, A.; Mulloni, A.; Lemmelä, S.; Oulasvirta, A.; Jacucci, G.; Peltonen, P.; Schmalstieg, D.; Regenbrecht, H. Collaborative use of mobile augmented reality with paper maps. Comput. Graph. 2011, 35, 789–799. [Google Scholar] [CrossRef] [Green Version]
- Sun, M.; Chen, X.; Zhang, F.; Zheng, H. Augmented Reality Geographic Information System. Acta Sci. Nat. Univ. Pekin. 2004, 6, 906–913. [Google Scholar]
- Volker, P.; Monika, S. Augmented paper maps exploring the design space of a mixed reality system. Int. J. Photogramm. Remote Sens. 2010, 65, 56–265. [Google Scholar]
- Bobrich, J.; Otto, S. Augmented Maps. Int. Arch. Photogramm. Remote Sens. Spat. Inf. Sci. 2002, 34, 502–505. [Google Scholar]
- Schmalstieg, D.; Reitmayr, G. Augmented Reality as a Medium for Cartography. Multimedia Cartography; Springer: New York, NY, USA, 2006; pp. 267–282. [Google Scholar]
- Uchiyama, H.; Saito, H.; Servières, M.; Moreau, G. AR city representation system based on map recognition using topological information. In Virtual and Mixed Reality, LNCS 5622; Springer: Berlin/Heidelberg, Germany, 2009; pp. 128–135. [Google Scholar]
- Zhang, A.; Zhuang, J.; Qi, Q. Visualization and Interaction of Augmented Paper Maps Based on Augmented Reality. Trop. Geogr. 2012, 32, 476–480. [Google Scholar]
- Fang, X.; Qu, Q. Paper map expression and its application based on mobile augmented reality. Microcomput. Appl. 2014, 7, 41–43, 47. [Google Scholar]
- An, Z.; Xu, X.; Yang, J.; Liu, Y.; Yan, Y. Research of the three-dimensional tracking and registration method based on multiobjective constraints in an AR system. Appl. Opt. 2018, 57, 9625–9634. [Google Scholar] [CrossRef]
- Santos, C.; Araújo, T.; Morais, J.; Meiguins, B. Hybrid approach using sensors, GPS and vision based tracking to improve the registration in mobile augmented reality applications. Int. J. Multimed. Ubiquitous Eng. 2017, 12, 117–130. [Google Scholar] [CrossRef]
- Wu, Y.; Che, W.; Huang, B. An Improved 3D Registration Method of Mobile Augmented Reality for Urban Built Environment. Int. J. Comput. Games Technol. 2021, 2021, 8810991. [Google Scholar] [CrossRef]
- Pauwels, K.; Rubio, L.; Diaz, J.; Ros, E. Real-time model-based rigid object pose estimation and tracking combining dense and sparse visual cues. In Proceedings of the IEEE Conference on Computer Vision and Pattern Recognition, Portland, OR, USA, 23–28 June 2013; pp. 2347–2354. [Google Scholar]
- Payet, N.; Todorovic, S. From contours to 3d object detection and pose estimation. In Proceedings of the 2011 International Conference on Computer Vision, Barcelona, Spain, 6–13 November 2011; pp. 983–990. [Google Scholar]
- Yue, W.A.; Shusheng, Z.H.; Weiping, H.E.; Xiaoliang, B.A. Model-based marker-less 3D tracking approach for augmented reality. J. Shanghai Jiaotong Univ. 2018, 52, 83. [Google Scholar]
- Chari, V.; Singh, J.M.; Narayanan, P.J. Augmented Reality Using Over-Segmentation; Center for Visual Information Technology, International Institute of Information Technology: Hyderabad, India, 2008. [Google Scholar]
- Pambudi, E.A.; Fauzan, A.; Sugiyanto, S. Logarithmic transformation for enhancing keypoint matching of SIFT in augmented reality. AIP Conf. Proc. 2022, 2578, 060010. [Google Scholar]
- Li, X.; Wang, X.; Cheng, C. Application of scene recognition technology based on fast ER and surf algorithm in augmented reality. In Proceedings of the 4th International Conference on Smart and Sustainable City (ICSSC 2017), Shanghai, China, 5–6 June 2017; pp. 1–5. [Google Scholar]
- Tian, Y.; Zhou, X.; Wang, X.; Wang, Z.; Yao, H. Registration and occlusion handling based on the FAST ICP-ORB method for augmented reality systems. Multimed. Tools Appl. 2021, 80, 21041–21058. [Google Scholar] [CrossRef]
- Tan, S.Y.; Arshad, H.; Abdullah, A. An improved colour binary descriptor algorithm for mobile augmented reality. Virtual Real. 2021, 25, 1193–1219. [Google Scholar] [CrossRef]
- Malek, K.; Mohammadkhorasani, A.; Moreu, F. Methodology to integrate augmented reality and pattern recognition for crack detection. In Computer—Aided Civil and Infrastructure Engineering; Wiley: Hoboken, NJ, USA, 2022. [Google Scholar]
- Araghi, L.F.; Arvan, M.R. An implementation image edge and feature detection using neural network. In Proceedings of the International MultiConference of Engineers and Computer Scientists, Hong Kong, China, 18–20 March 2009; pp. 835–837. [Google Scholar]
- Maini, R.; Aggarwal, H. Study and comparison of various image edge detection techniques. Int. J. Image Process. (IJIP) 2009, 3, 1–11. [Google Scholar]
- Ren, F.; Wu, X. Outdoor Augmented Reality Spatial Information Representation. Appl. Math. 2013, 7, 505–509. [Google Scholar] [CrossRef] [Green Version]
- Pan, C.; Chen, Y.; Wang, G. Virtual-Real Fusion with Dynamic Scene from Videos. In Proceedings of the 2016 International Conference on Cyberworlds (CW), Chongqing, China, 28–30 September 2016. [Google Scholar]
- Brejcha, J.; Lukáč, M.; Hold-Geoffroy, Y.; Wang, O.; Čadík, M. Landscapear: Large scale outdoor augmented reality by matching photographs with terrain models using learned descriptors. In European Conference on Computer Vision; Springer: Cham, Switzerland, 2020; pp. 295–312. [Google Scholar]
- Stylianidis, E.; Valari, E.; Pagani, A.; Carrillo, I.; Kounoudes, A.; Michail, K.; Smagas, K. Augmented Reality Geovisualisation for Underground Utilities. J. Photogramm. Remote Sens. Geoinf. Sci. 2020, 88, 173–185. [Google Scholar] [CrossRef]
- Garbin, E.P.; Santil FL, D.P.; Bravo JV, M. Semiotics and the Cartographic Visualization theory: Considerations on the analysis of map design. Bol. Ciênc. Geod. 2012, 18, 624–642. [Google Scholar] [CrossRef] [Green Version]
- Chang, K.T. Introduction to Geographic Information Systems; McGraw-Hill Education: New York, NY, USA, 2018. [Google Scholar]
- Eba, S.; Nakabayashi, N.; Hashimoto, M. Single-scan multiple object detection based on template matching using only effective pixels. In Proceedings of the International Workshop on Advanced Imaging Technology (IWAIT), Hong Kong, China, 4–6 January 2022; Volume 12177, pp. 55–60. [Google Scholar]
- Liu, Z.; Guo, Y.; Feng, Z.; Zhang, S. Improved Rectangle Template Matching Based Feature Point Matching Algorithm. In Proceedings of the Chinese Control and Decision Conference (CCDC), Nanchang, China, 3–5 June 2019; pp. 2275–2280. [Google Scholar]
- Ingle, M.A.; Talmale, G.R. Respiratory mask selection and leakage detection system based on canny edge detection operator. Procedia Comput. Sci. 2016, 78, 323–329. [Google Scholar] [CrossRef] [Green Version]
- Khotanzad, A.; Zink, E. Contour line and geographic feature extraction from USGS color topographical paper maps. IEEE Trans. Pattern Anal. Mach. Intell. 2003, 25, 18–31. [Google Scholar] [CrossRef]
- Zhou, W.; Xu, J.; Jiang, Q.; Chen, Z. No-reference quality assessment for 360-degree images by analysis of multifrequency information and local-global naturalness. IEEE Trans. Circuits Syst. Video Technol. 2021, 32, 1778–1791. [Google Scholar] [CrossRef]
- Xu, S.; Xun, Y.; Jia, T.; Yang, Q. Detection method for the buds on winter vines based on computer vision. In Proceedings of the 2014 Seventh International Symposium on Computational Intelligence and Design, Hangzhou, China, 13–14 December 2014; Volume 2, pp. 44–48. [Google Scholar]
- Yalcinkaya, B.; Aguizo, J.; Couceiro, M.; Figueiredo, A. A Multimodal Tracking Approach For Augmented Reality Applications. In Proceedings of the 12th Augmented Human International Conference (AH2021), Geneva, Switzerland, 27–28 May 2021; pp. 1–8. [Google Scholar]
- Shi, Q.; Wang, Y.T.; Cheng, J. Vision-Based Algorithm for Augmented Reality Registration. J. Image Graph. 2002, 7, 679–683. [Google Scholar]
- Burkard, S.; Fuchs-Kittowski, F. User-aided global registration method using geospatial 3D data for large-scale mobile outdoor augmented reality. In Proceedings of the 2020 IEEE International Symposium on Mixed and Augmented Reality Adjunct (ISMAR-Adjunct), Recife, Brazil, 9–13 November 2020; pp. 104–109. [Google Scholar]
- Koenderink, J.J.; Van Doorn, A.J. Affine structure from motion. JOSA A 1991, 8, 377–385. [Google Scholar] [CrossRef] [PubMed] [Green Version]
- Wu, X.; Ren, F. Spatial information augmented representation using affine transformations registration. Comput. Eng. Appl. 2010, 3, 16–19, 29. [Google Scholar]
- Ma, W.; Xiong, H.; Dai, X.; Zheng, X.; Zhou, Y. An indoor scene recognition-based 3D registration mechanism for real-time AR-GIS visualization in mobile applications. ISPRS Int. J. Geo-Inf. 2018, 7, 112. [Google Scholar] [CrossRef] [Green Version]
- Laganiere, R. OpenCV Computer Vision Application Programming Cookbook Second Edition; Packt Publishing Ltd.: Birmingham, UK, 2014. [Google Scholar]
- Sellers, G.; Wright, R.S., Jr.; Haemel, N. OpenGL superBible: Comprehensive Tutorial and Reference; Addison-Wesley: Boston, MA, USA, 2013. [Google Scholar]
- Zhang, T.Y.; Suen, C.Y. A Fast Parallel Algorithm for Thinning Digital Patterns. Commun. Acm 1984, 27, 236–239. [Google Scholar] [CrossRef]
Figure 1.
The flow of the image multi-target recognition and extraction algorithm based on template and contour matching.
Figure 1.
The flow of the image multi-target recognition and extraction algorithm based on template and contour matching.

Figure 2.
The flow of the recognition and extraction algorithm of line elements in the planar map.

Figure 3.
Schematic diagram of 3D tracking and registration.

Figure 4.
The flow of the AR map virtual–real fusion algorithm.

Figure 5.
The example planar map.

Figure 6.
The point-like element recognition and extraction results (The red box represents the commercial building, and the blue box represents the educational institution).
Figure 6.
The point-like element recognition and extraction results (The red box represents the commercial building, and the blue box represents the educational institution).

Figure 7.
The line element recognition and extraction results.

Figure 8.
The line element refinement.

Figure 9.
The effect of virtual–real fusion of point-like elements (The red box represents the commercial building, and the blue box represents the educational institution. The occlusion of the text in Figure 9 verifies the principle of virtual-real fusion).
Figure 9.
The effect of virtual–real fusion of point-like elements (The red box represents the commercial building, and the blue box represents the educational institution. The occlusion of the text in Figure 9 verifies the principle of virtual-real fusion).

Figure 10.
The effect of virtual–real fusion of line elements.

Figure 11.
Accuracy rate of map element identification.


Table 1.
Table of identification efficiency of point-like element and line element.
| Experiment Content | Identification Times (N) | Single Mean Time for Point-like Element Identification (t1, ms) | Single Mean Time for Line Element Identification (t2, ms) | ||
|---|---|---|---|---|---|
| The Proposed Method | SIFT | The Proposed Method | Region Extraction + Fast Parallel | ||
| Point-like element and line element identification | 10 | 115.11 | 501.82 | 21.21 | 31.96 |
| 20 | 114.93 | 498.98 | 19.97 | 31.23 | |
| 30 | 114.86 | 498.97 | 19.88 | 33.58 | |
| 40 | 114.76 | 504.70 | 19.85 | 28.71 | |
| 50 | 114.73 | 502.60 | 20.95 | 30.87 | |
| 60 | 114.66 | 502.85 | 19.79 | 33.42 | |
| 70 | 114.57 | 506.25 | 19.73 | 33.37 | |
| 80 | 114.43 | 508.08 | 19.81 | 30.82 | |
| 90 | 114.27 | 503.37 | 20.97 | 30.80 | |
| 100 | 114.29 | 502.62 | 19.87 | 30.76 | |
Disclaimer/Publisher’s Note: The statements, opinions and data contained in all publications are solely those of the individual author(s) and contributor(s) and not of MDPI and/or the editor(s). MDPI and/or the editor(s) disclaim responsibility for any injury to people or property resulting from any ideas, methods, instructions or products referred to in the content. |
© 2023 by the author. Licensee MDPI, Basel, Switzerland. This article is an open access article distributed under the terms and conditions of the Creative Commons Attribution (CC BY) license (https://creativecommons.org/licenses/by/4.0/).
Share and Cite
MDPI and ACS Style
Wang, Z. An AR Map Virtual–Real Fusion Method Based on Element Recognition. ISPRS Int. J. Geo-Inf. 2023, 12, 126. https://doi.org/10.3390/ijgi12030126
AMA Style
Wang Z. An AR Map Virtual–Real Fusion Method Based on Element Recognition. ISPRS International Journal of Geo-Information. 2023; 12(3):126. https://doi.org/10.3390/ijgi12030126
Chicago/Turabian StyleWang, Zhangang. 2023. "An AR Map Virtual–Real Fusion Method Based on Element Recognition" ISPRS International Journal of Geo-Information 12, no. 3: 126. https://doi.org/10.3390/ijgi12030126
Note that from the first issue of 2016, this journal uses article numbers instead of page numbers. See further details here.