1. Introduction
Thanks to digitization, the last ten years have seen a major breakthrough in the processing and accessibility of cartographic documents of Czech and foreign memory institutions. Cartographic cultural heritage is comprised not only of old maps, atlases and globes published before 1850, but also of unique manuscripts, works on original media or other rarities. Globes represent a specific category because their production in manufactories continued practically until the middle of the 20th century. Therefore, it is safe to assume that so-called unique globes were being created until 1950.
Digitization—composed of all its essential elements, i.e., selection, legal aspects, metadata [
1,
2,
3], technology [
4,
5,
6], grid data and repositories [
7,
8]—appears to be the key tool for protection, archiving and enabling public access to globes. This viewpoint is reflected in documents issued by governments and international organizations. The protection efforts are supported by major international institutions such as UNESCO [
9]. The greatest attention is paid to the processing of, and ensuring access to, old cartographic documents, which are among the most used but also the most endangered segments of cartographic cultural heritage [
10]. It is due to this reason they need special protection.
Many map collections in Europe, the United States of America and Australia are gradually digitizing and making accessible their unique holdings. Among the most im-portant described and digitized map collections today are the David Rumsey Map Center [
11] at Stanford University Libraries, the Leventhal Map and Education Center [
12] at the Boston Public Library and the Map Collection at the National Library of Australia [
13]. However, the description and digitization of globes is different from the processing of other cartographic materials. It is necessary to accurately prepare the sphere, as well as the description, geographical grid and texture of the continents, countries and other details. This is possible by creating a virtual three-dimensional model.
An example is the digital reconstruction of an old 16th century globe by Gerhard Mercator [
14] for visitors to the Mercator Museum in Belgium [
15]. One of the largest manuscript globes of László Percze with a diameter of 139 cm from 1862 has been digitized by the team of Mátyás Gede and made available in the Hungarian Virtual Globes Museum [
16,
17]. Valuable exhibits of Dutch pairs of globes by Willem Janszon Blaeu from the 17th century are also made available here.
The French National Library has also published a collection of digitized globes in the Gallica Digital Library [
18], including a valuable terrestrial globe with a diameter of 24 cm by Martin Waldseemüller from 1506. Another unique item is an Arabic celestial globe from the 11th century.
Around a hundred digitized globes from various collections of the Czech Republic are published on the website of the Research Institute of Geodesy, Topography and Car-tography [
19]. Among old works, remarkable is a pair of globes by Vincenzo Maria Coronelli from the end of the 17th century with a diameter of 110 cm, owned by the National Library of the Czech Republic [
20].
The problem of describing the globes and making them available was also addressed by the Map Collection of the Faculty of Science of Charles University, which was founded as early as in 1891. It acquired the status of the State Map Collection of the Czechoslovak Republic in 1920. Although this status was changed in the 1950s, the Map Collection has retained its importance. It contains 130,000 map sheets, 3500 atlases and 122 globes. More than 100,000 maps have been scientifically catalogued and 65,000 map sheets have been made accessible electronically [
21].
The first attempts to make this part of the collection accessible were published al-ready in 2013 [
22]. Photographs of the globes with a brief description were gradually published on separate websites. They are dedicated to each exhibit, showing bibliographic, globographic information on the given specimen (metadata), such as the title, author, place and year of publication, as well as physical data describing the dimensions, the stand and material from which the globe was made. In the history of cartography, the Greenwich meridian was not always the prime meridian. Therefore, the position of the prime meridian (passing through, for example, Cape Verde or the Canary Islands) is also given for each globe. Old celestial globes depict the starry sky with allegorical representations of constellations in the form of animal or human figures.
Attempts at three-dimensional presentation have been published for the eight oldest globes. Researchers can virtually rotate the globe model, zoom in on it, view unique illustrations and notes, or read the historical names of cities and constellations. Due to the large volume of data, only smaller models have been presented so far. Projecting a globe into two-dimensional maps was also a topic of discussions. In 2013, an experienced team from the Belgian University of Ghent, led by Professor Philippe de Maeyer, who had already digitized the above-mentioned G. Mercator’s globe [
15] in the past, was recruited to collaborate. The digitized globes are presented in different formats (pdf, wrl and WebGL) and in different qualities, so that each user can view the model according to the capabilities of their technical equipment. It is often the case that researchers do not have the necessary browsers, programs or other equipment needed to quickly view the globes.
Physically, old globes are either not displayed or only rarely displayed so as not to damage them. The spheres were often made of plaster and paper and are therefore very fragile. The globes cannot be exposed to light or to changes in climate and temperature, or to human intervention in order to prolong their life. The high financial costs involved in restoration should also be mentioned, as it was not possible to make accessible the original blackened, damaged, cracked or illegible globes [
23]. This has also created new re-paired objects that will need to be newly processed. In addition, through gradual acquisitions, the Map Collection of the Faculty of Science, Charles University, has obtained around 50 new globes in the last ten years. In digital format with verified metadata, re-searchers can zoom in on the globes at any time in great detail and verify a lot of the data.
The aim of the article is to prepare a model for making available metadata and digital objects of the new Globe Virtual Collection for the Map Collection of the Faculty of Science of Charles University. Therefore, the research question arose of how to describe the globes in a modern and effective metadata method and of how to digitally process and make them accessible. Simply put, how to digitally process and visualize the repaired and new globes quickly, easily, without major demands on other auxiliary tools and browsers, in order to make them efficiently accessible to researchers.
This article therefore deals with the digital reconstruction and visualization of globes and how to provide access to them. Good practice is demonstrated through a case study of the processing of a terrestrial globe by Josef Jüttner (1775–1848), originating from the repository of the Map collection of the Faculty of Science of Charles University.
1.1. Research of Literature and Existing Methods
Knowledge of the original materials, the process of creating the globes and their individual components was a prerequisite of successful digitization. Numerous authors have studied this topic in the past [
24,
25,
26,
27,
28]. Initially, the globes used to be of a smaller diameter. As the diameter became larger, it gradually became customary to create globes comprised of two hemispheres, which were made in molds. Gores were cut from a globe map printed on paper and carrying terrestrial or celestial content, and then carefully pasted onto a gypsum or cardboard sphere. The old globes were often supplemented with further instruments and aids such as the compass, the meridian or the horizontal circle. Degrees were engraved into the meridian circle to aid the reading of the latitude. The horizontal circle was usually made of wood and pasted over with paper with a calendarium printed on it [
29].
The old terrestrial globes usually included a geographical grid. The choice of the zero meridian could vary—it would pass through the Azores or El Hierro Island in the Canary Islands. It was not until the late 19th century that the prime Greenwich meridian became the established norm.
In order to digitize the globes and provide access to them, it was first necessary to identify a suitable digitalization method and then apply it accurately and efficiently. The criteria for the selection of this method were to determine the overall geometry and small details such as drawings, grids, or captions on the terrestrial globe. Another important parameter to be taken into account was the size of the globe, which could range from 10 cm to 100 cm in diameter. In particular, the Map Collection of the Faculty of Science of Charles University contains old globes ranging from 8.6 cm to 113 cm in diameter. In the whole Czech Republic, according to Karel Kuchař’s research, old globes have a diameter from 7.5 cm to 127 cm [
30].
The physical mounting and the possibility of removing the globe from the base was equally important. Four basic approaches to the digitization and 3D reconstruction of old globes are described in the literature.
The first attempts focused on creating a high-quality texture and then displaying it on a spherical model. This method was described by [
31]. Taking images of the globe was carried out sequentially, according to the geographical grid at regular intervals to ensure sufficient image overlap. The subsequent conversion of the images into a 3D model was very +labor intensive. Each image had to be georeferenced separately using control points. Overlapping images rectified this way could be assembled into a complete mosaic in the shape of a sphere. This method has also been discussed in detail by [
32,
33]. This procedure involved some difficult manual handling of the globe. This involved dismounting the object from the base, expertly removing the meridian ring and placing the globe into a special static imaging device, where it was fixed and could be moved around on wheels.
The second approach was the creation of a 3D model on the basis of printed globe maps, as described by [
17,
34,
35,
36]. This method involved a reconstruction (rather than digitization) of the globe and its visualization on the Internet. In these cases, gores of the globe printed on paper were scanned. The digitized data obtained in this way had to be georeferenced using the intersections of the geographic grid to create a uniform (spherical) object with the texture of a globe. It was an efficient, accurate but very labor-intensive method.
A third variant was described by [
37]. It involved laser scanning combined with the photogrammetric method. In this case, a real 3D globe was scanned and photographed. Laser scanning was used to define the final shape of the globe (sphere) and a texture was created from the photogrammetric images. The resulting globe models had a visible structure (e.g., continents, oceans, descriptions, etc.). Calculation problems may arise in relation to the resulting point cloud. Visible empty space appears in areas with a uniform texture, such as the oceans. This problem is addressed by [
38], who used laser scanning data to fill in the gaps in the point cloud.
The last known method of processing three-dimensional objects is close-range photogrammetry. This method was tested by [
15]. The gaps occurring in the point cloud were calculated using triangulation. This procedure of contact-free digitization and reconstruction of old globes was used by [
39,
40]. The testing of the relationship between varying image overlap sizes, the used focal length and the resulting accuracy of the 3D model was presented by [
41].
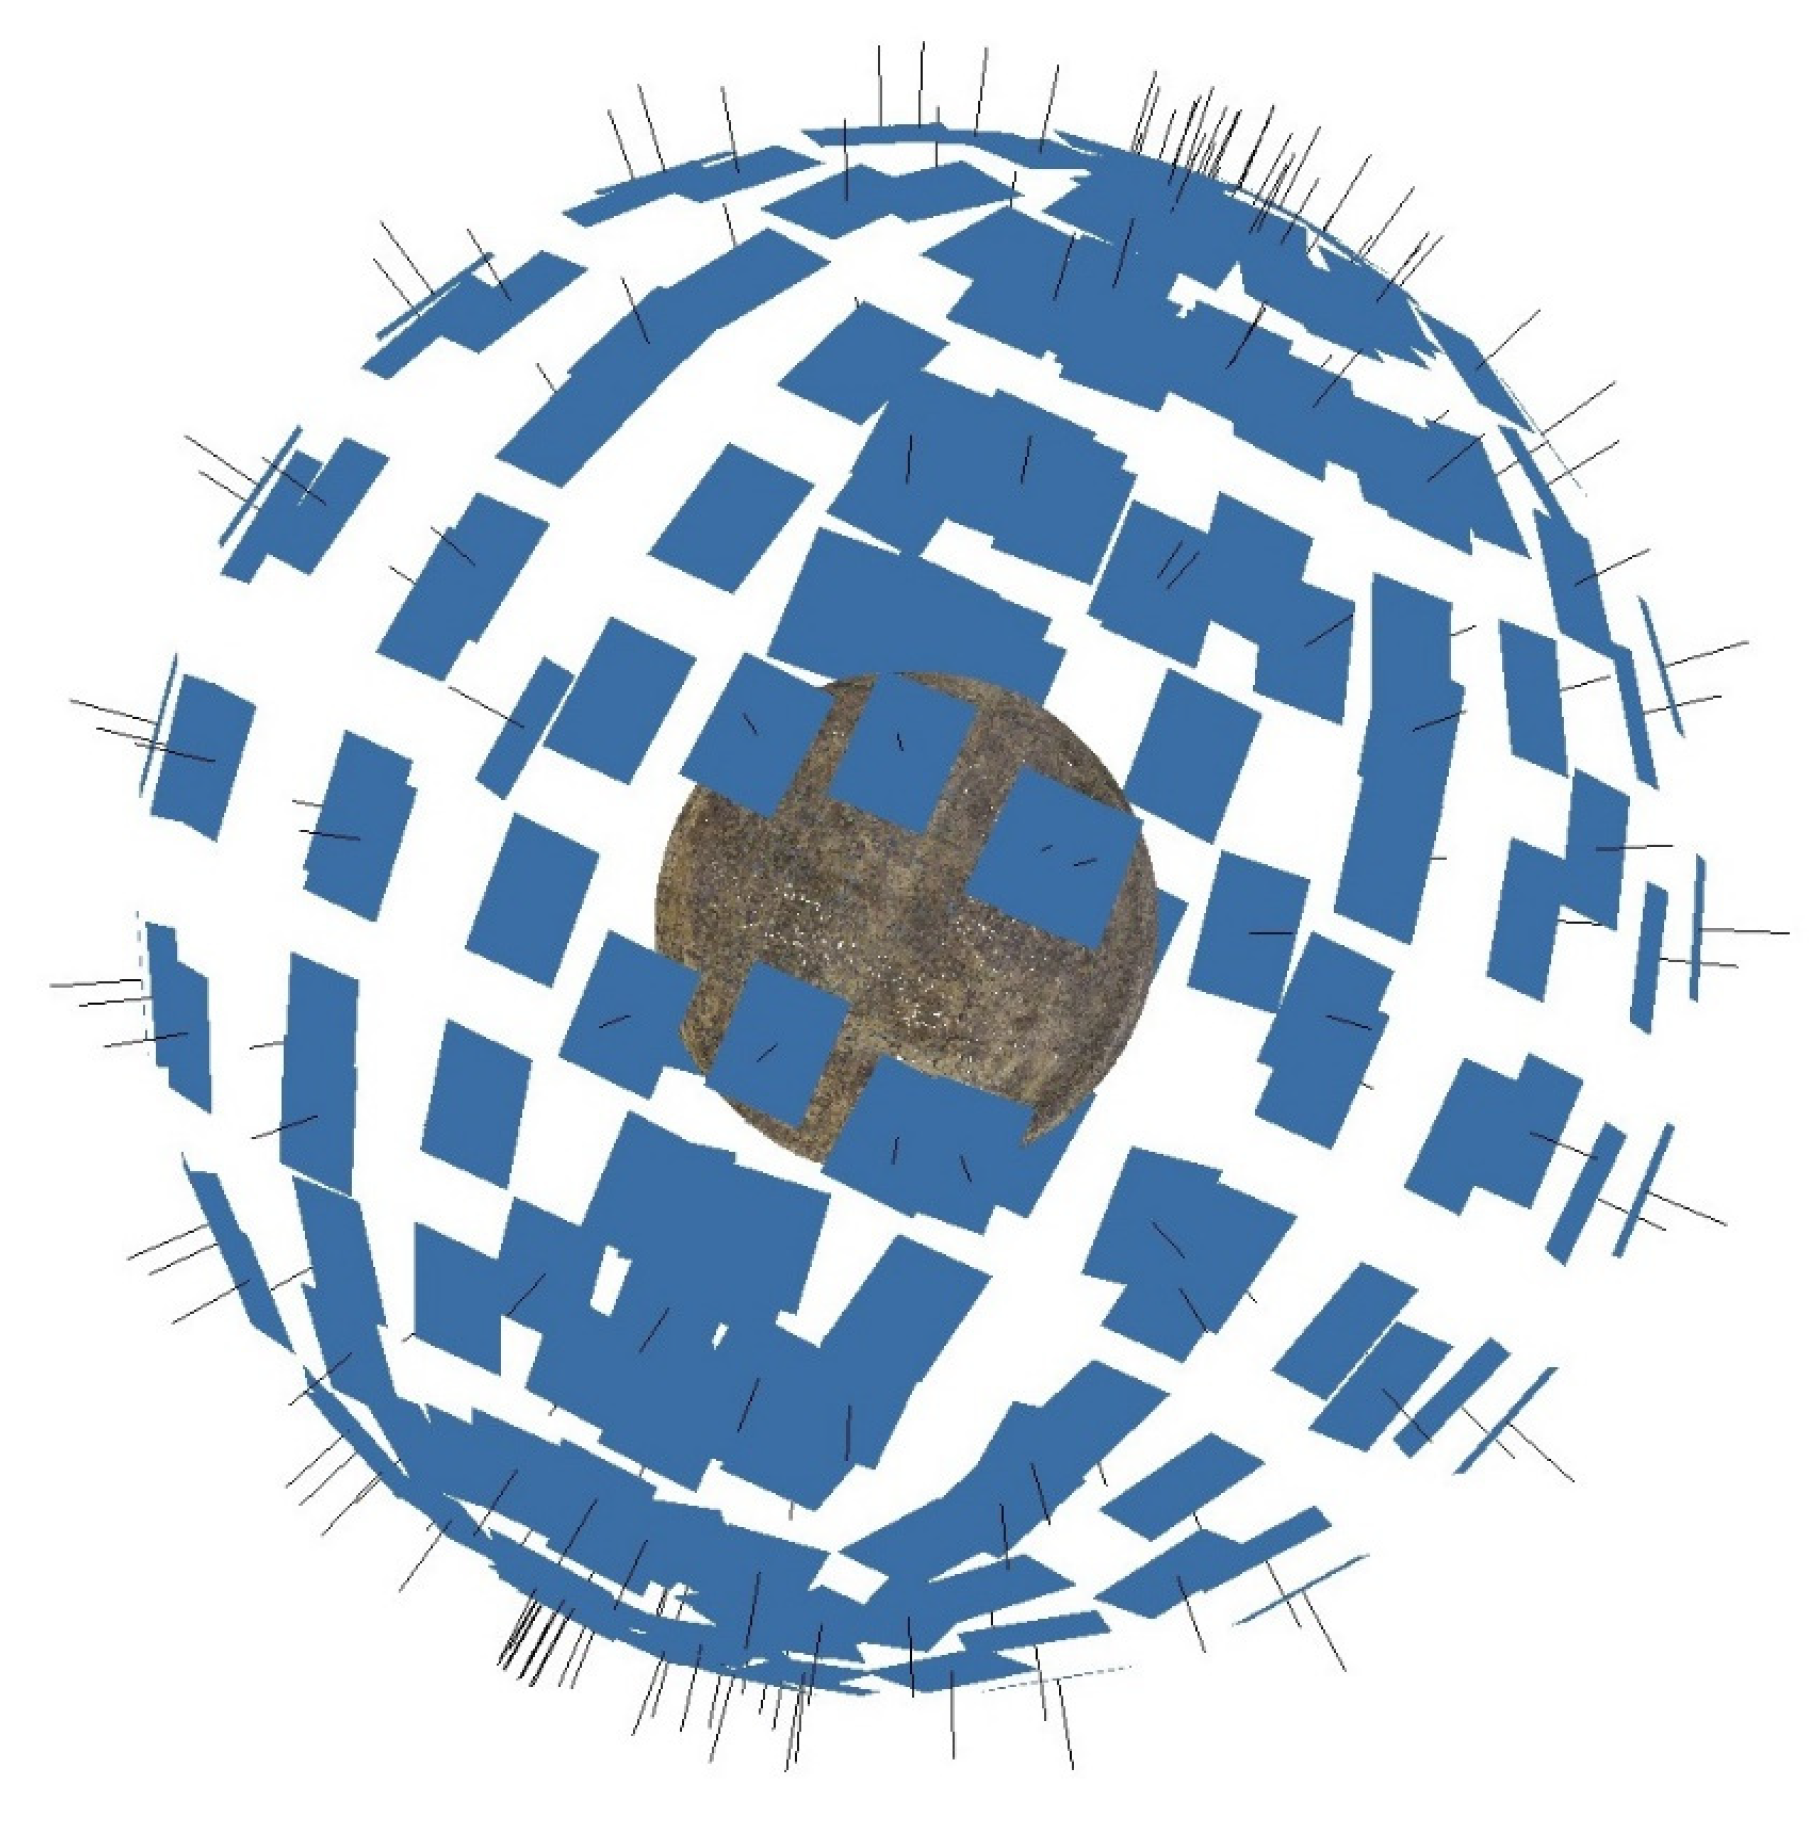
Laser scanning and photogrammetry are suitable for creating a 3D textured model. Laser scanning is recommended when high accuracy over a large area is required. Photogrammetry is more suitable for documenting smaller objects and capturing realistic textures. A comparison of these methods according to the various criteria of equipment, data processing and accuracy are described, for example [
42]. SfM-MVS photogrammetry appears to be a suitable method for 3D digitization of the globe, using the automatic techniques of Structure from Motion (SfM) and MultiView Stereo (MVS) to estimate a 3D model from overlapping 2D images. The creation of the 3D model takes three steps. (i) The automatic keypoints extraction from all images and matching across images using the algorithm Scale Invariant Feature Transform (SIFT). SIFT allows for a comparison of corresponding features under changes in the angle of view, scale, partial occlusion and changing illumination. (ii) SfM is used for the calculation of individual camera positions, orientations, focal lengths and relative positions of corresponding features. This step is known as bundle adjustment. (iii) The dense point and 3D surface (model) are determined based on known camera parameters using MVS. The quality and accuracy of the 3D model depends on the image’s quality [
43].
In general, camera calibration must be performed for non-metric cameras. This determines the Internal Orientation Parameters (IOP) that are necessary for image processing—i.e., the focal length, the coordinates of the camera principal point, and the radial and tangential distortion coefficients. The radial distortion of the lens significantly affects the geometric accuracy of the result. For non-metric cameras, the distortion at the edges of the images can be as high as 200 µm. In the case of high image overlap, self-calibration can be used [
44,
45]. The digitization parameters are related to good map design. The use of the black line, black dash and black dot in cartography is described [
46]. Web presentations represent an increasingly popular means for the public to access three-dimensional globe models in a virtual environment and work with them. These presentations can be created in three ways.
The first option is to make the digitized globes accessible in the form of georeferenced maps using one of the web services designed for this purpose. The Tile Map Service is an example of such a service [
33].
The second option is to view a three-dimensional model in one of the graphic formats directly in the web browser. The graphic format determines how and what data are saved in the file. Each format has its own specifics and is suitable for a particular application and purpose. The most commonly used 3D graphic formats are obj, x3d or glb.
The obj format was developed in 1990 by Wavefront Technologies. It is an open text format that describes the geometry of one or more objects. The color and texture data in-formation is usually stored in a separate mtl file, which is distributed with the original obj file [
47].
This format is used in most 3D software such as Maya, Blender and 3ds Max. It is suitable for exporting objects, but not for exporting animations [
48].
The glb format is a binary file format used to share 3D data. It contains geometric da-ta such as vertices, surfaces and normals. However, it may also contain additional information about models, lighting, materials and animations. The glb format is developed by the Khronos Group, a non-profit consortium that creates open standards in 3D computer graphics or virtual and augmented reality [
49].
Extensible 3D, abbreviated x3d, is an open format from the Web3D consortium. It al-lows you to store 3D objects and scenes. It is used, for example, for the visualization of scientific data, multimedia presentations or websites with 3D content. It replaces and ex-tends the original Virtual Reality Modeling Language (VRML) format, which was de-signed primarily for virtual reality, to include new features [
50].
The glb format has the advantage over obj and x3d in the better rendering of object shape. This is because it uses not only triangular meshes, but also points or edges. All the elements of a 3D scene are stored in one compressed file, so it speeds up loading in web browsers.
In terms of technology, HTML5 programming language is used nowadays, which allows for rendering graphical elements directly in the core of the web browser [
51]. Open-source libraries based on JavaScript and WebGL (Web Graphics Library) web standard are used to render 3D graphics [
52]. JSC3D Viewer, the Google Earth plugin or the JavaScript libraries Cesium and X3DOM appear to be the most widely used tools [
51,
53].
The last option for presenting a 3D model of a globe is the 3D pdf format. This is a document type created by Adobe in the 1990s that can be opened in the freely available Acrobat Reader. This presentation method allows 3D objects to be displayed, as well as zoomed in on, rotated from any angle and interactively manipulated [
54].
One of the most popular options for displaying a virtual globe in a web browser is the Cesium JavaScript library. It is available under the Apache 2.0 open-source license for commercial and non-commercial use. It supports many formats such as obj, glb, 3D tiles and more. It is a solution that supports the modification of globe display parameters—including the combination of map layers with a digital model of the Earth’s relief—by calling the CesiumJS functions. Cesium makes full use of web technologies, and, unlike software solutions, it does not require any installation, only a web browser [
51].
JSC 3D Viewer is a freely available browser based on JavaScript technology. The program uses spatial models that are stored in an obj file. The model can be rendered using points, triangles, a flat surface, smooth flat surface or may be textured. The web browser loads the entire model, saves it in its cache memory and displays it. JSC Viewer is easy to implement in a web browser without the need for any installation [
55].
X3DOM is a program library created in JavaScript. It allows for the easy integration of three-dimensional models in x3d formats directly into the web browser. Using the JavaScript language, it is possible to modify the parameters of the scene view, as well as the appearance of the 3D model and more. Like Cesium and JSC 3D Viewer, X3DOM does not require the installation of plugins. The library can be used free of charge for non-commercial and commercial purposes. Detailed description of the X3DOM library is described [
56,
57].
It is necessary to specify the end users and their demands for making the globes available on the web. The added value of virtual globes compared to traditional objects can be summarized as follows: interactivity, navigation, object as interface, exploration, customizable to user needs, updatable, dynamic animation, multimedia integration [
58]. The authors of the web presentation drew/derived primarily from good practice examples of other virtual globe collections, as well as from communication with users. The necessary financial, human and time resources have not yet been obtained to carry out a detailed survey of user needs. The web interface for viewing the globes contains tools related to the experience of cartographers and programmers. It has to be user-friendly and address their spatio-temporal questions for the answers they need to function in their daily life, employment or education [
59]. It is assumed that users of the virtual globe collection have a basic level of technical knowledge and have an idea of how to use the online map or globe and also how to access the information. Most of these users are probably influenced by the availability of Google Maps [
60]. In general, globe information offers many topics related to geography, cartography, history, astronomy or toponomastics. The restorers can also use the objects to repair and reconstruct globes. In this case, working with users is based on a partnership and collaboration with experts and is aimed at educational institutions. In previous years, the Map Collection organized a series of competitions for the public on the topic of georeferencing old maps. Therefore, it is known that most people interested in these cartographic materials access them from home in their free time and use the site for their personal use [
61]. On the other hand, interviews with curators and teachers during school excursions in the Map Collection of the Faculty of Science of Charles University show that the globe’s website is also used in teaching. Considering the demands on the quality of data transfer, it can be assumed that users tend to be well technically equipped, not only with good quality computers, but also with good data transfer speeds, as is common in the academic community.
Slow loading of the 3D model can be a significant limitation for working with web pages. If the model does not load in real time, the user may even leave the site and probably not return. Therefore, website speed optimization performance is an important parameter for making the 3D model available. Most web browsers offer a simple tool in their “Developer Tools” to assess a website’s loading speed and weak points. Website loading time can be measured using three criteria: Domcontentloaded, Load and Finished. It is made possible thanks to WebGL’s ability to work with so-called DOM (Document Object Model) elements [
49,
62]. DOM is an API allowing access to or modification of the content, structure or style of a document.
The “Domcontentloaded” event indicates the point in time when the DOM has been completed but the external resource has not yet been loaded. The “Load” event indicates when each individual resource (img, glb, style, script, etc.) has been loaded into the browser. “Finish” refers to the period of time from the start and end of loading the 3D model data after each resource has been downloaded.
1.2. Case Study: The Globe of Josef Jüttner
A relatively large globe created by Josef Jüttner in the first half of the 19th century was chosen for the case study.
Josef Jüttner (1775–1848) was a mathematician and military cartographer of the Austro-Hungarian Army. He later worked in Prague as a globemaker and publisher [
63]. He also published maps, for example
Grundriss des …Hauptstadt Prag, on two sheets (1811–1815). He created a 12-inch celestial globe in 1:29,000,000 (Prague, 1822, with Franz Lettany) and a new 12-inch celestial globe (1824). An armillary sphere called
Ringkugel was published in 1828. The Jüttner-Lettany globe from 1822 was reissued in Prague in 1840. Jüttner continued to publish 24-inch pair globes in the 1836–1839 period. The terrestrial globe was republished in 1846 [
64].
The subject of our study, i.e., the terrestrial globe called
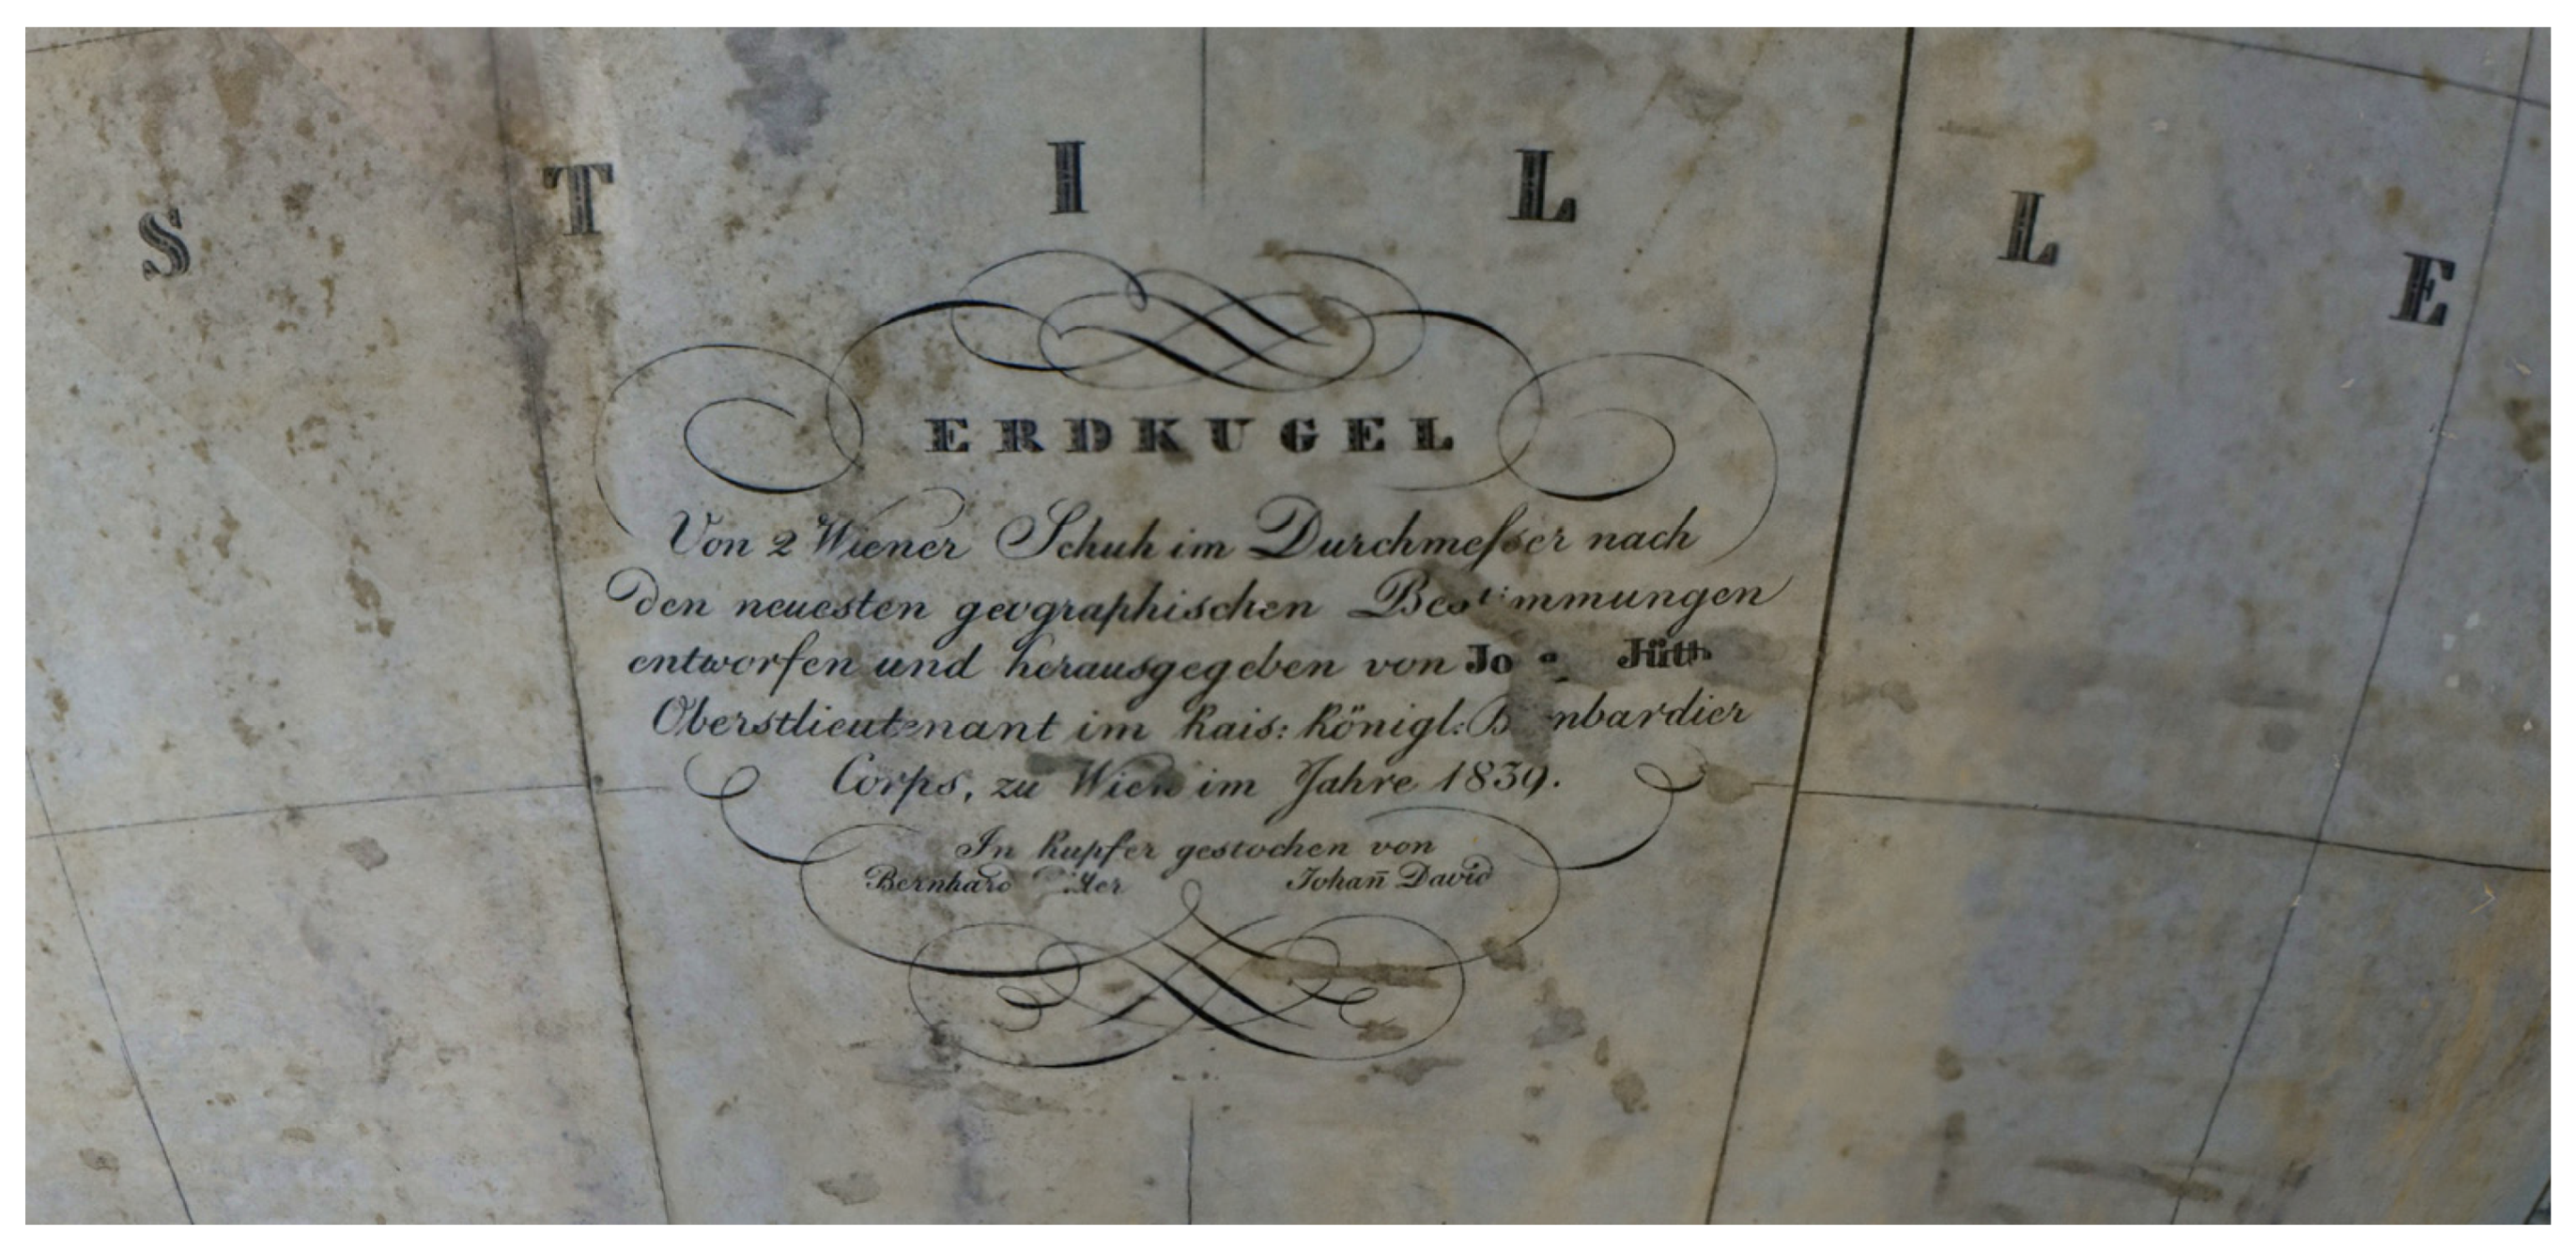
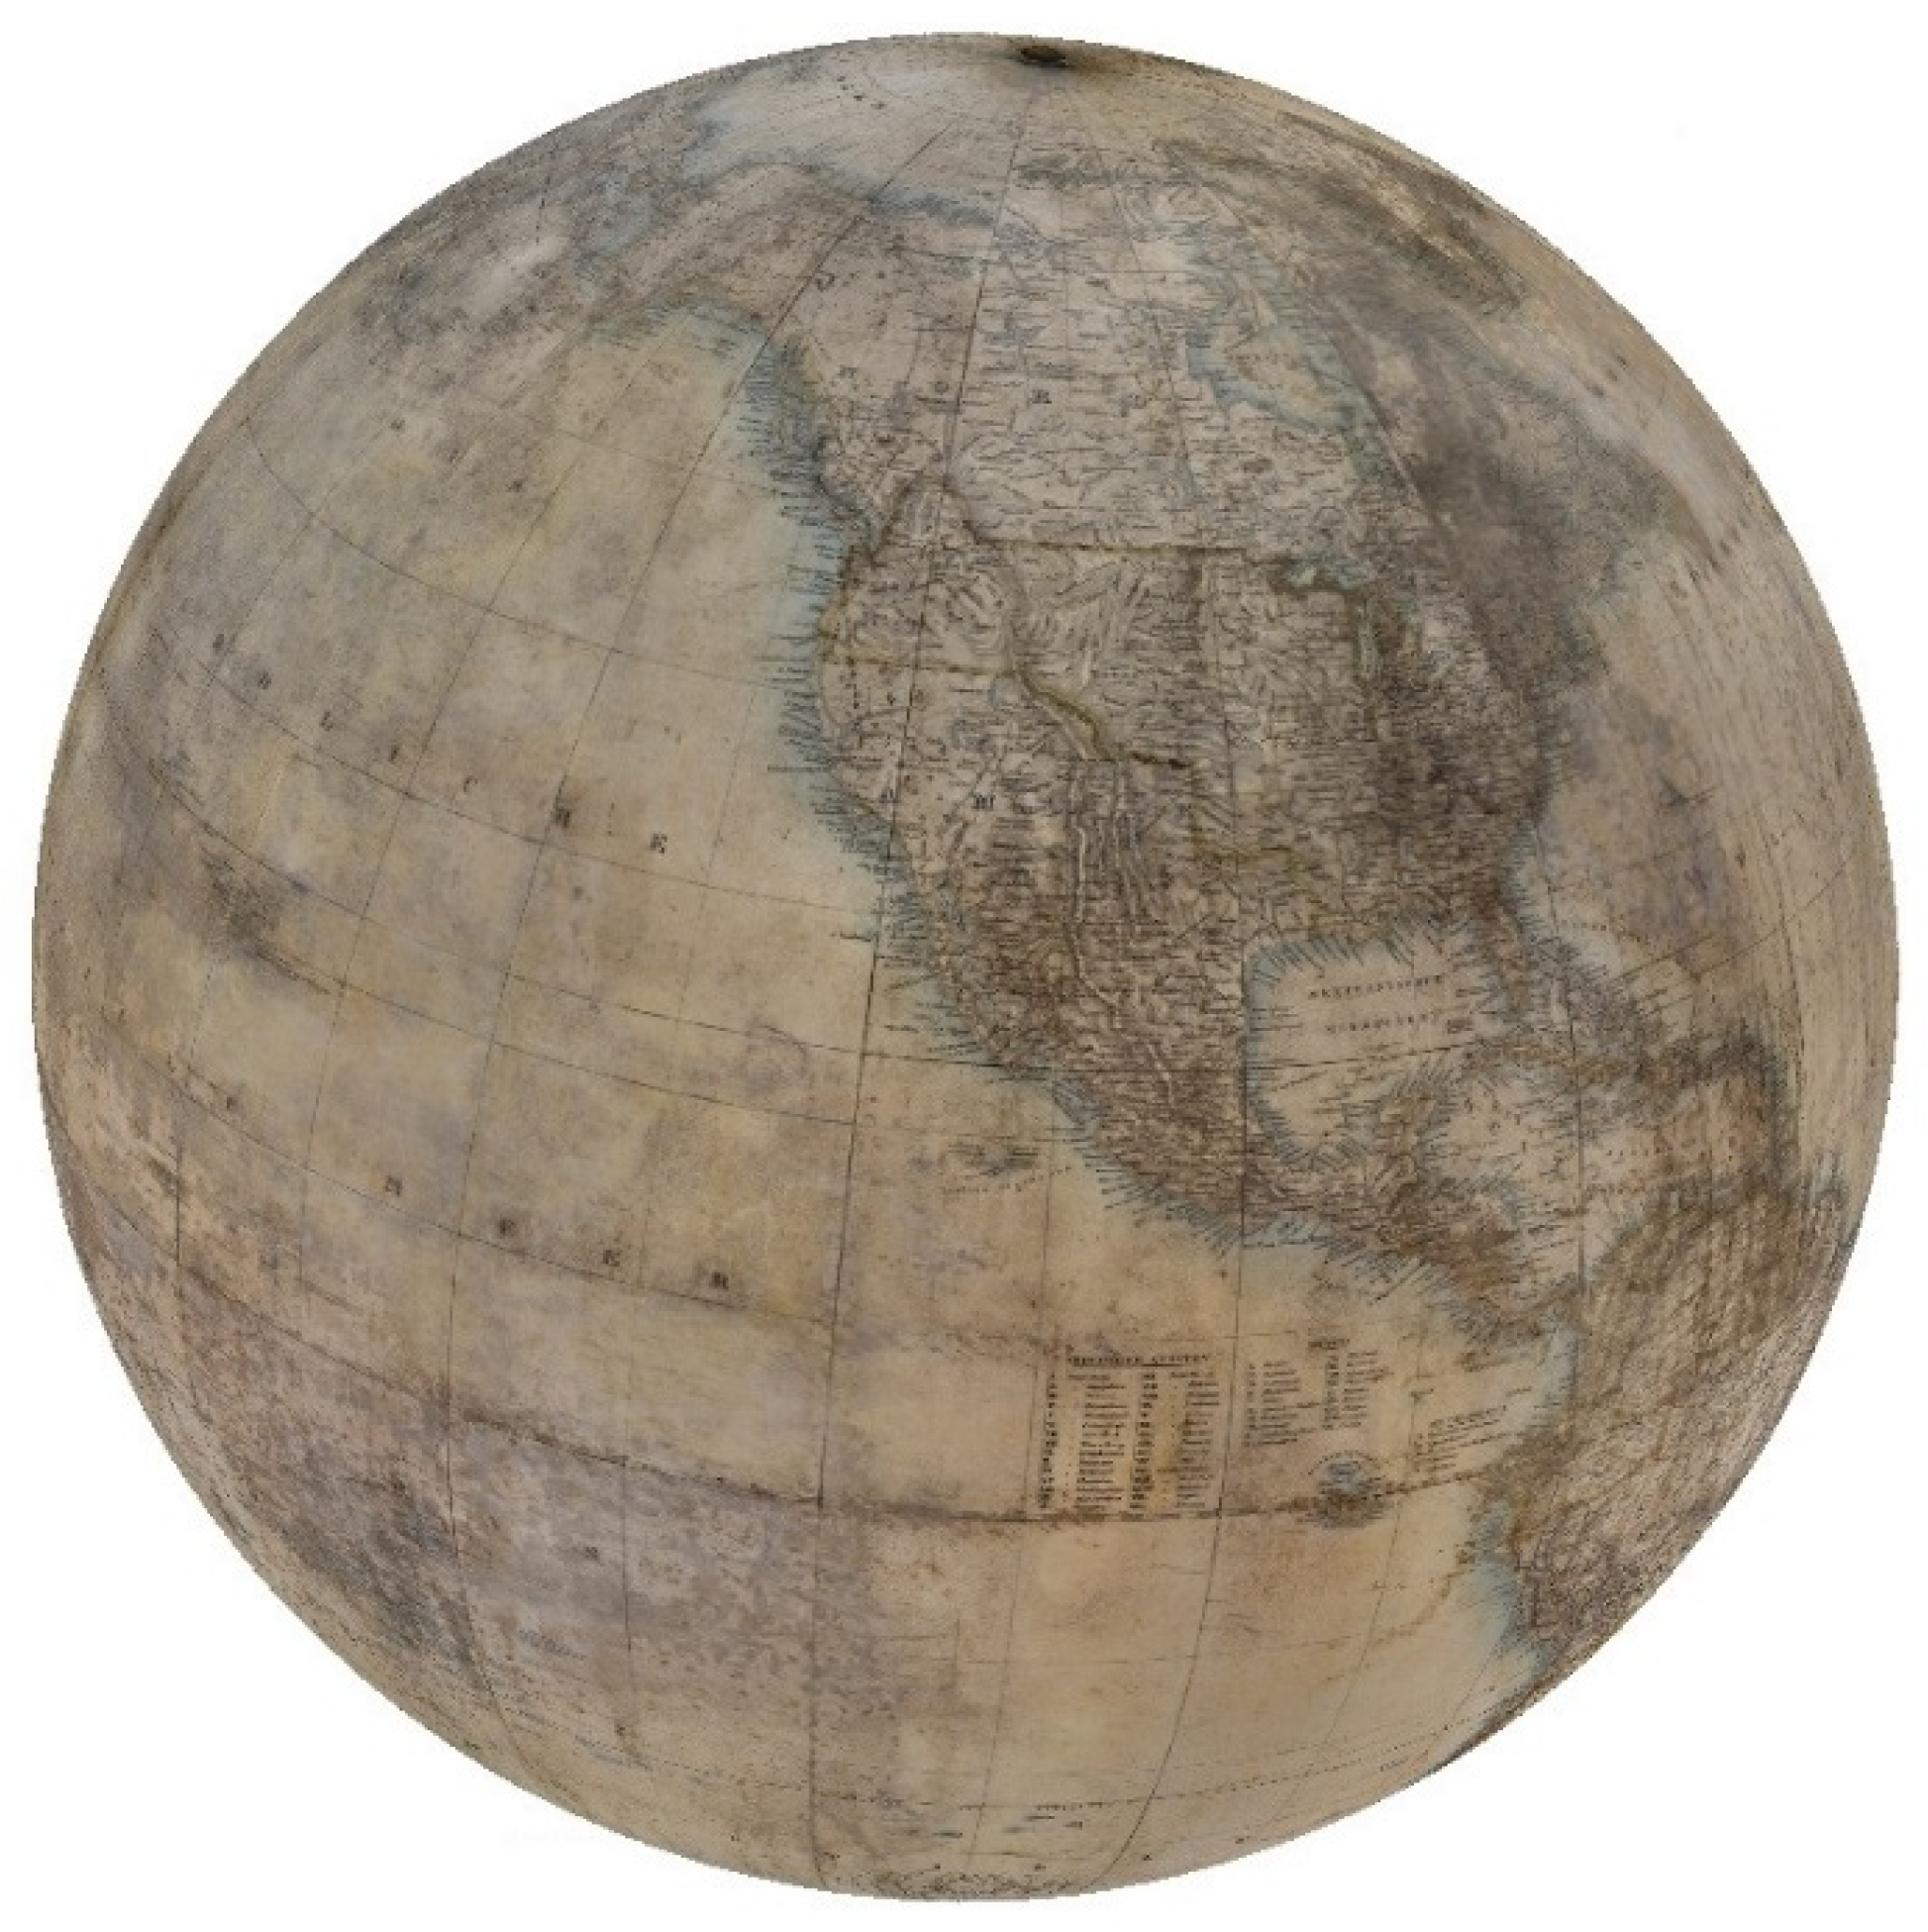
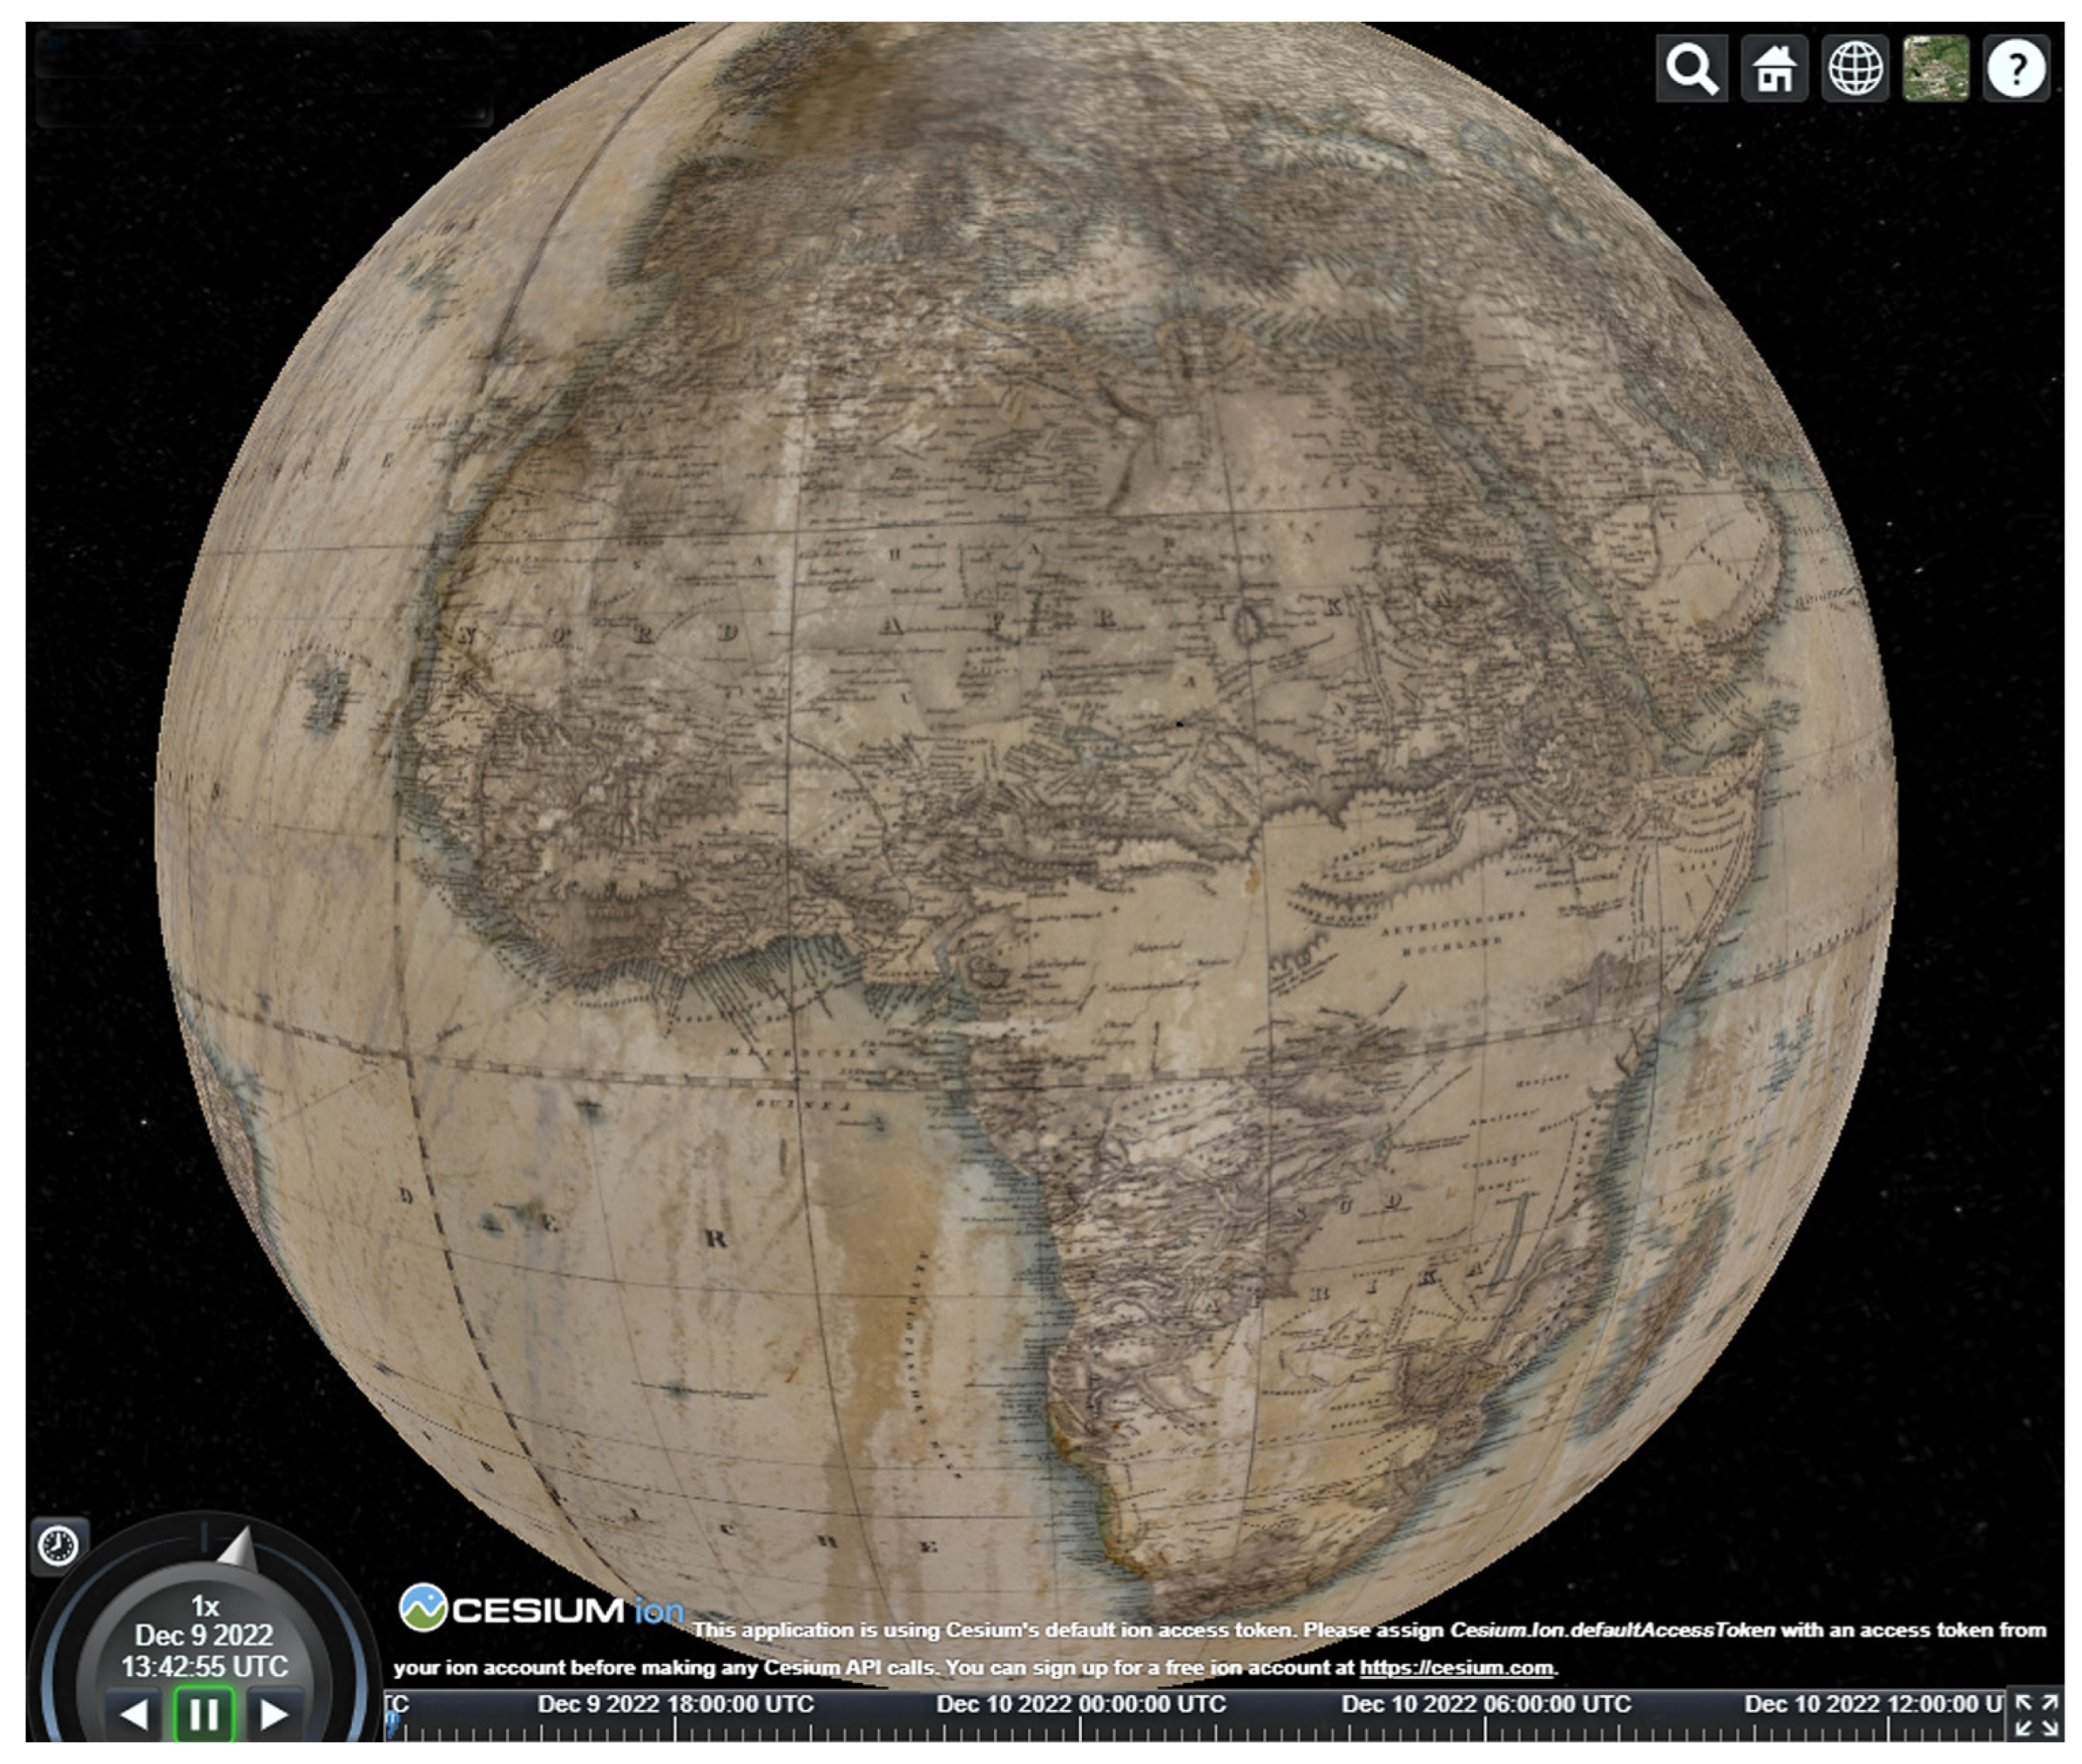
Erdkugel, with a diameter of 63.5 cm, a circumference of 199.5 cm and a height of the stand up to the brass meridian circle (measured perpendicularly from the base) of about 41.8 cm, originates from 1839. The full transcription of the German text of the cartouche containing the globe’s title (
Figure 1) and author reads as follows:
ERDKUGEL von 2 Wiener Schuh im Durchmesser nach den neuesten geographischen Bestimmungen entworfen und herausgegeben von Joseph Jüttner Oberstlieutenant im Kais. Königl. Bombardier Corps; in Kupfer gestochen von Bernhard Bitter und Johann David.(Translated: The globe measuring 2 Viennese feet in diameter reflecting the latest geographical knowledge was designed and published by Josef Jüttner, Artillery Lieutenant Colonel; engraved in copper by Bernhard Bitter and Johann David.)
J. Jüttner published the work in Vienna at the scale of 1:20,050,000. Bernhard Bitter and Johann David from Vienna are listed as engravers [
64]. The globe is made of gypsum, covered with a copperplate print of 18 paper gores and two polar spherical caps. A wooden lacquered tripod on wheels serves as the base. The globe is encircled by a brass meridian circle with engraved degrees (4 × 0–90°). Furthermore, the instrument is equipped with a horizontal wooden circle illustrated by a calendarium and Zodiac signs.
A detailed metadata description in MARC 21 format was created for the Central Catalogue of Charles University. From it, the basic metadata for the web presentation of globes were extracted (in the
Appendix A,
Table A1).
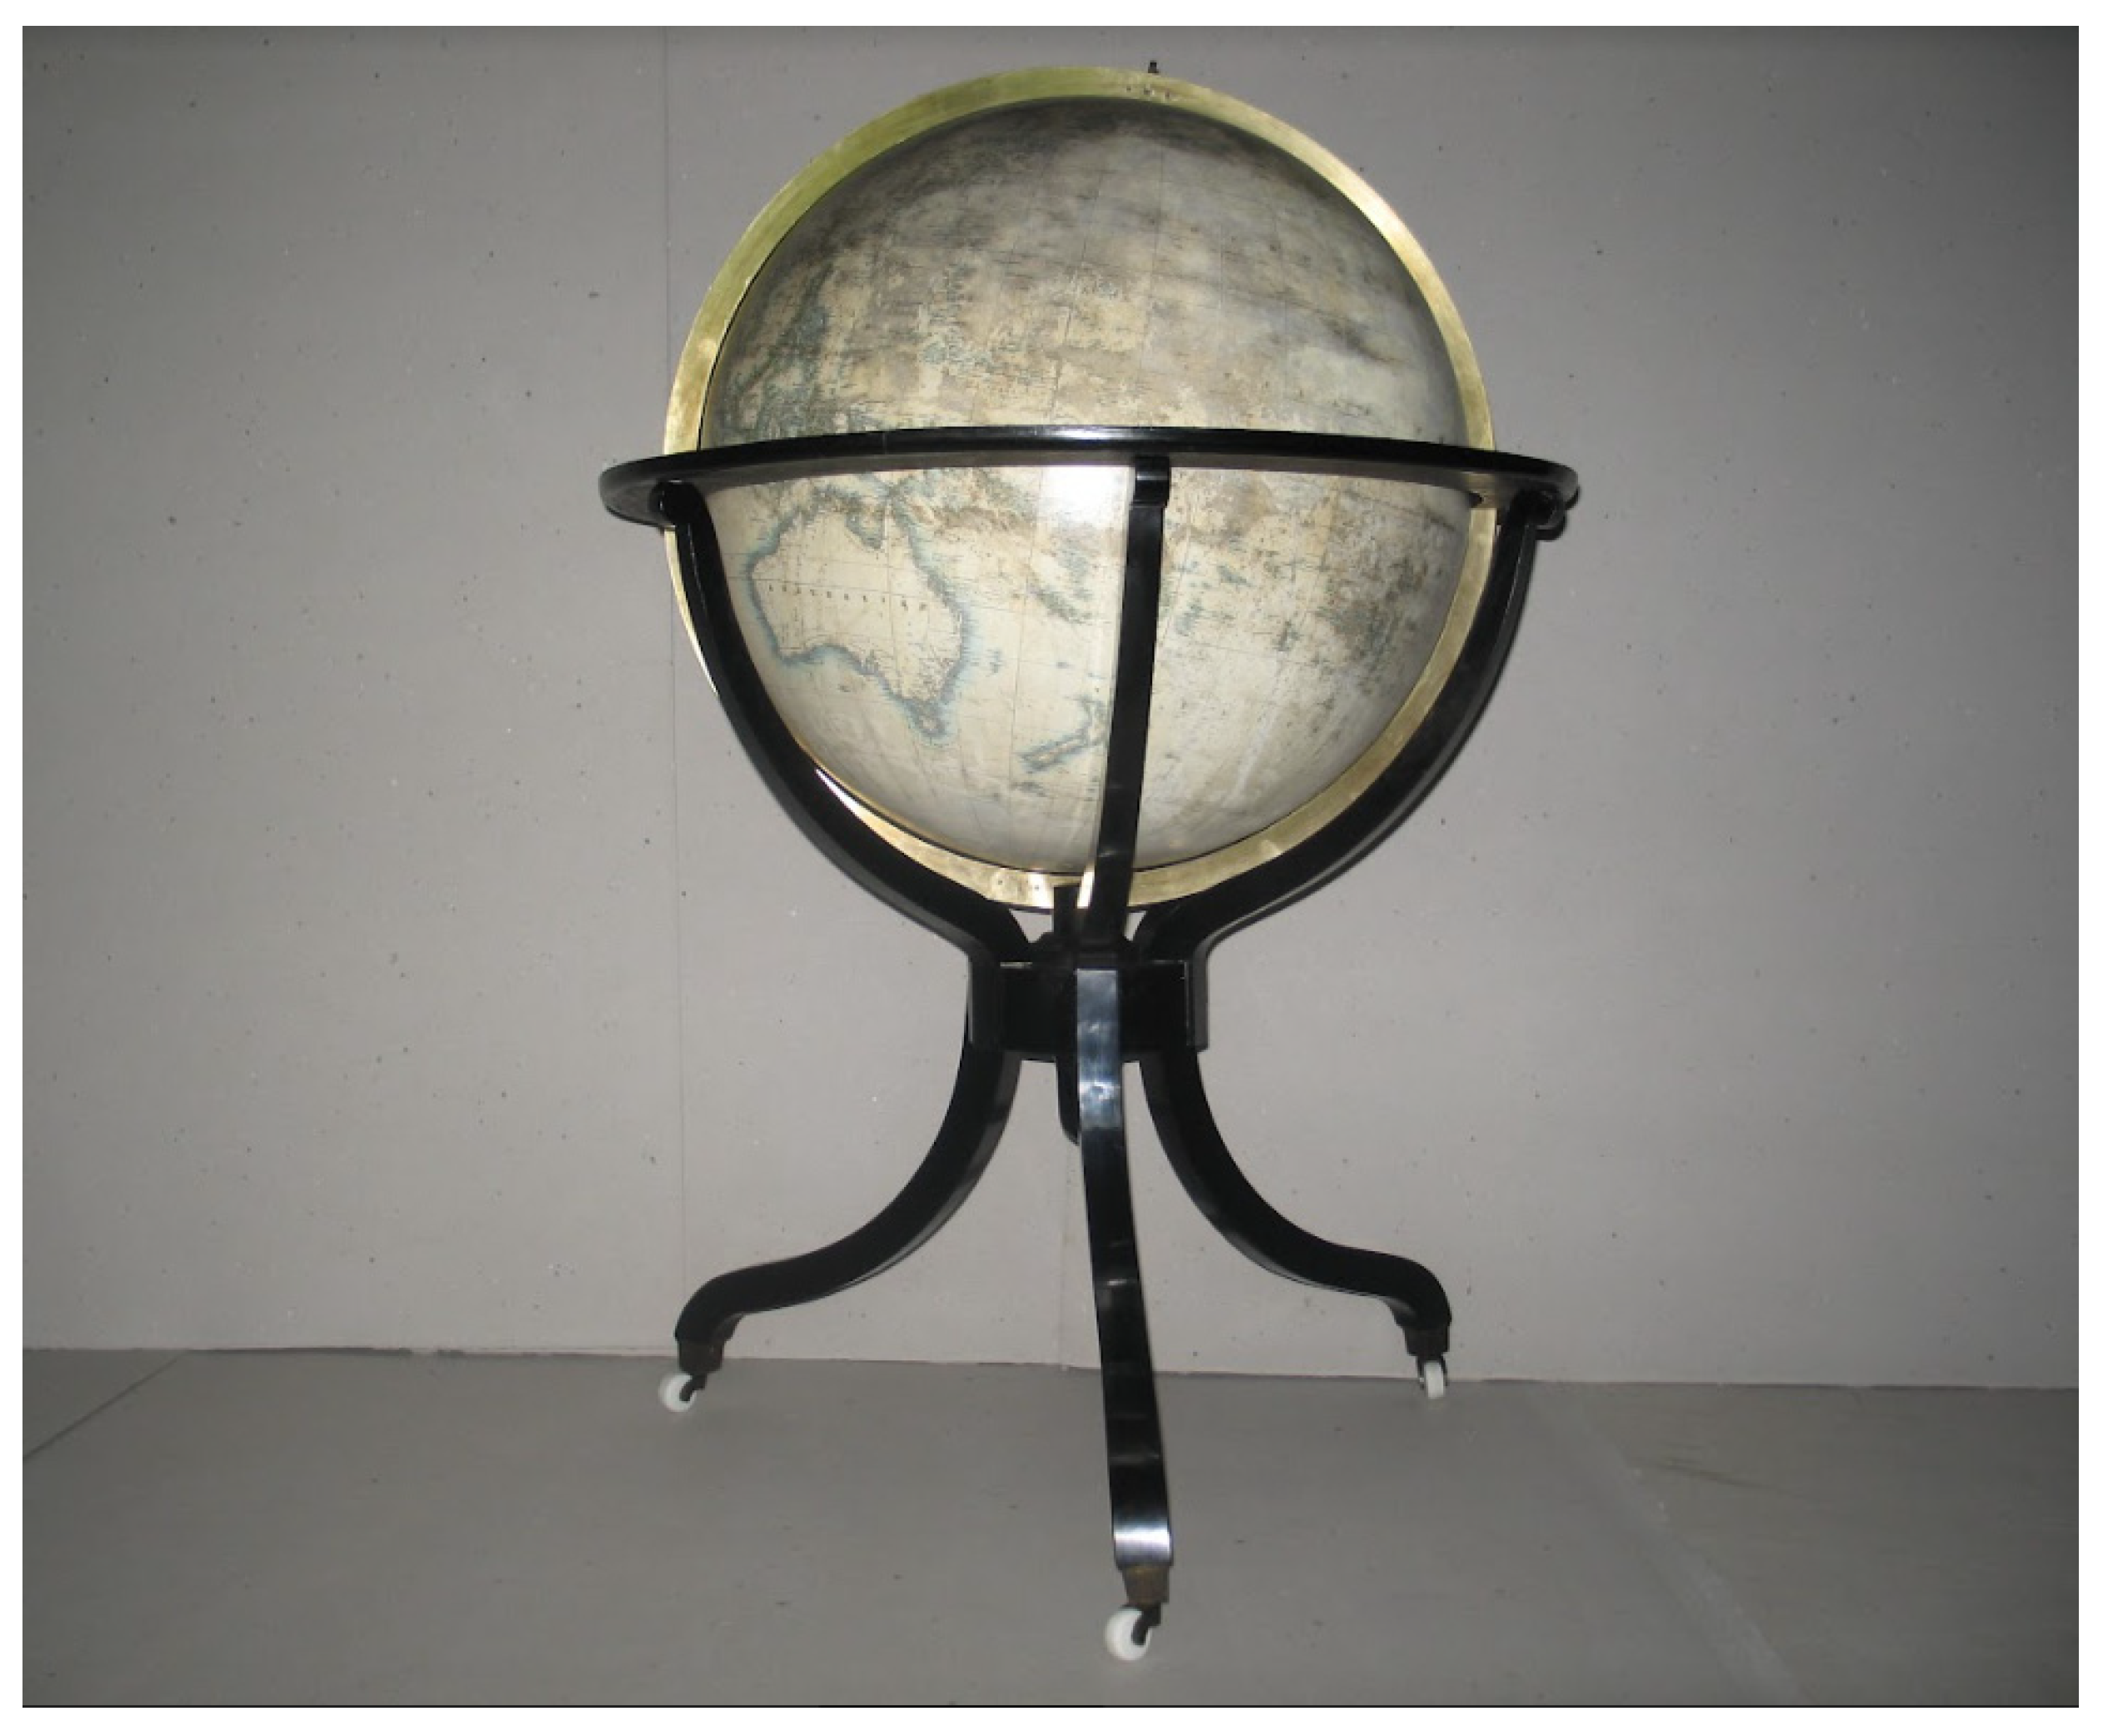
The globe was restored in 2016 by Miroslav Široký as it was illegible and damaged in many places [
65]. The stand had also seriously deteriorated. The repaired globe was inserted into a triangular base. Currently, the historical teaching aid is in excellent physical condition (
Figure 2).
1.3. Contents of the Globe
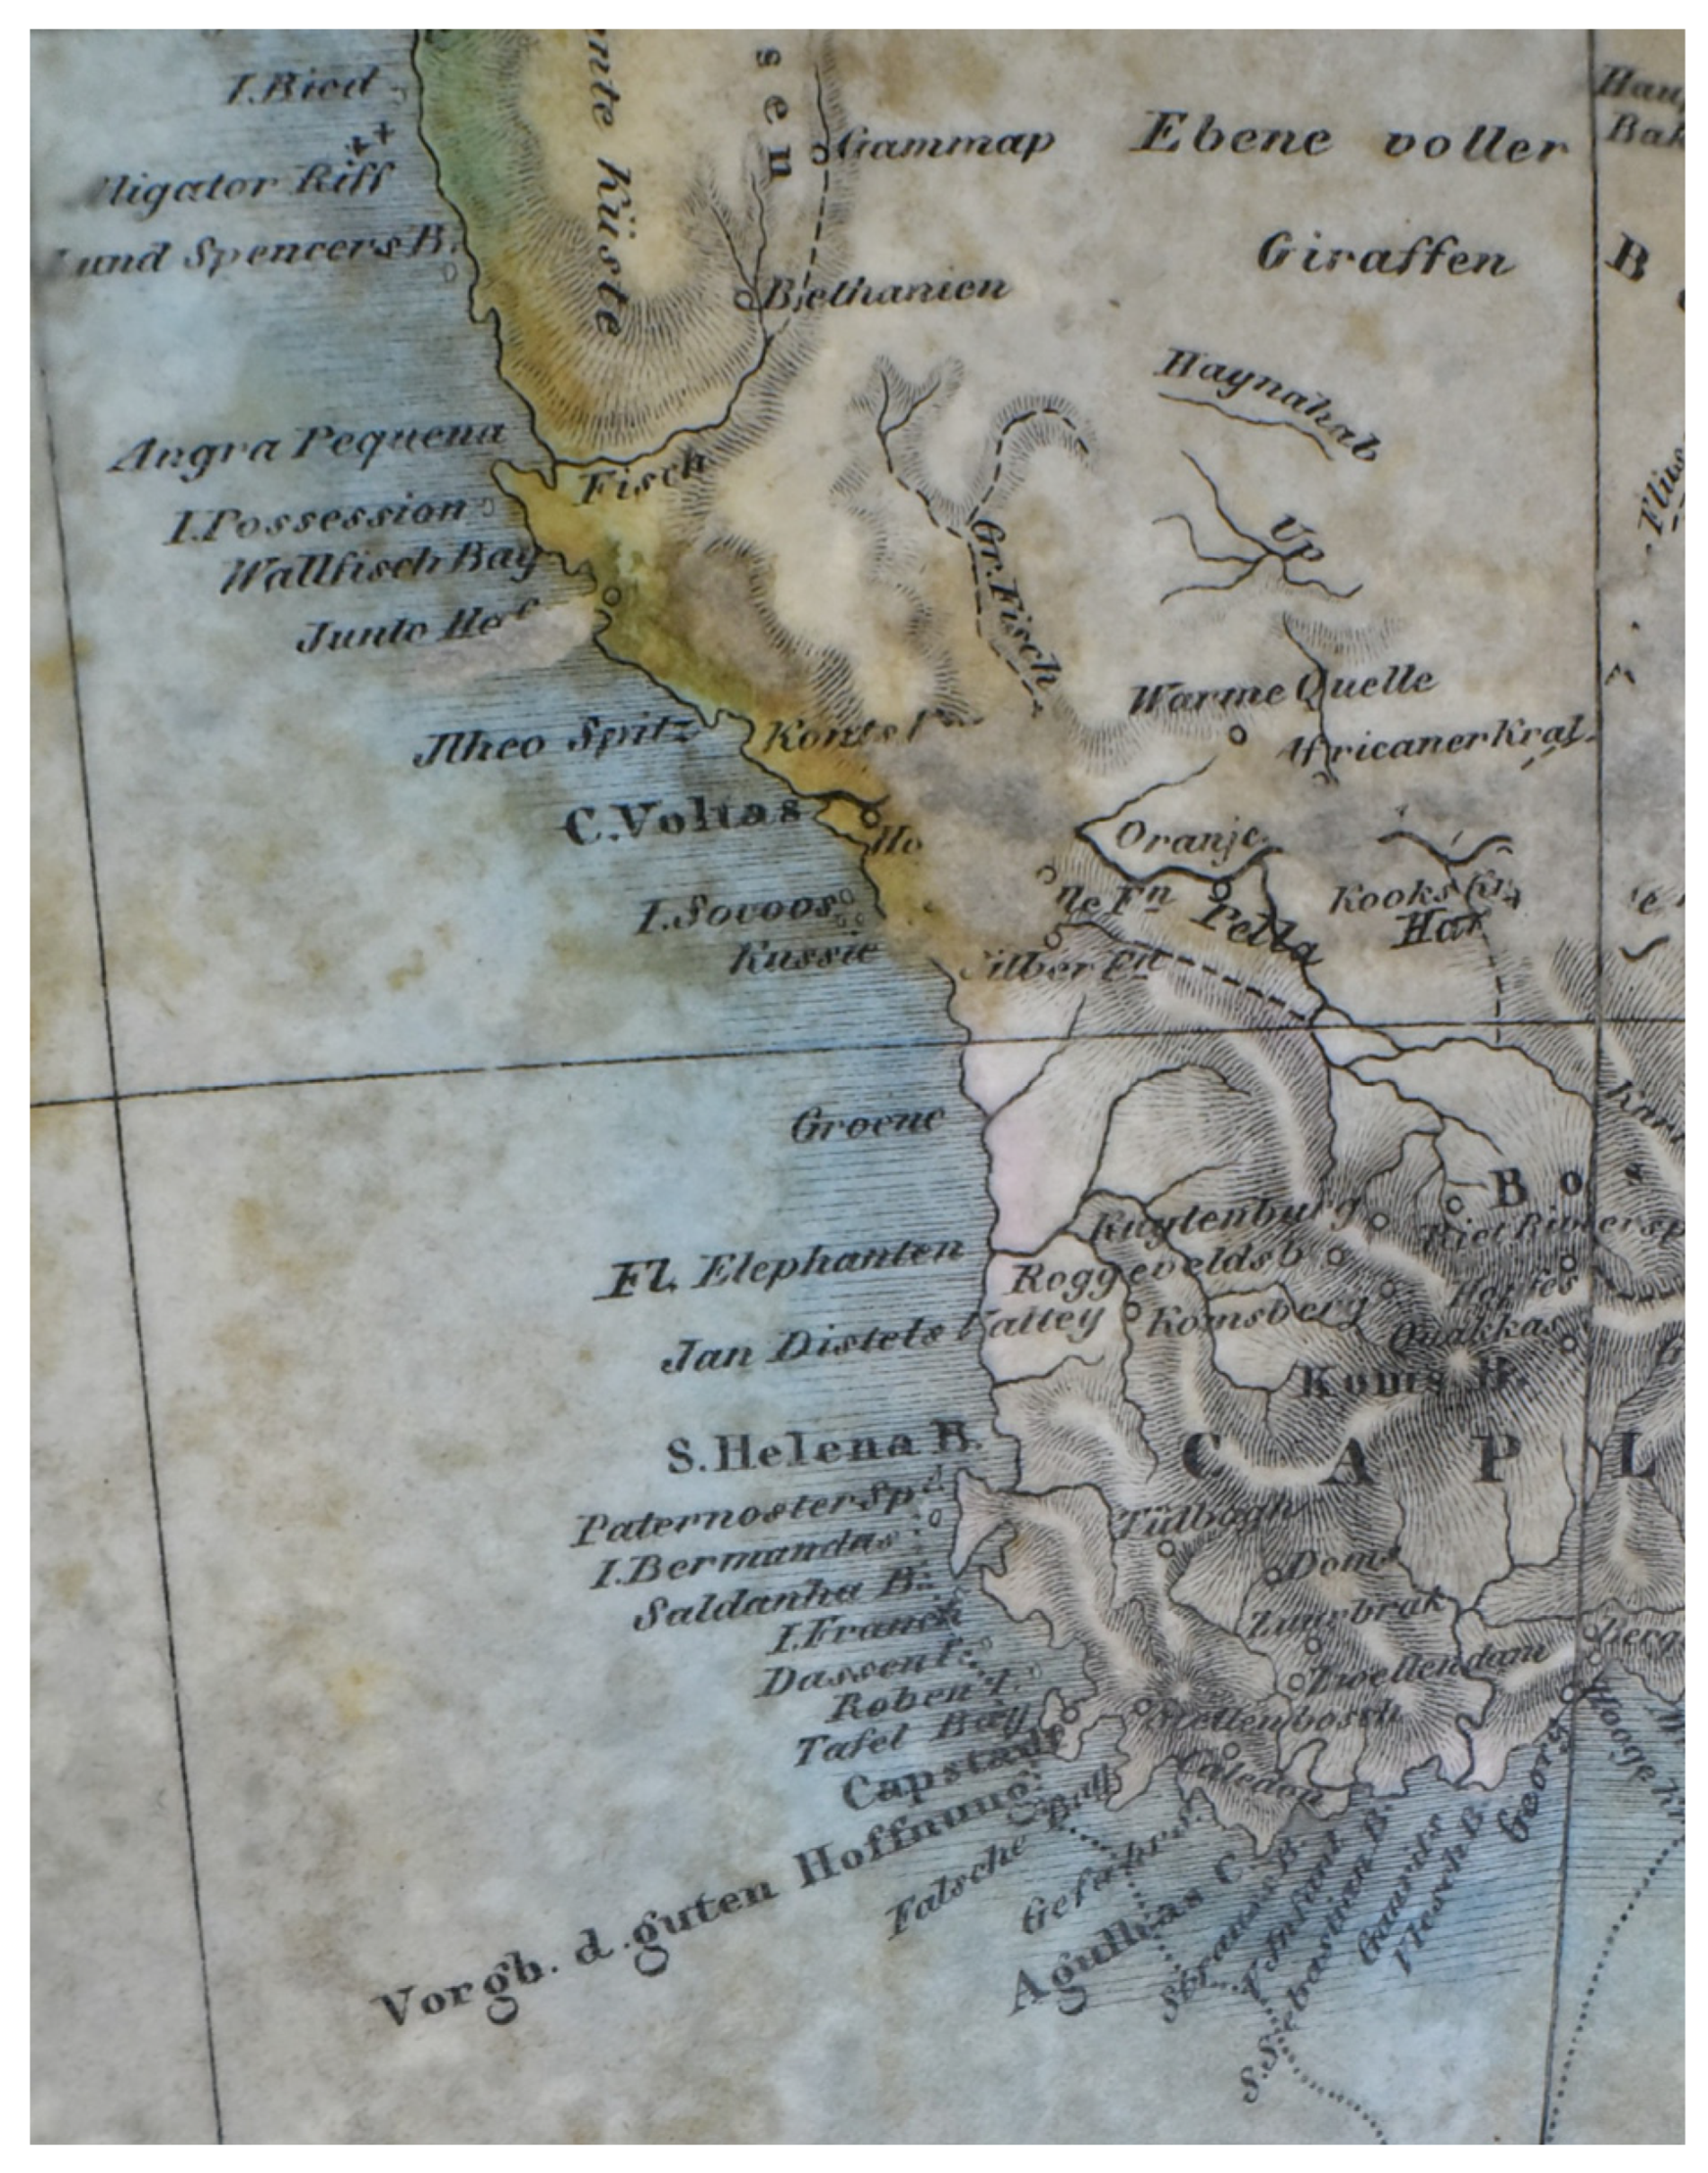
Detailed imaging allowed for better identification of the contents of the globe. The zero meridian passes through the east of the island of El Hierro, i.e., through the Canary Islands. The globe features a geographical grid, and the major parallels are marked: the Equator, the Tropics and the polar circles.
The colors of the globe have already faded, especially those of the water bodies where the blue color is preserved only along the coasts. The Earth’s surface was rendered in greyish brown. The elevation of the mountains was represented by shading in a brown color and the density of slope shading.
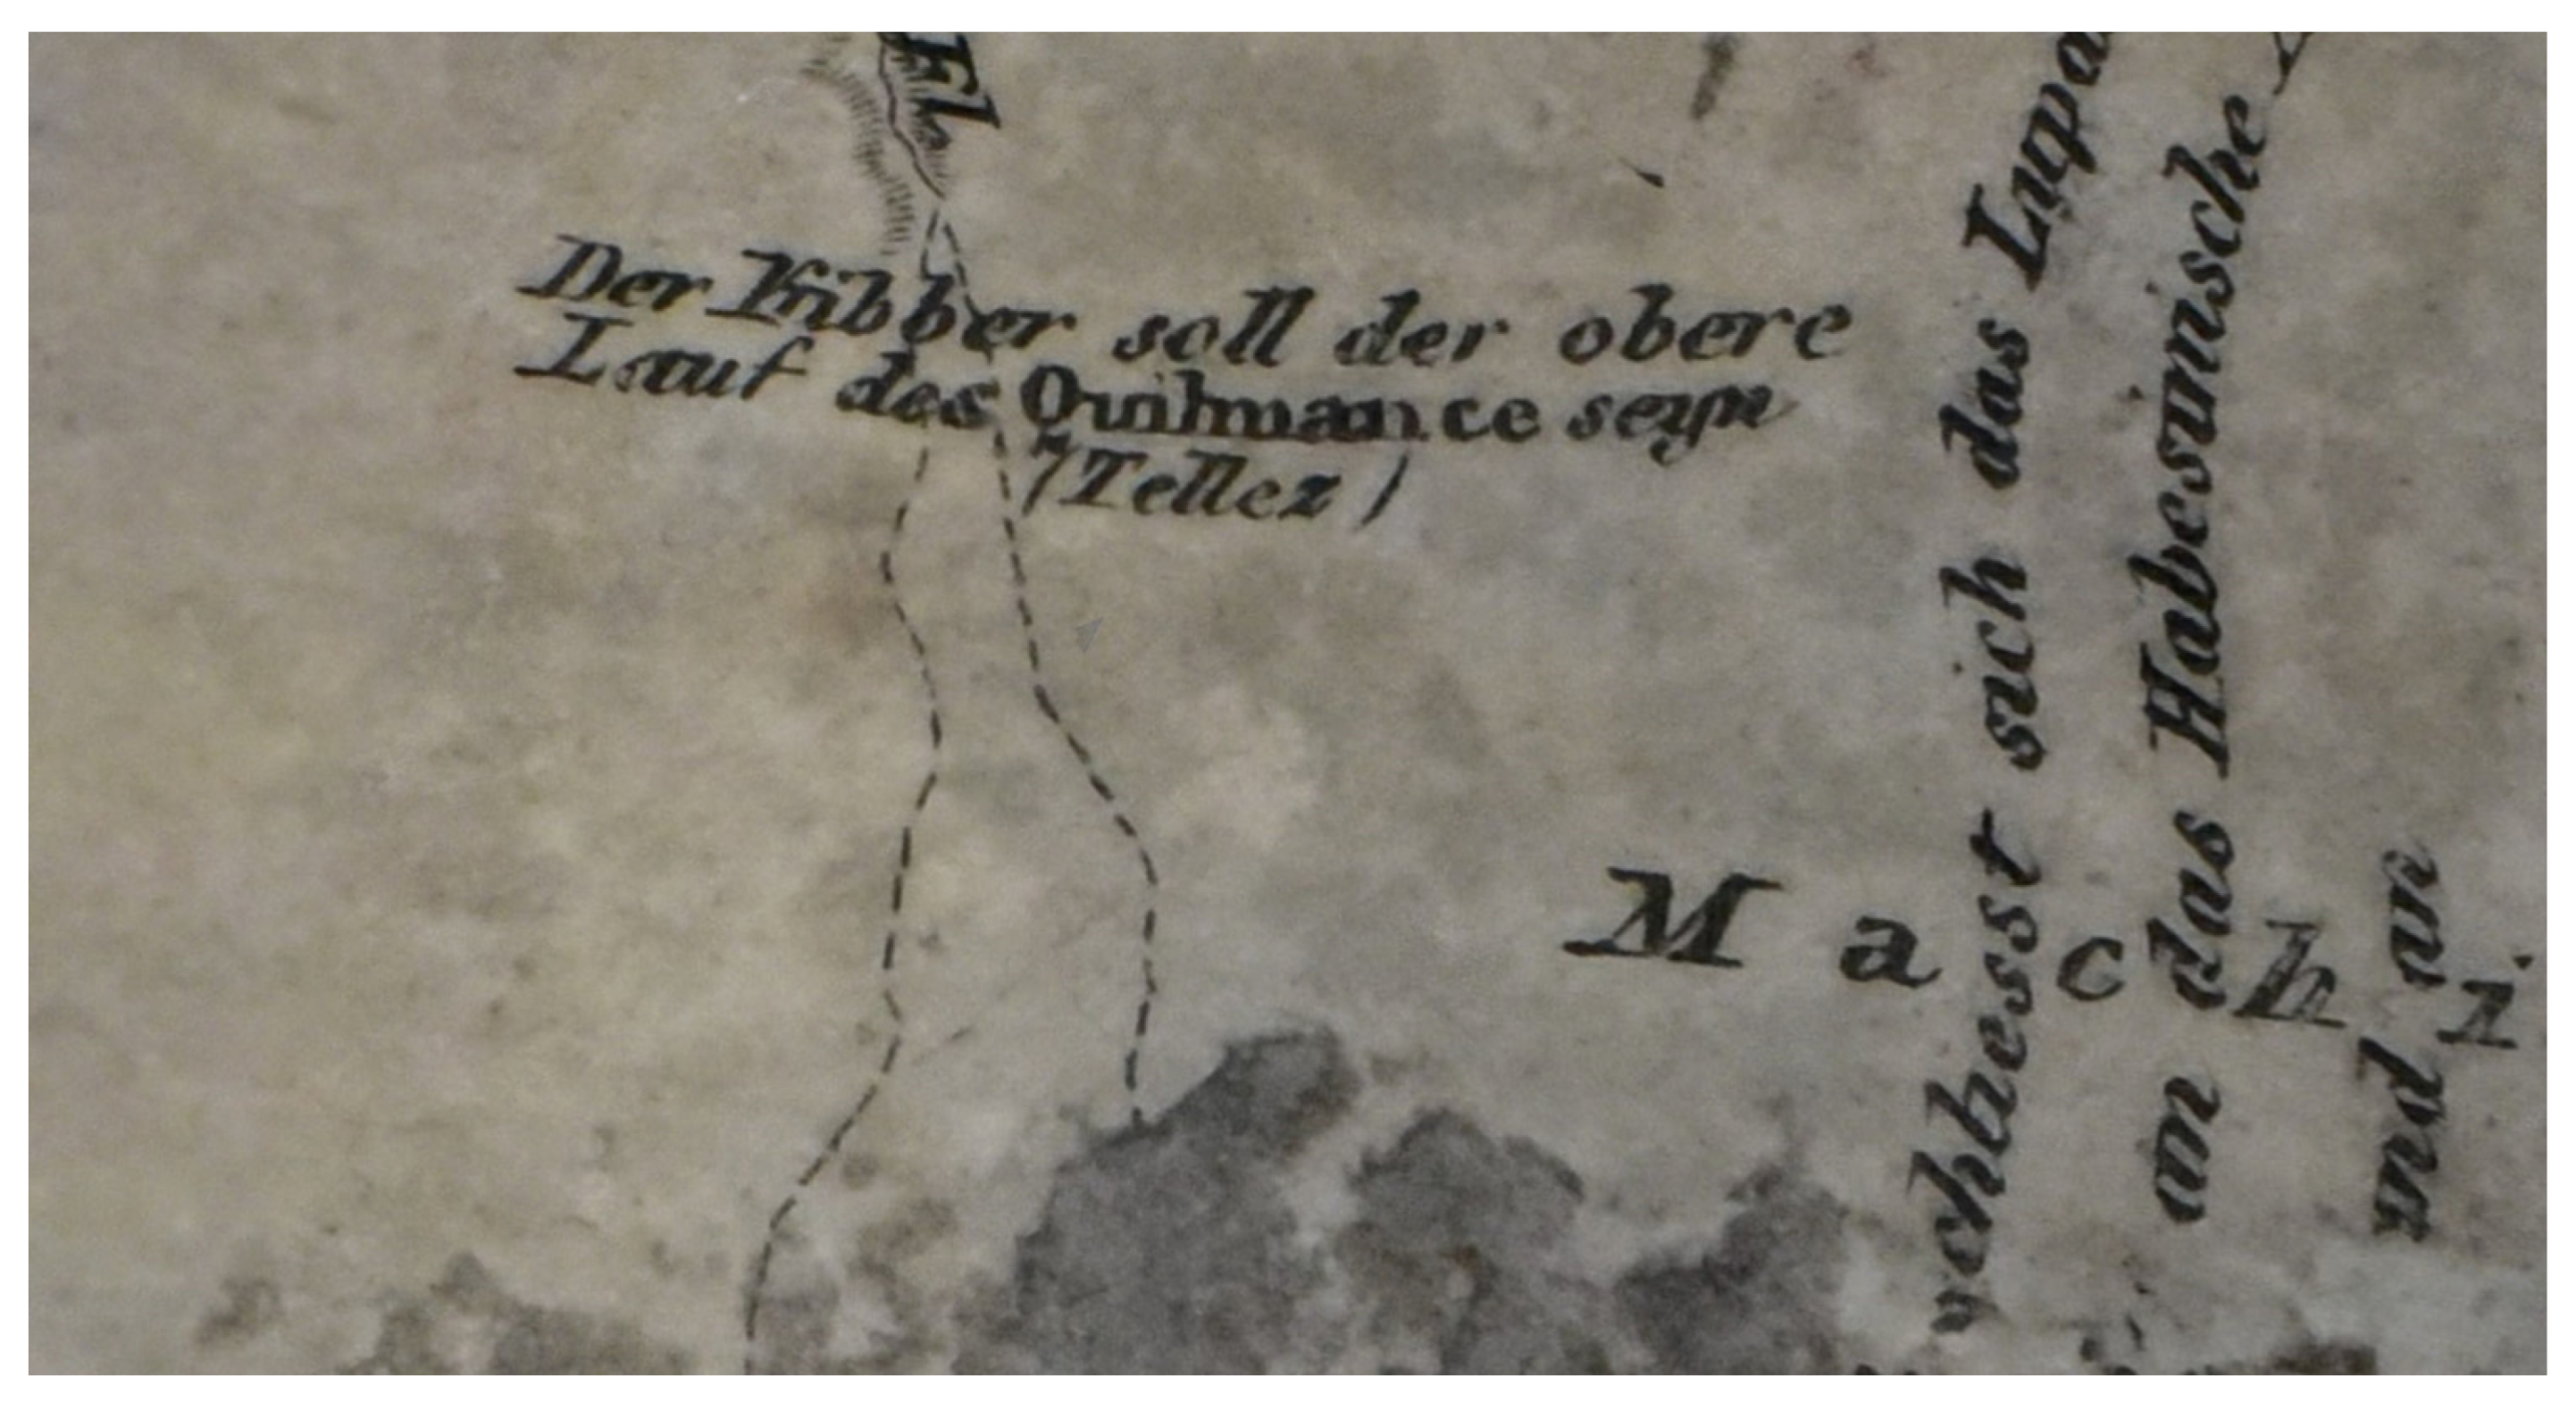
The contemporary content reflects the geopolitical division of the world and the geographical knowledge of the time. The globe contains information about geographical discoveries. For example, the following note appears regarding the Philippines: Die Filippinen wurden im Jahre 1521 von Ferdinand Magellan entdeckt. Er und mehrere seiner Officire wurden von den Eingebonen gohödtet. Sebastian del Cano setzte die eisen ach Ostindien fort, und war der erste der die Welt umsegelte. (Translation: The Philippines were discovered by Ferdinand Magellan in 1521. He and several of his officers were killed by the natives. Sebastian del Cano continued his voyage to the East Indies and was the first to circumnavigate the world.)
India is named as Hindostan. Tibet, Nepal, the Himalayas (Himalaya Gebirge), the eastern Indian coast known as Coromandel, or the island of Sri Lanka (Ceylon) are also shown in the area.
In the east, the description of Kamtschatka is emphasized, and present-day Alaska, which was still part of the Russian empire known there as Russisches America, is seen.
The continents and the countries within them are marked selectively. Nevertheless, the globe map looks cluttered in some areas and on the coasts. The work also contains a detailed description of the countries in the United States of America (Vereinigte Staaten), marked by Roman numerals from I to XXX. Numbers are assigned similarly to the states in Mexico (I.–XIX.) and in Central America (Mittel America, I.–V.). In South America, the Amazon River is marked, as well as the following states: Columbia, Guyana and Brazil.
Australia is only presented as an integrated land body without any further geographic structure, just the older name for the territory, Neu Holland, is included.
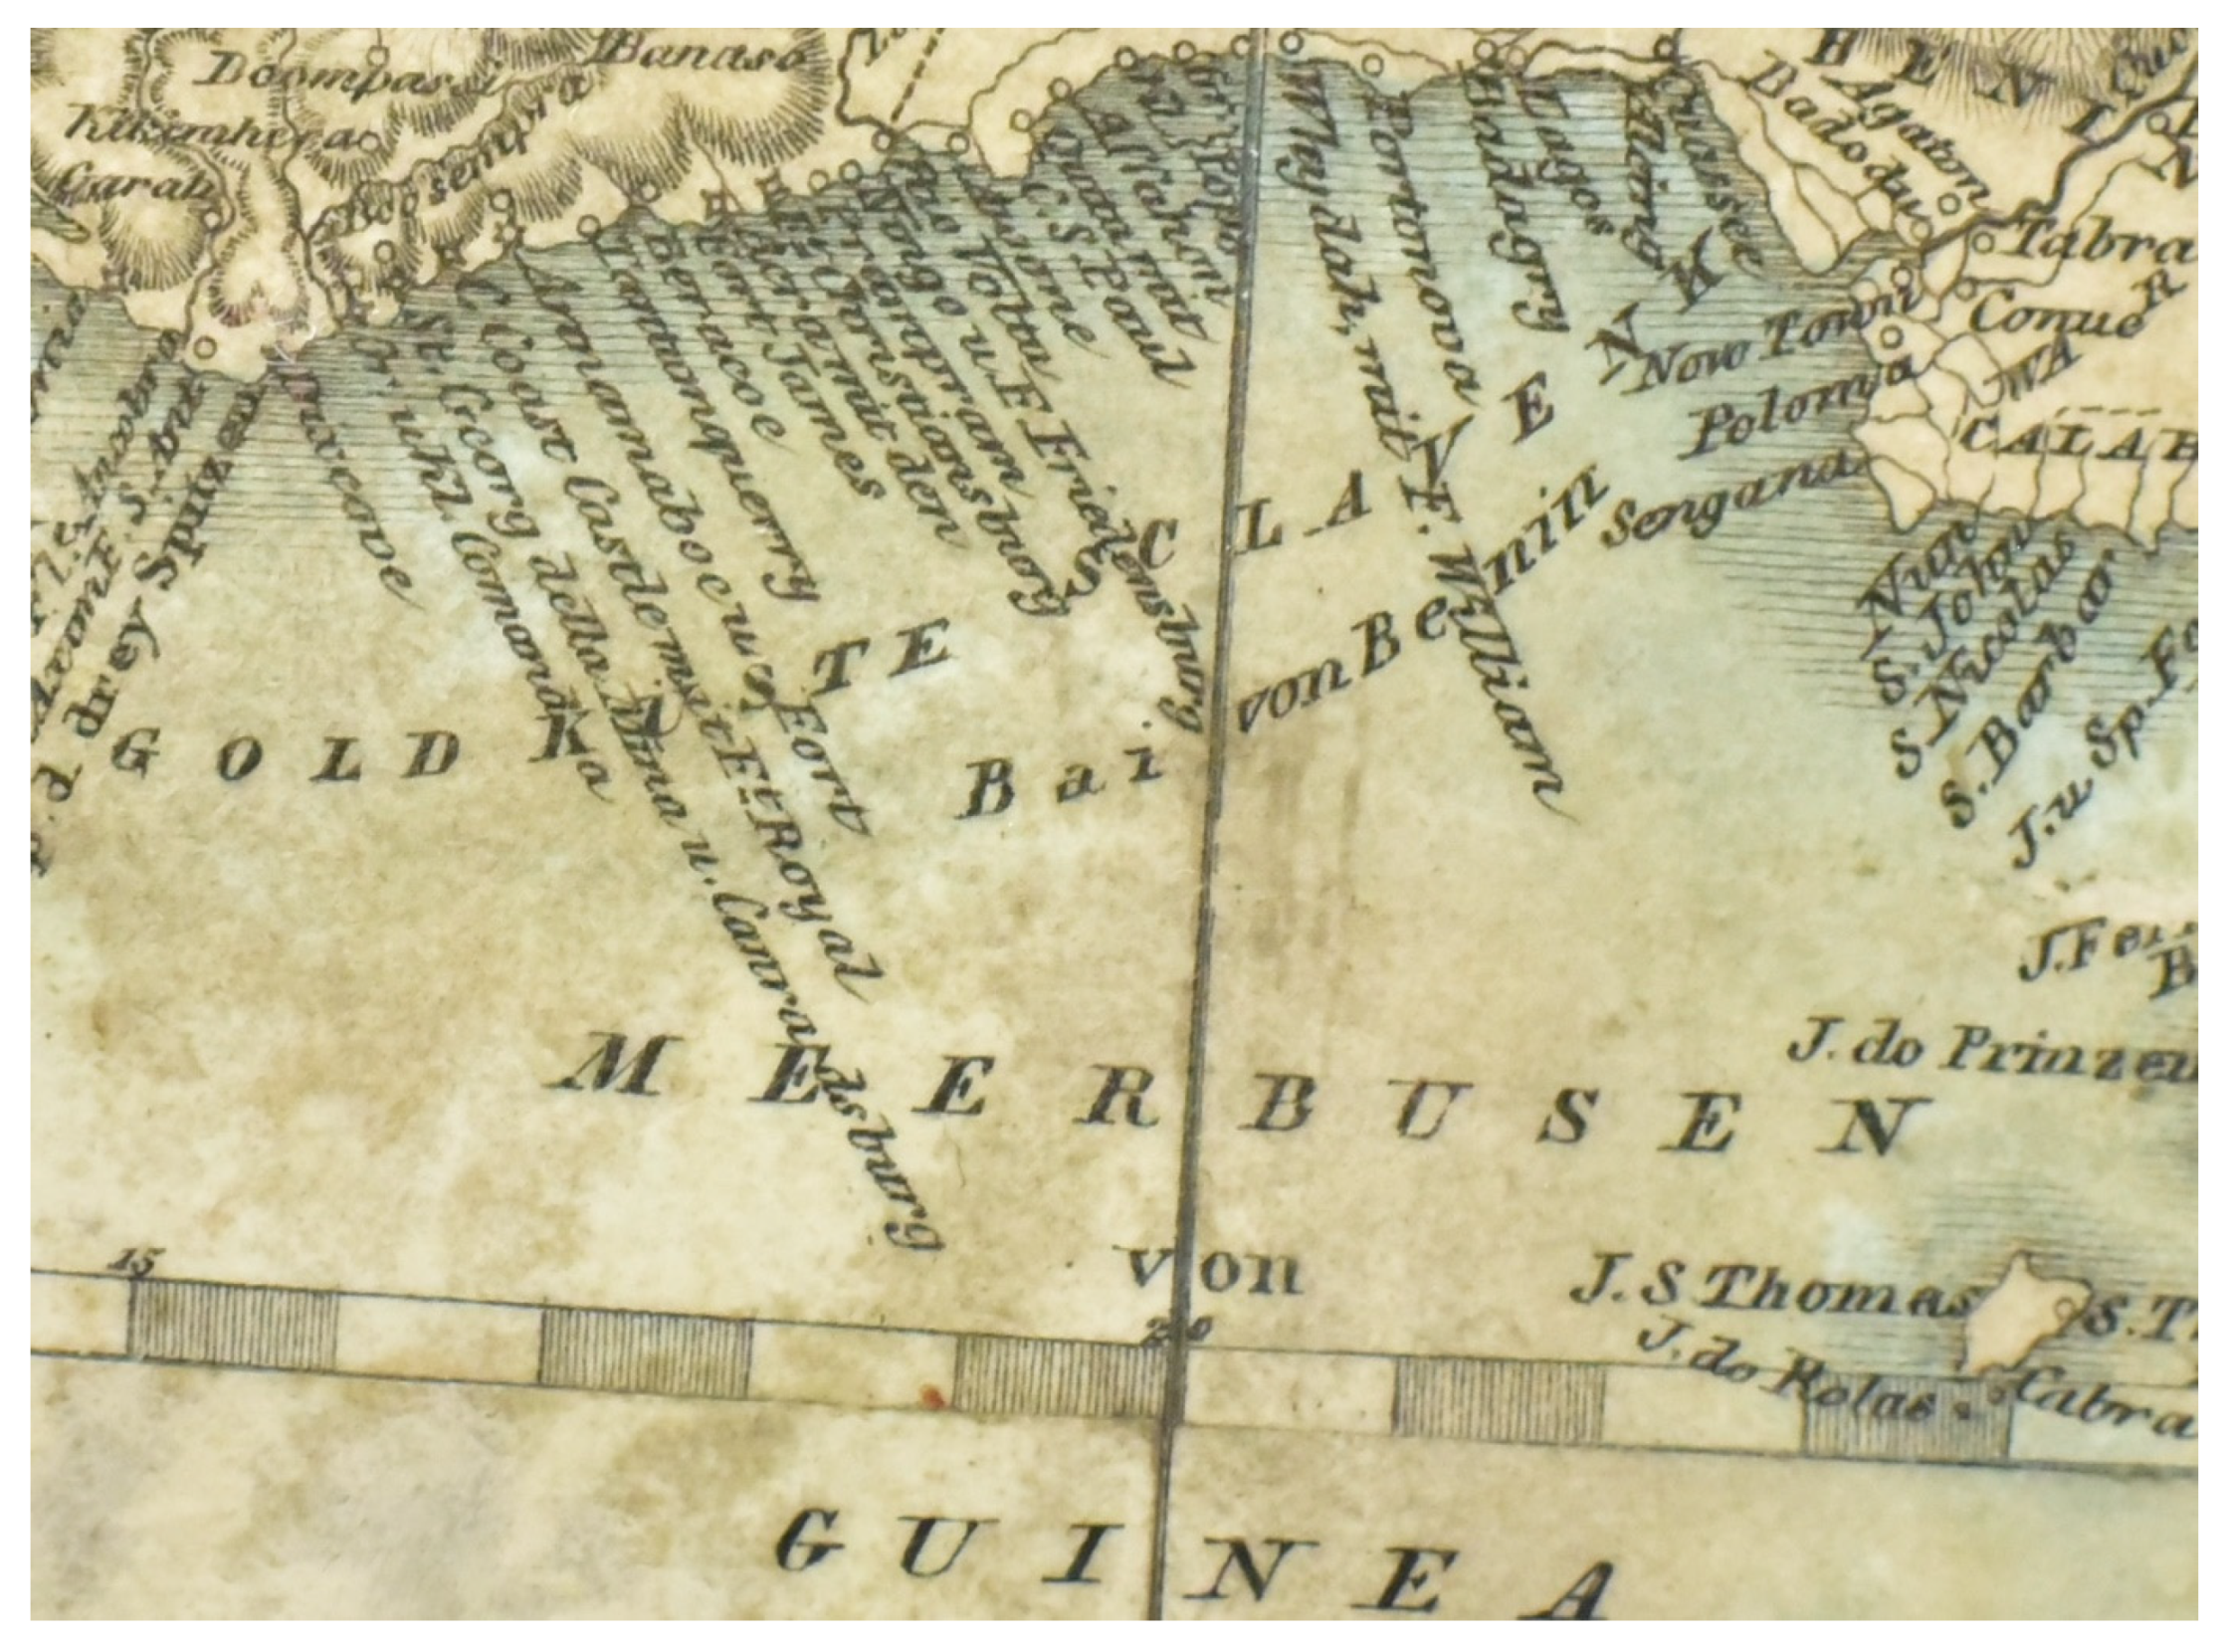
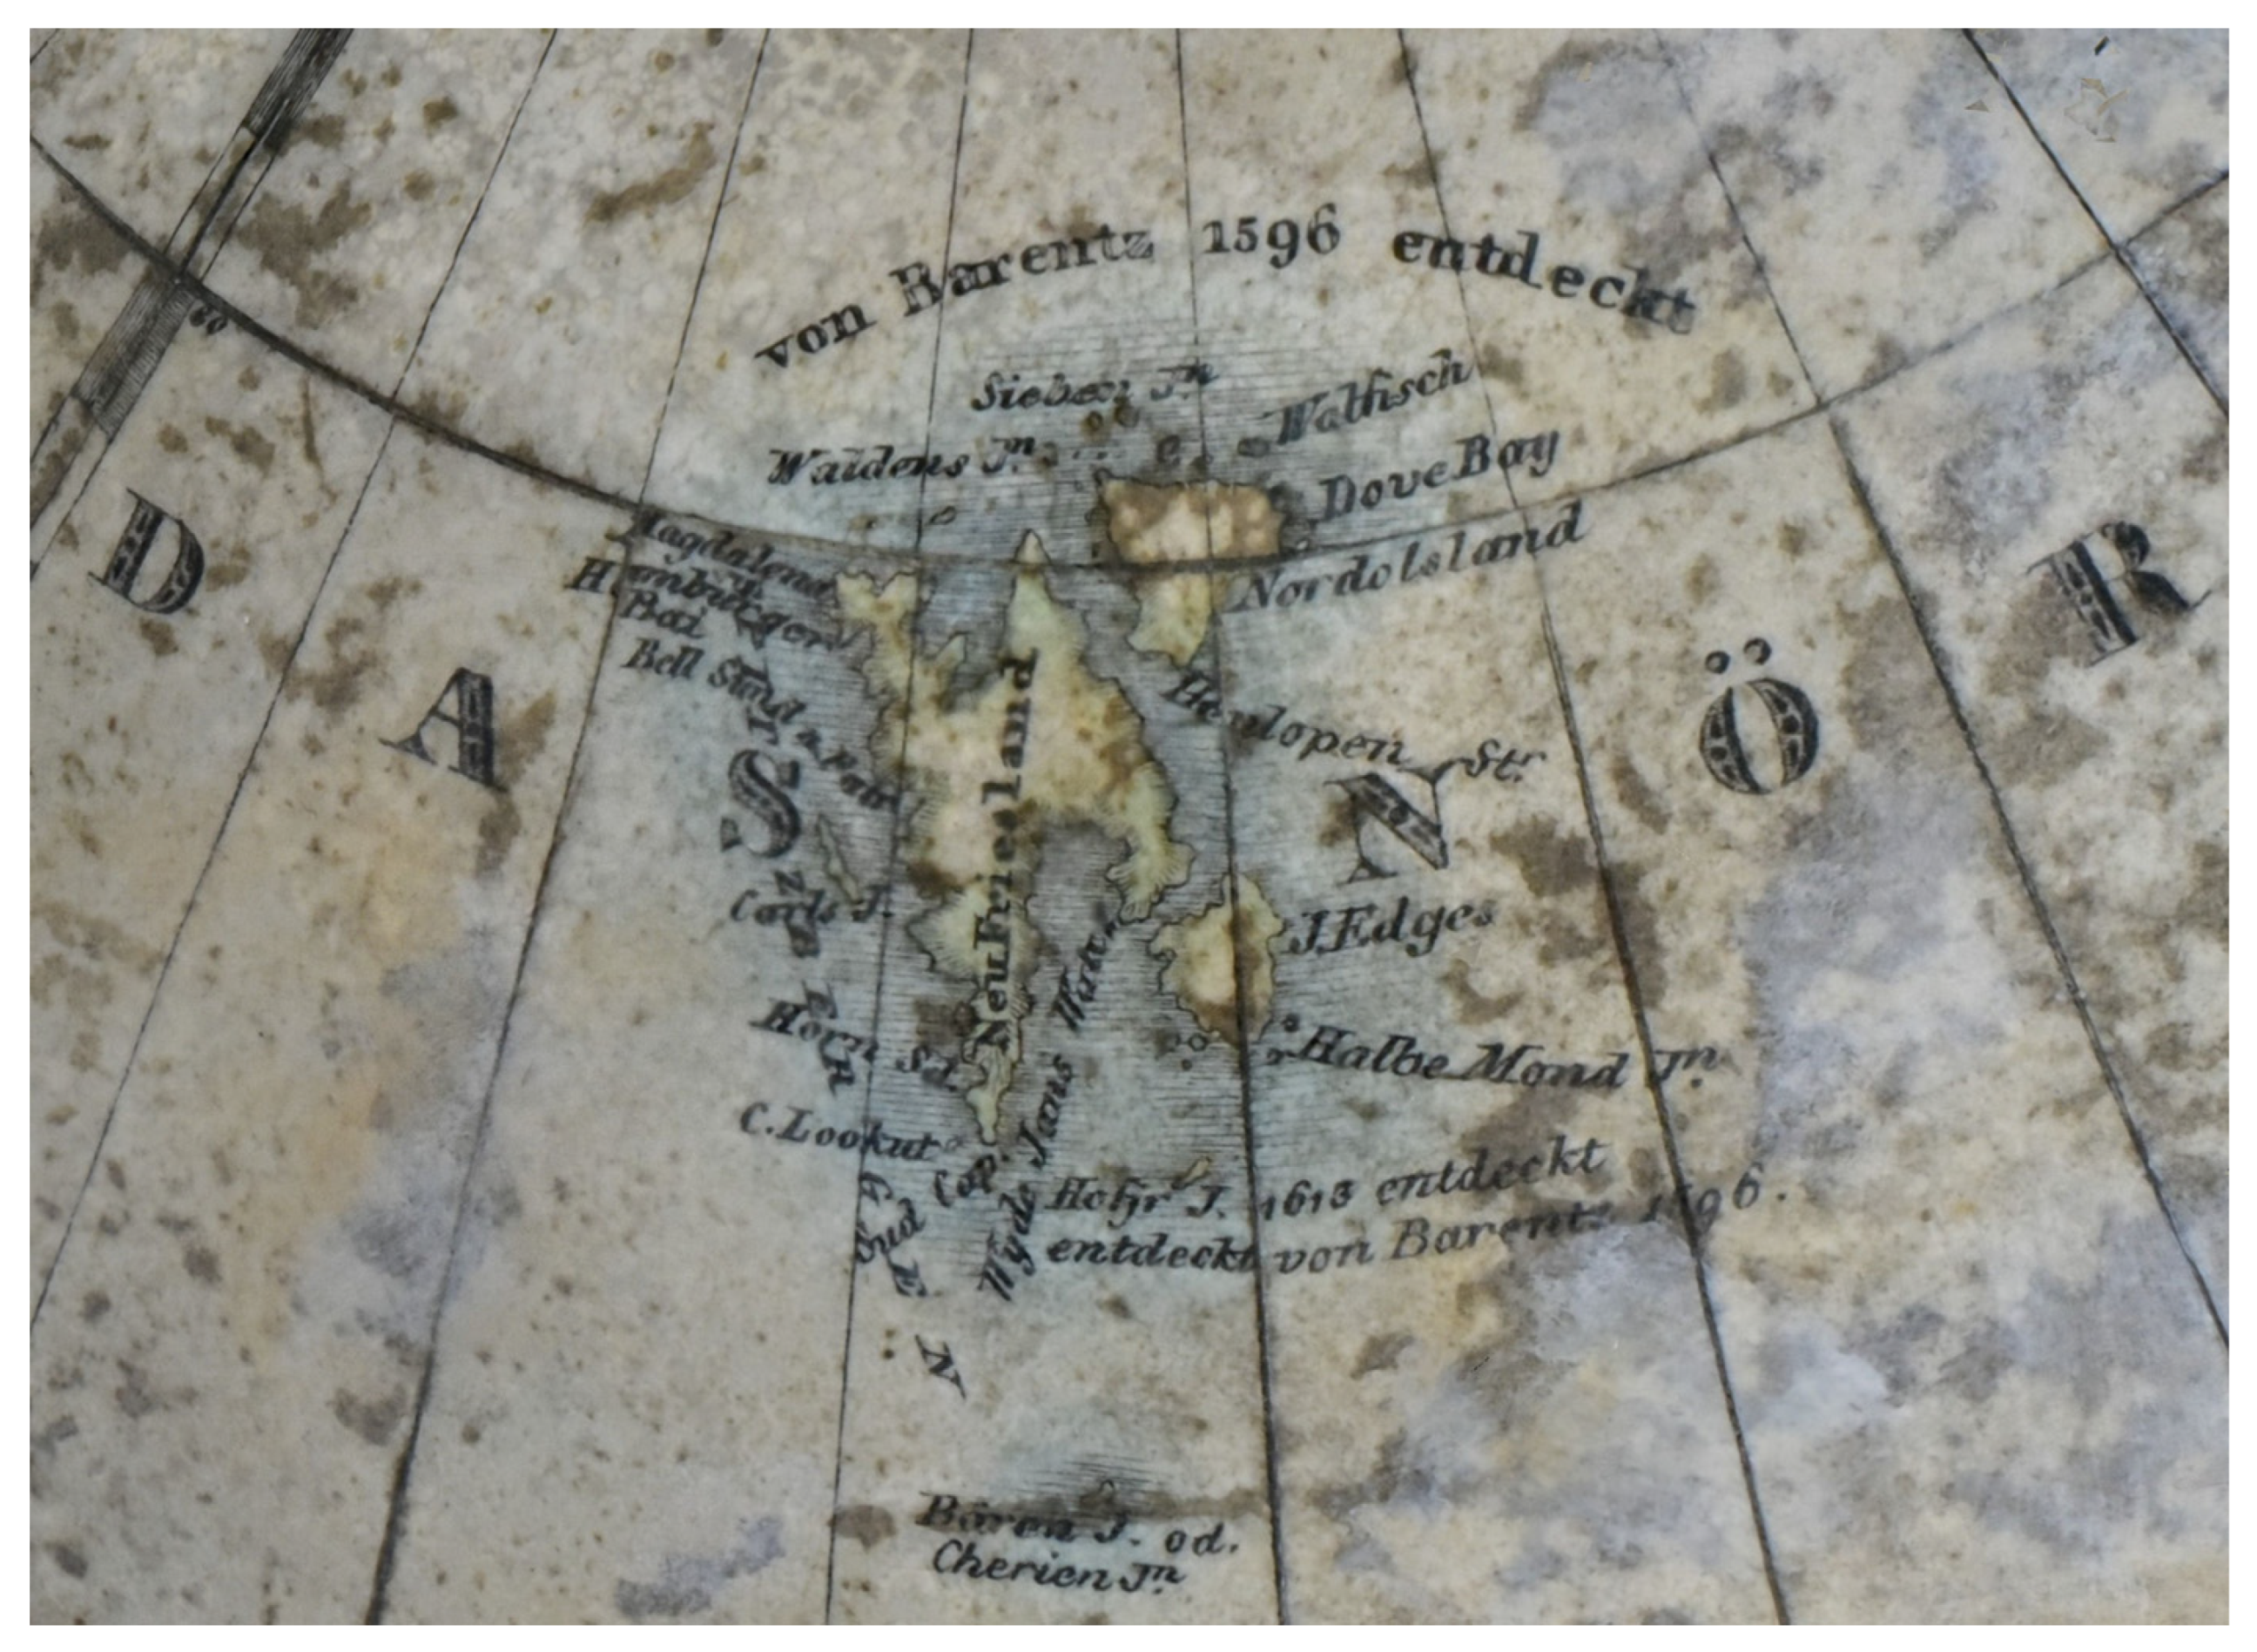
In Africa, the Niger River, Lake Chad (
Der Tschad) is drawn, but the Congo River is not yet described, which is consistent with contemporary knowledge. An infamous slave trading post is shown on the west coast of the African continent (
Gold Küste Sclaven,
Figure 3). The Pacific Ocean is called
Das nordliche Stille Meer.
4. Discussion
Many globes contain very little descriptive data of their own. Therefore, good quality visualizations can play a crucial role in the identification of a particular globe, especially in the case of older works. The virtual rotation and zooming of the globe or the celestial sphere make it easier for the researcher to read and verify the title, author and publisher details, as well as other supplementary texts that can be found on old globes. Such texts contain information about the history of the globe, or the state of geographical and cartographic knowledge at the time of the work’s creation. Researchers can usually discover a lot of details that map collection staff cannot process when creating general metadata.
The digitization of globes is a significant contribution to the creation of scholarly digital editions (SDEs). They are a valuable historical cartographic source for many specialists. The digital globe edition in the web environment provides and integrates three levels of data and information, namely pictorial (globe as an image), factual (globe as a source of information) and secondary (globe metadata).
A globe, seen as an image or object, also represents a map when turned into a two-dimensional image. It is possible to add additional information or make a link to the original globe map image, if available. Globe maps are also often used to reconstruct unavailable old globes. However, this fact needs to be mentioned in the metadata in order not to confuse researchers. Old globes are interesting art objects illustrated with not only map symbols and compass roses, but also with animals, people, sea monsters and large sailing ships. The question remains of how to describe individual images on the globe or how to search for them automatically.
Old globes are not only cultural artifacts, but also a source of much factual information for historians, librarians, geographers, cartographers, philologists, teachers, artists and others. They can be used to examine information related to the environment, ecology or socio-economic phenomena such as land-use development and changes in or reconstruction of river flows or coastline shapes. They also record geographical names as well as cultural, political and economic facts. They are an important source of information on the stage of development for technology and surveying and for cartographic knowledge at the time of the document creation. Last but not least, they are an essential study material for the history of the development of science and scientific instruments. Here, the instruments can be connected to similar ones or to information on the development of science and technology in a given period (for example [
67]).
As a source of factual information, the globe offers specific data, whether provided on a physical, political or celestial map. It shows rivers, ponds (some no longer existent), the shape of the coastline, which was also subject to changes, or sea currents. There are mountains and mountain ranges with the information, names and elevations of the time. There are images of woodlands, often depicted with very specific, unified features. There are historical toponyms. Philologists will appreciate the possibility of studying the development of the national geographical nomenclature over time. The extent to which descriptions and comparisons of historical toponyms on globes should be carried out remains a matter for discussion, and how to directly link the search for unified toponyms with the digital globe is also open for debate.
The map legend explains to the researcher the size and status of settlements, the economy and the political context. It may also contain statistical information. It should be transcribed in detail in all its original language versions and ideally also translated into the current language. All this can serve to annotate the globe in detail.
Celestial globes are important for the history of astronomy. Astronomical globes depict ancient constellations, allegories, ideas about the size of stars and so on [
68]. For celestial globes, it will be necessary to address the issue of the unification of nomenclature so as to avoid any confusion of terms. The history of globes is also connected with decorations in the ceremonial halls of aristocratic mansions, in monastic libraries as a symbol of education, etc. Historians or archivists can research the history of ownership, or the actual paths taken by these art objects and the reasons behind this movement. The projected globes could theoretically be linked to information on original mansions, castles, chateaus or presentation libraries, with their history and interiors.
Globes have been used as teaching aids since the 19th century and were usually supplemented with instructions for use and examples for teaching geography. They are valuable for research into the history of the didactics of geography and mathematical cartography. They acquaint researchers with the state of knowledge in the field and the quality of teaching at various types of schools where these aids were compulsorily introduced. In this connection, it is also possible to examine how these aids are promoted by the ministries of education, and how well the schools and school offices are equipped. Comparisons can also be made within different regions. In this case, the digital globes could be supplemented with full texts of scanned manuals, textbooks, ministerial decrees or links to archival material, all in compliance with copyright and proprietary rights. Examples of period school offices can also shed light on the history of the use of globes.
Globes provide information on cartographers, engravers, translators, publishers and makers. Cartographers who produced globe maps were usually involved in the production of old maps, and this production complemented their wider activity in publishing maps, atlases and globes. This information offers a wide range of options for making links to digitized biographical dictionaries, bibliographies of authors, information about their lives, and their images.
Additional factual information can be obtained in the fields of book culture, the history of publishing houses, their production and the production of school geographical aids in the region concerned. Of equal interest is the development of trades, the origins of a company and the beginning of and the reason behind the production or sale of a globe. This information retrospectively helps to identify the missing data on the date of the publication of the document. The researcher can also examine the printing techniques used to make the globe map. If in some cases the printing plates have survived, then valuable hands-on experiments can be made with reprints of the work. Even without an imprint, it is possible to reconstruct no longer existing globes that have survived only on printing plates and to use them as a source of new information. This is why printing plates and stones also become items of map collections. Here, it is quite appropriate to make a link to dictionaries of printers, publishers and companies involved in the publication of globes or teaching aids, as the case may be.
Information about the manufactories producing globes is essential for the history of the industry. Of interest to humanities studies is the impact of the war on small manufacturers and education systems, and the interventions of totalitarian regimes and censorship in the production and creation of these teaching aids. Some patented inventions, such as composing globes, are an interesting part of the history of patents [
69].
Furthermore, it is possible to study the development of geographical instruments in their entirety; that is, globes, both terrestrial and celestial, planetariums, armillary spheres and sololunaria. The question is how to digitize and present these complex devices. The digitized objects can be used to create further reconstructions of possible usage, not only to enable rotating and zooming in on them, for example [
70].
Like the bibliographic description of an old map, the metadata description of a globe should be improved from the simplest to the most complex form of description. Metadata not only enable subsequent retrieval by the user, but in the event of damage or even loss, they can provide very accurate information that can be used to reconstruct or trace the given collection item.
Globes are usually described individually, but there are cases where they are described as a set or pair. Indeed, old globes were usually made in pairs, that is, as terrestrial and celestial globes [
71]. Therefore, it is advisable to try to track down information about the second, paired globe in information sources and mention it at least in the metadata description, if there is no online availability of the paired globe. According to the available information, J. Jüttner did not make a star globe as the second in the pair. Therefore, this matter need not be given further attention.
In addition to basic descriptive information about the globe, such as the title, subtitle, author, secondary authors, scale (star globes do not have scales), place, publisher and the year of publication, the physical description fields (diameter, circumference, base) are much richer for globes than for conventional maps. This is due to the different materials the globes are made of. The accuracy and quality of metadata are very important, especially in the physical description, because the researcher of a digitized product does not have access to the original physical product. Important is the exact size, and the globe circumference from which both the diameter and the scale are derived.
From the 15th to the early 19th century, intaglio copperplate engraving techniques were used in cartographic production. These techniques involve making indents or incisions into a metal plate surface (most often copper) which hold the ink when ink is applied to handmade paper. The quality of the printing plate determined the quality and even distribution of the printed ink. The quality of the print was also influenced by the intensity of the paper wetting, the ink density and smear, as well as the smooth passing of the print through the intaglio press. The scale and dimensions of the original globe map may therefore vary from source to source, as may the dimensions of the gores, depending on the time and method of obtaining the relevant data and the shrinkage of the handmade paper for a particular map. Similarly, the plaster base, the hemispheres, were handmade, and this could also cause differences in the diameter of the base sphere. Therefore, it will be very useful in the future to compare similar specimens of the same globe. This could shed light on what variations can occur in handmade globes. Further interventions by restorers, especially wet process cleaning, can lead to changes in the paper or in individual gore joints. It is therefore a good idea to take these into account.
As far as further processing is concerned, the globe gores were cut out by hand, so they could also have been different sizes before gluing. They were glued on a plaster or paper base material by hand. A high-quality globe product was characterized by the precise connection of the individual globe gores in the map image as well as in the description of geographical names. In inaccurate products, the globe gores were glued sloppily or did not connect in some parts. The question is whether to make (or were made) corrections of these manufacturing errors during digitization, when the segments can be accurately connected.
Information on the size of the base, and its height below the globe, should also be accurate. It is equally important to know whether the globe is furnished with a meridian semicircle or circle, how it is divided into gores and whether it has an hour circle, compass or calendarium. When digitizing, the meridian circle as well as the hour circle are often removed from the sphere or digitally eliminated. It is also appropriate to ask how to incorporate these parts into the digital presentation of the globe. Whether to settle for a photograph, a description or whether to try to combine them into one object remains an issue.
If possible, the map legend should be detailed in the digitized object’s metadata. We can also expand and add information to the note fields. These include characteristic features of decoration, such as portraits, scenes, allegories, parerga and cartouches. It is possible to add literature references that cite the source of studies on the globe or the existence of the second globe to the pair. To describe in detail the method of manufacturing and the material, you may pay detailed attention to the content and write down interesting toponyms or factual information that is described on the globe. The note fields also include information on restoration efforts, repairs and changes to the globe in terms of connections of paper gores, color, material or replica stands. It is also a good idea to include the history of ownership and provenance of the globe, if known. Additional notes should be made regarding language, edition, version, reprint, etc. A lot of other information can be drawn from supplementary documents such as the cover, information manuals, etc. A note on a defective specimen informs about the physical condition of the globe specimen, especially its damage.
The user should be knowledgeable of what type of globe they have access to. The objects are classified by: displayed object (terrestrial globes, planet globes, star globes), purpose (school, decorative, etc.), content (geographic and thematic), method of execution (smooth, embossed, luminous, duplex globes), induction globes (teaching aid without map content), free globes (have no axis and sit in a bowl), pneumatic (inflatable), processing technology (glued, injection-molded) or scale. So far, only celestial, terrestrial and embossed globes have been used for digitization purposes.
It is essential to always describe changes in the document history caused by restoration, preferably with pictorial documentation, original damage, various crooked paper gluing, inaccurate connections of the geographical names descriptions that have been corrected, different sizes or changes in the printing paper or other printing and manufacturing errors.
The physical condition or unique nature of a work may be crucial factors to be considered, as it may not be feasible to regularly lend out such works to the public due to security reasons or other restrictions imposed by restorers.
Many map collections are unable to describe their holdings for financial reasons. This is especially true about large archival or museum collections. Therefore, attempts have been made to digitize and display the globes owned by such institutions with minimum metadata, as has been performed, for example, in the Virtual Map Collection [
19]. Although metadata are clearly highly beneficial for all digital representations as described above, in these special cases, even displaying a globe on the Internet with minimum descriptive metadata seems to be highly beneficial as well.
By virtue of such accessibility, the work has been recorded at a certain point of time, and thus documented. According to the depth of their interest and knowledge, the researchers can verify and complete the description of the work. If the work was to be lost or damaged in the future, there is a real chance of making a copy or at least creating a detailed description of it. Then, this can make it much easier for the police or the original owner to locate the work.
The method of digitization and visualization described above was tested on the antique Jüttner globe. There are other specimens of this globe in the Czech Republic. In the future, it would therefore be useful to find out about their physical condition and compare them physically. Furthermore, an attempt should be made to digitally document and compare them.
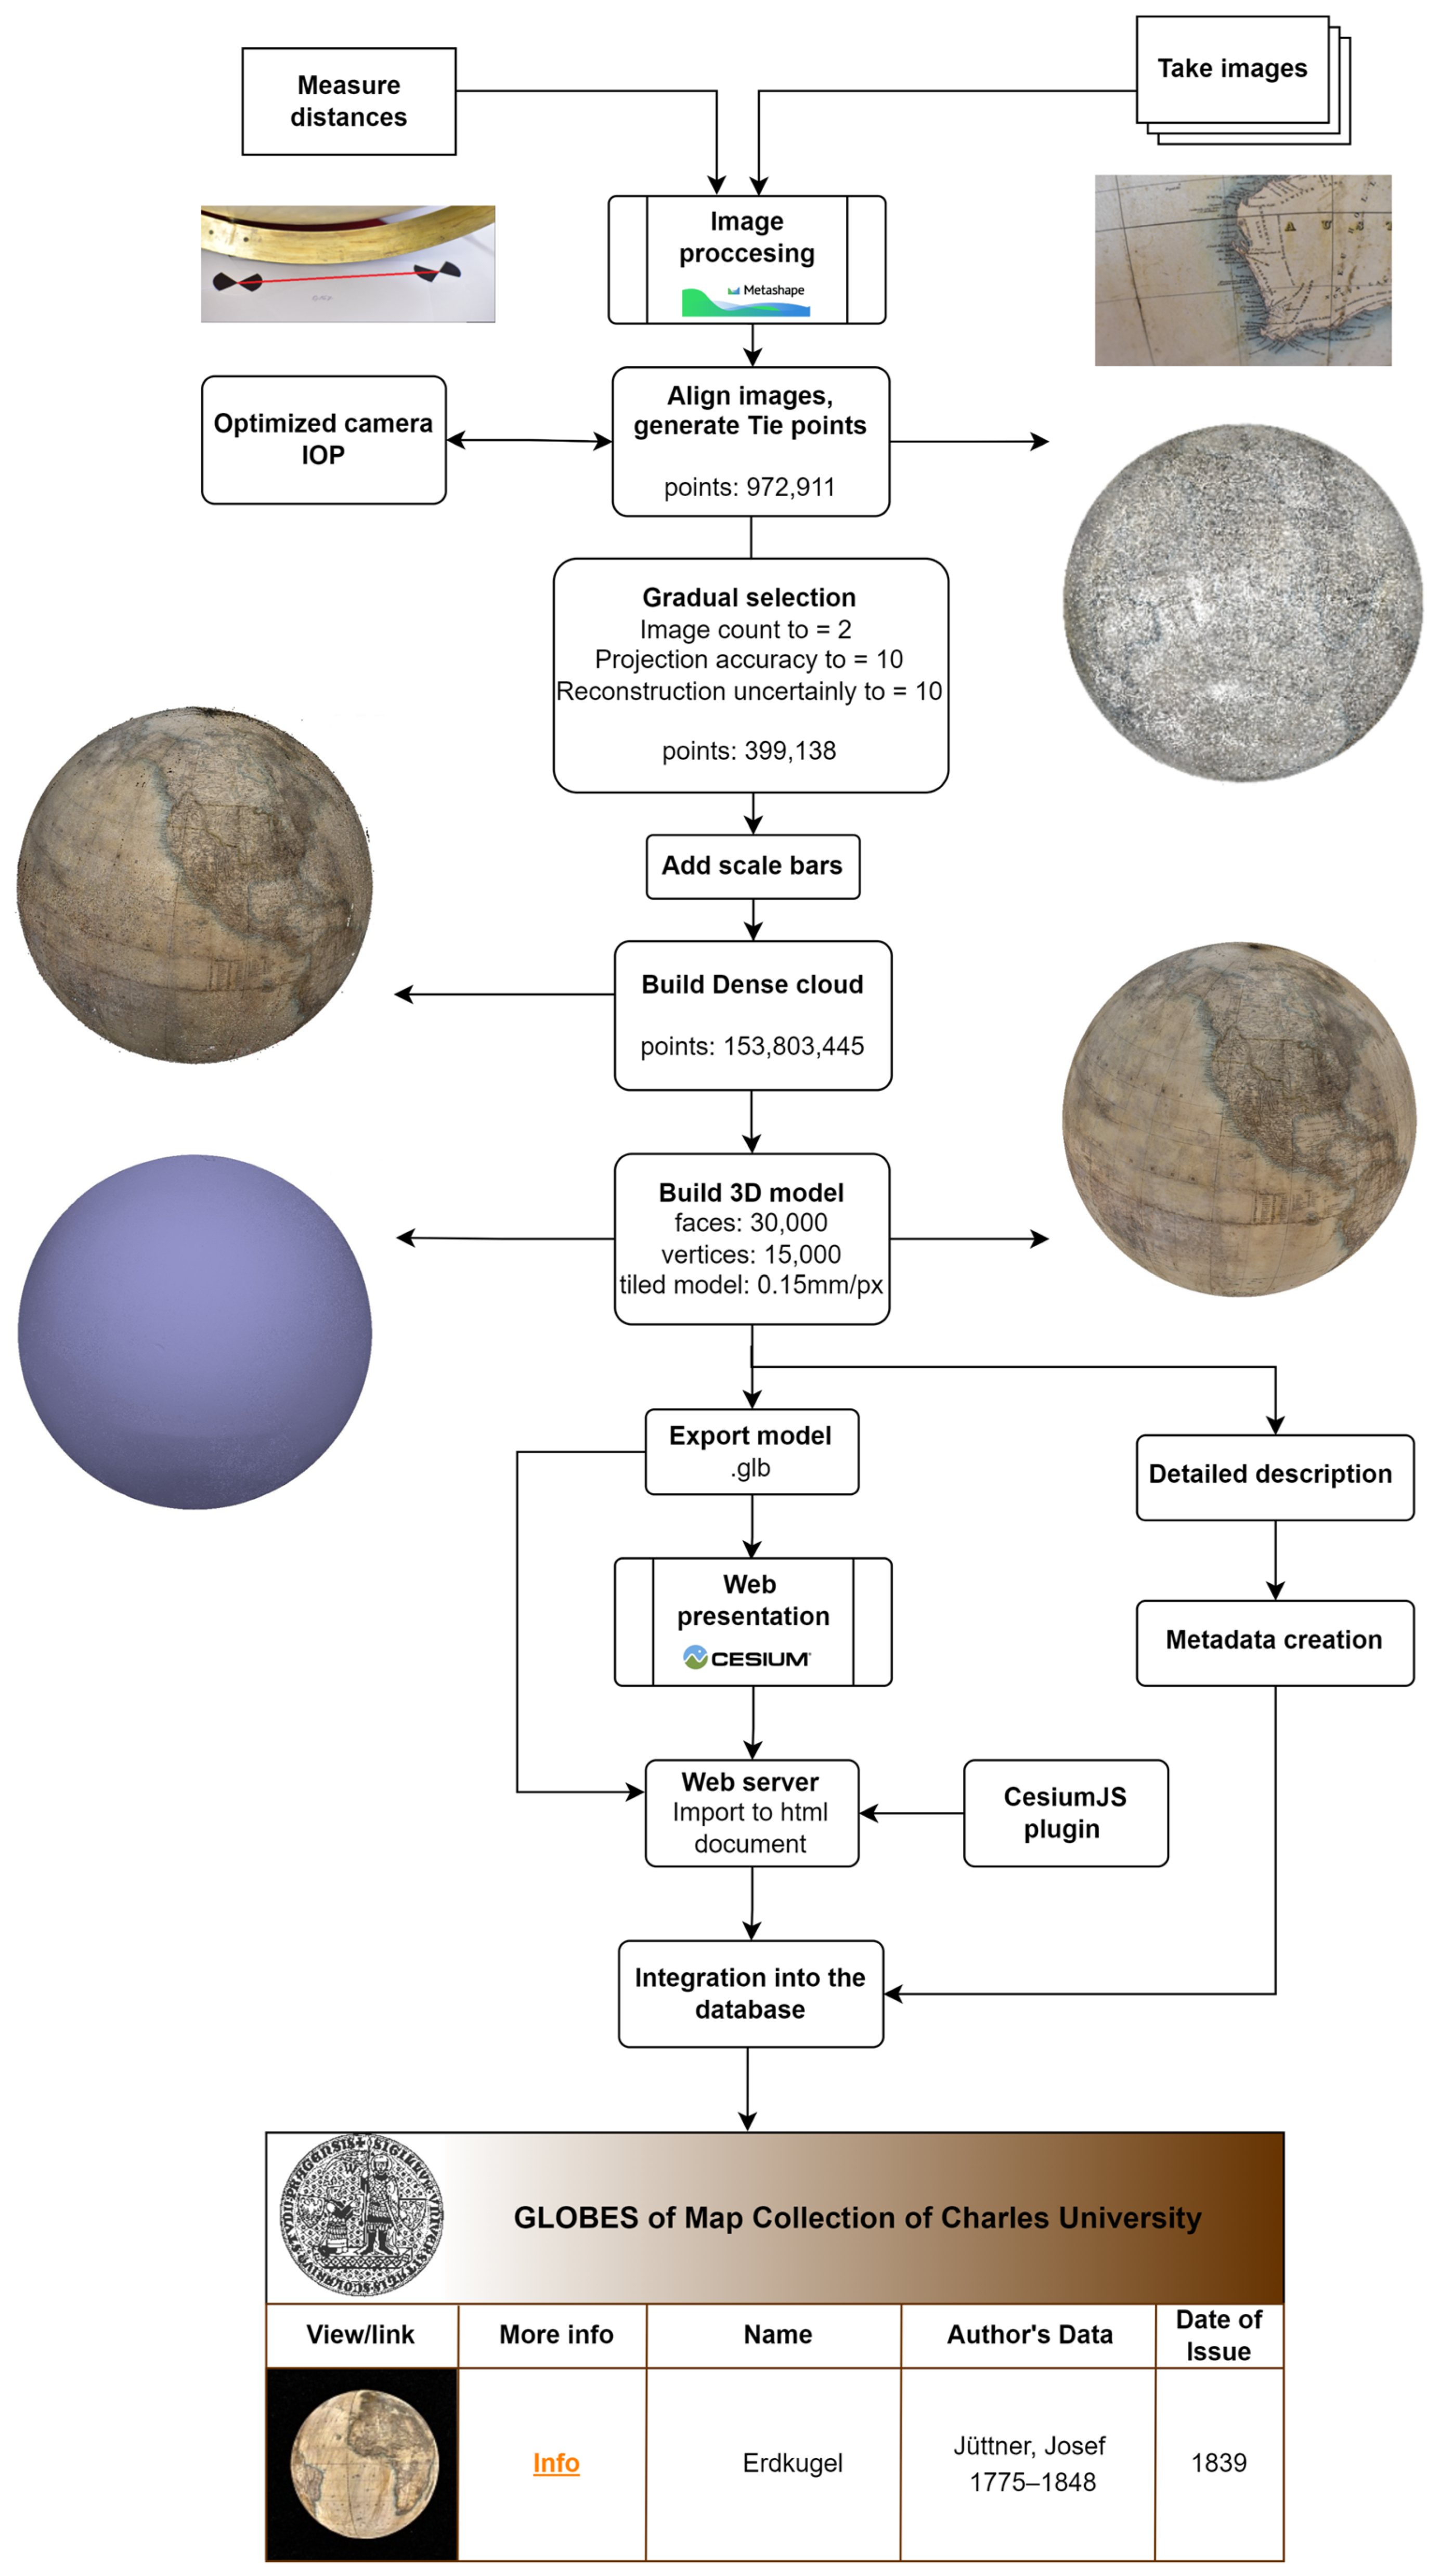
The suitability of SfM-MVS photogrammetry for the digitization and visualization of old globes was demonstrated. The method is simple and there is no need for expensive specialized equipment or software such as laser scanners or expensive metric cameras.
The globes can be digitized on site and do not have to be transported to a specially designed facility. The method is contactless, posing no threat of damage to rare old globes. Photographing can be performed with digital cameras now commonly available and boasting sufficient resolution to capture even the smallest details on the surface. Any number of images can be recorded and processed. Image acquisition is relatively quick compared to the computer conversion of data into a 3D model.
The relatively high processing power required of the computer used for processing the images appears to be a disadvantage of this method. The method cannot be applied in a universal way with the same setup and implementation. It always depends on the size of the object to be digitized, the possibility of handling the object and the site of the imaging. The lighting of the photographed scene was a serious problem. In the case of smaller globes, the use of a diffusion tent to improve the properties of the light can be useful. This is one of the reasons why all images had to undergo additional editing. The quality of the final textured model depends on the quality of the images. The quality of the camera used is a closely related factor. A significant problem with cheaper cameras is lens distortion, which affects the geometric accuracy of the model. Every camera must be calibrated before use.
The digital 3D model of the Jüttner’s globe was made available on the web using the Cesium JavaScript library. The advantage of this solution is the possibility to alter the source code and modify the visualization parameters of the globe. The solution makes full use of web technologies, and unlike purely software-based solutions, it does not require any software installation, only a web browser. Another advantage is the easy implementation of the model of a web browser. A common disadvantage of the internet presentations discussed here is the user’s dependence on an internet connection.
The problem with making this globe available online was the considerable size of the resulting 14 MB glb format model. This resulted in the lengthy loading time of the model. This problem could have been eliminated by using image pyramids, which would have increased the speed of image data processing.
The tests performed showed the effect of using different web browsers on the speed of loading the 3D model and the entire website. They showed how quickly users can view content and interact. The resulting values are dependent on the speed of the internet connection and the performance of the PC, and are therefore not absolute. However, the speed of different browsers under the same conditions can be compared with each other. From the point of view of loading the model itself (Domcontentloaded and Load), Firefox emerged as the fastest browser. In terms of loading the entire website, the test identified MS Edge (1.000 s) and Google Chrome (1.057 s) as the fastest browsers.
When making globes available on the Internet, it is always important to respect the copyright and property rights associated with the use of the data in accordance with the law and licensing terms. However, old globes, published before 1850, are not affected by copyright restrictions.


