


Filling in the Spaces: Compactifying Cities towards Accessibility and Active Transport
 , , ,
, , ,
Abstract
:1. Introduction
2. Materials and Methods
2.1. Indicator Motivation
2.1.1. Accessibility
2.1.2. Active Modal Share
2.1.3. Transport Energy Consumption
2.1.4. The 15-Minute City
2.2. GIS Implementation
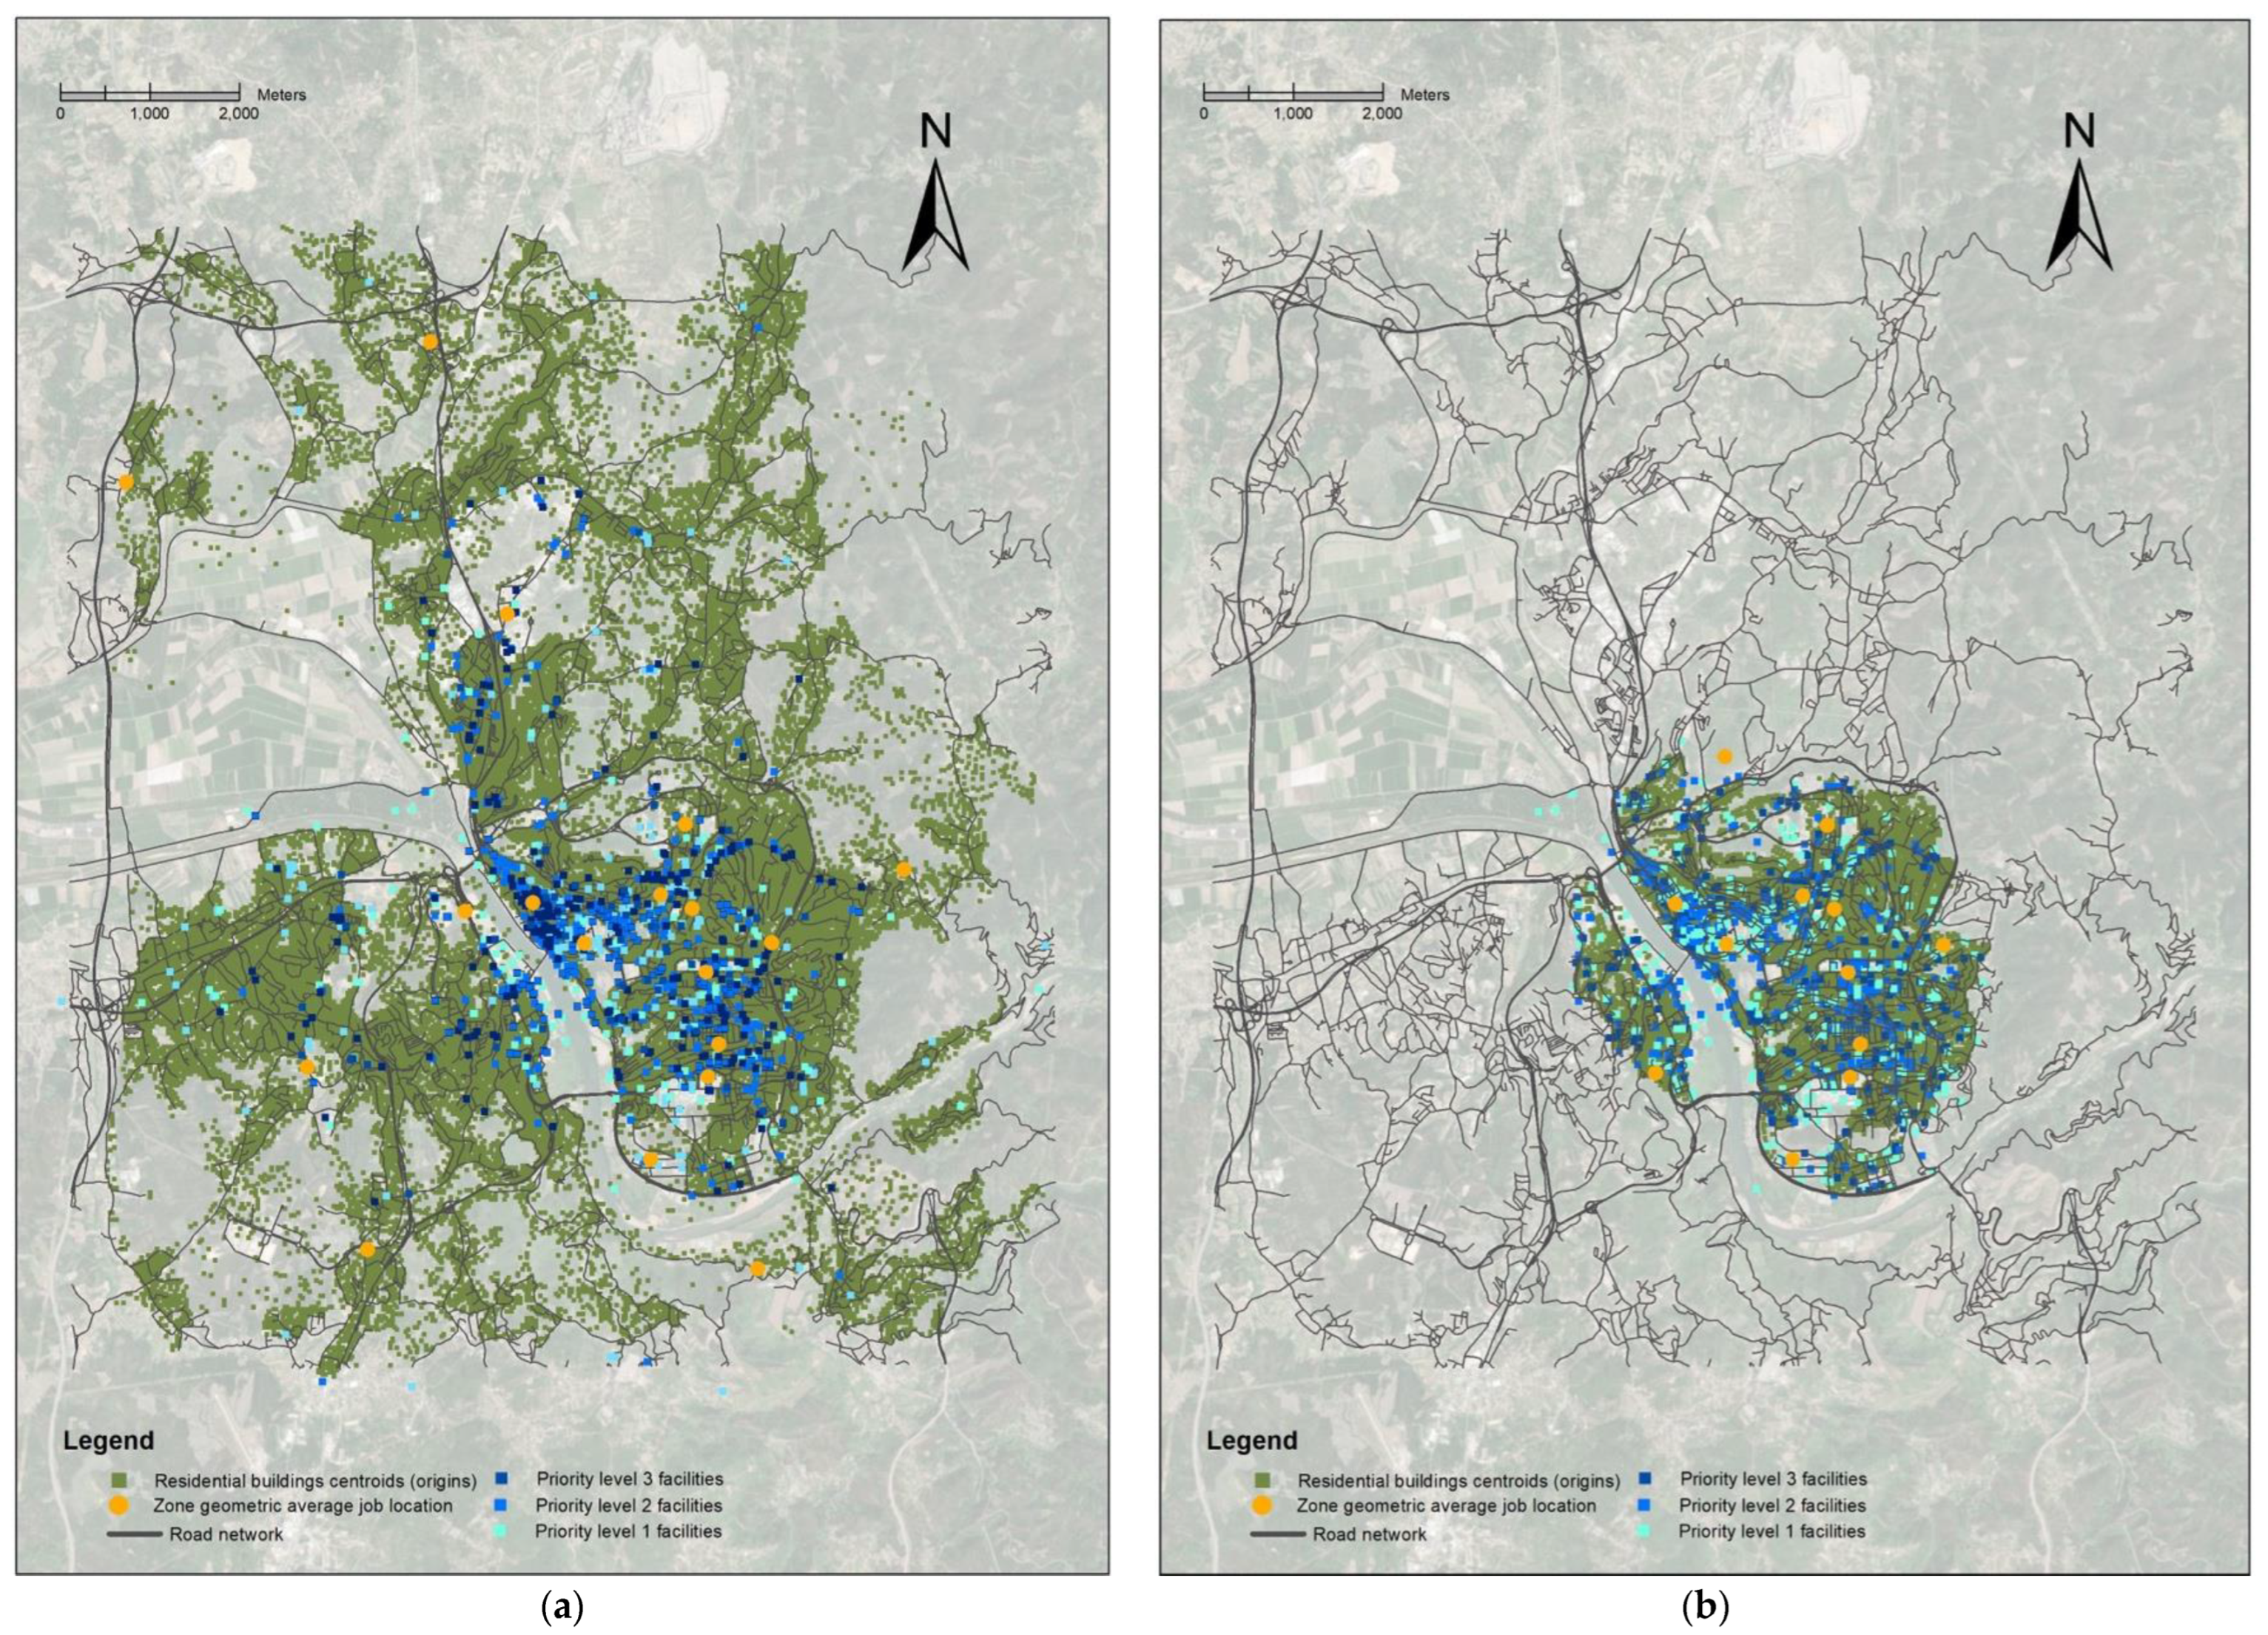
- An urban area was selected for study. Three datasets are collected and curated into a GIS environment: origins (O), destinations (D), and road network. Origins represent demand (for trips) and are the centroids of buildings (endowed with inhabitant number information). Destinations represent supply and are urban facilities and centroids of job zones (see Section 2.4.1. for details on job zones). The road network connects origins to destinations. Origins and destinations are point feature classes, and the road network is a polyline feature class;
- In a copy of the datasets, new buildings and facilities are positioned in vacant urban spaces, job zones are remade, and connecting roads are drawn. The buildings house population from the outskirts and are endowed with inhabitant information;
- For every origin of each layout, network distances are evaluated in GIS to (a) the nearest urban facilities of each type and (b) the centroid of each job zone;
- Four transport modes are considered: walking, cycling, private motorised transportation, and public transport. For each OD pair, trip probabilities for all those modes are obtained;
- Indicator values for each origin are then calculated for both the real and the compact layouts based on OD distances and trip probabilities;
- From the indicator values, statistical measures and maps are derived for the two layouts.
- The methodology considers only accessibility-related trips, which constitute most trips in an urban environment and can be modelled in GIS as one-way or round trips to predefined destinations, subject to supply attractiveness and demand intensity, two attributes which need be considered in accessibility [109,110];
- If the methodology is applied to a very large city, computational complexity can be reduced by defining origins as centroids of a square mesh over the study area, with associated inhabitant number given by the intersection of building centroids with mesh polygons;
- Urban facility types and respective destination attractiveness are here represented by weights as given in Table 1 below. An empirical 1–2–3 Likert scale for weights was used in the research, based on trip frequency, with three the most frequent. Higher weights mean trips to the corresponding destinations are likely to be more frequent. These weights are consistent with trip frequencies per facility type found by ref. [111];
- If the return trip to a facility is made soon after reaching the destination, the person may experience a feeling of walking or cycling a longer distance. Therefore, in evaluating active transport probabilities (which are a function of distance), a one-way distance is considered for facilities that imply a long stay at the destination (e.g., schools, restaurants), whereas for the other facilities, a two-way distance is considered instead. One- and two-way facilities are indicated in Table 1 by the I or II;
- The four transport modes are comprehensive categories; e.g., for cycling, they include all types of cycles and not just bicycles. Likewise, public transport includes buses, subway, etc.
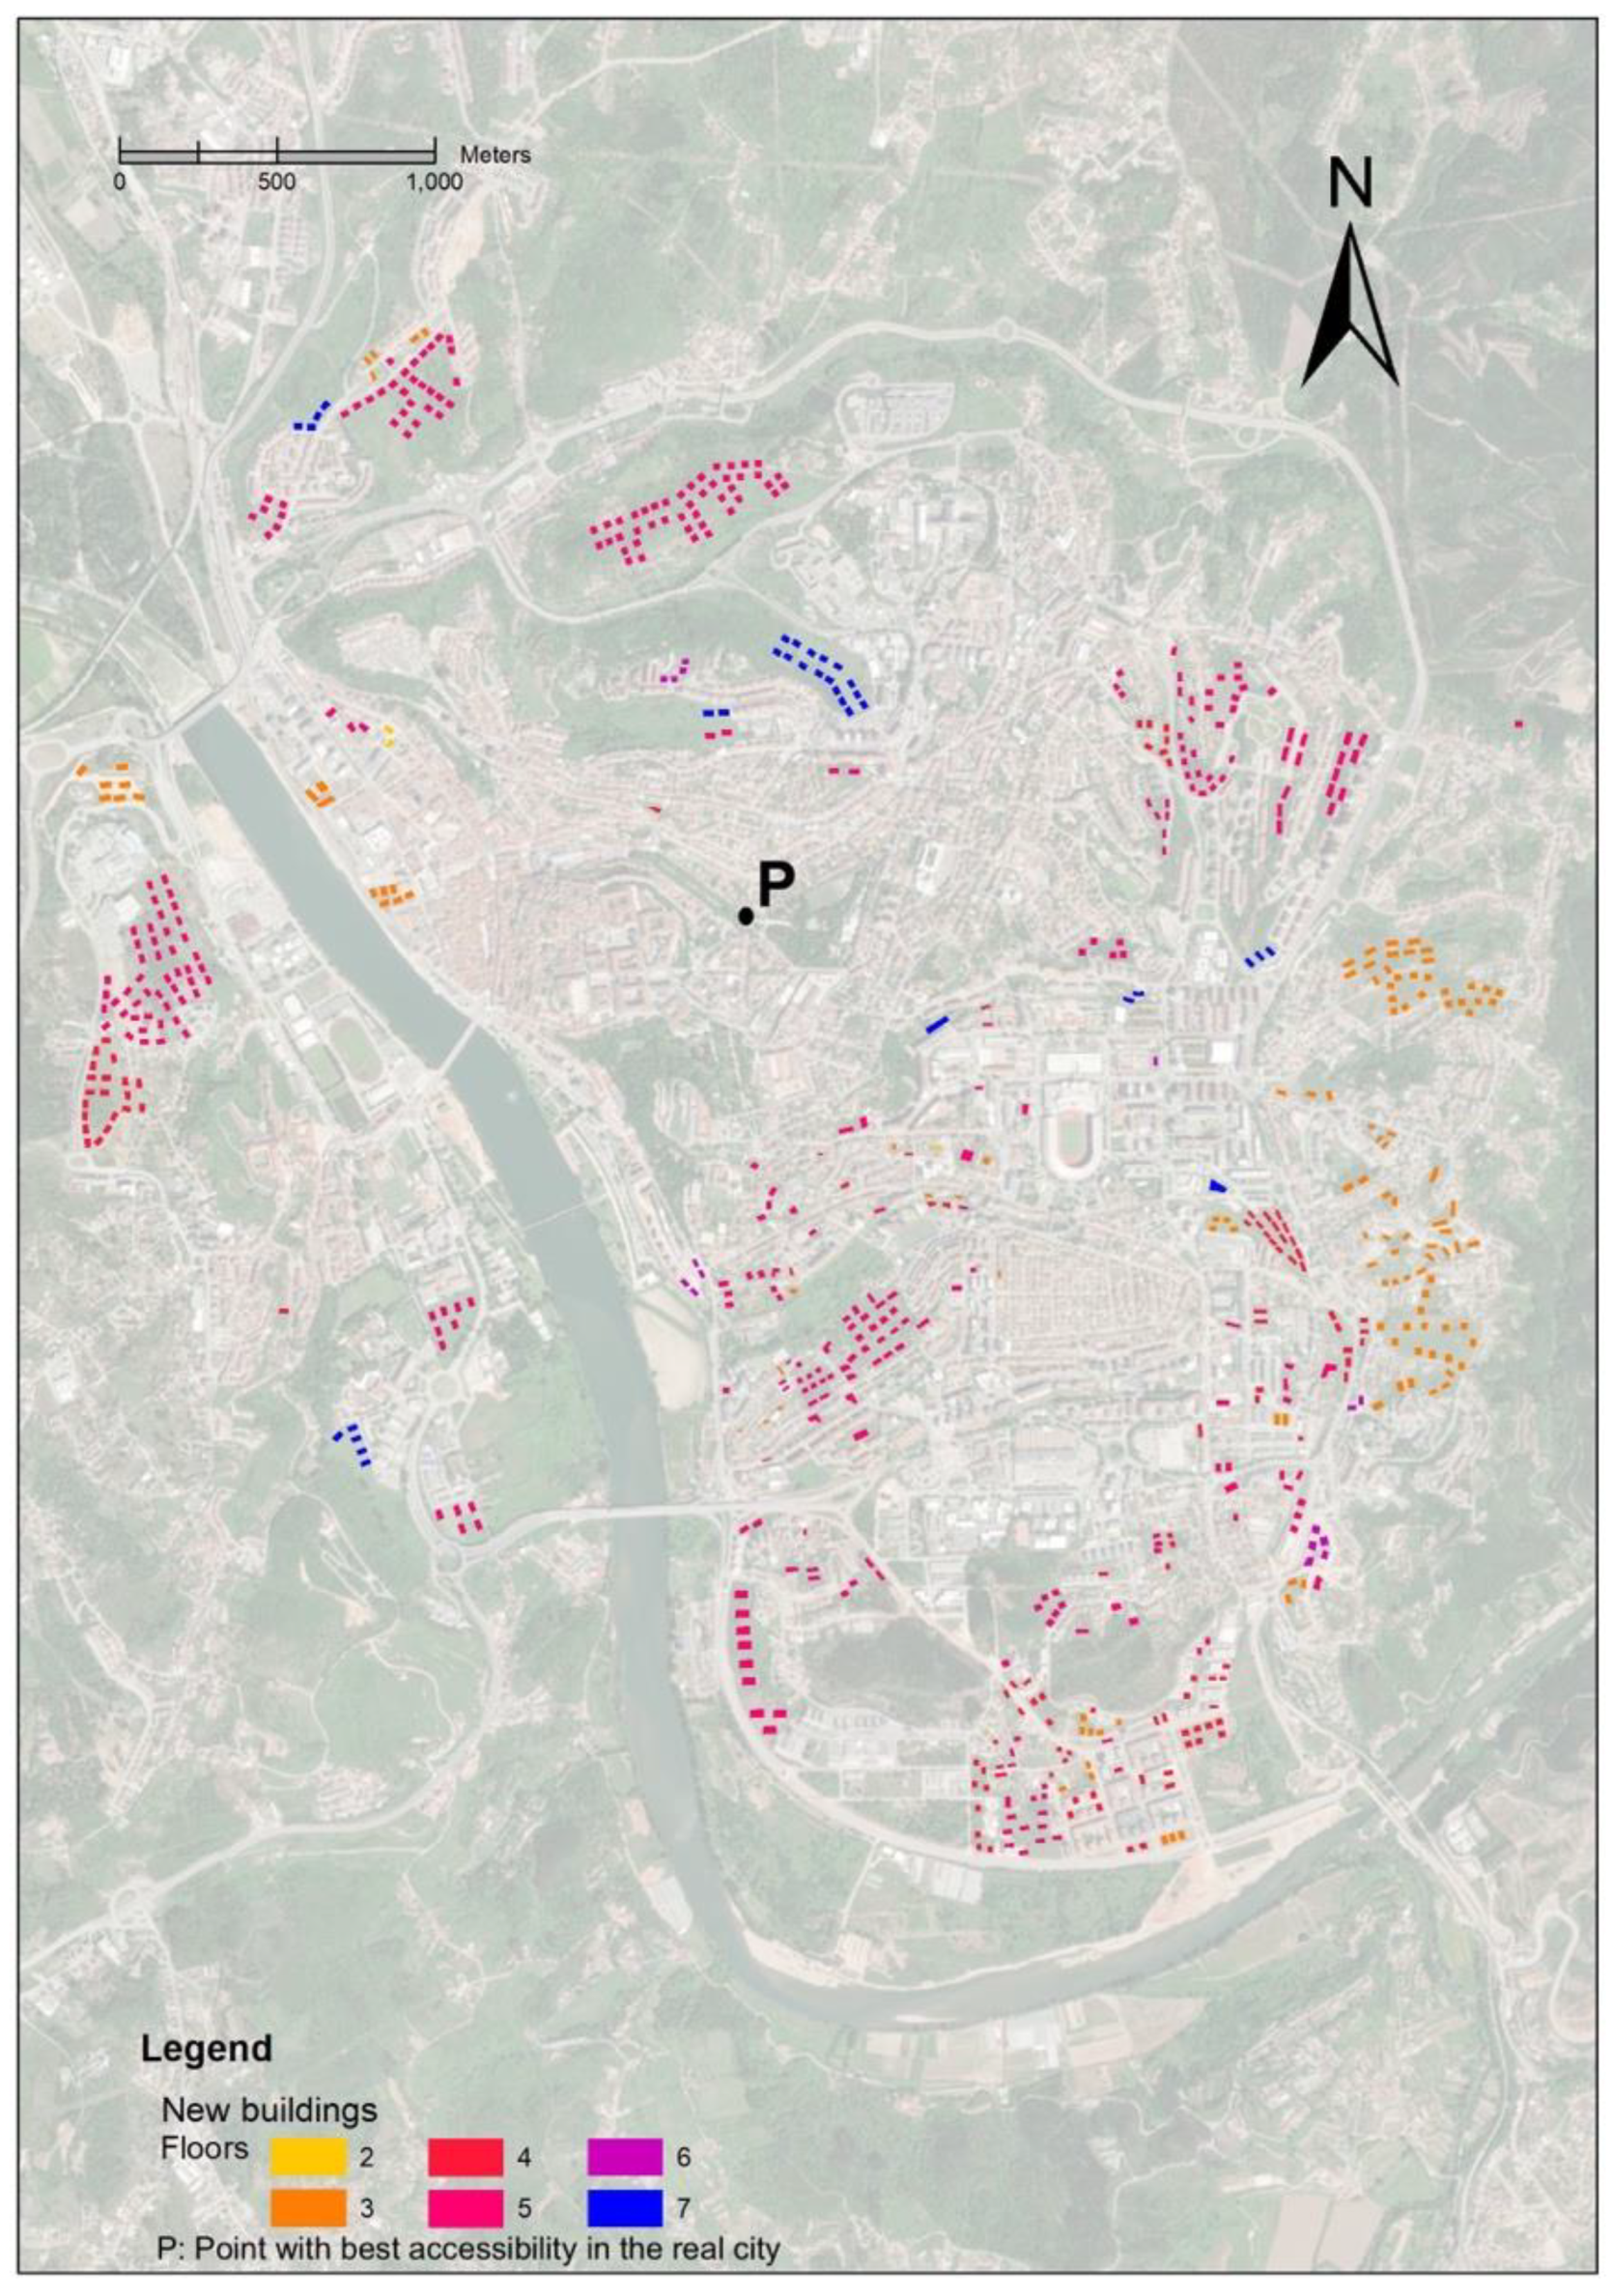
2.3. Compactification Procedure
- Locate the point with best accessibility in the real city, point P;
- Define a 100 m radius circle centred on P and draw all the possible new buildings within that circle. Assign the population farthest from P to those buildings and remove the buildings originally containing the moved population from the origins dataset;
- Define a ring-like area 100–200 m away from P and repeat the assignment of #2;
- Add 100 m to the ring-like area edges of #3 and repeat #3 until resulting new buildings can no longer be fully populated.
2.4. Accessibility
- : number of origins;
- : number of facility types;
- : number of closest facilities (when it applies), and in this article, K = 3;
- : accessibility score of origin i;
- : network distance from origin i to the k-th closest facility of type j (or job zone);
- : weight of facility type j;
- : freedom of choice factor for the k-th closest facility of type j; .
2.4.1. Accessibility to Jobs
- number of job zones;
- : fraction of total jobs in zone ;
- : distance from origin to the -th job zone centroid.
2.5. Active Modal Share
- The active mode share is estimated from transforming accessibility-related trip distances onto active trip probabilities using log-logistic distributions. Separate walk and walk/cycle probabilities are obtained, the latter by combining walk and cycle probabilities, yielding two types of analysis;
- After discounting the active trip probability, the remaining probability corresponds to motorised trips, which are split onto bus/car trips according to the empirical percentages.
- : active modal share of origin ;
- : active trip probability from origin to the -th closest destination of type , with for j: jobs (: active trip probability from to job centroid ).
2.6. Transport Energy Consumption
- : average fuel consumption of accessibility-related trips originating in ;
- : fraction of motorised trips made using the private car;
- : fraction of motorised trips made using public transportation;
- : private car average fuel economy (MJ/passenger.km);
- : public transportation average fuel economy (MJ/passenger.km);
- : one-way distances from origin , respectively, towards/away the -th closest destination of type .
2.7. 15-Minute City
- : attainable fraction of 15-minute city for origin ;
- : 1 if the trip from origin to the -th closest destination of type is possible within 15 min using active modes ; otherwise, 0. For jobs, (: 15-min binary score from to job centroid ).
3. Case Study Results
3.1. Compactification of Coimbra
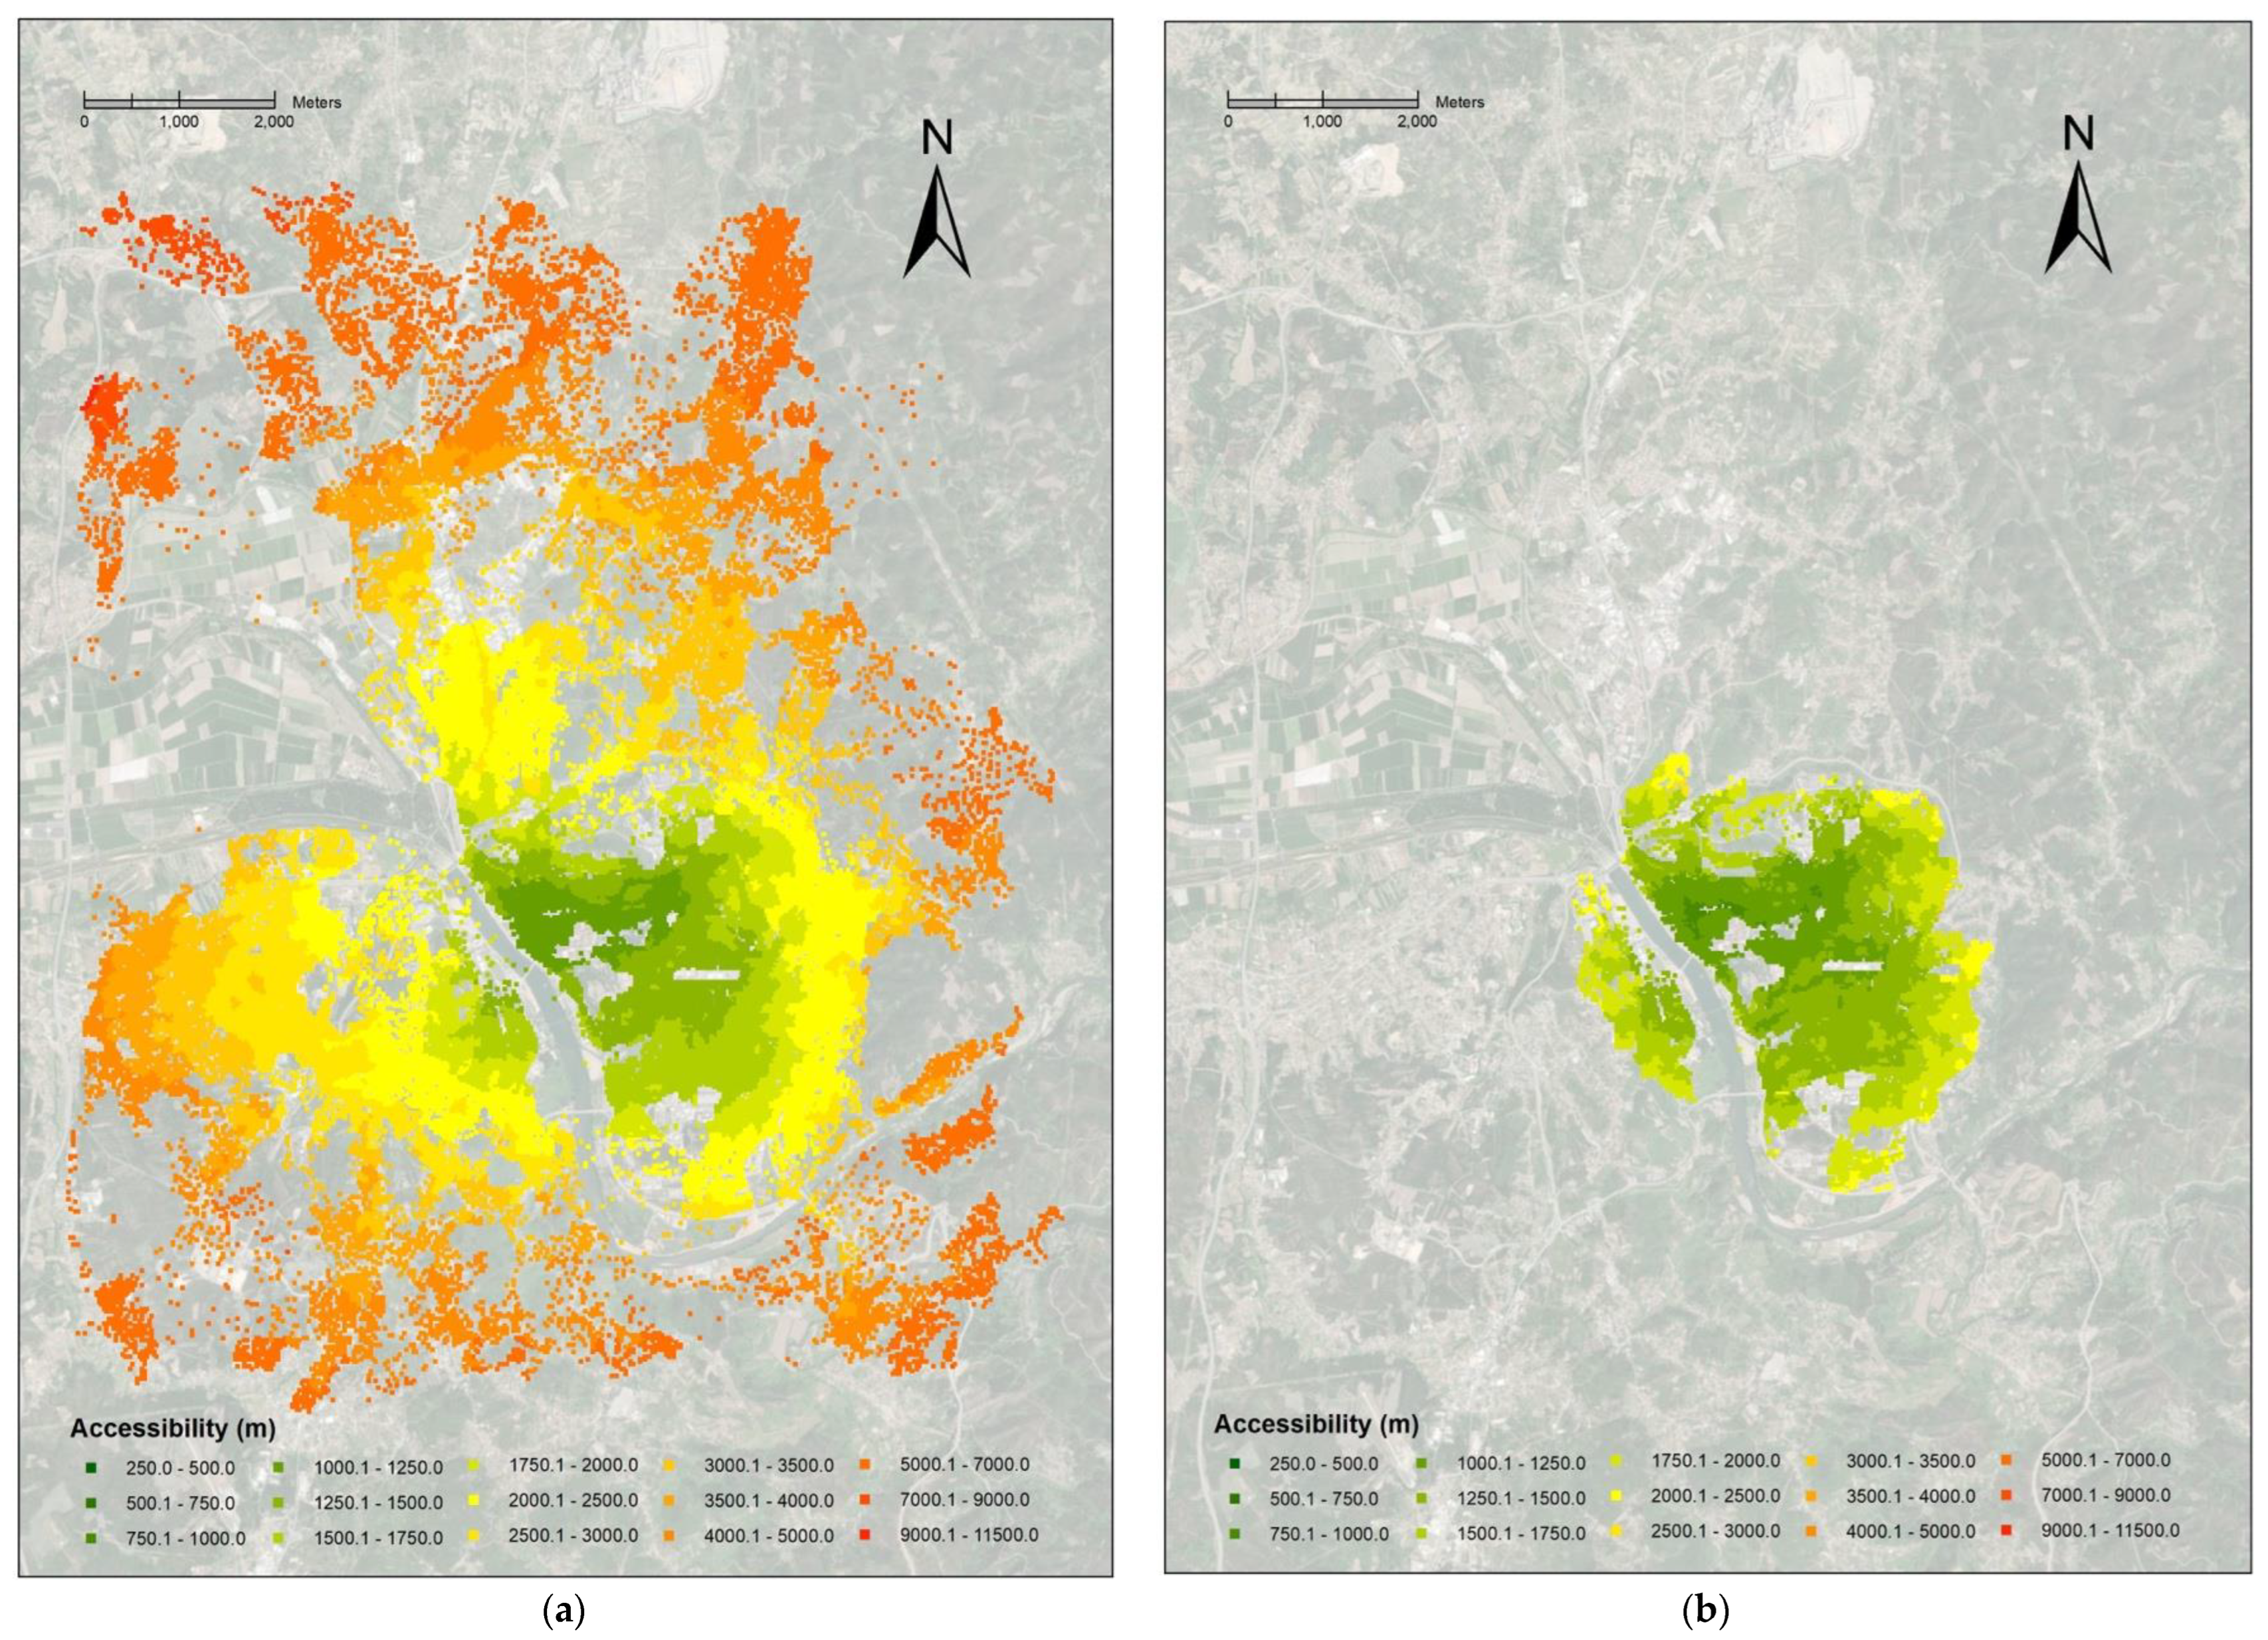
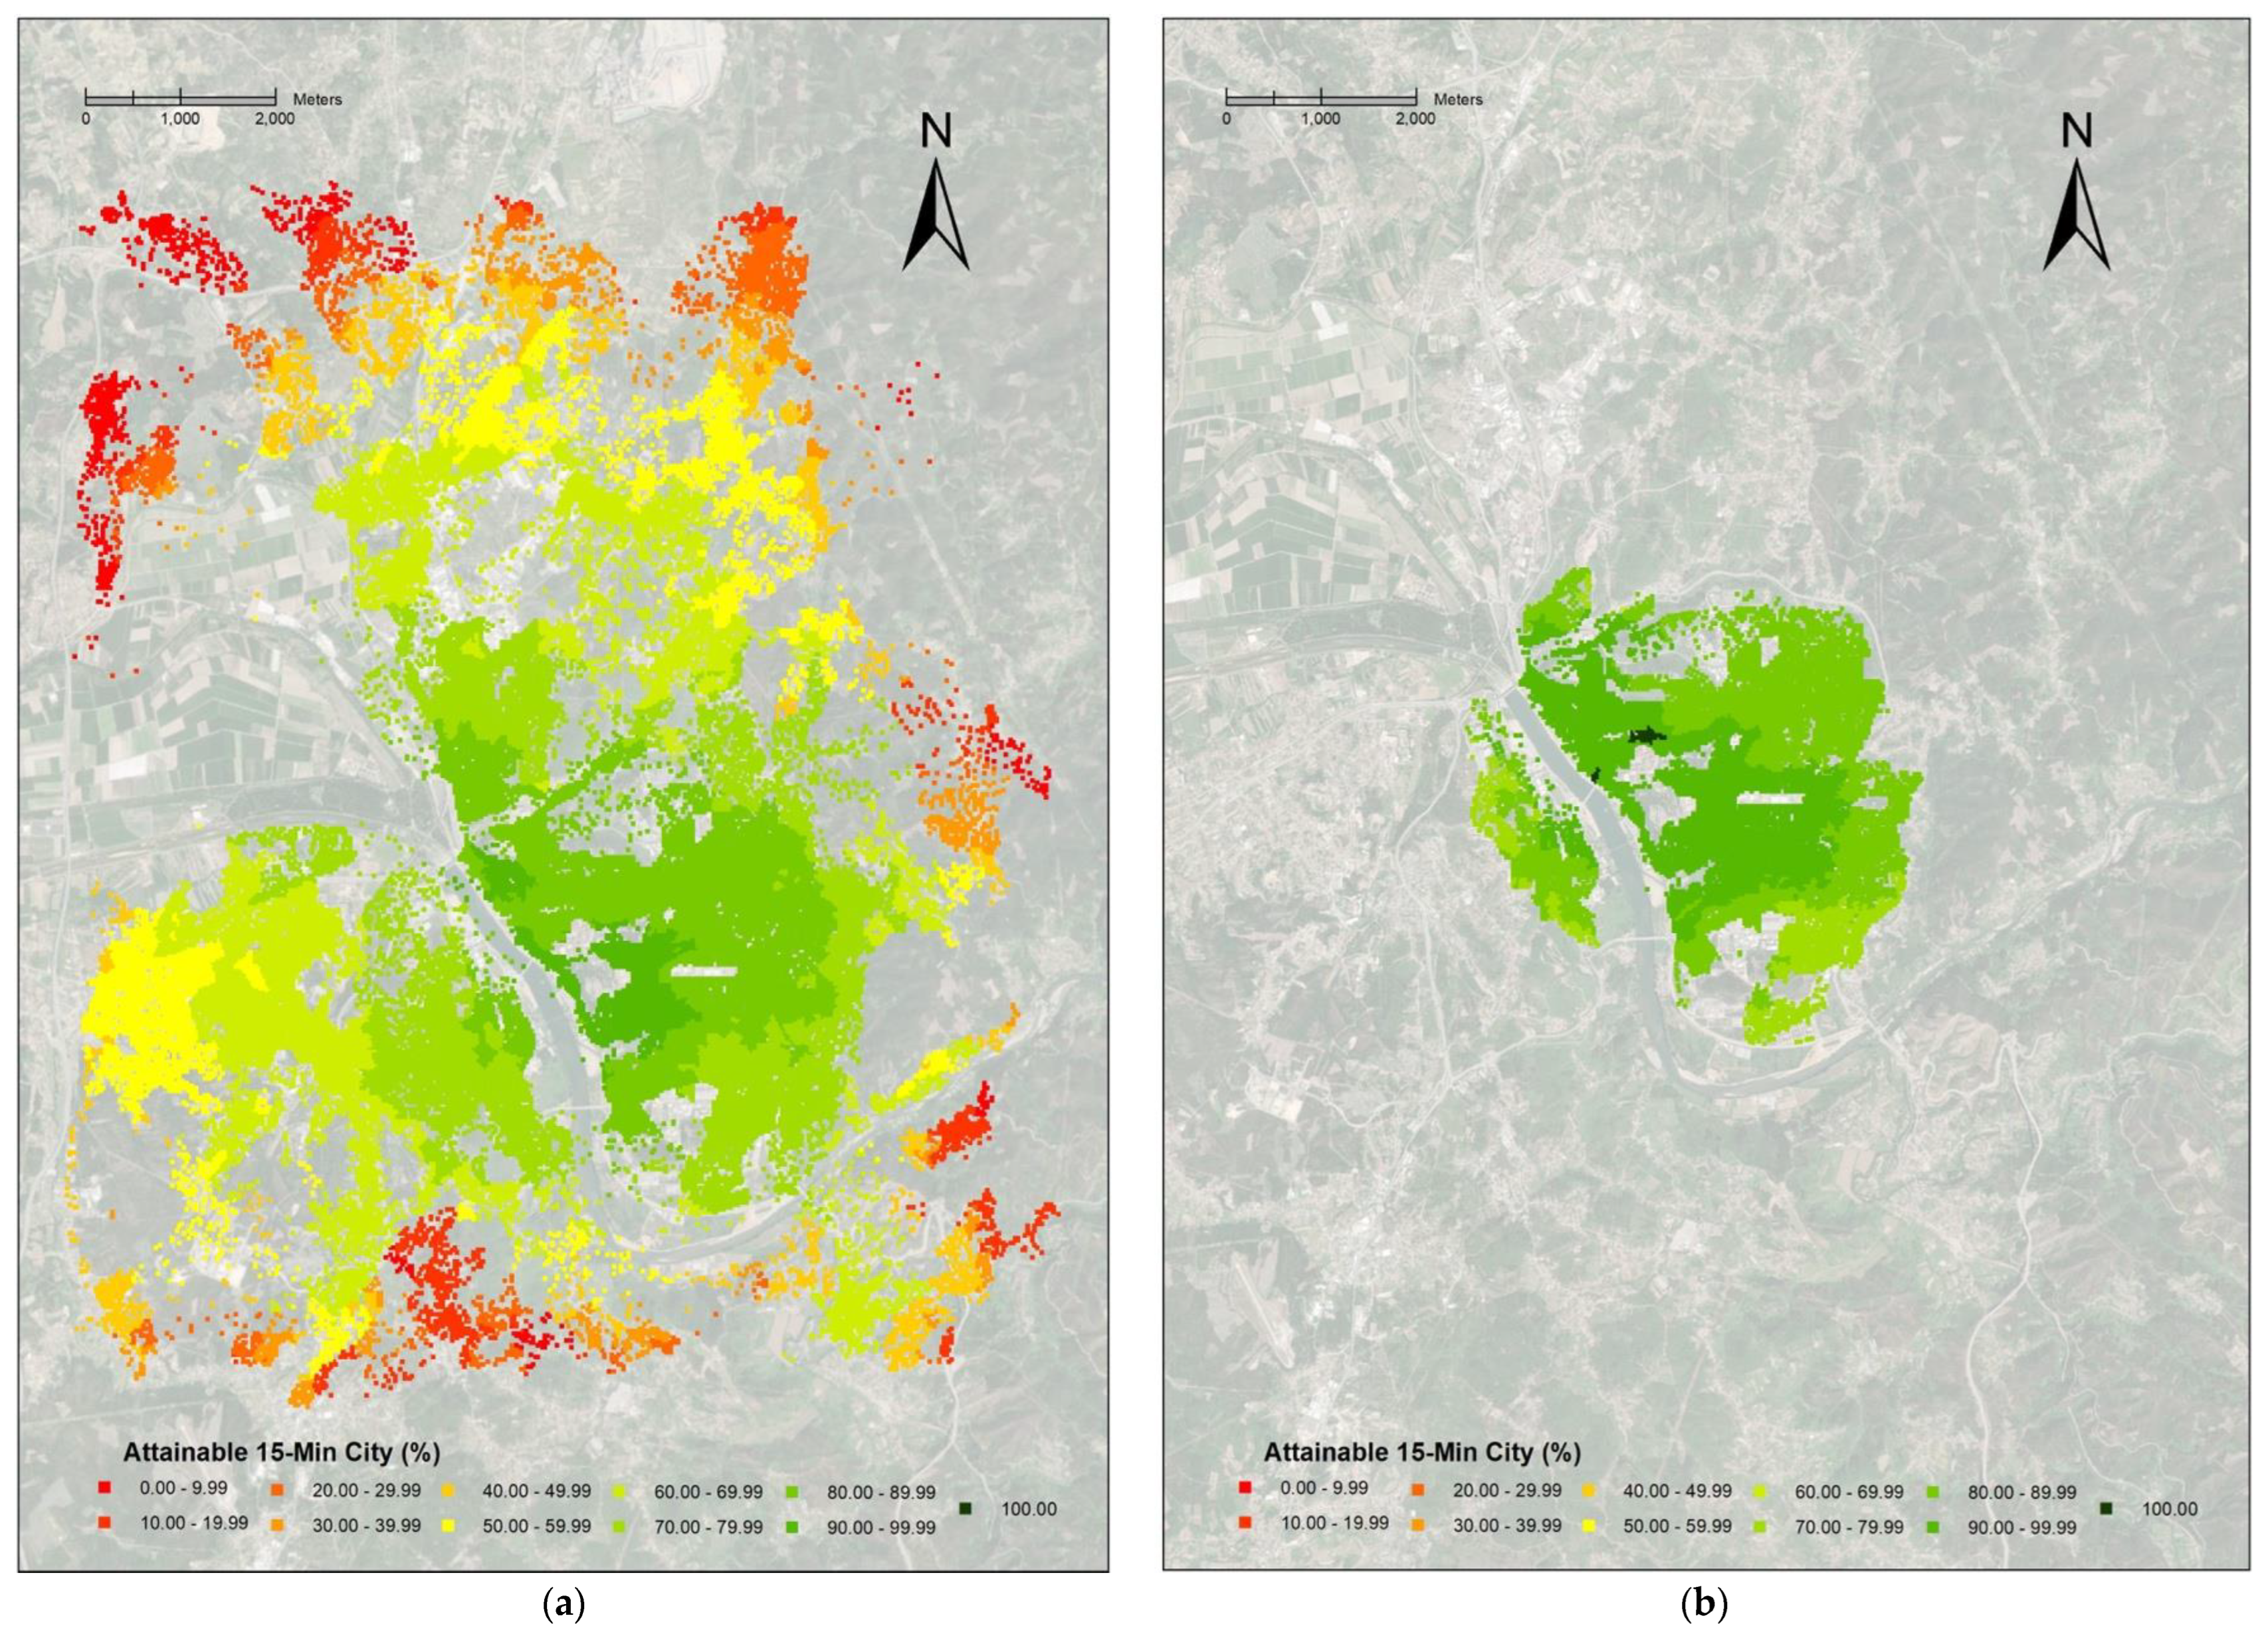
3.2. Accessibility and the 15-Minute City
3.3. Modal Share
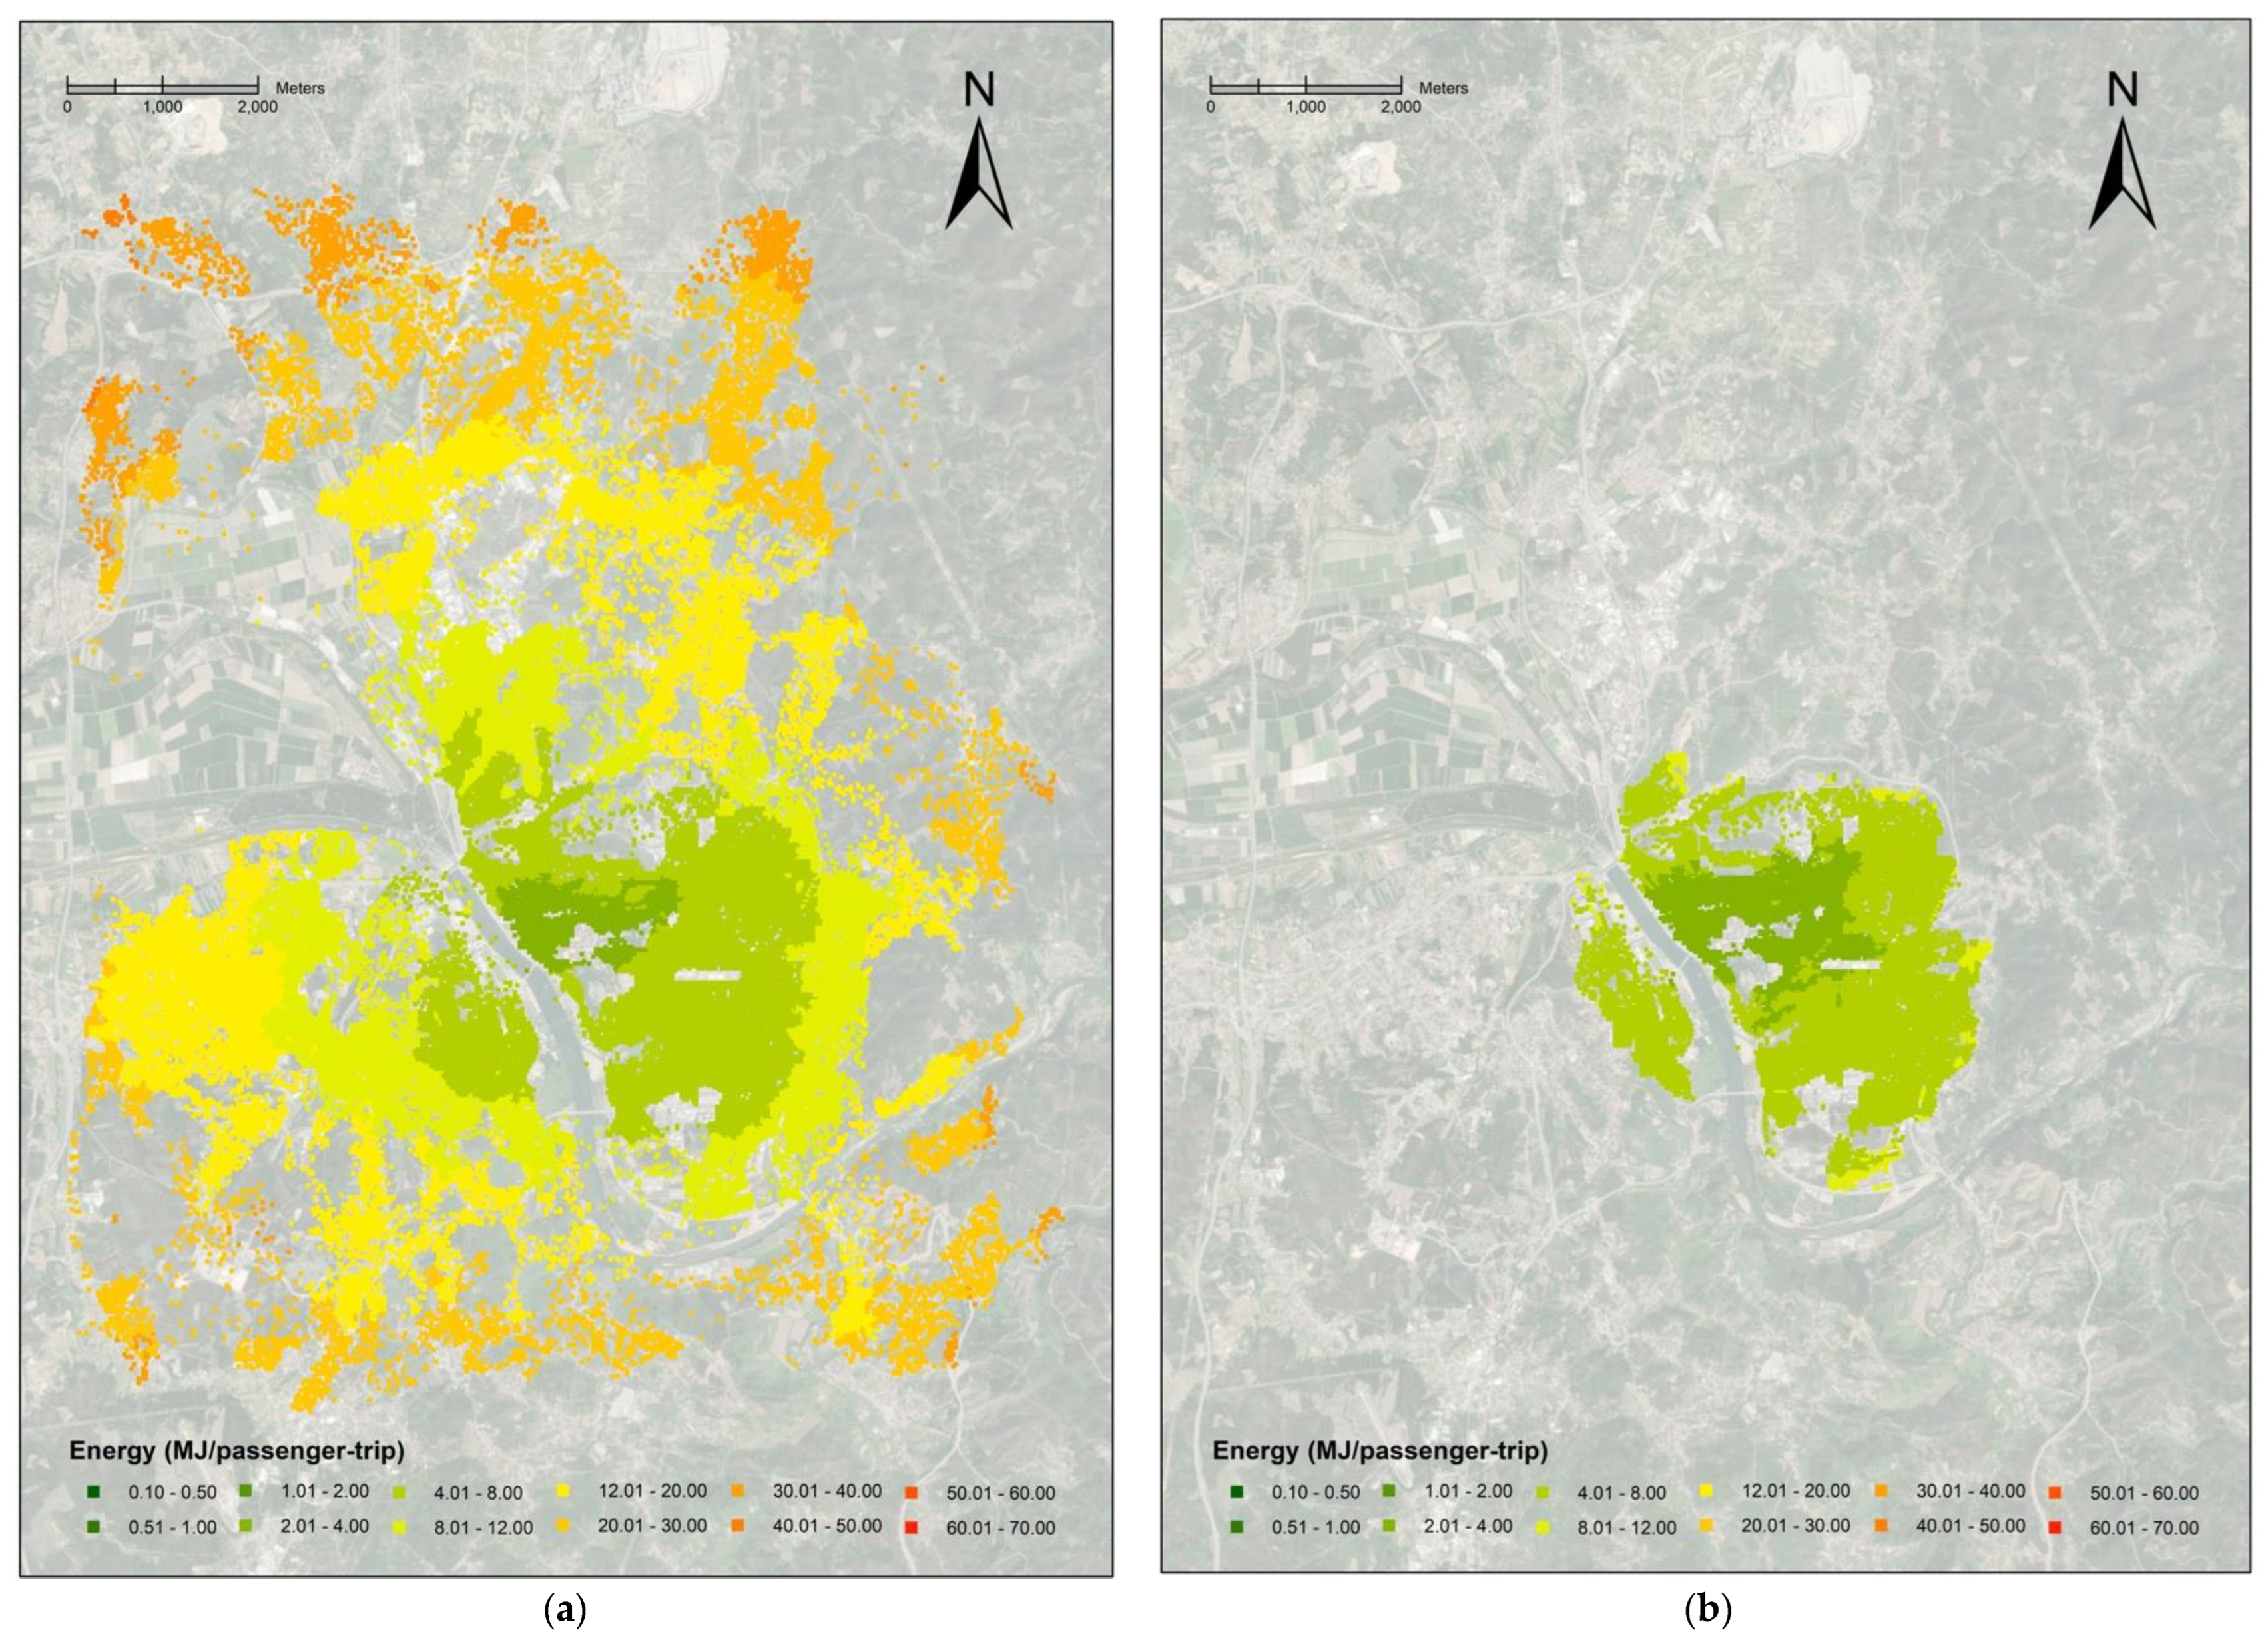
3.4. Transport Energy Consumption
4. Discussion
5. Conclusions
Supplementary Materials
Author Contributions
Funding
Data Availability Statement
Acknowledgments
Conflicts of Interest
References
- UN Habitat. The Strategic Plan for 2020-23; UN Habitat: Nairobi, Kenya, 2020. [Google Scholar]
- Tsui, R.; Wu, S.-W.; Siu, A. Holistic Approach to Shape Future Cities. In Future City Architecture for Optimal Living; Rassia, S.T., Pardalos, P.M., Eds.; Springer Optimization and Its Applications; Springer International Publishing: Cham, Switzerland, 2015; pp. 117–140. ISBN 978-3-319-15030-7. [Google Scholar]
- UN Habitat. Enviaging the Future of Cities—World Cities Resport 2022; UN Habitat: Nairobi, Kenya, 2022. [Google Scholar]
- 68% of the World Population Projected to Live in Urban Areas by 2050, Says UN|UN DESA|United Nations Department of Economic and Social Affairs. Available online: https://www.un.org/development/desa/en/news/population/2018-revision-of-world-urbanization-prospects.html (accessed on 13 January 2023).
- Loorbach, D.; Shiroyama, H. The Challenge of Sustainable Urban Development and Transforming Cities. In Governance of Urban Sustainability Transitions: European and Asian Experiences; Loorbach, D., Wittmayer, J.M., Shiroyama, H., Fujino, J., Mizuguchi, S., Eds.; Theory and Practice of Urban Sustainability Transitions; Springer: Tokyo, Japan, 2016; pp. 3–12. ISBN 978-4-431-55426-4. [Google Scholar]
- Klopp, J.M.; Petretta, D.L. The Urban Sustainable Development Goal: Indicators, Complexity and the Politics of Measuring Cities. Cities 2017, 63, 92–97. [Google Scholar] [CrossRef]
- Capasso Da Silva, D.; King, D.A.; Lemar, S. Accessibility in Practice: 20-Minute City as a Sustainability Planning Goal. Sustainability 2020, 12, 129. [Google Scholar] [CrossRef] [Green Version]
- Gil Solá, A.; Vilhelmson, B.; Larsson, A. Understanding Sustainable Accessibility in Urban Planning: Themes of Consensus, Themes of Tension. J. Transp. Geogr. 2018, 70, 1–10. [Google Scholar] [CrossRef]
- Guerra, G.; Duranton, E. Developing a Common Narrative on Urban Accessibility: An Urban Planning Perspective; Brookings: Washington, DC, USA, 2017. [Google Scholar]
- Mouratidis, K. Is Compact City Livable? The Impact of Compact versus Sprawled Neighbourhoods on Neighbourhood Satisfaction. Urban Stud. 2018, 55, 2408–2430. [Google Scholar] [CrossRef]
- Haaland, C.; van den Bosch, C.K. Challenges and Strategies for Urban Green-Space Planning in Cities Undergoing Densification: A Review. Urban For. Urban Green. 2015, 14, 760–771. [Google Scholar] [CrossRef]
- Kakar, K.A.; Prasad, C.S.R.K. Impact of Urban Sprawl on Travel Demand for Public Transport, Private Transport and Walking. Transp. Res. Procedia 2020, 48, 1881–1892. [Google Scholar] [CrossRef]
- Alonso, A.; Monzón, A.; Cascajo, R. Measuring Negative Synergies of Urban Sprawl and Economic Crisis over Public Transport Efficiency: The Case of Spain. Int. Reg. Sci. Rev. 2018, 41, 540–576. [Google Scholar] [CrossRef] [Green Version]
- Nechyba, T.J.; Walsh, R.P. Urban Sprawl. J. Econ. Perspect. 2004, 18, 177–200. [Google Scholar] [CrossRef] [Green Version]
- Urban Sprawl in Europe—Joint EEA-FOEN Report—European Environment Agency. Available online: https://www.eea.europa.eu/publications/urban-sprawl-in-europe (accessed on 21 February 2023).
- Frumkin, H. Urban Sprawl and Public Health. Public Health Rep. 2002, 117, 201–217. [Google Scholar] [CrossRef]
- Mills, D.E. Growth, Speculation and Sprawl in a Monocentric City. J. Urban Econ. 1981, 10, 201–226. [Google Scholar] [CrossRef]
- Dupras, J.; Marull, J.; Parcerisas, L.; Coll, F.; Gonzalez, A.; Girard, M.; Tello, E. The Impacts of Urban Sprawl on Ecological Connectivity in the Montreal Metropolitan Region. Environ. Sci. Policy 2016, 58, 61–73. [Google Scholar] [CrossRef] [Green Version]
- Artmann, M.; Inostroza, L.; Fan, P. Urban Sprawl, Compact Urban Development and Green Cities. How Much Do We Know, How Much Do We Agree? Ecol. Indic. 2019, 96, 3–9. [Google Scholar] [CrossRef]
- Bibri, S.E. Compact Urbanism and the Synergic Potential of Its Integration with Data-Driven Smart Urbanism: An Extensive Interdisciplinary Literature Review. Land Use Policy 2020, 97, 104703. [Google Scholar] [CrossRef]
- Bibby, P.; Henneberry, J.; Halleux, J.-M. Under the Radar? ‘Soft’ Residential Densification in England, 2001–2011. Environ. Plan. B Urban Anal. City Sci. 2020, 47, 102–118. [Google Scholar] [CrossRef] [Green Version]
- Balletto, G.; Ladu, M.; Milesi, A.; Borruso, G. A Methodological Approach on Disused Public Properties in the 15-Minute City Perspective. Sustainability 2021, 13, 593. [Google Scholar] [CrossRef]
- de Roo, G.; Miller, D. (Eds.) Compact Cities and Sustainable Urban Development: A Critical Assessment of Policies and Plans from an International Perspective; Routledge: London, UK, 2020; ISBN 978-1-315-18936-9. [Google Scholar]
- Rode, P. Urban Planning and Transport Policy Integration: The Role of Governance Hierarchies and Networks in London and Berlin. J. Urban Aff. 2019, 41, 39–63. [Google Scholar] [CrossRef] [Green Version]
- Giles-Corti, B.; Vernez-Moudon, A.; Reis, R.; Turrell, G.; Dannenberg, A.L.; Badland, H.; Foster, S.; Lowe, M.; Sallis, J.F.; Stevenson, M.; et al. City Planning and Population Health: A Global Challenge. Lancet 2016, 388, 2912–2924. [Google Scholar] [CrossRef]
- Hu, N.; Legara, E.F.; Lee, K.K.; Hung, G.G.; Monterola, C. Impacts of Land Use and Amenities on Public Transport Use, Urban Planning and Design. Land Use Policy 2016, 57, 356–367. [Google Scholar] [CrossRef]
- Hickman, R.; Banister, D. Transport and Reduced Energy Consumption: What Role Can Urban Planning Play? Transport Studies Unit, University of Oxford: Oxford, UK, 2007. [Google Scholar]
- Abdullahi, S.; Pradhan, B. Land Use Change Modeling and the Effect of Compact City Paradigms: Integration of GIS-Based Cellular Automata and Weights-of-Evidence Techniques. Environ. Earth Sci. 2018, 77, 251. [Google Scholar] [CrossRef]
- Gaigné, C.; Riou, S.; Thisse, J.-F. Are Compact Cities Environmentally Friendly? J. Urban Econ. 2012, 72, 123–136. [Google Scholar] [CrossRef]
- Cheng, Y.-H.; Chang, Y.-H.; Lu, I.J. Urban Transportation Energy and Carbon Dioxide Emission Reduction Strategies. Appl. Energy 2015, 157, 953–973. [Google Scholar] [CrossRef]
- Stevenson, M.; Thompson, J.; de Sá, T.H.; Ewing, R.; Mohan, D.; McClure, R.; Roberts, I.; Tiwari, G.; Giles-Corti, B.; Sun, X.; et al. Land Use, Transport, and Population Health: Estimating the Health Benefits of Compact Cities. Lancet 2016, 388, 2925–2935. [Google Scholar] [CrossRef] [PubMed] [Green Version]
- Della Architettura Della Pittura e Della Statua Di Leonbatista Alberti—1782|Historian Antiques. Available online: https://historianlugano.com/prod-8159-Della-Architettura-della-pittura-e-della-statua-di-Leonbatista-Alberti-1782 (accessed on 21 February 2023).
- Romano, M. L’Estetica della Città Europea. Forme e Immagini; Giulio Einaudi Editore: Torino, Italy, 1993; p. XIV-218. [Google Scholar]
- Barthelemy, M. Modeling Cities. Comptes Rendus Phys. 2019, 20, 293–307. [Google Scholar] [CrossRef]
- Phillis, Y.A.; Kouikoglou, V.S.; Verdugo, C. Urban Sustainability Assessment and Ranking of Cities. Comput. Environ. Urban Syst. 2017, 64, 254–265. [Google Scholar] [CrossRef]
- Liu, L.; Tian, Y. Compact Urban Form and Human Development: Retest Based on Heterogeneous Effects. Int. J. Environ. Res. Public Health 2022, 19, 2198. [Google Scholar] [CrossRef]
- Rode, P.; Floater, G.; Thomopoulos, N.; Docherty, J.; Schwinger, P.; Mahendra, A.; Fang, W. Accessibility in Cities: Transport and Urban Form. In Disrupting Mobility: Impacts of Sharing Economy and Innovative Transportation on Cities; Meyer, G., Shaheen, S., Eds.; Lecture Notes in Mobility; Springer International Publishing: Cham, Switzerland, 2017; pp. 239–273. ISBN 978-3-319-51602-8. [Google Scholar]
- Lau, J.C.Y.; Chiu, C.C.H. Accessibility of Workers in a Compact City: The Case of Hong Kong. Habitat Int. 2004, 28, 89–102. [Google Scholar] [CrossRef]
- Kaido, K. Urban Densities, Quality of Life and Local Facility Accessibility in Principal Japanese Cities. In Future Forms and Design For Sustainable Cities; Routledge: New York, NY, USA, 2005; ISBN 978-0-08-045552-5. [Google Scholar]
- Shirazi, M.R. Compact Urban Form: Neighbouring and Social Activity. Sustainability 2020, 12, 1987. [Google Scholar] [CrossRef] [Green Version]
- Hofstad, H. Compact City Development: High Ideals and Emerging Practices. Eur. J. Spat. Dev. 2012, 10, 1–23. [Google Scholar]
- Melia, S.; Parkhurst, G.; Barton, H. The Paradox of Intensification. Transp. Policy 2011, 18, 46–52. [Google Scholar] [CrossRef]
- Neuman, M. The Compact City Fallacy. J. Plan. Educ. Res. 2005, 25, 11–26. [Google Scholar] [CrossRef]
- Banister, D. Transport and Urban Development; Routledge: London, UK, 1995; ISBN 978-0-203-45132-8. [Google Scholar]
- Handy, S.L. Accessibility- vs. Mobility-Enhancing Strategies for Addressing Automobile Dependence in the U.S. In Proceedings of the European Conference of Ministers of Transport, Paris, France, 29–30 May 2002. [Google Scholar]
- Papa, E.; Bertolini, L. Accessibility and Transit-Oriented Development in European Metropolitan Areas. J. Transp. Geogr. 2015, 47, 70–83. [Google Scholar] [CrossRef] [Green Version]
- Järv, O.; Tenkanen, H.; Salonen, M.; Ahas, R.; Toivonen, T. Dynamic Cities: Location-Based Accessibility Modelling as a Function of Time. Appl. Geogr. 2018, 95, 101–110. [Google Scholar] [CrossRef]
- Deboosere, R.; El-Geneidy, A.M.; Levinson, D. Accessibility-Oriented Development. J. Transp. Geogr. 2018, 70, 11–20. [Google Scholar] [CrossRef] [Green Version]
- Kompil, M.; Jacobs-Crisioni, C.; Dijkstra, L.; Lavalle, C. Mapping Accessibility to Generic Services in Europe: A Market-Potential Based Approach. Sustain. Cities Soc. 2019, 47, 101372. [Google Scholar] [CrossRef]
- Bertolini, L.; le Clercq, F.; Kapoen, L. Sustainable Accessibility: A Conceptual Framework to Integrate Transport and Land Use Plan-Making. Two Test-Applications in the Netherlands and a Reflection on the Way Forward. Transp. Policy 2005, 12, 207–220. [Google Scholar] [CrossRef]
- Shen, G.; Wang, Z.; Zhou, L.; Liu, Y.; Yan, X. Home-Based Locational Accessibility to Essential Urban Services: The Case of Wake County, North Carolina, USA. Sustainability 2020, 12, 9142. [Google Scholar] [CrossRef]
- Verma, A.; Verma, M.; Rahul, T.M.; Khurana, S.; Rai, A. Measuring Accessibility of Various Facilities by Walking in World’s Largest Mass Religious Gathering—Kumbh Mela. Sustain. Cities Soc. 2019, 45, 79–86. [Google Scholar] [CrossRef]
- Pucher, J.; Buehler, R.; Bassett, D.R.; Dannenberg, A.L. Walking and Cycling to Health: A Comparative Analysis of City, State, and International Data. Am. J. Public Health 2010, 100, 1986–1992. [Google Scholar] [CrossRef]
- Rojas-Rueda, D.; de Nazelle, A.; Teixidó, O.; Nieuwenhuijsen, M.J. Replacing Car Trips by Increasing Bike and Public Transport in the Greater Barcelona Metropolitan Area: A Health Impact Assessment Study. Environ. Int. 2012, 49, 100–109. [Google Scholar] [CrossRef]
- Rojas-Rueda, D.; de Nazelle, A.; Teixidó, O.; Nieuwenhuijsen, M.J. Health Impact Assessment of Increasing Public Transport and Cycling Use in Barcelona: A Morbidity and Burden of Disease Approach. Prev. Med. 2013, 57, 573–579. [Google Scholar] [CrossRef]
- Smith, M.; Hosking, J.; Woodward, A.; Witten, K.; MacMillan, A.; Field, A.; Baas, P.; Mackie, H. Systematic Literature Review of Built Environment Effects on Physical Activity and Active Transport—An Update and New Findings on Health Equity. Int. J. Behav. Nutr. Phys. Act. 2017, 14, 158. [Google Scholar] [CrossRef]
- Owen, A.; Levinson, D.M. Modeling the Commute Mode Share of Transit Using Continuous Accessibility to Jobs. Transp. Res. Part A Policy Pract. 2015, 74, 110–122. [Google Scholar] [CrossRef] [Green Version]
- Barton, H.; Grant, M.; Horswell, M.W. Suburban Solutions: The Other Side of the Story. Town Ctry. Plan. 2011, 80, 339–345. [Google Scholar]
- Birr, K. Mode Choice Modelling for Urban Areas. Tech. Trans. 2018, 115, 67–77. [Google Scholar] [CrossRef]
- Avila-Palencia, I.; Int Panis, L.; Dons, E.; Gaupp-Berghausen, M.; Raser, E.; Götschi, T.; Gerike, R.; Brand, C.; de Nazelle, A.; Orjuela, J.P.; et al. The Effects of Transport Mode Use on Self-Perceived Health, Mental Health, and Social Contact Measures: A Cross-Sectional and Longitudinal Study. Environ. Int. 2018, 120, 199–206. [Google Scholar] [CrossRef]
- Goenka, S.; Andersen, L.B. Urban Design and Transport to Promote Healthy Lives. Lancet 2016, 388, 2851–2853. [Google Scholar] [CrossRef]
- de Nazelle, A.; Nieuwenhuijsen, M.J.; Antó, J.M.; Brauer, M.; Briggs, D.; Braun-Fahrlander, C.; Cavill, N.; Cooper, A.R.; Desqueyroux, H.; Fruin, S.; et al. Improving Health through Policies That Promote Active Travel: A Review of Evidence to Support Integrated Health Impact Assessment. Environ. Int. 2011, 37, 766–777. [Google Scholar] [CrossRef]
- Lindsay, G.; Macmillan, A.; Woodward, A. Moving Urban Trips from Cars to Bicycles: Impact on Health and Emissions. Aust. N. Z. J. Public Health 2011, 35, 54–60. [Google Scholar] [CrossRef]
- Woodcock, J.; Edwards, P.; Tonne, C.; Armstrong, B.G.; Ashiru, O.; Banister, D.; Beevers, S.; Chalabi, Z.; Chowdhury, Z.; Cohen, A.; et al. Public Health Benefits of Strategies to Reduce Greenhouse-Gas Emissions: Urban Land Transport. Lancet 2009, 374, 1930–1943. [Google Scholar] [CrossRef]
- United Nations Economic Commission for Europe. A Handbook on Sustainable Urban Mobility and Spatial Planning: Promoting Active Mobility; UN: New York, NY, USA, 2020; ISBN 978-92-1-004859-0. [Google Scholar]
- Scotini, R.; Skinner, I.; Racioppi, F.; Fusé, V.; Bertucci, J.D.O.; Tsutsumi, R. Supporting Active Mobility and Green Jobs through the Promotion of Cycling. Int. J. Environ. Res. Public Health 2017, 14, 1603. [Google Scholar] [CrossRef] [Green Version]
- Wegener, S.; Raser, E.; Gaupp-Berghausen, M.; Anaya, E.; de Nazelle, A.; Eriksson, U.; Gerike, R.; Horvath, I.; Iacorossi, F.; Int Panis, L.; et al. Active Mobility—The New Health Trend in Smart Cities, or Even More? In REAL CORP 2017—PANTA RHEI—A World in Constant Motion. Proceedings of 22nd International Conference on Urban Planning, Regional Development and Information Society, Vienna, Austria, 12-14 september 2017; pp. 21–30.
- Pucher, J.; Buehler, R. (Eds.) City Cycling; The MIT Press: Cambridge, MA, USA, 2012; ISBN 978-0-262-51781-2. [Google Scholar]
- Commision of the European Communities Towards a New Culture for Urban Mobility. Available online: https://eur-lex.europa.eu/legal-content/EN/TXT/PDF/?uri=CELEX:52007DC0551&from=EN (accessed on 21 February 2023).
- Kahlmeier, S.; Boig, E.A.; Castro, A.; Smeds, E.; Benvenuti, F.; Eriksson, U.; Iacorossi, F.; Nieuwenhuijsen, M.J.; Panis, L.I.; Rojas-Rueda, D.; et al. Assessing the Policy Environment for Active Mobility in Cities—Development and Feasibility of the PASTA Cycling and Walking Policy Environment Score. Int. J. Environ. Res. Public Health 2021, 18, 986. [Google Scholar] [CrossRef]
- Nourian, P.; Rezvani, S.; Valečkaitė, K.; Sariyildiz, I.S. Modelling Walking and Cycling Accessibility and Mobility: The Effect of Network Configuration and Occupancy on Spatial Dynamics of Active Mobility. Smart Sustain. Built Environ. 2018, 7, 101–116. [Google Scholar] [CrossRef] [Green Version]
- Vale, D.S.; Saraiva, M.; Pereira, M. Active Accessibility: A Review of Operational Measures of Walking and Cycling Accessibility. J. Transp. Land Use 2016, 9, 209–235. [Google Scholar] [CrossRef]
- Lamíquiz, P.J.; López-Domínguez, J. Effects of Built Environment on Walking at the Neighbourhood Scale. A New Role for Street Networks by Modelling Their Configurational Accessibility? Transp. Res. Part A Policy Pract. 2015, 74, 148–163. [Google Scholar] [CrossRef] [Green Version]
- Hino, A.A.F.; Reis, R.S.; Sarmiento, O.L.; Parra, D.C.; Brownson, R.C. Built Environment and Physical Activity for Transportation in Adults from Curitiba, Brazil. J. Urban Health 2014, 91, 446–462. [Google Scholar] [CrossRef] [PubMed] [Green Version]
- Zannat, K.E.; Adnan, M.S.G.; Dewan, A. A GIS-Based Approach to Evaluating Environmental Influences on Active and Public Transport Accessibility of University Students. J. Urban Manag. 2020, 9, 331–346. [Google Scholar] [CrossRef]
- Grow, H.M.; Saelens, B.E.; Kerr, J.; Durant, N.H.; Norman, G.J.; Sallis, J.F. Where Are Youth Active? Roles of Proximity, Active Transport, and Built Environment. Med. Sci. Sports Exerc. 2008, 40, 2071–2079. [Google Scholar] [CrossRef] [Green Version]
- Dogan, T.; Yang, Y.; Samaranayake, S.; Saraf, N. Urbano: A Tool to Promote Active Mobility Modeling and Amenity Analysis in Urban Design. Technol.|Archit. + Des. 2020, 4, 92–105. [Google Scholar] [CrossRef]
- Scheepers, C.E.; Wendel-Vos, G.C.W.; van Kempen, E.E.M.M.; de Hollander, E.L.; van Wijnen, H.J.; Maas, J.; den Hertog, F.R.J.; Staatsen, B.A.M.; Stipdonk, H.L.; Int Panis, L.L.R.; et al. Perceived Accessibility Is an Important Factor in Transport Choice—Results from the AVENUE Project. J. Transp. Health 2016, 3, 96–106. [Google Scholar] [CrossRef]
- Glazener, A.; Khreis, H. Transforming Our Cities: Best Practices Towards Clean Air and Active Transportation. Curr. Environ. Health Rep. 2019, 6, 22–37. [Google Scholar] [CrossRef]
- Saelens, B.E.; Sallis, J.F.; Frank, L.D. Environmental Correlates of Walking and Cycling: Findings from the Transportation, Urban Design, and Planning Literatures. Ann. Behav. Med. 2003, 25, 80–91. [Google Scholar] [CrossRef] [PubMed]
- Heinrichs, D.; Jarass, J. Alltagsmobilität in Städten gesund gestalten: Wie Stadtplanung Fuß- und Radverkehr fördern kann. Bundesgesundheitsbl 2020, 63, 945–952. [Google Scholar] [CrossRef] [PubMed]
- Tight, M.; Timms, P.; Banister, D.; Bowmaker, J.; Copas, J.; Day, A.; Drinkwater, D.; Givoni, M.; Gühnemann, A.; Lawler, M.; et al. Visions for a Walking and Cycling Focussed Urban Transport System. J. Transp. Geogr. 2011, 19, 1580–1589. [Google Scholar] [CrossRef]
- Handy, S.L.; Boarnet, M.G.; Ewing, R.; Killingsworth, R.E. How the Built Environment Affects Physical Activity: Views from Urban Planning. Am. J. Prev. Med. 2002, 23, 64–73. [Google Scholar] [CrossRef]
- Nielsen, T.A.S.; Skov-Petersen, H. Bikeability—Urban Structures Supporting Cycling. Effects of Local, Urban and Regional Scale Urban Form Factors on Cycling from Home and Workplace Locations in Denmark. J. Transp. Geogr. 2018, 69, 36–44. [Google Scholar] [CrossRef]
- Koszowski, C.; Gerike, R.; Hubrich, S.; Götschi, T.; Pohle, M.; Wittwer, R. Active Mobility: Bringing Together Transport Planning, Urban Planning, and Public Health. In Towards User-Centric Transport in Europe: Challenges, Solutions and Collaborations; Müller, B., Meyer, G., Eds.; Lecture Notes in Mobility; Springer International Publishing: Cham, Switzerland, 2019; pp. 149–171. ISBN 978-3-319-99756-8. [Google Scholar]
- Pajares, E.; Büttner, B.; Jehle, U.; Nichols, A.; Wulfhorst, G. Accessibility by Proximity: Addressing the Lack of Interactive Accessibility Instruments for Active Mobility. J. Transp. Geogr. 2021, 93, 103080. [Google Scholar] [CrossRef]
- Rendall, S.; Page, S.; Reitsma, F.; Van Houten, E.; Krumdieck, S. Quantifying Transport Energy Resilience: Active Mode Accessibility. Transp. Res. Rec. 2011, 2242, 72–80. [Google Scholar] [CrossRef]
- Shams Amiri, S.; Mottahedi, S.; Lee, E.R.; Hoque, S. Peeking inside the Black-Box: Explainable Machine Learning Applied to Household Transportation Energy Consumption. Comput. Environ. Urban Syst. 2021, 88, 101647. [Google Scholar] [CrossRef]
- Dingil, A.E.; Schweizer, J.; Rupi, F.; Stasiskiene, Z. Updated Models of Passenger Transport Related Energy Consumption of Urban Areas. Sustainability 2019, 11, 4060. [Google Scholar] [CrossRef] [Green Version]
- Zhao, P.; Diao, J.; Li, S. The Influence of Urban Structure on Individual Transport Energy Consumption in China’s Growing Cities. Habitat Int. 2017, 66, 95–105. [Google Scholar] [CrossRef]
- Chen, H.; Jia, B.; Lau, S.S.Y. Sustainable Urban Form for Chinese Compact Cities: Challenges of a Rapid Urbanized Economy. Habitat Int. 2008, 32, 28–40. [Google Scholar] [CrossRef]
- Shim, G.-E.; Rhee, S.-M.; Ahn, K.-H.; Chung, S.-B. The Relationship between the Characteristics of Transportation Energy Consumption and Urban Form. Ann. Reg. Sci. 2006, 40, 351–367. [Google Scholar] [CrossRef]
- Kaza, N. Urban Form and Transportation Energy Consumption. Energy Policy 2020, 136, 111049. [Google Scholar] [CrossRef]
- Sun, L.; Zhang, T.; Liu, S.; Wang, K.; Rogers, T.; Yao, L.; Zhao, P. Reducing Energy Consumption and Pollution in the Urban Transportation Sector: A Review of Policies and Regulations in Beijing. J. Clean. Prod. 2021, 285, 125339. [Google Scholar] [CrossRef]
- Zhou, J.; Lin, J.; Cui, S.; Qiu, Q.; Zhao, Q. Exploring the Relationship between Urban Transportation Energy Consumption and Transition of Settlement Morphology: A Case Study on Xiamen Island, China. Habitat Int. 2013, 37, 70–79. [Google Scholar] [CrossRef]
- Rickwood, P.; Glazebrook, G.; Searle, G. Urban Structure and Energy—A Review. Urban Policy Res. 2008, 26, 57–81. [Google Scholar] [CrossRef] [Green Version]
- Mindali, O.; Raveh, A.; Salomon, I. Urban Density and Energy Consumption: A New Look at Old Statistics. Transp. Res. Part A Policy Pract. 2004, 38, 143–162. [Google Scholar] [CrossRef]
- Kissfazekas, K. Circle of Paradigms? Or ‘15-Minute’ Neighbourhoods from the 1950s. Cities 2022, 123, 103587. [Google Scholar] [CrossRef]
- Moreno, C.; Allam, Z.; Chabaud, D.; Gall, C.; Pratlong, F. Introducing the “15-Minute City”: Sustainability, Resilience and Place Identity in Future Post-Pandemic Cities. Smart Cities 2021, 4, 93–111. [Google Scholar] [CrossRef]
- Abdelfattah, L.; Deponte, D.; Fossa, G. The 15-Minute City: Interpreting the Model to Bring out Urban Resiliencies. Transp. Res. Procedia 2022, 60, 330–337. [Google Scholar] [CrossRef]
- Ferrer-Ortiz, C.; Marquet, O.; Mojica, L.; Vich, G. Barcelona under the 15-Minute City Lens: Mapping the Accessibility and Proximity Potential Based on Pedestrian Travel Times. Smart Cities 2022, 5, 146–161. [Google Scholar] [CrossRef]
- Pozoukidou, G.; Chatziyiannaki, Z. 15-Minute City: Decomposing the New Urban Planning Eutopia. Sustainability 2021, 13, 928. [Google Scholar] [CrossRef]
- 15-Minute City|Deloitte Global. Available online: https://www.deloitte.com/global/en/Industries/government-public/perspectives/urban-future-with-a-purpose/15-minute-city.html (accessed on 21 February 2023).
- Gaglione, F.; Gargiulo, C.; Zucaro, F.; Cottrill, C. Urban Accessibility in a 15-Minute City: A Measure in the City of Naples, Italy. Transp. Res. Procedia 2022, 60, 378–385. [Google Scholar] [CrossRef]
- Guzman, L.A.; Arellana, J.; Oviedo, D.; Moncada Aristizábal, C.A. COVID-19, Activity and Mobility Patterns in Bogotá. Are We Ready for a ‘15-Minute City’? Travel Behav. Soc. 2021, 24, 245–256. [Google Scholar] [CrossRef]
- Yeung, P. How “15-Minute Cities” Will Change the Way We Socialise. Available online: https://www.bbc.com/worklife/article/20201214-how-15-minute-cities-will-change-the-way-we-socialise (accessed on 21 February 2023).
- Monteiro, J.; Sousa, N.; Natividade-Jesus, E.; Coutinho-Rodrigues, J. Benchmarking City Layouts—A Methodological Approach and an Accessibility Comparison between a Real City and the Garden City. Sustainability 2022, 14, 5029. [Google Scholar] [CrossRef]
- Monteiro, J.; Sousa, N.; Natividade-Jesus, E.; Coutinho-Rodrigues, J. The Potential Impact of Cycling on Urban Transport Energy and Modal Share: A GIS-Based Methodology. ISPRS Int. J. Geo-Inf. 2023, 12, 48. [Google Scholar] [CrossRef]
- Schläpfer, M.; Dong, L.; O’Keeffe, K.; Santi, P.; Szell, M.; Salat, H.; Anklesaria, S.; Vazifeh, M.; Ratti, C.; West, G.B. The Universal Visitation Law of Human Mobility. Nature 2021, 593, 522–527. [Google Scholar] [CrossRef] [PubMed]
- Handy, S. Is Accessibility an Idea Whose Time Has Finally Come? Transp. Res. Part D Transp. Environ. 2020, 83, 102319. [Google Scholar] [CrossRef]
- GOV.UK. NTS0403: Average Number of Trips, Miles and Time SPENT Travelling by TRIP Purpose: England, Statistical Data Set—Purpose of Travel. Available online: https://www.gov.uk/government/statistical-data-sets/nts04-purpose-of-trips (accessed on 8 March 2023).
- Geurs, K.T.; van Wee, B. Accessibility Evaluation of Land-Use and Transport Strategies: Review and Research Directions. J. Transp. Geogr. 2004, 12, 127–140. [Google Scholar] [CrossRef]
- Nassauer, J.I.; Raskin, J. Urban Vacancy and Land Use Legacies: A Frontier for Urban Ecological Research, Design, and Planning. Landsc. Urban Plan. 2014, 125, 245–253. [Google Scholar] [CrossRef]
- Buitelaar, E.; Moroni, S.; De Franco, A. Building Obsolescence in the Evolving City. Reframing Property Vacancy and Abandonment in the Light of Urban Dynamics and Complexity. Cities 2021, 108, 102964. [Google Scholar] [CrossRef]
- Loures, L.; Vaz, E. Exploring Expert Perception towards Brownfield Redevelopment Benefits According to Their Typology. Habitat Int. 2018, 72, 66–76. [Google Scholar] [CrossRef]
- Greenberg, M.; Lowrie, K.; Mayer, H.; Miller, K.T.; Solitare, L. Brownfield Redevelopment as a Smart Growth Option in the United States. Environmentalist 2001, 21, 129–143. [Google Scholar] [CrossRef]
- Brownfields Redevelopment and the Quest for Sustainability. Available online: https://books.emeraldinsight.com/page/detail/brownfields-redevelopment-and-the-quest-for-sustainability-christopher-de-sousa/?k=9780080453583 (accessed on 21 February 2023).
- Sanches, P.M.; Mesquita Pellegrino, P.R. Greening Potential of Derelict and Vacant Lands in Urban Areas. Urban For. Urban Green. 2016, 19, 128–139. [Google Scholar] [CrossRef]
- Adaptive Reuse of Abandoned Monumental Buildings as a Strategy for Urban Liveability. Available online: https://iris.unica.it/handle/11584/120199# (accessed on 21 February 2023).
- Tavakoli, H.; Marzbali, M.H. Urban Public Policy and the Formation of Dilapidated Abandoned Buildings in Historic Cities: Causes, Impacts and Recommendations. Sustainability 2021, 13, 6178. [Google Scholar] [CrossRef]
- Portal Do INE. Available online: https://www.ine.pt/xportal/xmain?xpgid=ine_main&xpid=INE&xlang=pt (accessed on 12 January 2023).
- Boisjoly, G.; El-Geneidy, A.M. The Insider: A Planners’ Perspective on Accessibility. J. Transp. Geogr. 2017, 64, 33–43. [Google Scholar] [CrossRef]
- Ryan, J.; Pereira, R.H.M. What Are We Missing When We Measure Accessibility? Comparing Calculated and Self-Reported Accounts among Older People. J. Transp. Geogr. 2021, 93, 103086. [Google Scholar] [CrossRef]
- Zhou, L.; Shen, G.; Wu, Y.; Brown, R.; Chen, T.; Wang, C. Urban Form, Growth, and Accessibility in Space and Time: Anatomy of Land Use at the Parcel-Level in a Small to Medium-Sized American City. Sustainability 2018, 10, 4572. [Google Scholar] [CrossRef] [Green Version]
- Straatemeier, T.; Bertolini, L. Joint Accessibility Design: Framework Developed with Practitioners to Integrate Land Use and Transport Planning in the Netherlands. Transp. Res. Rec. 2008, 2077, 1–8. [Google Scholar] [CrossRef]
- Sousa, N.; Natividade-Jesus, E.; Coutinho-Rodrigues, J. Bike-Index—Um índice de acessibilidade velocípede recorrendo a programação em ambiente SIG. Rev. Ciências Comput. 2018, 13, 67–88. [Google Scholar] [CrossRef]
- Jiao, H.; Li, C.; Yu, Y.; Peng, Z. Urban Public Green Space Equity against the Context of High-Speed Urbanization in Wuhan, Central China. Sustainability 2020, 12, 9394. [Google Scholar] [CrossRef]
- Wang, F. Modeling Commuting Patterns in Chicago in a GIS Environment: A Job Accessibility Perspective. Prof. Geogr. 2000, 52, 120–133. [Google Scholar] [CrossRef] [Green Version]
- Campbell, M.J.; Dennison, P.E.; Butler, B.W.; Page, W.G. Using Crowdsourced Fitness Tracker Data to Model the Relationship between Slope and Travel Rates. Appl. Geogr. 2019, 106, 93–107. [Google Scholar] [CrossRef]
- Flügel, S.; Hulleberg, N.; Fyhri, A.; Weber, C.; Ævarsson, G. Empirical Speed Models for Cycling in the Oslo Road Network. Transportation 2019, 46, 1395–1419. [Google Scholar] [CrossRef] [Green Version]
- Parkin, J.; Rotheram, J. Design Speeds and Acceleration Characteristics of Bicycle Traffic for Use in Planning, Design and Appraisal. Transp. Policy 2010, 17, 335–341. [Google Scholar] [CrossRef]
- Instituto Nacional de Estatistica, Censos 2011. Available online: https://censos.ine.pt/xportal/xmain?xpid=CENSOS&xpgid=censos2011_apresentacao (accessed on 21 February 2023).
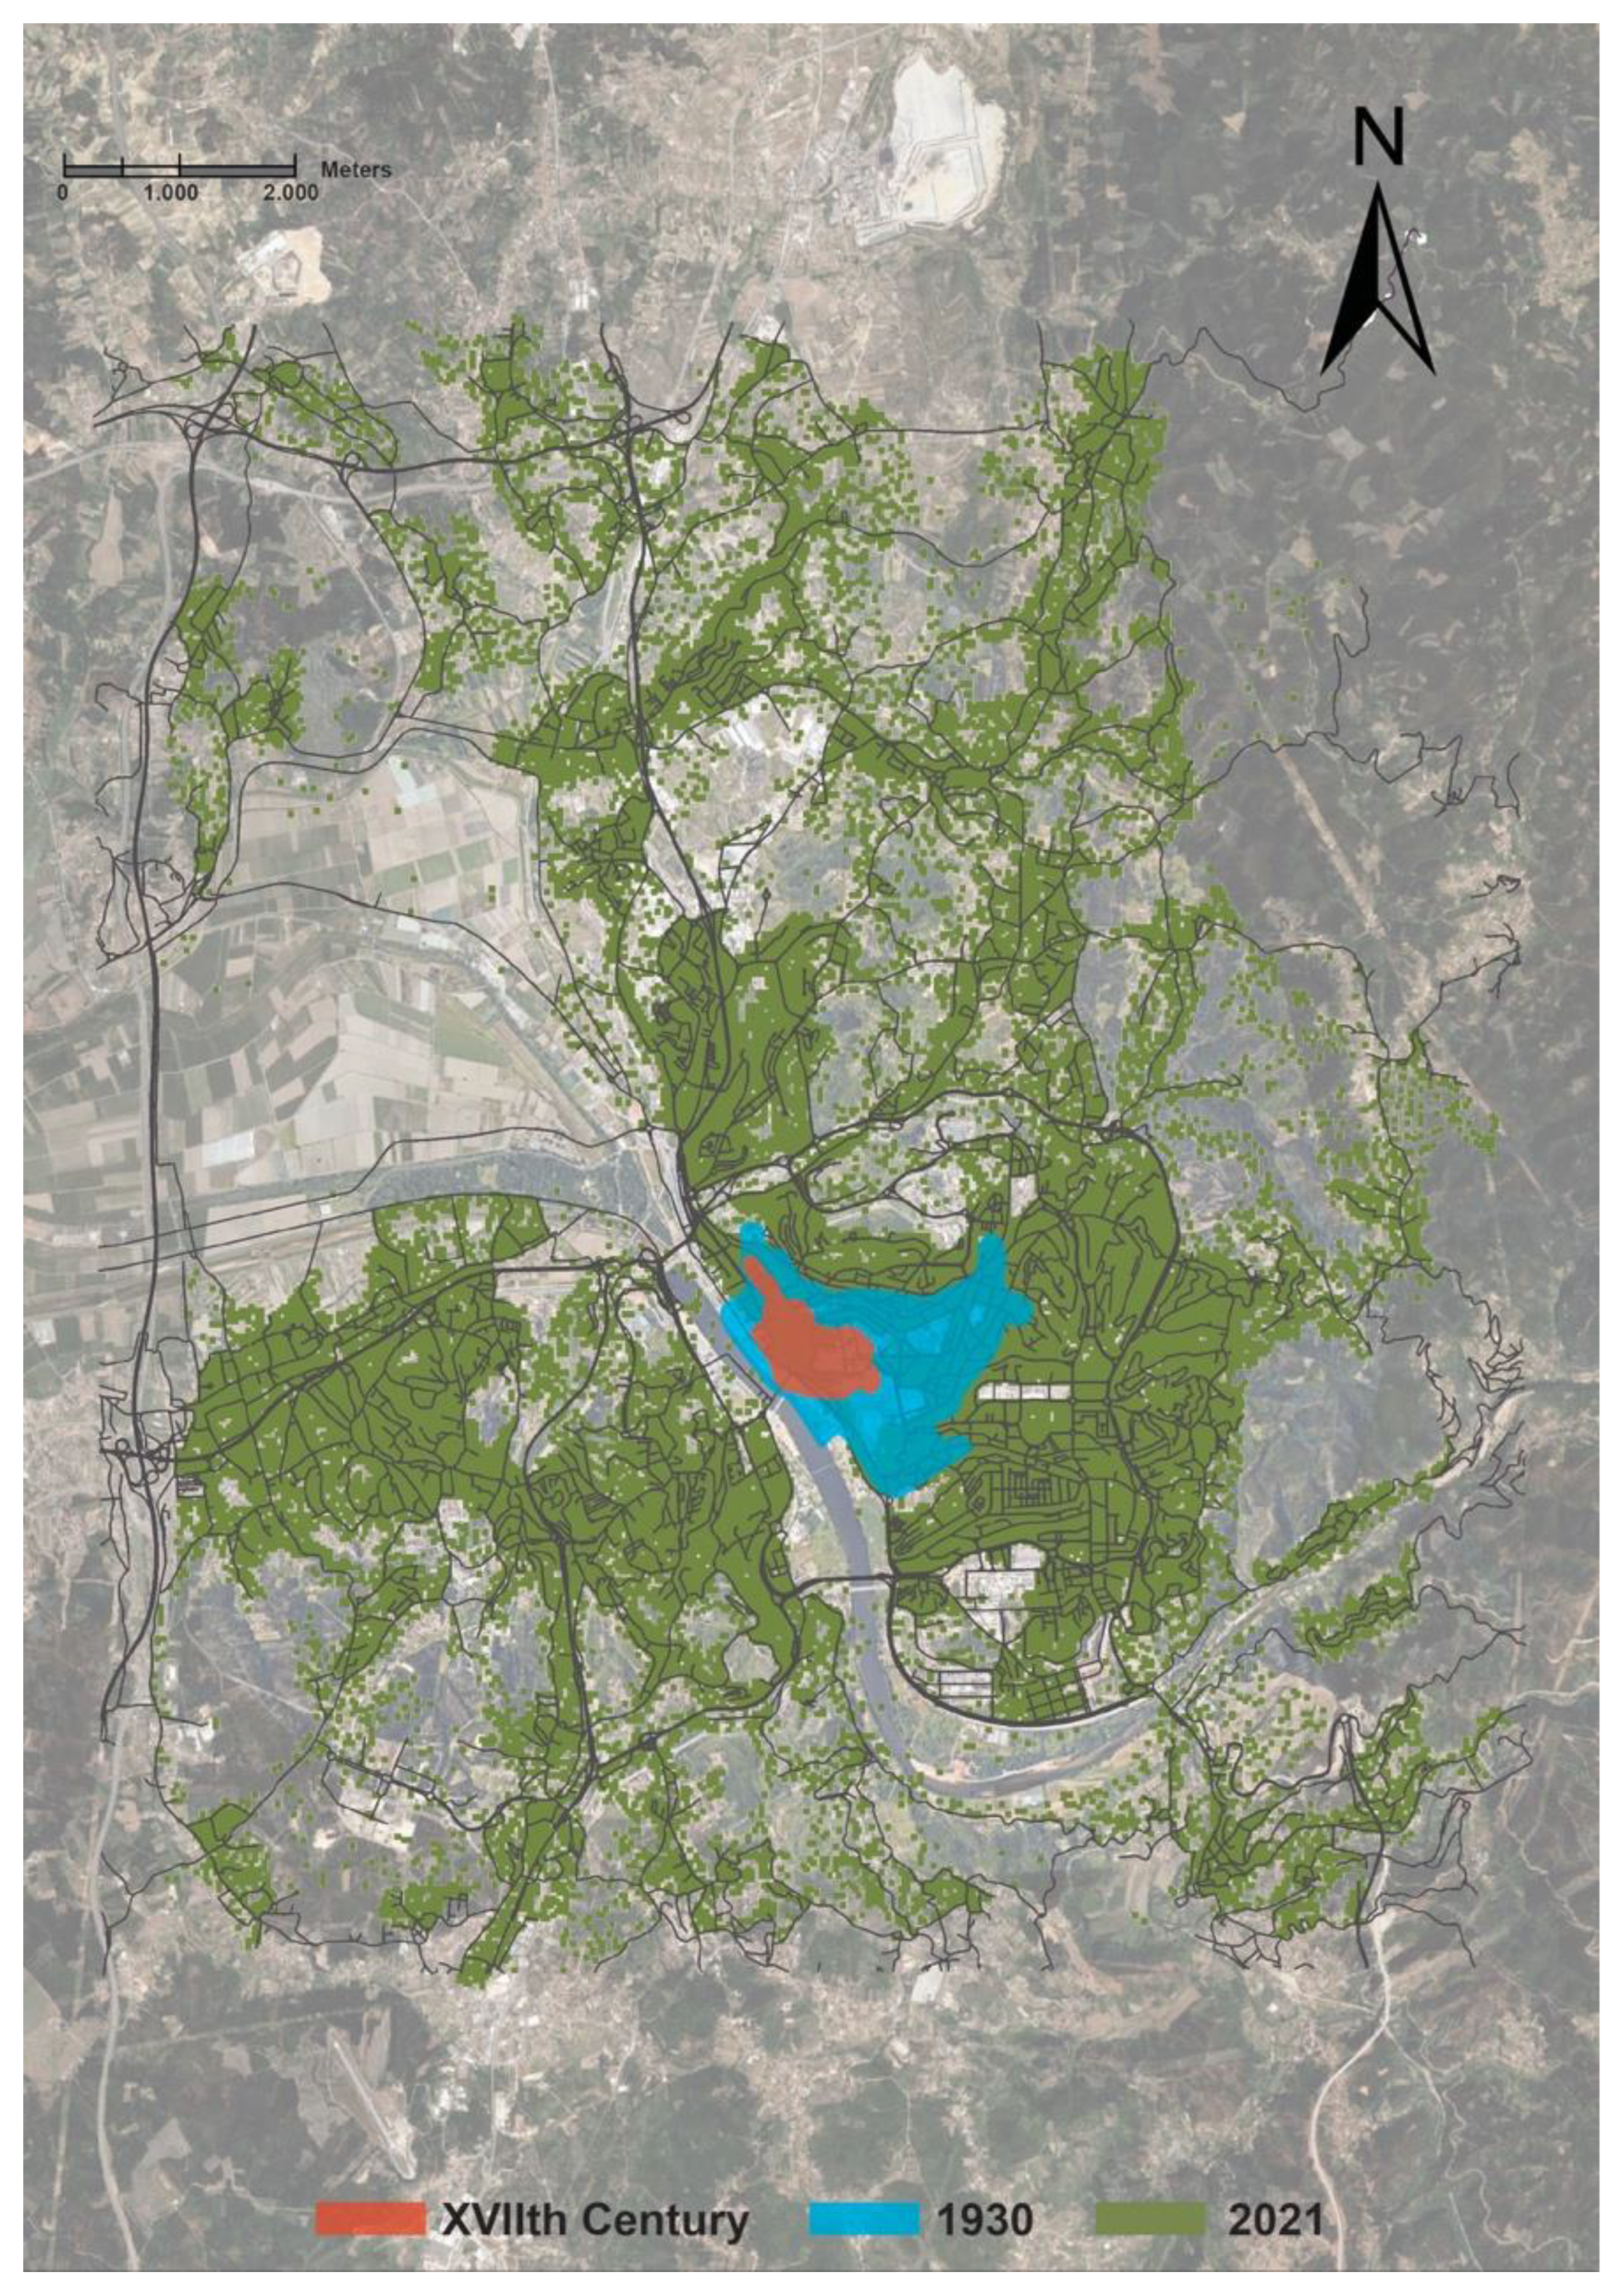
- Manta, V.; França, P.; GONÇALVES, J.A. Tratamento e Difusão da Cartografia Histórica na Câmara Municipal de Coimbra. VII IBERCARTO—Encontro do Grupo de Trabalho de Cartotecas Públicas Luso-Espanholas, Porto, Faculdade de Ciências da Universidade do Porto, 15–17 de novembro de 2018. Available online: https://www.fc.up.pt/biblioteca/ibercarto/storage/docs/programa/tratamento-e-difusao-da-cartografia-historica-na-camara-municipal-de-coimbra.pdf (accessed on 8 March 2023).
- Calmeiro, M.I.B.R. Urbanismo Antes dos Planos: Coimbra 1834—1934, Coimbra, 2015. Tese de Doutoramento em Arquitetura, na Especialidade de Teoria e História da Arquitetura Apresentada ao Departamento de Arquitetura da Faculdade de Ciências e Tecnologia da Universidade de Coimbra. Available online: https://estudogeral.uc.pt/bitstream/10316/11794/1/Coimbra%20Cidade%20Verde.pdf (accessed on 8 March 2023).
- Câmara Municipal de Coimbra. História da Cidade. Available online: https://www.cm-coimbra.pt/areas/viver/a-cidade/historia/historia-da-cidade (accessed on 8 March 2023).
- Ribeiro, A.; Neto, M. Olhares Historiográficos Sobre a Cidade de Coimbra Na Época Moderna. In Proceedings of the II Congresso Histórico Internacional, Guimarães, Portugal, 1 December 2019. [Google Scholar]
- INE 1930 Portuguese Population Census. Available online: https://www.ine.pt/xportal/xmain?xpid=INE&xpgid=ine_publicacoes&PUBLICACOESpub_boui=72364315&PUBLICACOESmodo=2 (accessed on 3 March 2023).
- Metro Mondego. Available online: https://www.metromondego.pt/pt/home (accessed on 19 February 2023).
- Pais, F.; Monteiro, J.; Sousa, N.; Coutinho-Rodrigues, J.; Natividade-Jesus, E. A Multicriteria Methodology for Maintenance Planning of Cycling Infrastructure. Proc. Inst. Civ. Eng.—Eng. Sustain. 2022, 175, 248–264. [Google Scholar] [CrossRef]
- Energy Intensity of Passenger Transport Modes, 2018—Charts—Data & Statistics. Available online: https://www.iea.org/data-and-statistics/charts/energy-intensity-of-passenger-transport-modes-2018 (accessed on 12 January 2023).
- Buehler, R.; Pucher, J.; Bauman, A. Physical Activity from Walking and Cycling for Daily Travel in the United States, 2001–2017: Demographic, Socioeconomic, and Geographic Variation. J. Transp. Health 2020, 16, 100811. [Google Scholar] [CrossRef]
- Hsu, C.-I.; Tsai, Y.-C. An Energy Expenditure Approach for Estimating Walking Distance. Environ. Plan. B Plan. Des. 2014, 41, 289–306. [Google Scholar] [CrossRef]
- Yang, Y.; Diez-Roux, A.V. Walking Distance by Trip Purpose and Population Subgroups. Am. J. Prev. Med. 2012, 43, 11–19. [Google Scholar] [CrossRef] [Green Version]
- Cunha, J. Avaliação Do Desempenho de Infraestruturas Pedonais Em Meio Urbano Com Técnicas de Análise Multicritério. Master’s Thesis, FCTUC, University of Coimbra, Coimbra, Portugal, 2011. [Google Scholar]
- Boele-Vos, M.J.; Commandeur, J.J.F.; Twisk, D.A.M. Effect of Physical Effort on Mental Workload of Cyclists in Real Traffic in Relation to Age and Use of Pedelecs. Accid. Anal. Prev. 2017, 105, 84–94. [Google Scholar] [CrossRef]
- Gerike, R.; Parkin, J. Cycling Futures: From Research into Practice; Routledge: London, UK, 2016; ISBN 978-1-315-57574-2. [Google Scholar]
- Rudolph, F. Promotion of Pedelecs as a Means to Foster Low-Carbon Mobility: Scenarios for the German City of Wuppertal. Transp. Res. Procedia 2014, 4, 461–471. [Google Scholar] [CrossRef] [Green Version]
- Brueckner, J.K. Urban Sprawl: Diagnosis and Remedies. Int. Reg. Sci. Rev. 2000, 23, 160–171. [Google Scholar] [CrossRef]
- Tannier, C.; Vuidel, G.; Houot, H.; Frankhauser, P. Spatial Accessibility to Amenities in Fractal and Nonfractal Urban Patterns. Environ. Plan. B Plan. Des. 2012, 39, 801–819. [Google Scholar] [CrossRef]
- Leyden, K.M.; Goldberg, A.; Michelbach, P. Understanding the Pursuit of Happiness in Ten Major Cities. Urban Aff. Rev. 2011, 47, 861–888. [Google Scholar] [CrossRef]
- Mouratidis, K.; Ettema, D.; Næss, P. Urban Form, Travel Behavior, and Travel Satisfaction. Transp. Res. Part A Policy Pract. 2019, 129, 306–320. [Google Scholar] [CrossRef]
- Leach, F.; Kalghatgi, G.; Stone, R.; Miles, P. The Scope for Improving the Efficiency and Environmental Impact of Internal Combustion Engines. Transp. Eng. 2020, 1, 100005. [Google Scholar] [CrossRef]
- Roberts, A.; Brooks, R.; Shipway, P. Internal Combustion Engine Cold-Start Efficiency: A Review of the Problem, Causes and Potential Solutions. Energy Convers. Manag. 2014, 82, 327–350. [Google Scholar] [CrossRef] [Green Version]
- Fitzgibbons, J.; Mitchell, C.L. Just Urban Futures? Exploring Equity in “100 Resilient Cities”. World Dev. 2019, 122, 648–659. [Google Scholar] [CrossRef]
- Sousa, N.; Monteiro, J.; Natividade-Jesus, E.; Coutinho-Rodrigues, J. The Impact of Geometric and Land Use Elements on the Perceived Pleasantness of Urban Layouts. Environ. Plan. B Urban Anal. City Sci. 2022, 23998083221129880. [Google Scholar] [CrossRef]


| Weight 1 Facilities | Weight 2 Facilities | Weight 3 Facilities |
|---|---|---|
| Post offices *II | High schools I | Kindergartens *II |
| Sports facilities I | Shopping centres II | Primary schools *II |
| Cultural organizations I | Entertainment sites I | Middle schools *I |
| Universities and institutes I | Primary healthcare services *I | Grocery stores II |
| Elderly care centres I | Pharmacies *II | Supermarkets II |
| Churches I | Restaurants I | Bakeries and pastries II |
| Parks and green areas *I |
| Apartment Typology | Fraction | Minimum Private Area * (m2) | Average Inhabitants |
|---|---|---|---|
| T0 (studio) | 2% | 35 | 1 |
| T1 (one bedroom) | 9% | 52 | 2 |
| T2 (two bedrooms) | 32% | 72 | 3 |
| T3 (three bedrooms) | 36% | 91 | 4 |
| T4 (four bedrooms) | 13% | 105 | 5 |
| T5+ (five+ bedrooms) | 9% | 122 | 6 |
| Year | Population | Population Increase | Area (ha) | Area Increase | Population Density (inhab./km2) |
|---|---|---|---|---|---|
| 17th Century | Circa 12,000 | N/A | 43 | N/A | 27,907 |
| 1930 | 36,021 | 200% | 170 | 295% | 21,189 |
| 2021 | 104,464 | 190% | 8700 | 5018% | 1201 |
| Indicator | Compact Coimbra | Notes |
|---|---|---|
| City area | 16,732 m2 | Coimbra: 141,720 m2 |
| New buildings | 636 | New land plots: 196 |
| New building area | 296,910 m2 | Gross floor area: circa 1,300,000 m2 |
| Moved population | 54,469 inhab. | 52% of total population |
| Average residents per building | 86 | |
| Average building floors | 4.5 floors | |
| Living space per inhabitant | 24 m2 | Coimbra: 47 m2 |
| Accessibility (m) | Urban Facilities | Urban Facilities Plus Jobs | ||
|---|---|---|---|---|
| Coimbra | Compact Cbr. | Coimbra | Compact Cbr. | |
| Min | 268 | 252 | 1063 | 948 |
| Max | 8099 | 1746 | 9329 | 3092 |
| Average | 1936 | 594 | 3088 | 1491 |
| Average per inhabit. | 1440 | 638 | 2533 | 1570 |
| Standard deviation | 1352 | 188 | 1483 | 280 |
| Coeff. of variation | 70% | 32% | 48% | 19% |
| 15-Min City (%) (Facilities Plus Jobs) | Walking | Walking and Cycling | ||
| Coimbra | Compact Cbr. | Coimbra | Compact Cbr. | |
| Min | 0.0 | 6.7 | 0.0 | 69.1 |
| Max | 71.3 | 76.3 | 91.8 | 100 |
| Average | 22.5 | 61.6 | 66.3 | 88.5 |
| Average per inhabit. | 30.2 | 58.0 | 71.1 | 85.0 |
| Standard deviation | 20.1 | 8.9 | 19.7 | 5.7 |
| Coeff. of variation | 95% | 15% | 30% | 7% |
| Active Modal Share (%) (Facilities Plus Jobs) | Walking | Walking Plus Cycling | ||
|---|---|---|---|---|
| Coimbra | Compact Cbr. | Coimbra | Compact Cbr. | |
| Min | 0.5 | 5.6 | 3.5 | 28.9 |
| Max | 48.0 | 48.7 | 73.7 | 76.3 |
| Average | 12.7 | 28.1 | 35.6 | 61.6 |
| Average per inhabit. | 16.8 | 25.6 | 42.6 | 58.0 |
| Standard deviation | 10.6 | 7.4 | 18.7 | 7.2 |
| Coeff. of variation | 83% | 26% | 53% | 12% |
| Transp. Energy (MJ/p.t.) (Facilities Plus Jobs) | Active: Walking | Active: Walking Plus Cycling | ||
|---|---|---|---|---|
| Coimbra | Compact Cbr. | Coimbra | Compact Cbr. | |
| Min | 0.690 | 0.605 | 0.190 | 0.132 |
| Max | 36.340 | 7.365 | 35.370 | 5.491 |
| Average | 8.180 | 2.056 | 6.700 | 0.954 |
| Average per inhabit. | 5.901 | 2.254 | 4.533 | 1.103 |
| Standard deviation | 6.210 | 0.830 | 6.170 | 0.578 |
| Coeff. of variation | 76% | 40% | 92% | 61% |
| Indicator | Statistics | |||||||
|---|---|---|---|---|---|---|---|---|
| Facilities | Facilities + jobs | |||||||
| Accessibility (m) | Coimbra | Compact Coimbra | Reduction (m) | Reduction (%) | Coimbra | Compact Coimbra | Reduction (m) | Reduction (%) |
| Avg. | 1936 | 594 | 1342 | 69% | 3088 | 1491 | 1597 | 52% |
| Avg. per inhab. | 1440 | 638 | 802 | 56% | 2533 | 1570 | 963 | 38% |
| Walking | Walking + Cycling | |||||||
| 15-min city (%) (Facilities + jobs) | Coimbra | Coimbra compact | Increase | Increase (%) | Coimbra | Coimbra compact | Increase | Increase (%) |
| Avg. | 22.5 | 61.6 | 39.1 | 174% | 66.3 | 88.5 | 22.2 | 33% |
| Avg. per inhab. | 30.2 | 58 | 27.8 | 92% | 71.1 | 85 | 13.9 | 20% |
| Walking | Walking + Cycling | |||||||
| Active modal share (%) (Fac. + jobs) | Coimbra | Coimbra compact | Increase | Increase (%) | Coimbra | Coimbra compact | Increase | Increase (%) |
| Avg. | 12.7 | 28.1 | 15.4 | 121% | 35.6 | 61.6 | 26 | 73% |
| Avg. per inhab. | 16.8 | 25.6 | 8.8 | 52% | 42.6 | 58 | 15.4 | 36% |
| Walking | Walking + Cycling | |||||||
| Transport energy (MJ/p.t.) (Fac. + jobs) | Coimbra | Coimbra compact | Reduction (MJ/p.t.) | Reduction (%) | Coimbra | Coimbra compact | Reduction (MJ/p.t.) | Reduction (%) |
| Avg. | 8.18 | 2.056 | 6.124 | 75% | 6.7 | 0.954 | 5.746 | 86% |
| Avg. per inhab. | 5.901 | 2.254 | 3.647 | 62% | 4.533 | 1.103 | 3.43 | 76% |
Disclaimer/Publisher’s Note: The statements, opinions and data contained in all publications are solely those of the individual author(s) and contributor(s) and not of MDPI and/or the editor(s). MDPI and/or the editor(s) disclaim responsibility for any injury to people or property resulting from any ideas, methods, instructions or products referred to in the content. |
© 2023 by the authors. Licensee MDPI, Basel, Switzerland. This article is an open access article distributed under the terms and conditions of the Creative Commons Attribution (CC BY) license (https://creativecommons.org/licenses/by/4.0/).
Share and Cite
Monteiro, J.; Para, M.; Sousa, N.; Natividade-Jesus, E.; Ostorero, C.; Coutinho-Rodrigues, J. Filling in the Spaces: Compactifying Cities towards Accessibility and Active Transport. ISPRS Int. J. Geo-Inf. 2023, 12, 120. https://doi.org/10.3390/ijgi12030120
Monteiro J, Para M, Sousa N, Natividade-Jesus E, Ostorero C, Coutinho-Rodrigues J. Filling in the Spaces: Compactifying Cities towards Accessibility and Active Transport. ISPRS International Journal of Geo-Information. 2023; 12(3):120. https://doi.org/10.3390/ijgi12030120
Chicago/Turabian StyleMonteiro, João, Marvin Para, Nuno Sousa, Eduardo Natividade-Jesus, Carlo Ostorero, and João Coutinho-Rodrigues. 2023. "Filling in the Spaces: Compactifying Cities towards Accessibility and Active Transport" ISPRS International Journal of Geo-Information 12, no. 3: 120. https://doi.org/10.3390/ijgi12030120