
Skyline-Based Sorting Approach for Rail Transit Stations Visualization

1
The College of Computer Science, Beijing University of Technology, Beijing 100124, China
2
Art College, Hebei Normal University of Science and Technology, Qinhuangdao 066004, China
*
Author to whom correspondence should be addressed.
ISPRS Int. J. Geo-Inf. 2023, 12(3), 110; https://doi.org/10.3390/ijgi12030110
Submission received: 15 December 2022
/
Revised: 22 February 2023
/
Accepted: 26 February 2023
/
Published: 6 March 2023
Abstract
:Urban rail transit is an essential part of the urban public transportation system. The reasonable spatial data visualization of urban rail transit stations can provide a more intuitive way for the majority of travelers to arrange travel plans and find destinations. The map service of rail transit stations generated by data visualization has gradually become indispensable information guidance in the rail transit system. The existing map service icons block each other when the scale changes, and new stations cannot be displayed dynamically when users drag the map. This paper uses filtering and sorting methods to dynamically query and visualize the relatively more important transportation stations within the users’ visible range, so as to solve the above problems and provide people with better transportation services. Our method introduces three constraints: spatial diversity, time-sharing passenger flow analysis and whether it is a transit station, and calculates the scores of constraint relationships of feature objects to evaluate stations. On the basis of the skyline query, the scores of feature objects are combined and sorted to obtain an ordered object set of the most interesting k points(top-k POIs), and the rail transit stations are dynamically retrieved and visualized. Before sorting POIs, we filter out POIs that need to be fitted, so that only the k most representative POIs in the currently visible range are displayed. When the map scale changes, the displayed POIs are updated. Finally, through the statistics of efficiency calculation of this method under different scales and centers, combined with users’ evaluations, it was proved that our method could better display critical information and improve user experience.
1. Introduction
Nowadays, with the rapid growth of the global economy, the construction of urban rail transit has developed rapidly. Urban rail transit greatly improves people’s travel modes, fundamentally improves the quality and standard of urban life, and has a significant impact on the development of the urban economy and society [1]. In order to meet the needs of urban travel, people draw rail transit layers on the electronic map and visually display rail lines and transit stations on the map [2]. As urban rail transit becomes a critical part of urban life, rail transit map services also play an essential role in people’s daily lives. When millions of people come in and out of this complicated transportation system every day, the rail transit information map, as the primary and critical visual information element, plays the role of guidance in the whole rail transit system. Passengers can locate and find stations, as well as arrange and estimate their journey through the map, which significantly improves the users’ travel efficiency [3].
Although the existing map services visualize each site’s geographic information, their main focus is to show all results for users [4], which leads to the unreasonable display of information in the rail transit layer. In the visible range of the map, the station icons are often covered and overlap each other, which not only affects the user’s perception, but, more importantly, it means the user cannot clearly identify the site, which increases the user’s inconvenience. In the case of constant scale, if users execute the operation of dragging the map, the map query stations do not change, and so the display of the stations cannot meet the users’ needs. Moreover, when the scale is zoomed in to view finer details of a map, the sites are not queried again, and the surrounding sites cannot be displayed accurately. When the scale is reduced, the icons are stacked, and the information cannot be displayed reasonably [5].
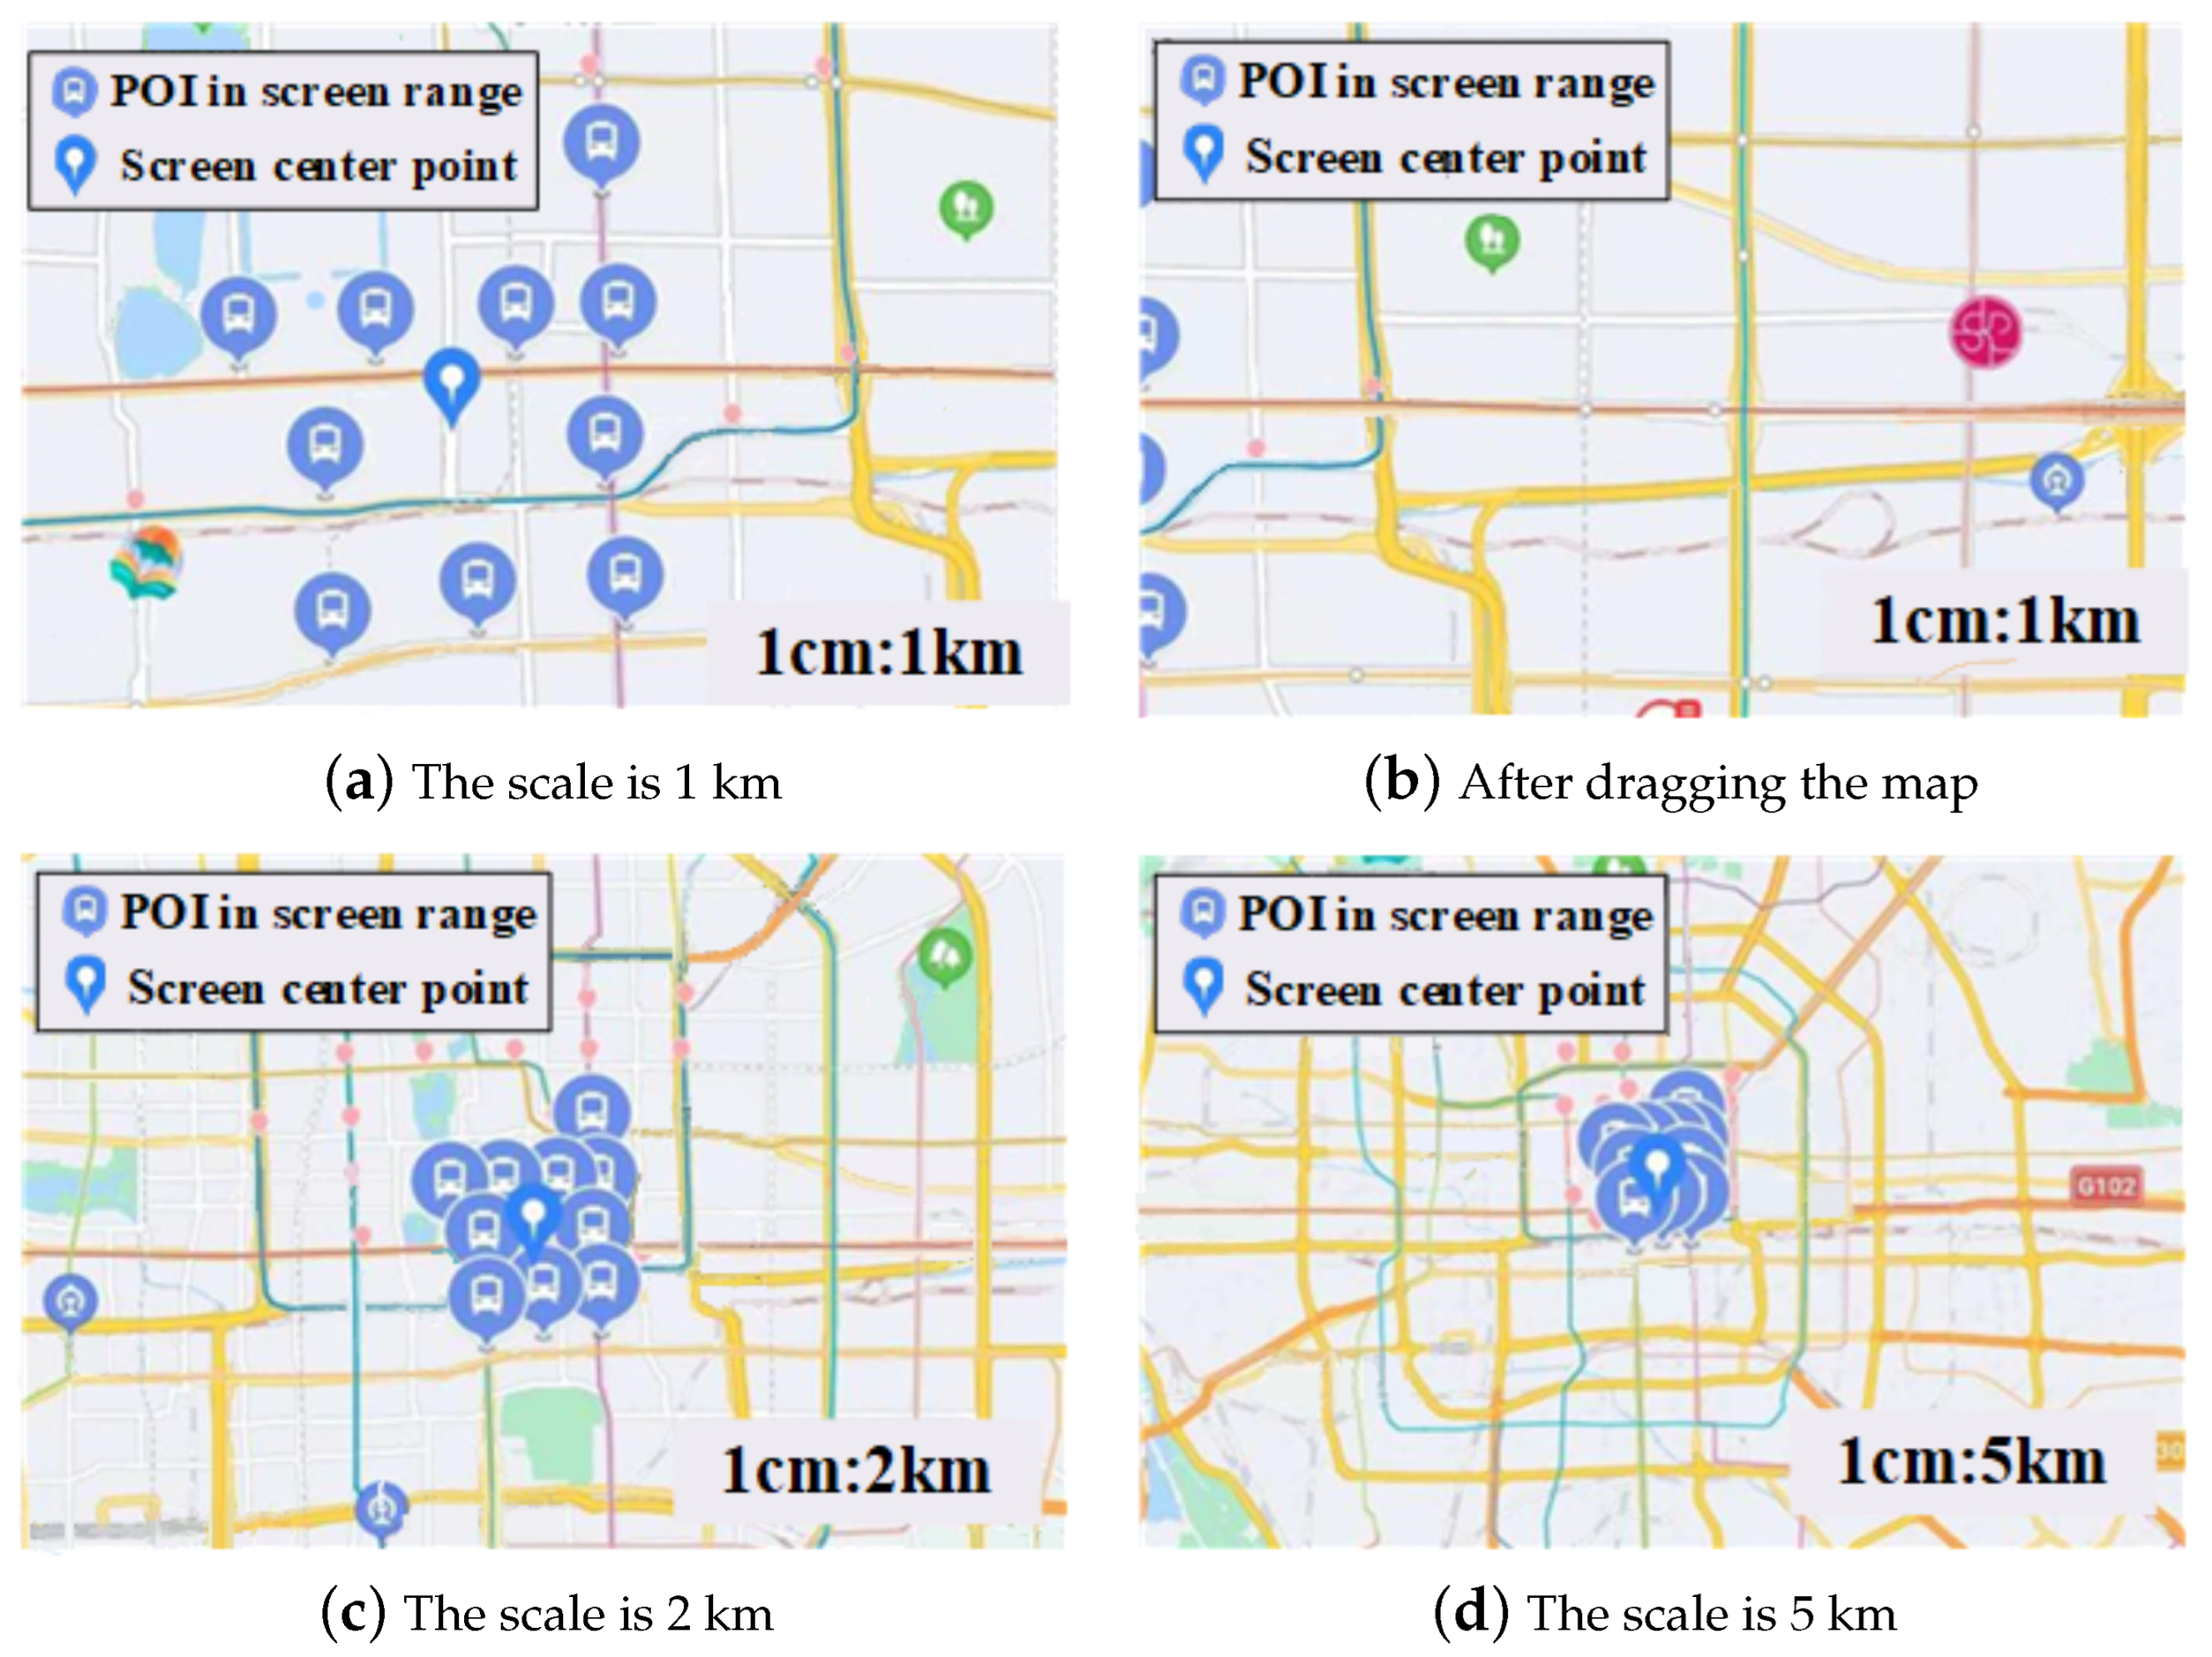
As shown in Figure 1, when the scale of the Baidu map (https://map.baidu.com (accessed on 2 November 2022)) is 1 km, the display scale of the surrounding subway stations on the map is 1 cm: 1 km. In Figure 1b, the center point of the map changes, but the display of surrounding stations does not change with the change of the center point. Figure 1c,d show different degrees of occlusion when the scales are 2 km and 5 km, respectively. It can be seen that the information displayed in Figure 1b–d is unreasonable. In order to give full play to the role of the rail transit map as information guidance for the urban public transport system, and to facilitate passengers arranging their traveling plans more intuitively, this paper paid more attention to the display of key information, and the less critical rail transit stations could be omitted. In this paper, the main improvements to the visualization of rail transit stations are summarized as follows: (1) The display offered in this paper covers a reasonable number of subway stations on different scales of the map, and there is no overlapping between the selected objects’ text labels, so as to improve the user experience; (2) It is necessary to dynamically display the new stations when the scale is constant but the center point changes. At the same time, the number of surrounding stations should be reasonable. (3) When the center point remains constant but the scale changes, the demand for dynamic display of stations must be met, and the number of stations must change with the change of the map scale.
Rail transit stations are important visual elements in rail transit maps and the display of key sites is essential. Only a small number of representative POIs (represented by k) in a certain area on the online map are displayed at a certain scale. In the visible range of the user’s current area, k objects need to be effectively selected [6,7].
In the evaluation of urban rail transit stations, the location, passenger flow, transfer and other characteristics of the stations affect the importance of the stations in the current screen range. It is necessary to analyze the urban rail transit stations from a more comprehensive and multi-dimensional perspective. First of all, in terms of spatial distribution, most spatial searches for spatial data sets are sorted according to the distance, and k points closest to the search point are preferentially selected to form the result set, which may cause the phenomenon of results gathering in a certain direction. Sorting may only consider the weight size of the points to be sorted, which may also lead to the aggregation of results in a certain spatial distribution. Therefore, it is necessary to employ spatial constraints based on spatial distribution to improve the quality of search results. Secondly, station passenger flow data is the most intuitive reflection of the mobility of urban residents, and passenger flow analysis is also an effective method to evaluate rail transit stations [8]. Through the analysis of passenger flow at subway stations, we can better understand the spatial form and evolution of the city. Thirdly, the transfer nodes (transfer stations) are direct connections between passengers and between tracks. The transfer function can not only realize resource sharing and linkage between rail transit and other public transport modes, but also it functions as an important node to realize passenger flow distribution, transfer, guidance and other functions of the transfer station [9]. It can be seen that the transfer station has a greater influence on the whole urban rail transit network.
How to select the information that best meets the query conditions from a large amount of data has always been an important topic in data management and information retrieval. This is because when facing of multi-dimensional data, it is impossible to ensure which dimension is relatively important (that is, it cannot be directly compared between different dimensions), and then it is impossible to determine an optimal choice. In order to solve this problem, a calculation method of Skyline, based on the multi-objective optimization problem, is proposed [10]. Aiming at the large scale and high dimensional characteristics of rail transit station data, the recommendation of the stations can be abstracted as a multi-objective optimization problem. Skyline query can centrally extract the data contour from a large number of high-dimension rail transit station data, and query in each dimension on the basis of not dividing the correlation relationship among various attributes. Unlike traditional Skyline queries, that only consider static attributes of the object (for example, restaurant ratings and prices), the spatial diversity attributes and passenger flow similarity attributes of the stations on which the Skyline point defined in this paper is based are dynamically calculated according to the user’s query. Therefore, the results depend on the data and the given queries, applicable to the objectives of dynamic searching of spatial data under different regions at different scaling levels.
However, the Skyline query may obtain fewer, or more, Skyline objects. How to quickly help users find the most relevant objects is a question worth discussing. Top-k query processing is an important technology in applications involving large amounts of data interaction. Top-k query allows users to specify a monotone function for each query, which aggregates a certain number of object features into a single score that defines the total order, retrieving an ordered object set of the best k objects. To achieve this, we leverage the intrinsic relationship between the attributes of top-k and Skyline objects. Our method is based on the novel use of Skyline arithmetic to answer the first k queries. After the Skyline calculation filters out a set of points meeting the requirements, based on a large number of evaluation points, the maximum value of the aggregate values of the three attributes is taken to obtain the most representative stations. After joining the selected queue, the top-k result set is gradually retrieved according to this queue.
In order to avoid some important stations being ignored, our method performs preprocesses, data cleaning and other operations on the existing data sets, and quantifies and normalizes the three dimensions of spatial constraint, and time-sharing passenger flow analysis, and ascertains whether a station is a transfer station, obtaining the skyline result set of POIs within the screen on three-dimensional attributes. On the basis of a skyline query, we can combine the scores of the constraints of the sites in the skyline result set to evaluate the objects of interest and obtain the -k POIs. The Skyline-based -k sorting method is used to select the k POIs with the highest scores, and the value of k changes with the change of the scale. Before sorting POIs, we determine whether occlusion occurs, and filter it if it occurs. In this way, relatively more important POIs can be screened, and users’ needs can be reasonably satisfied, while maintaining the beautiful display of the stations on the map. When the map scale changes, or the user drags the map, the method is updated, and a new set of representative objects are selected for the new map area.
A huge subway network constitutes the urban underground rail transit system around the world, with several lines crisscrossing, forming massive and complex traffic data information. Due to uneven economic development, population distribution and other factors, the development of rail transit is not balanced, resulting in different and irregular distribution of rail transit stations. However, regardless of the distribution and number of subway stations, the design in this paper can carry out dynamic information retrieval at different scaling levels, which is applicable to more than 140 subway systems around the world.
Most rail transit systems around the world span the entire city, and their audiences are wide. All citizens and external population are their audiences. In London, 70% of its peak traffic volume is diverted and borne by underground traffic. As the key page of the rail transit layer, the rail station information page in this study can provide a simple and effective reference for the unfamiliar migrant population and travelers with uncertain destinations to make travel plans, and its information representation design is crucial.
The main contributions of this paper are summarized as follows:
- On the basis of filtering overlapping marks, we propose three constraints which are spatial diversity, time-sharing passenger flow analysis, and whether a station is a transfer station. We also propose a Skyline-based -k sorting method to extract -k POIs from the current visual area.
- Our method implements dynamic retrieval of POIs and visualizes them on the map. When the map is zoomed or panned, we select the new -k POIs as the representative POIs, and the value of k is related to the zoom scale.
- Through experiments on the real data of Beijing rail transit system, combined with users’ objective evaluations of the results, we proved the effectiveness of our proposed method for the display of key information and that our method could improve users’ experiences of the rail transit services.
The rest of this paper is arranged as follows. Section 2 reviews the related research. Section 3 introduces three important constraints for sorting. Section 4 gives the node filtering method and the Skyline-based -k sorting algorithm. In Section 5, the experimental results are explained and analyzed. Finally, Section 6 summarizes the paper and suggests future work.
2. Related Research
With the continuous development of urban rail transit worldwide, scholars from all over the world have continued to research rail transit. The research of this paper involved map visualization and POI display, station sequencing method, and passenger flow analysis of the urban rail transit system. The above three aspects of related researches are introduced in detail in the following three sub-sections.
2.1. Map Visualization and POIs Display
Map visualization systems are playing an increasingly important role in providing users with geographic datasets. Since these datasets can be enormous, map rendering systems usually need to select a small part of data to visualize in a limited space [11]. Although the map visualization of geographic data has been used in many commercial systems (such as Google Maps), their focus is to show results without considering the appropriate balance between the map zoom level and the amount of displayed data [12]. The research in this area mainly focuses on the cartographic generalization of the number of surface features [13,14], so as to select useful information from a large number of cartographic objects, keep them on the map, and discard secondary and unnecessary information. Sarma et al. [15] used integer programming formulae to express, and effectively solve, the problem of refinement of the desired goal and proposed a more effective maximization solution based on DFS traversal of the spatial tree. Kefaloukos et al. [16] combined the declarative language for data reduction with the data compilation process to generate efficient database programs, and all operations were performed entirely in the database process, to transform the data for cartographic visualization. The above research could achieve data reduction on different map zoom levels, but essentially assigned a number to each spatial record, which corresponded to the zoom level of the map. These solutions were for the static display of POIs, which could not dynamically display and filter data for users. This paper provides a solution to dynamically display the data sample set in a specific geographic area and zoom level based on the target dataset.
2.2. Station Sorting Method
The research on station ranking mainly focuses on ranking stations or the importance of stations. In order to evaluate the node importance comprehensively, Liu et al. [17] proposed a multi-attribute ranking method, based on the Technique for Order Preference by Similarity to Ideal Object (TOPSIS), and it performed well in distinguishing the importance of nodes in real complex networks. Tan et al. [18] proposed the node contraction method for the evaluation of node importance in complex networks based on a new evaluation criterion, whereby the most important node was the one whose contraction resulted in the largest increase of the network agglomeration. Xia et al. [19] proposed a novel ranking method of station importance (SIRank) utilizing human mobility patterns and improved the PageRank algorithm. The SIRank focuses on bi-directional passenger flow analysis between origins and destinations to iteratively generate the importance value for each station. The above methods are all based on the network nodes as the research objects to sort the importance of the nodes, and cannot combine the map zoom level and the map center point to select efficient representative objects.
In order to quickly and efficiently return the data that users care about most from the massive data, skyline query has become a hot research spot in the academic world with its intuitive query methods [10,20]. However, if we only use skyline query, it brings the side effect of too many retrieval results (especially for high-dimensional data) [21]. To solve this problem, considering -k queries combined with spatial data [22], Lin et al. [23] proposed an effective 2D spatially accurate algorithm based on dynamic programming, which selects k skyline points to maximize the number of points dominated by at least one of these points. On the basis of skyline calculation, this paper performed -k secondary screening on the skyline result set, and selected objects considered the ‘most interesting’ without caring about the filtered objects. At the same time, it conducted a dynamic search and sorting of spatial data in different regions with different zoom levels.
2.3. The Passenger Flow of Rail Transit Stations
As an important part of public transportation in big cities, the subway plays an important role in alleviating urban traffic congestion and promoting urban transportation’s sustainable development. At present, the research on passenger flow analysis mainly focuses on analysis and prediction. Due to the dynamic and time-varying characteristics of subway passenger flow, scientific analysis and prediction of passenger flow can provide more timely train dispatch and scientific passenger organization. Li et al. [24] presented an algorithm for dynamic correction of this data using the actual number of people entering and exiting the station and actual passenger volume traveling in the main channel. Passenger organization of a transfer station could then be optimized according to the results obtained from this analysis. Through processing the bus trajectory data and the passenger card-swiping records, Huang et al. [25] obtained historical origin–destination data and transfer data and proposed a bus-dispatching model based on passenger flow and arrival time prediction. Zhang et al. [26] used the data collected by the automatic fare collection system, traffic data profiling and feature extraction, and combined this with various external factors, to predict the short-term passenger flows of subway stations. Most of the existing research on passenger flow analysis is mainly used for travel time prediction and rail transit operation scheduling.
From the perspective of use of passenger flow analysis for station ranking, Wei et al. [27] focused on a method using static factors (location, surrounding facilities, etc.) and dynamic characteristics (such as passenger flow, etc.) to classify subway stations. However, this method only roughly classifies the stations, without sorting them. Xia et al. [19] combined station importance with passenger flow analysis, and focused on two-way passenger flow analysis between start and end points to generate the importance value of each station iteratively. For the selection of representative POIs, all of the stations’ locations, passenger flows, and characteristics have a significant impact on the importance of stations. So, the importance of urban rail transit stations should have a richer evaluation system. This paper focused on quantifying the similarity of passenger flow between stations by analyzing the passenger flow data and using it as one of the attributes for the station ranking algorithm, playing an essential role in evaluating the importance of stations.
3. Constraint Parameters Analysis
In order to maintain the density of POIs on the screen within an acceptable range, some less important POIs must be omitted during visualization. It is necessary to make a reasonable assessment of the importance of POIs, quantify some parameters to evaluate whether the POI point is a Skyline Point (), and calculate scores for different attributes to carry out -k screening. The three constraints of spatial constraint, time-sharing passenger flow analysis and whether the station is a transfer station are used as the three-dimensional parameters for judgment and for real-time and dynamic -k score calculation.
3.1. Spatial Constraints
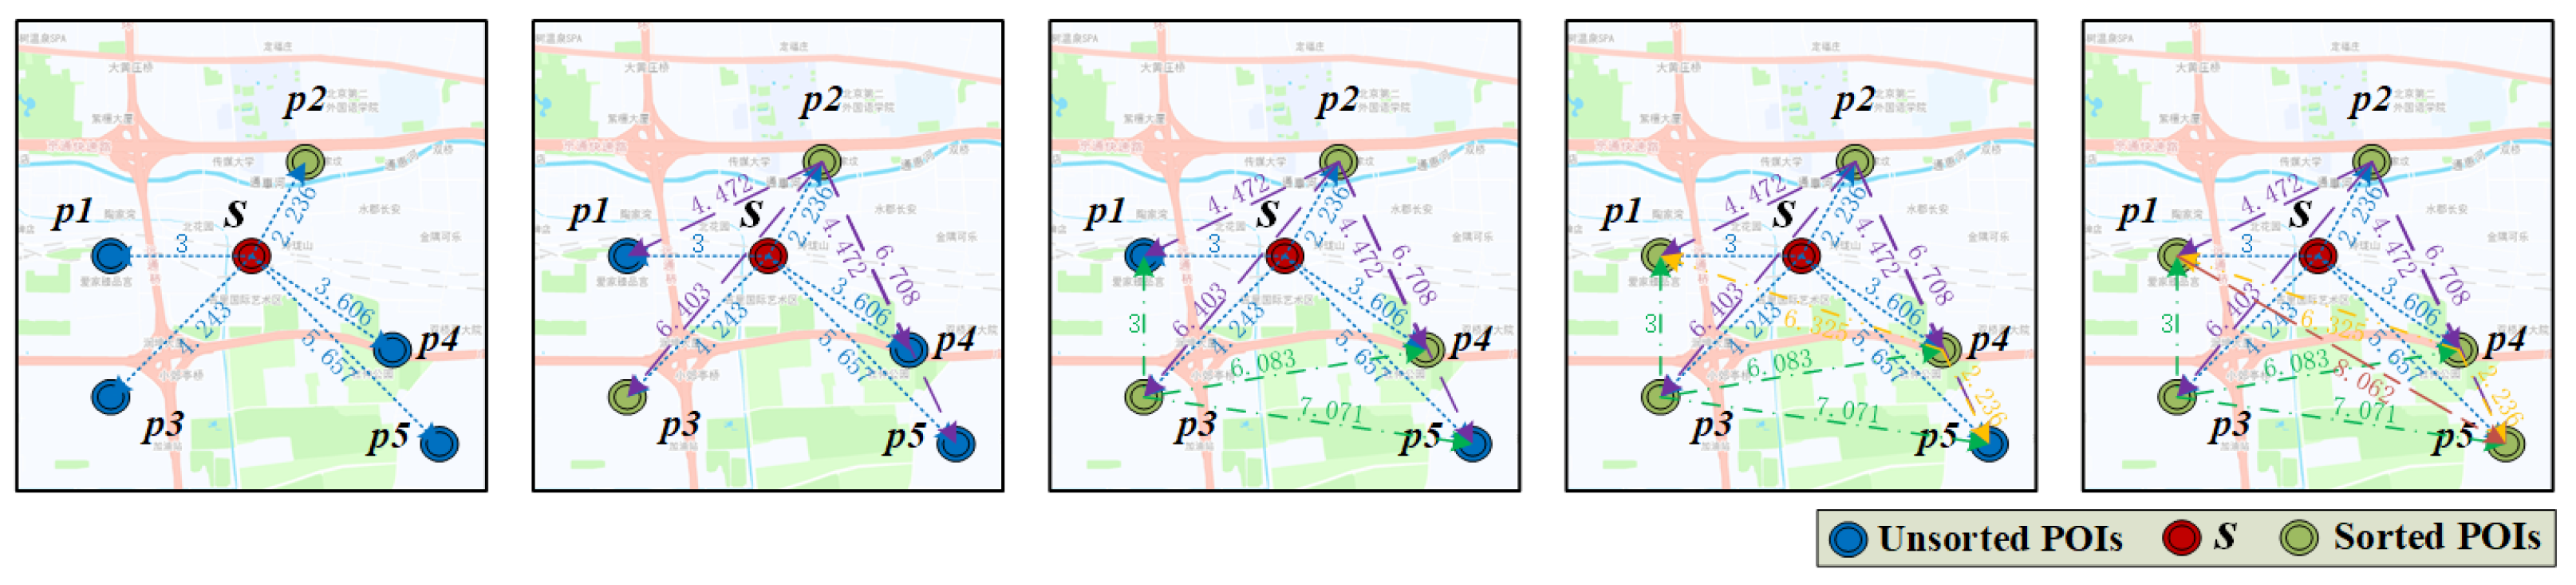
In the process of -k POI extraction, to make the visualized POIs more evenly and reasonable distributed in space, we use the spatial-based diversity method. Spatial diversity refers to weakening the points in the same direction in the candidate POIs by the direction of the selected POIs [28]. It is necessary to consider the location distribution of all the relative POIs in the coverage. This includes two main factors, the direction between two POIs and the distance between two POIs. That is to say, spatial diversity is the distribution diversity and multiple orientations, so the spatial distribution is calculated according to the triangular characteristics. The formula for the spatial diversity is described as follows:
where is any POI in the candidate POI collection; is any POI in the extracted queue(); represents the number of POIs that have been extracted; s is the real-time screen center point, is the Euclidean distance between two POIs. The range of this formula is (0, 1]. Taking Figure 2 as an example, we calculate the diversity values between POIs and perform station ranking by considering only spatial diversity. The position coordinates of s and to are: s: < 5,5 > : < 2,5 : < 6,7 > : < 2,2 > : < 8,3 > : < 9,1 >. s is the center point of the area at this time, assuming that to are all POIs in the screen area. First, as is closest to the center of the map, add it to the , where l = 1, that is, = ; according to Equation (1), calculate for , , and , respectively, and the results are = 0.8541, = 0.9965, = 0.7655 and = 0.8499. We take the maximum value to add to the queue and = , ; Similarly, according to Equation (1), , and are obtained a score , the with the highest score enters , l = 3; finally, the scores of and are calculated according to the formula, the final POIs sequence is →→→→.
3.2. Time-Sharing Passenger Flow
Subway stations are the key nodes of various social and economic activities in the city. Due to the great impact of different functional types of subway stations on people’s urban travel, there are space–time differences in the passenger flow of subway stations. The research on the time distribution of passenger flow at subway stations is helpful to further interpret the different functional divisions of the city and the social behavior characteristics embodied in it [8,29]. It has great significance in the understanding of the urban spatial pattern and its evolution. Passenger flow data of the subway station is an intuitive reflection of urban residents’ use of rail transit, and is an effective way to evaluate the similarity of rail transit stations.
This paper calculated the similarity between stations based on the time-sharing passenger flow of each station. We used the time-sharing method to conduct statistical analysis on the passenger flow of POIs in different time periods. According to the number of passengers entering the station, we could intuitively compare the distribution similarity of the time perception passenger flow of two stations, focusing on comparing the similarity of the passenger flow distribution trends between stations.
According to the AFC (Automatic Fare Collection System) data of Beijing Rail Transit System, Figure 3 shows the trend of inbound passenger flow at stations with hourly intervals in a day, and lists two pairs of stations with high similarity. Figure 3a,c have similar trends in inbound passenger flow curves. The main characteristics of Xi’erqi and Xizhimen stations are that they are located close to the central business district of the city or the company concentration area, the station scale is large and the passenger boarding and landing volume is large. Their passenger flow in the evening is much higher than in the morning, showing evening peak unimodal: Figure 3b,d are Jingsong and Shilihe. The land around these two stations not only contains residential areas, but also schools, shopping malls and exurban bus stations, which means the inbound passenger flow of this station is not only concentrated in the morning rush hour.
We used the equivalent time (per hour) to describe the passenger flow of the station accurately, and the similarity calculation method to calculate the passenger flow similarity of the station. For the inbound passenger volume, one hour was used as the interval, and the passenger flow of station p in one day (from 5:00 to 24:00) was described as the passenger flow of the equivalent time (per hour), that is (H ∈ [5, 23]) represented the number of passengers entering the station p in the time interval from H to . Using the idea of Euclidean distance, we could calculate the difference of passenger flow between two stations and .
The similarity of time perception passenger flow of the two stations and could be calculated according to the formula described as follows:
Based on the above formulae, the similarity of inbound passenger flow could be calculated as follows:
According to the similarity of the inbound passenger flow at stations, the passenger flow constraint was quantified, as shown in Equation (4). Its value range was , which was used as one of the dynamic properties for skyline retrieval and subsequent sorting.
3.3. Transfer Station
As supporting points of the rail transit network skeleton, the transfer stations are important nodes of passenger flow distribution and transfer. The passenger flow of transfer stations is much higher than that of ordinary stations [9,30]. It can be seen that the importance of the transfer stations is much higher than that of the ordinary stations too. If a station was a transfer station, the parameter was set to 1 ( = 1), and if it was a non-transfer station, the parameter was set to 0.
4. Top-k POI Selection Method
4.1. Filter Overlapping Icons
When the map scale is reduced, the POI density increases sharply on the map, so many points are crowded together after the map scale is reduced to a certain extent, making it impossible to distinguish POIs. In order to determine whether the POI should be filtered, it is necessary to consider whether there is an overlap between the icons of POIs, which is related to the distance between POIs, the size of the icons and the zoom level of the map.
Before a POI is added to the selected queue (), we need to judge whether it overlaps with the icons of other POIs in the . If there is overlap, filter the POI. If there is no overlap, add it to the . The main steps to judge whether there is an overlap between two points are described as follows:
- Obtain the current zoom level () and the plotting scale relation corresponding to . For example, when = 13, the plotting scale is 1 cm = 1 km.
- Calculate the actual distance according to the latitude and longitude coordinates of the two POIs.
- Divide by the plotting scale’s size to get the distance of the two POIs on the map.
- If the POI icon’s width is x and 2 * x < , it can be considered that there is no overlap between the icons of the two POIs. Otherwise, they are considered to be overlapping.
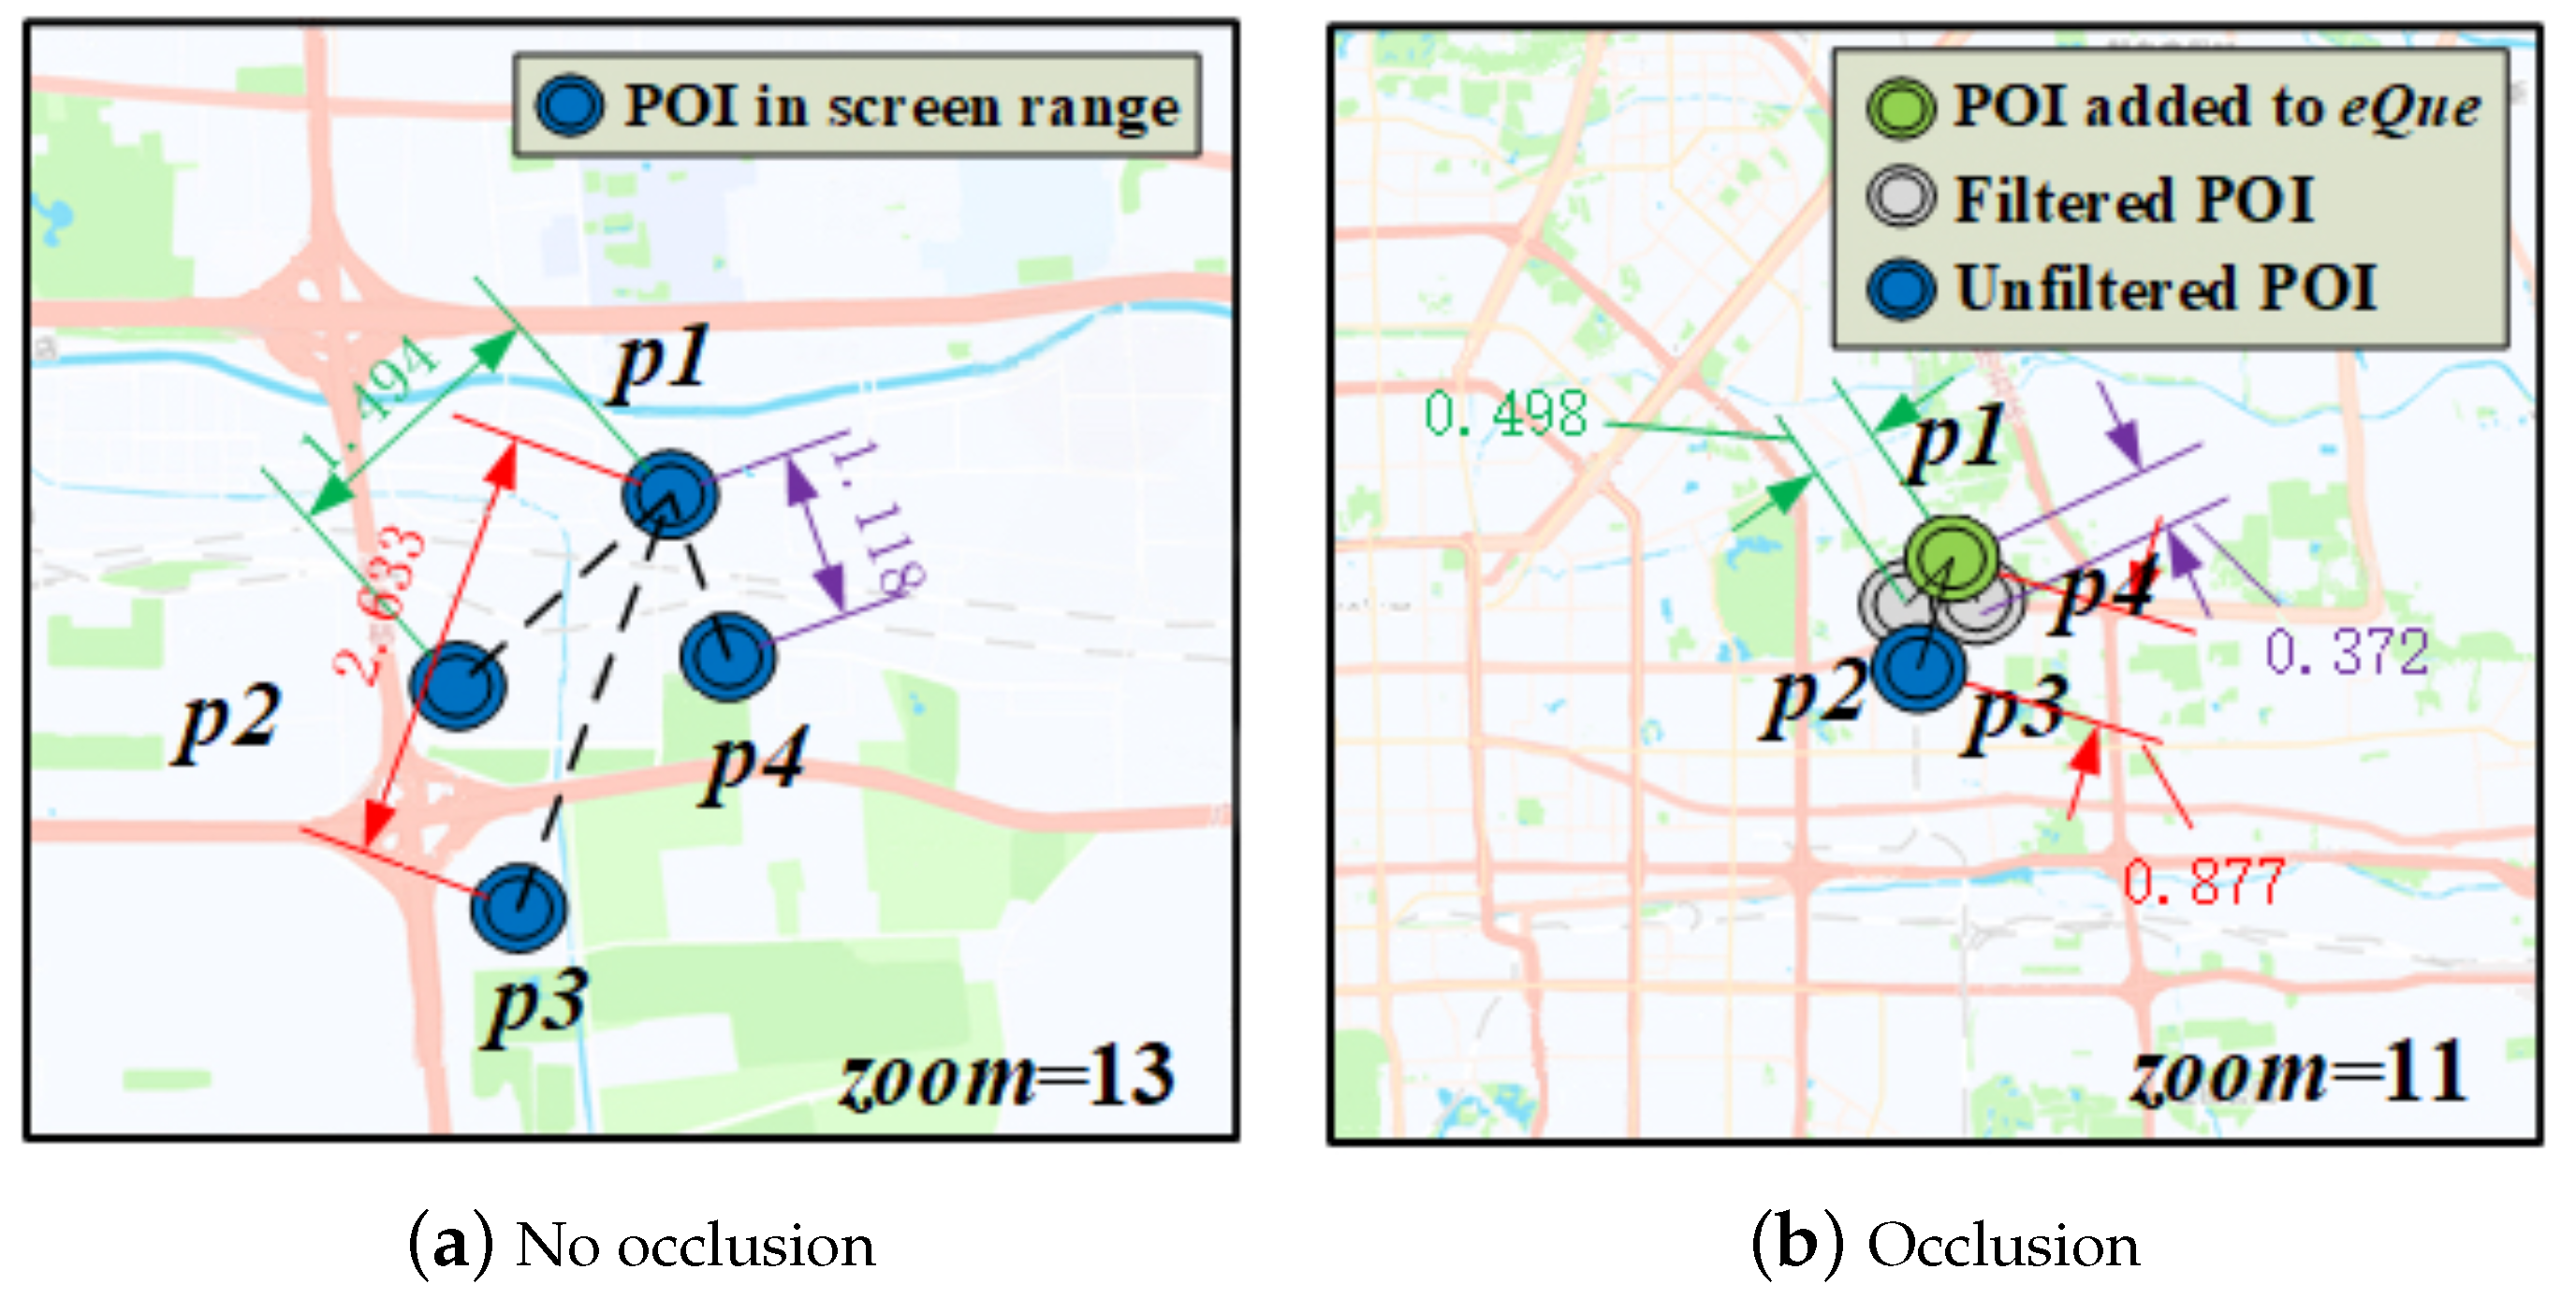
Assume that the positions of four POIs, (116.270479, 40.218583), (116.267035, 40.205396), (116.269865, 40.194891) and (116.281690, 40.213294), are shown in Figure 4. If we want to judge whether the icons of and are overlapping, first find the actual distance between the two points, = 1.494 km. Suppose the width of the icon is 10 px, when the screen resolution of an ordinary desktop computer is set to 800 × 600, according to the Pythagorean theorem, we know that the diagonal pixel of the display is 1000, while the diagonal length of the ordinary 17 inches display is about 43 cm. That is to say, in this case, 1000 px = 43 cm, that is, 1 px = 0.4 mm, and x = 0.4, the width of the icon is about 0.4 cm.
If = 13 at this time, the scale is 1 cm = 1 km, and = 1.494 cm > 2 * x, it can be considered that there is no overlap between and icons. In the same way, there is no overlap between each icon, as shown in Figure 4a.
Assume that has entered the , if = 11 at this time, the scale is 1 cm = 5 km, = 0.498 cm < 2 * x, = 0.372 cm < 2 * x, and , and can be considered to overlap between icons, then and are filtered; = 0.877 cm > 2 * x, and icons do not overlap, as shown in Figure 4b.
4.2. Skyline-Based Top-k Sorting Method
Definition 1
(). Scope of interest means that under different screen center points (i) and zoom levels (j), a closed study area is formed by four boundary points within the visible range of the screen. It can be expressed as R(i, j) = , where (, ) is the boundary point of the rectangle of interest area. A set of geospatial objects in the current area is = , and ∈ POIs.
Definition 2
( ). The selected POIs in the spatial objects of urban rail transit refers to the -k POIs extracted from the POIs in the current visual range based on the user’s interest in the POIs. In the scope of interest R(i, j), given a distance threshold x and an integer k. C⊂ is the set of candidate geospatial objects, and ∀∈C is Skyline Points (). The purpose of spatial object selection is to select a subset S∈C, ≤k, for any ∈S,
- 1.
- (, ) ≥ x, ∈ S,
- 2.
- ⊂ ,
- 3.
- () is maximized.
(, ) is the Euclidean distance between and . () is a dynamic score of , and it is calculated by the proposed method based on the spatial diversity, the similarity of passenger flow and whether the station is a transfer stations. We provide solutions in Section 3 and Section 4. Condition (1) ensures that there is no overlap between two close spatial objects. Conditions (2) and (3) ensure that the selected POIs in the spatial objects are the most representative POIs in the scope of interest.
In many practical applications, skyline query is an essential query type, which returns tuples that are not dominated by other tuples in the potentially huge data space [31]. Skyline calculations are critical in many decision-making applications involving high-dimensional data sets, but skyline queries cannot control the number of returned results [32]. In the process of each sorting, based on the sorted , the three-dimensional attribute values of the unsorted POIs are calculated, and the skyline retrieval is performed according to these attribute values.
The -k query selects a monotonic function to return the data objects with the first k largest (or smallest) value of this function as the result, which has great significance for data analysis aiming to find meaningful objects to support decisions. The main idea is to aggregate multiple attributes of each object in the object set through a monotonic weighting function to get a single value, and this value is usually called . Then, sorting all objects, according to their , and selecting the top k largest objects, provides the query results.
Top-k query is widely used in many fields, such as database query, image processing, data mining, etc. The existing Top-k query algorithms can be roughly divided into three categories: view-based methods, index-based methods and order-linked methods. In this paper, top-k POI represents the most representative k POI in the display area of the current scaling level. Differing from the traditional top-k method, the value of k changes dynamically with the scaling level, and when the scaling level is constant, each POI is a real-time SP, extracted according to the dynamic score of POI. That is, POI ⊂ SP.
The Skyline-based -k selection method controls the number of query results that need to be returned to users, and returns the first k data objects to users, so as to keep the size of the result set in a reasonable range. -k POIs are the k most representative POIs in the current visual range. It can be considered that these k stations already represent the maximum number of available options (stations) to display without overlapping on the map and facilitate online user query. This solution evaluates the interest objects according to the scores of the feature objects that satisfy the three constraints.
In the process of each sorting, the three-dimensional attribute values of unsorted POIs are calculated based on the sorted . After quantifying the POIs’ three constraints of spatial constraint, time-sharing passenger flow analysis and whether a transfer station, the attributes of each dimension of all POIs are normalized. The maximum and minimum values are 1 and 0, respectively. Each object has three scores ((), (), ()), and each attribute has a score between 0 and 1. Before each sorting, based on the result set of the skyline query, the three attribute scores are combined by adding coefficients , and . The values of , and satisfy + + = 1. Then, a total score is assigned to each object by combining the attribute scores to determine the k objects with the highest total scores. Among them, the value of k can be linked with the scale of the map, and different k values can be set in different scale ranges. The formula for extracting -k POIs in the visible range is described as follows:
The main steps of the algorithm are described as follows:
- Obtain all POIs in the scope of interest.
- Find the POI that is closest to the center of the map and enter it to as -1 with the queue length l = 1.
- If l < k, go to step (4); otherwise, go to step (9).
- Let be the size of the POI collection to be sorted. If = 0, there is no POI that can be sorted, go to step (9), otherwise, go to step (5).
- Use the skyline algorithm to perform a skyline query on the candidate POIs to find the .
- Use Equation (6) to sort the scores for SPs obtained from large to small.
- Pick the POI with the highest score and judge whether there is occlusion with the POIs icons in the . If no overlap occurs, enter it to , l + = 1 and go to step (3); filter the POI after occlusion, judge the POI with the second-highest score until one point joins the queue, l + = 1 and go to step (3); if the candidate POIs are empty, go to step (9).
- Output the values in the sequence .
- Re-execute the algorithm when panning or zooming the map.
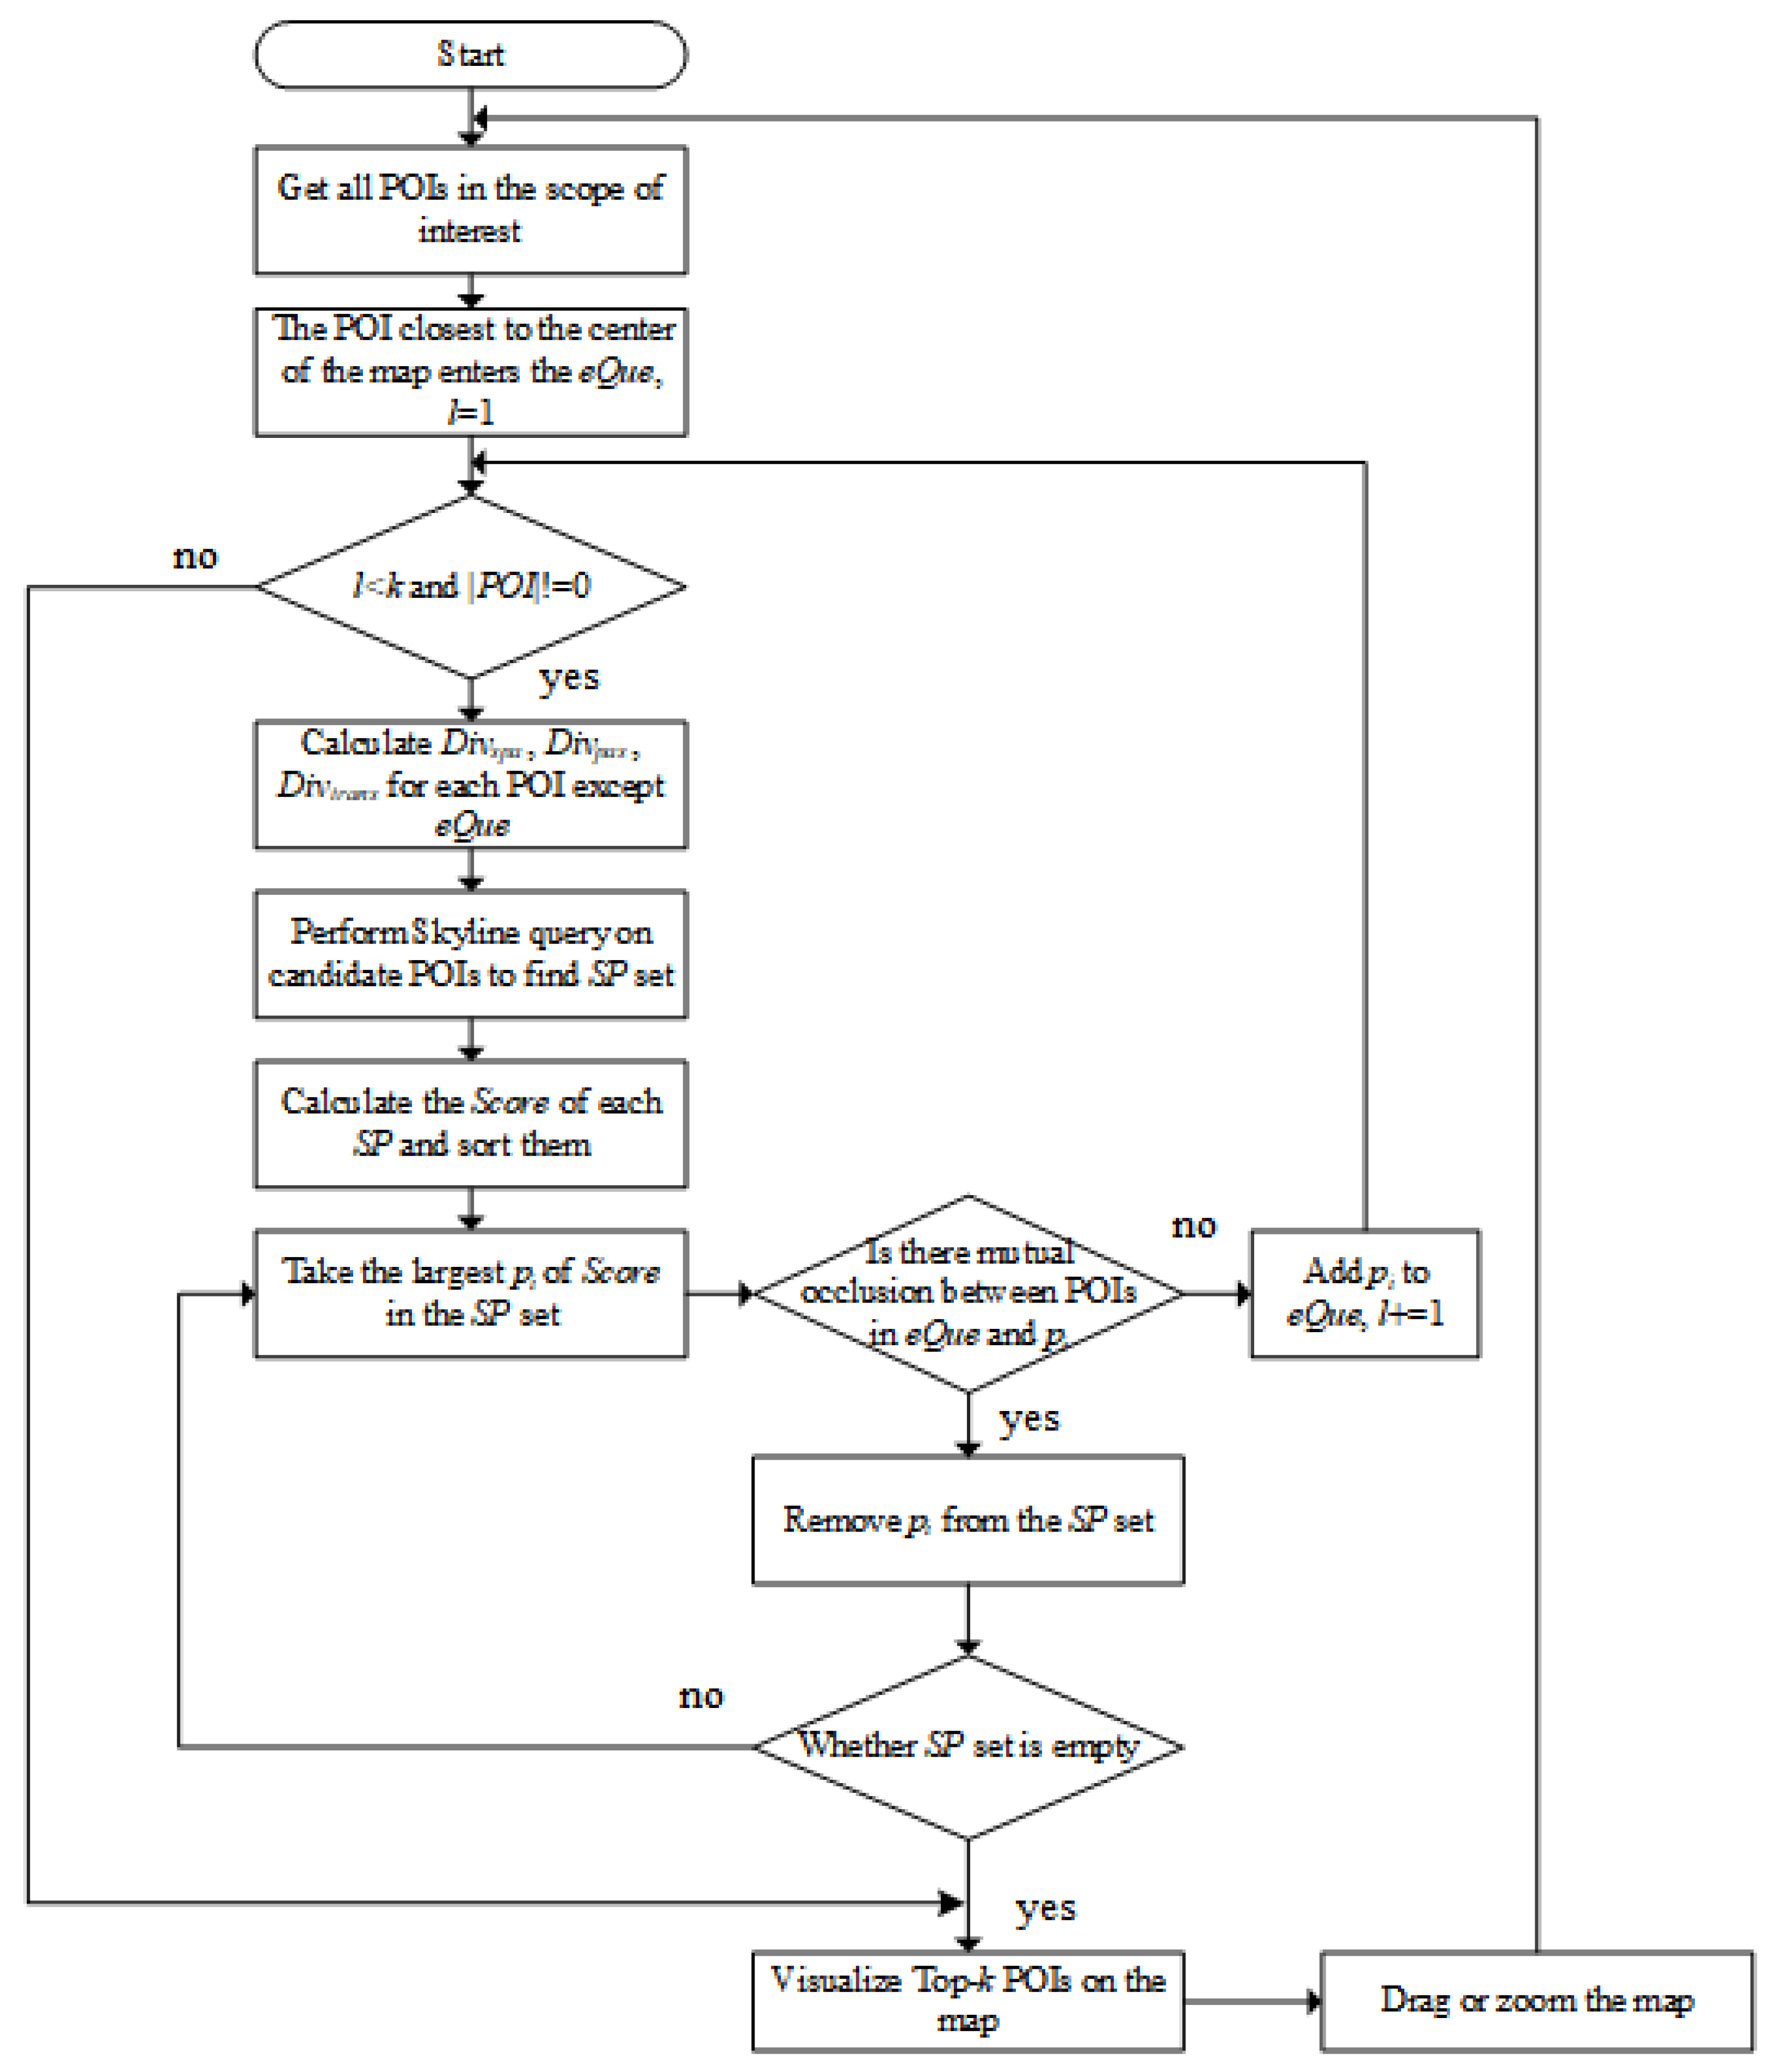
The calculation steps of the Skyline-based -k sorting method are visually displayed through the flowchart in Figure 5. Algorithm 1 shows the pseudo codes of the Skyline-based -k sorting algorithm.
| Algorithm 1: Extracting -k POIs by Skyline-based -k sorting algorithm |
 |
5. Experimental Evaluations
In this section, the data set used in the experiment is introduced. Then, the experimental settings and benchmarks are given in detail, including the settings of parameters in the experiment, such as k, , and . Since POIs in the visible range are different at different map center points and scales, the skyline results retrieved in various cases are different, and the k values of -k POIs displayed in different map scales are different. The k most representative POIs resulting in the current visual range are different. Demonstrating and evaluating the influence of k, , and on the experimental results requires making a reasonable record and analyzing the query efficiency of this method, and combining the users’ evaluations of this method to optimize the query efficiency and querying quality.
5.1. Data Set Description
We usee Beijing subway station data and the Automatic Fare Collection (AFC) system data of the Beijing rail transit system as the data set. Beijing subway station data set contains 227 subway POIs. Each POI contains two attributes, the attribute is the station’s name, and the attribute includes the latitude and longitude coordinates of the station. In the experiment, we used 483,614,919 passenger travel data generated and collected by the AFC system from June 2013, to July 2013. A total of 15,081,258 different passengers (AFC cards) entering and exiting the station within one month were recorded and used to calculate the passenger flow of 227 stations in Beijing rail transit system.
5.2. Experimental Settings
5.2.1. k Value at Different Zoom Levels
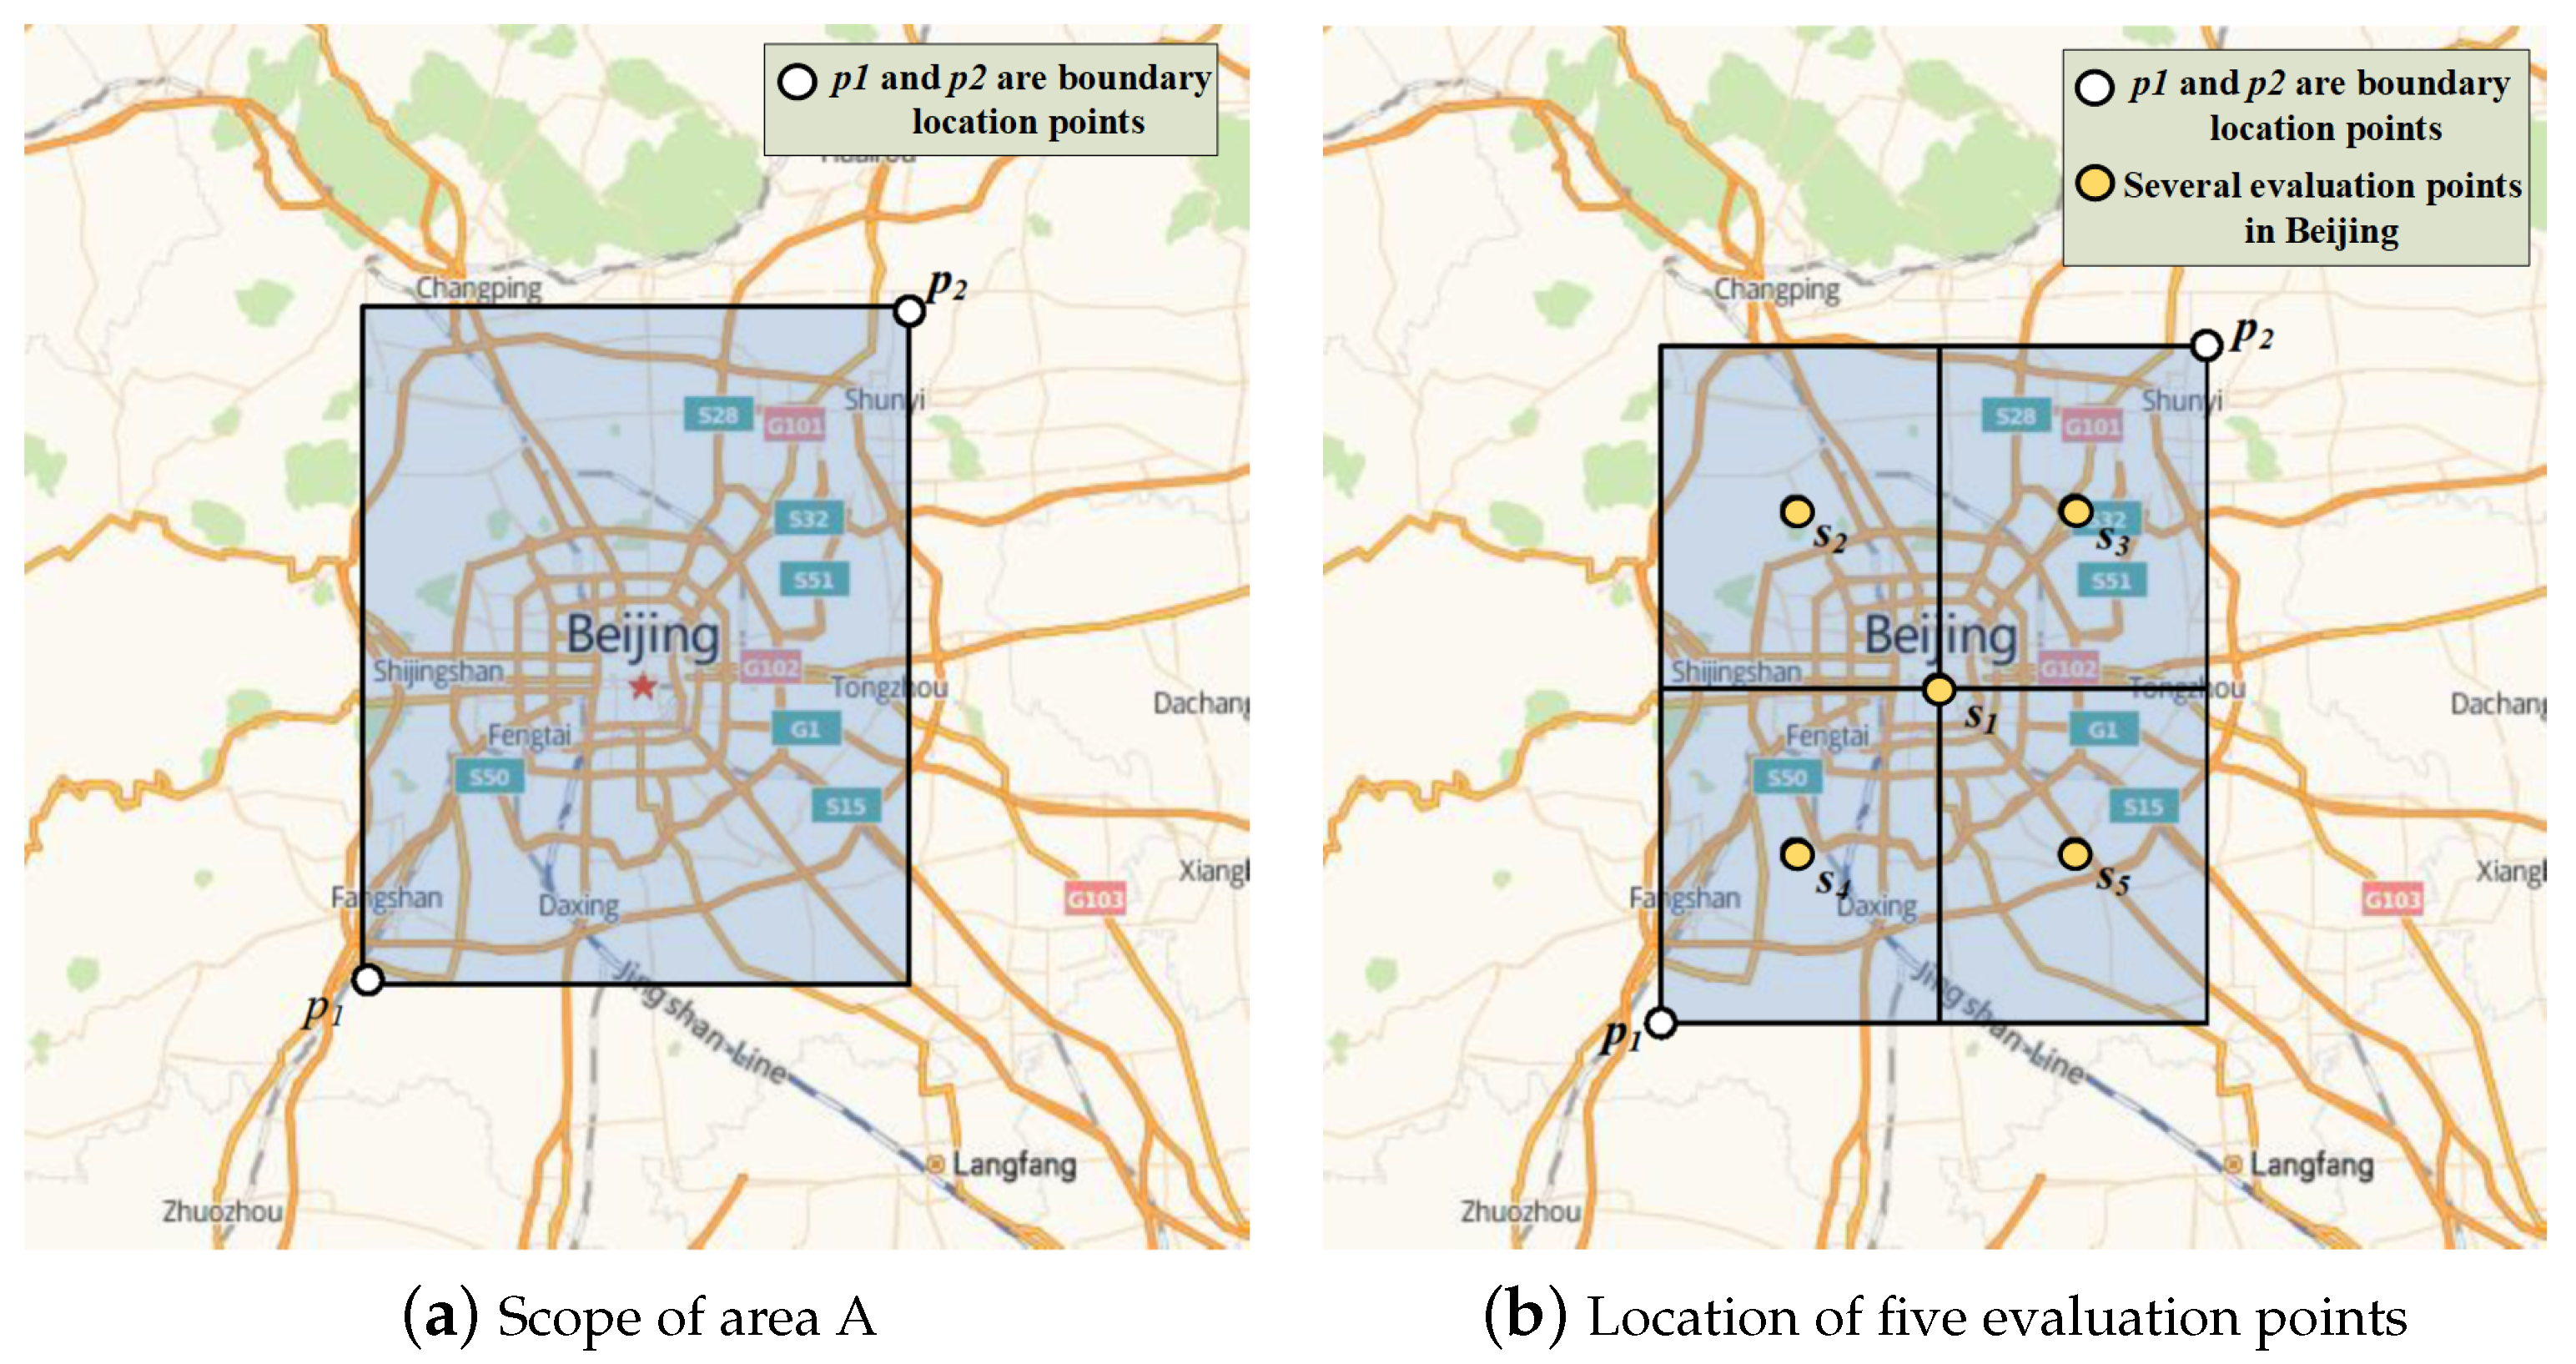
In order to display a reasonable number of POIs in different map zoom levels, the value of k was linked to the in the experiment. The range of was set from 3 to 18, and we assigned different values of k to different on the map. To reasonably make different corresponding to k value better, we traversed and queried the maximum and minimum longitude and latitude of POIs in the Beijing subway station data set. The query results showed that the maximum longitude was Tuqiao (116.686349, 39.871926) and the minimum longitude was Suzhuang (116.125306, 39.723188). The maximum latitude was Nanshao (116.287534, 40.207492), and the minimum latitude was Tiangongyuan (116.319932, 39.670342). By combining the minimum and maximum longitude and latitude in pairs, we obtained two position points, which were (116.125306, 39.670342) and (116.686349, 40.207492). Taking and as the starting points, we drew straight lines along the north–south direction of the longitude line and the east–west direction of the latitude line, respectively. The area enclosed by the four straight lines was Area A. Area A contained all the POIs of the Beijing subway stations, as shown in Figure 6a.
The allocation of k value under different levels can be seen in the following two steps:
(1) When <=10, the visible area entirely displayed Area A, so the area ratios () of Area A to the visible range at different zoom levels of 3 to 10 were calculated, as shown in Table 1. When the proportion of Area A in the visible range was small enough ( 0.01), the area of the subway could be considered negligible. At this time, let k = 1 and select a representative object to identify the location of the subway area. When 0.01, k = 1; when 0.01 << = 0.1, k = 2; when 0.1 << = 1, k = 3.
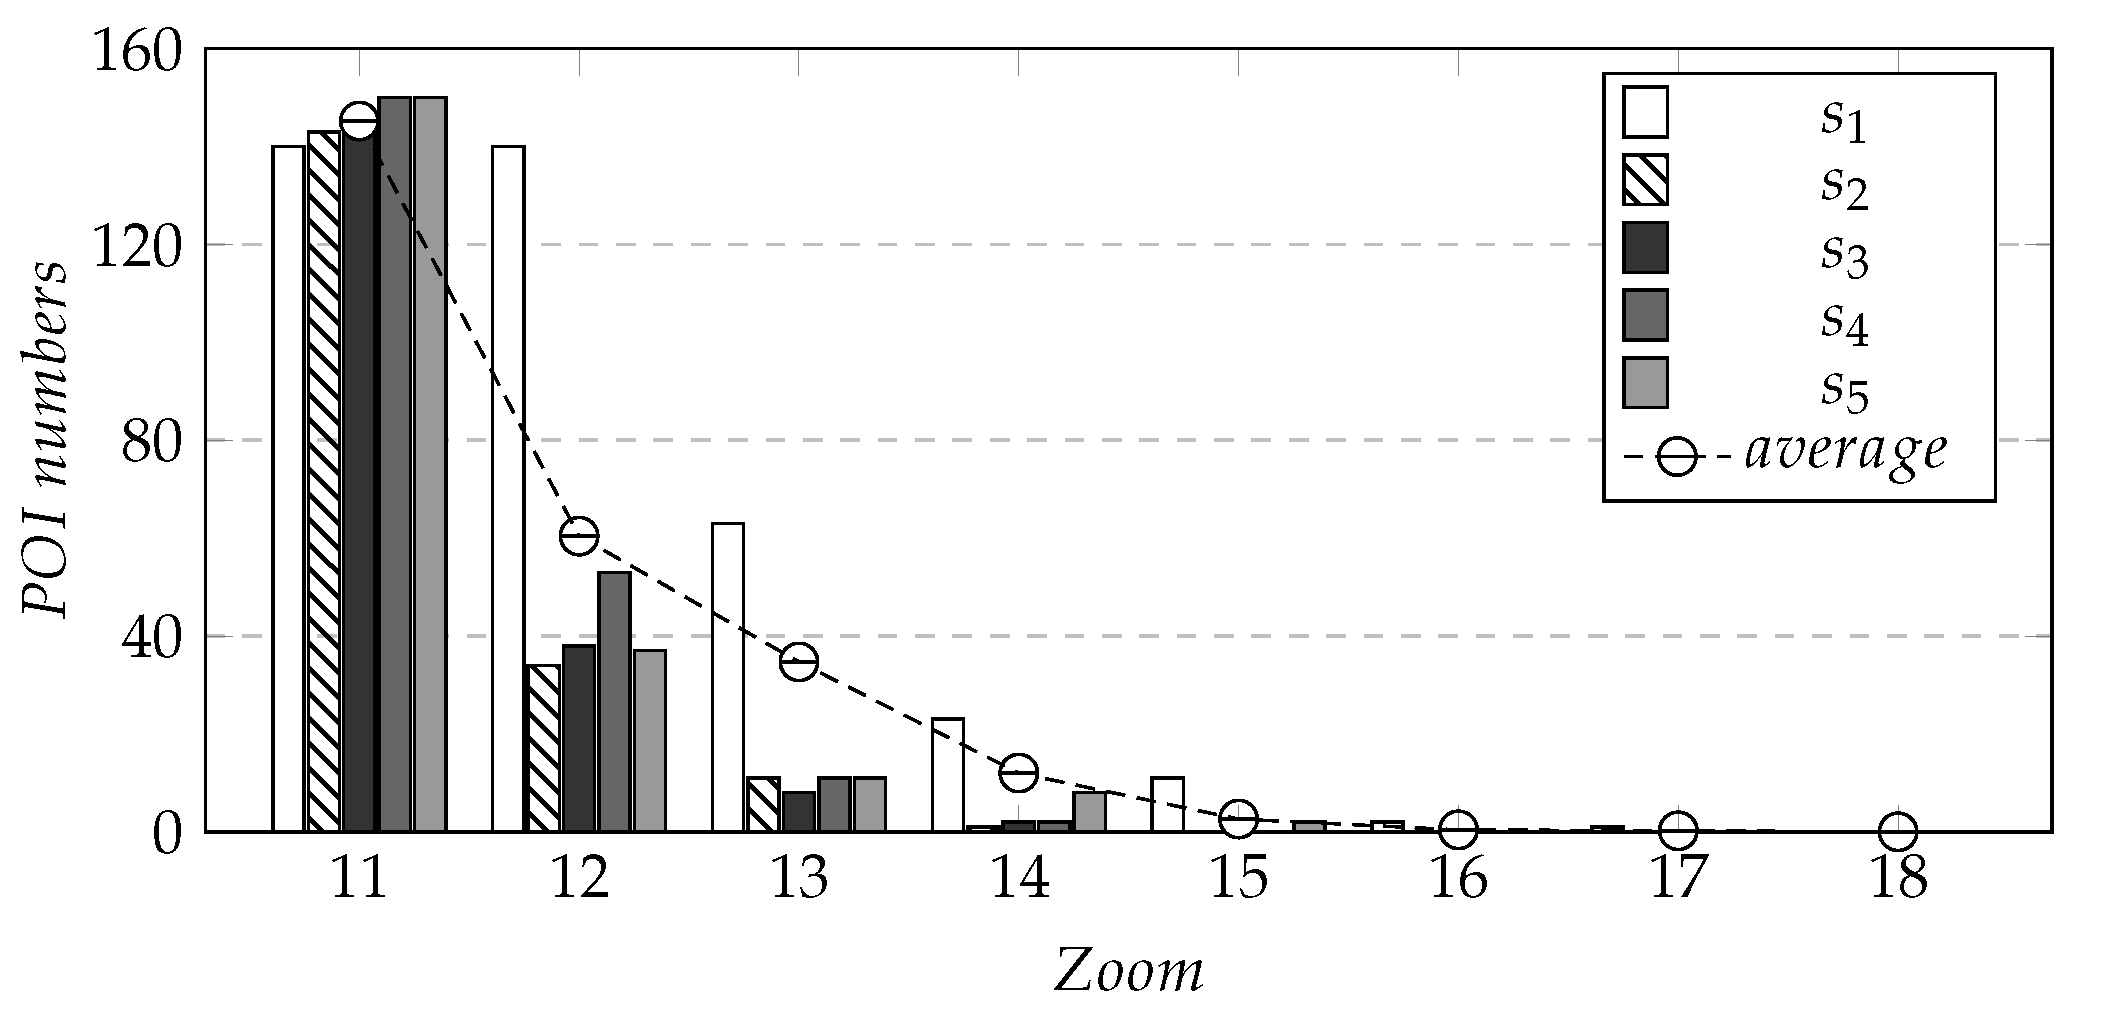
(2) When > 10, Area A could not be completely displayed in the visible range, and the value of k should be related to the density of regional stations. The value of k was determined by evaluating the density of sites at different zoom levels, when the center position of the map was fixed. We selected several evaluation points in the area of Beijing as the center of the map in the experiment to perform experiments at different zoom levels. The selection method of evaluation points is described as follows. The coordinates of Tiananmen Square, the central point of Beijing, are (116.397451, 39.909187). By taking the geographical coordinates of the regional boundary of Area A as the boundary and Tiananmen Square coordinates as the benchmark, we drew a straight line along the north–south direction of the longitude line and the east–west direction of the latitude line, respectively, and Area A was divided into four regions B, C, D, F. Taking the center point coordinates (116.2613, 40.0583), (116.5419, 40.0583), (116.2613, 39.7897), and (116.5419, 39.7897) of the areas B, C, D and F, and the central point coordinates of Beijing city (116.3974, 39.9091), there were a total of five points representing the evaluation positions of the experiment, as shown in Figure 6b. After taking the five locations as the center points of the map, we, respectively, recorded the number of all POIs at eight different zoom levels of 11, 12, 13, 14, 15, 16 17 and 18, and calculated the average values of POIs at the five locations. The results are shown in Figure 7. It can be seen that as the zoom level increased, the POI density within the screen area decreased. When = 11, the average number of POIs () in the screen reached the maximum. We calculated the values of k when > 10 according to Equation (7), represents the value of k when = i, and is the when = i. The values of k obtained by the calculation are shown in Table 2.
After the above two steps, the allocation of k values, based on different zoom levels, was completed, and the allocation results are shown in Table 2.
5.2.2. Coefficient
The coefficients , and play an essential role in the -k POI extraction method, and are based on the three constraints of spatial diversity, passenger flow similarity and whether the station is a transfer station. In the experiment, by adjusting the values of the three coefficients, the influence proportion of the three constraints on the -k POI extraction was adjusted, and then the k objects with the highest total scores were determined. By comparing the performance of the proposed method under different , and values, we obtained better , and values. Table 3 shows the parameters in the experiment and the corresponding parameter range. The four values of parameters , and ( = 0.8, = = 0.1; = = 0.1, = 0.8; = = 0.1, = 0.8; and = = = 0.33), respectively, represent four kinds of POI extraction: preference space, preference passenger flow, preference transfer station and constraint balance. The skyline evaluation dimensions , and represent three constraints. The of the map was from 3 to 18. The smaller the map scale was, the larger the map display range would be. Different zoom levels were bound to different k values, and the value range of k was 1 to 15.
5.3. Experimental Results and Analysis
5.3.1. Evaluation of Experimental Effect
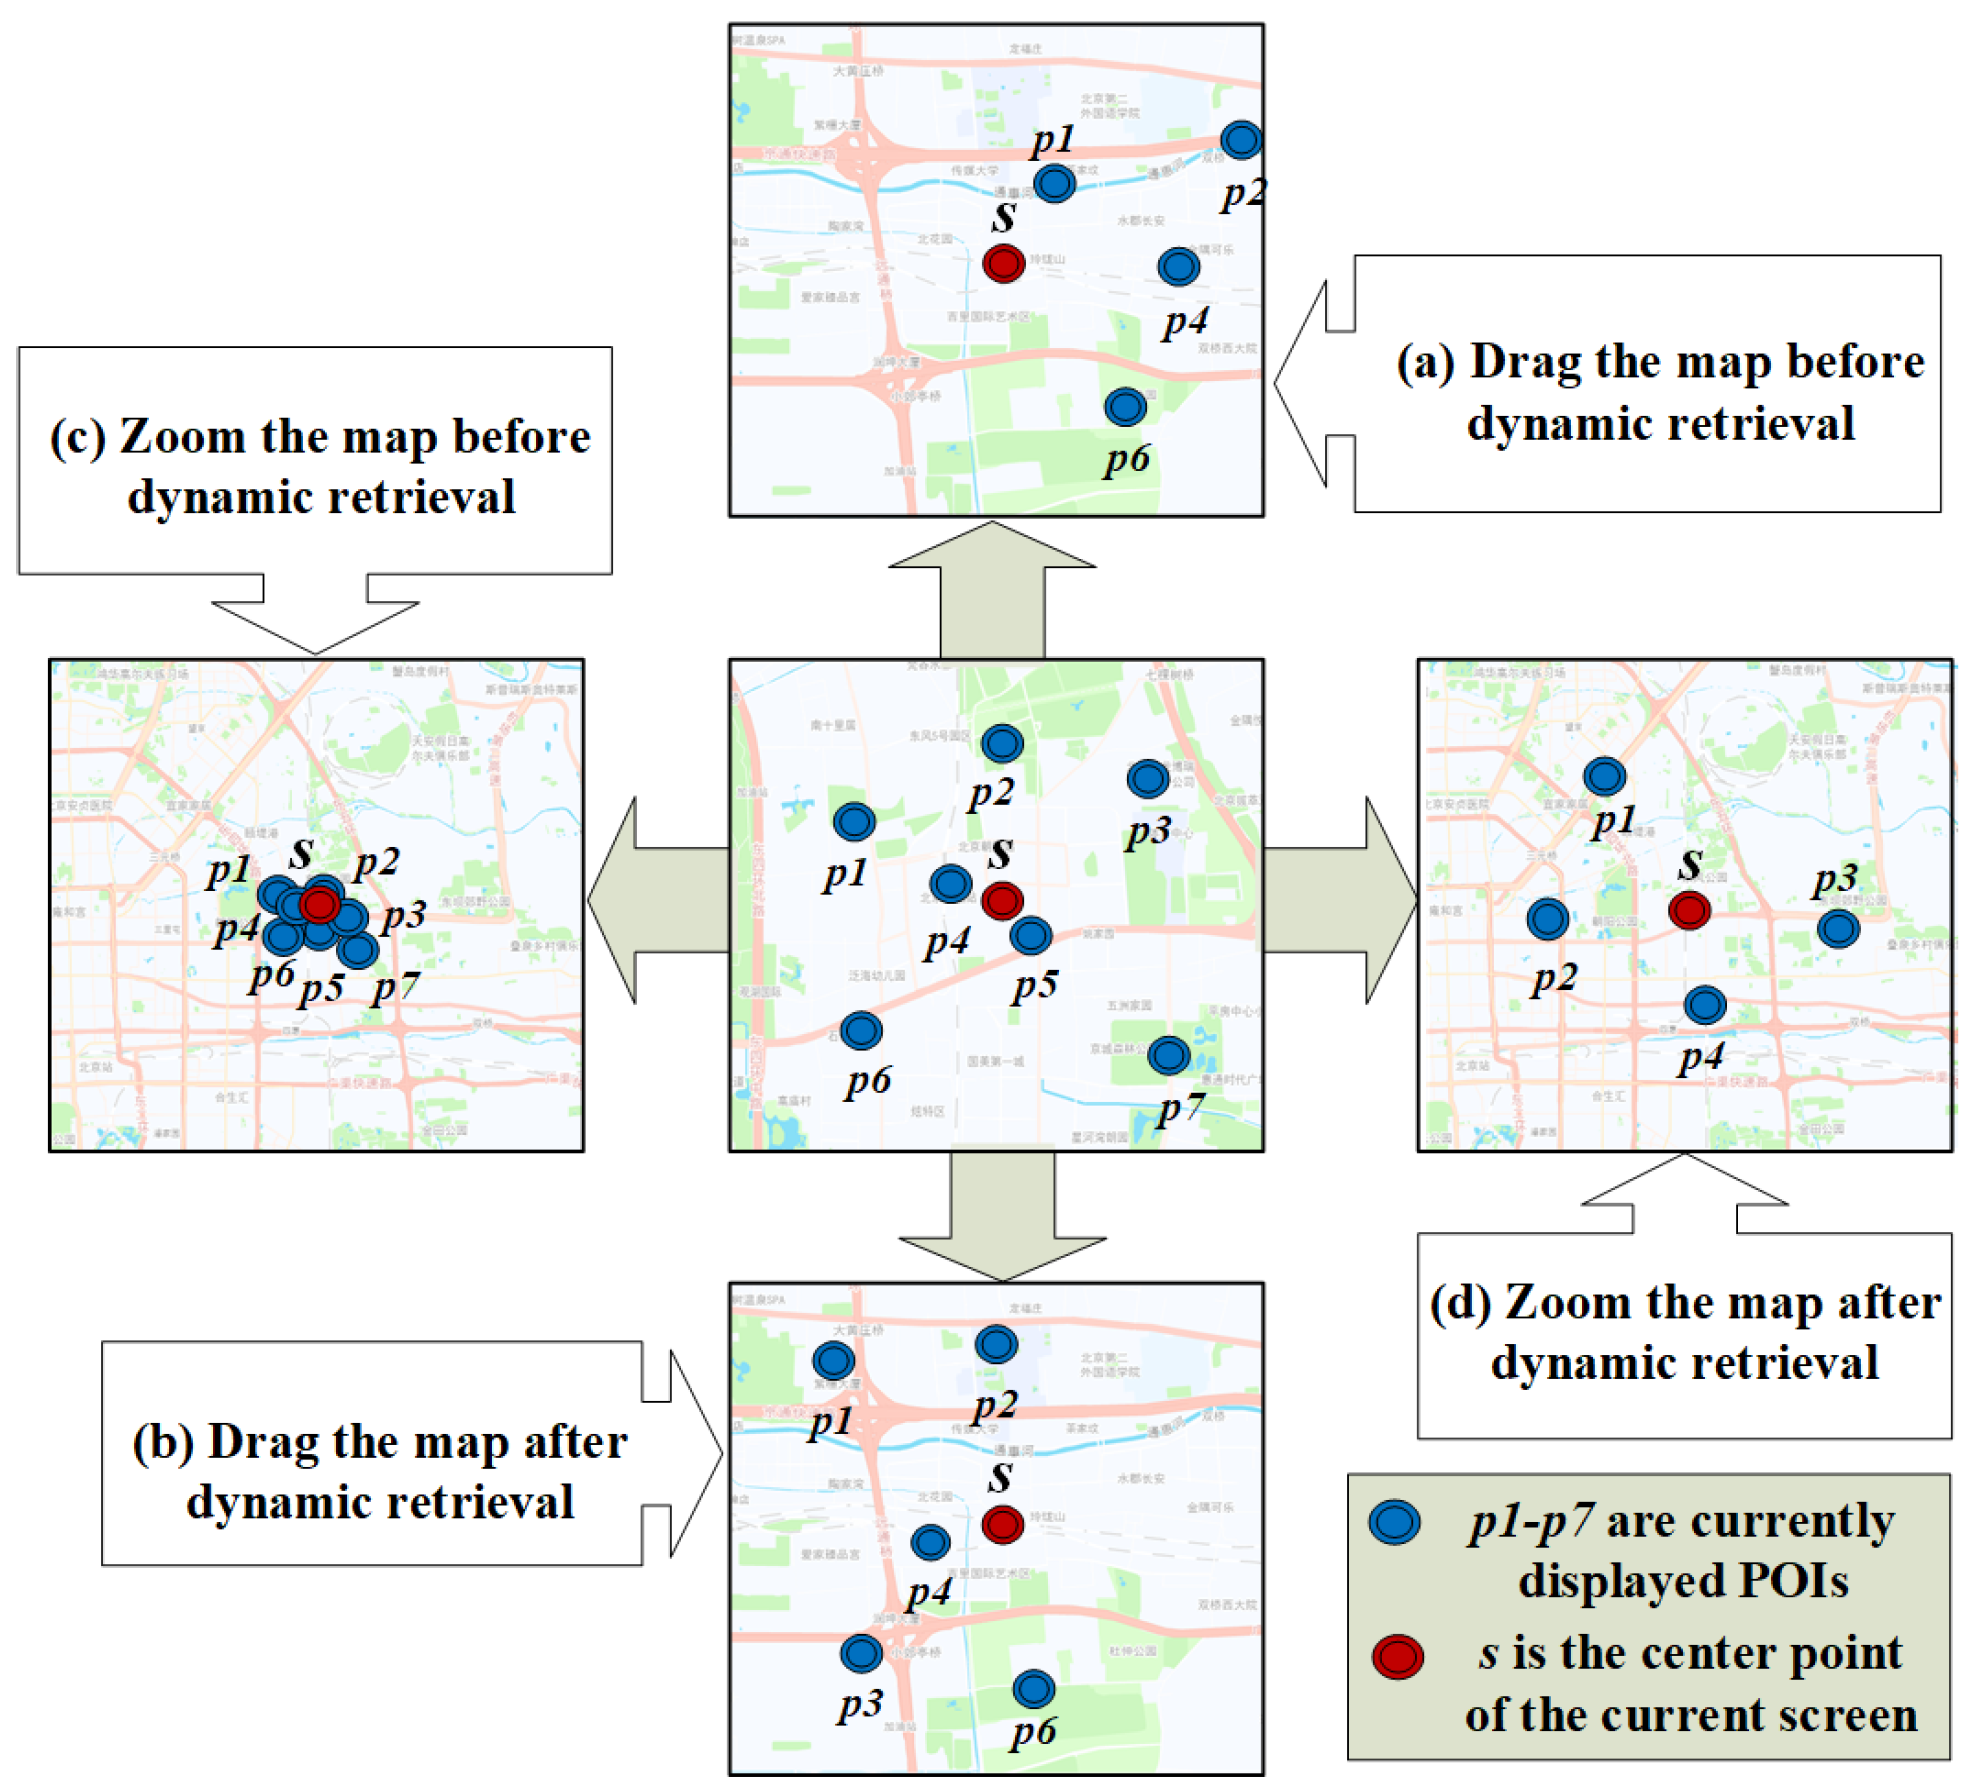
At present, the various existing rail transit layers on the electronic map cannot be dynamically updated when users drag the map. For example, Figure 8 shows the stations displayed in its visible area. When the map is dragged or the scale changes, the icons of the stations block each other, as shown in Figure 8a,c. It can be seen that it would be inconvenient for users to identify stations when using subway layers. This method aimed to solve the inconvenience caused by static display and occlusion. As shown in Figure 8b,d key stations could be reasonably displayed when dragging or zooming the map, and there would be no overlap between the icons of the stations. It can be seen that our method was beneficial to the improvement of subway traffic service quality.
5.3.2. Query Efficiency
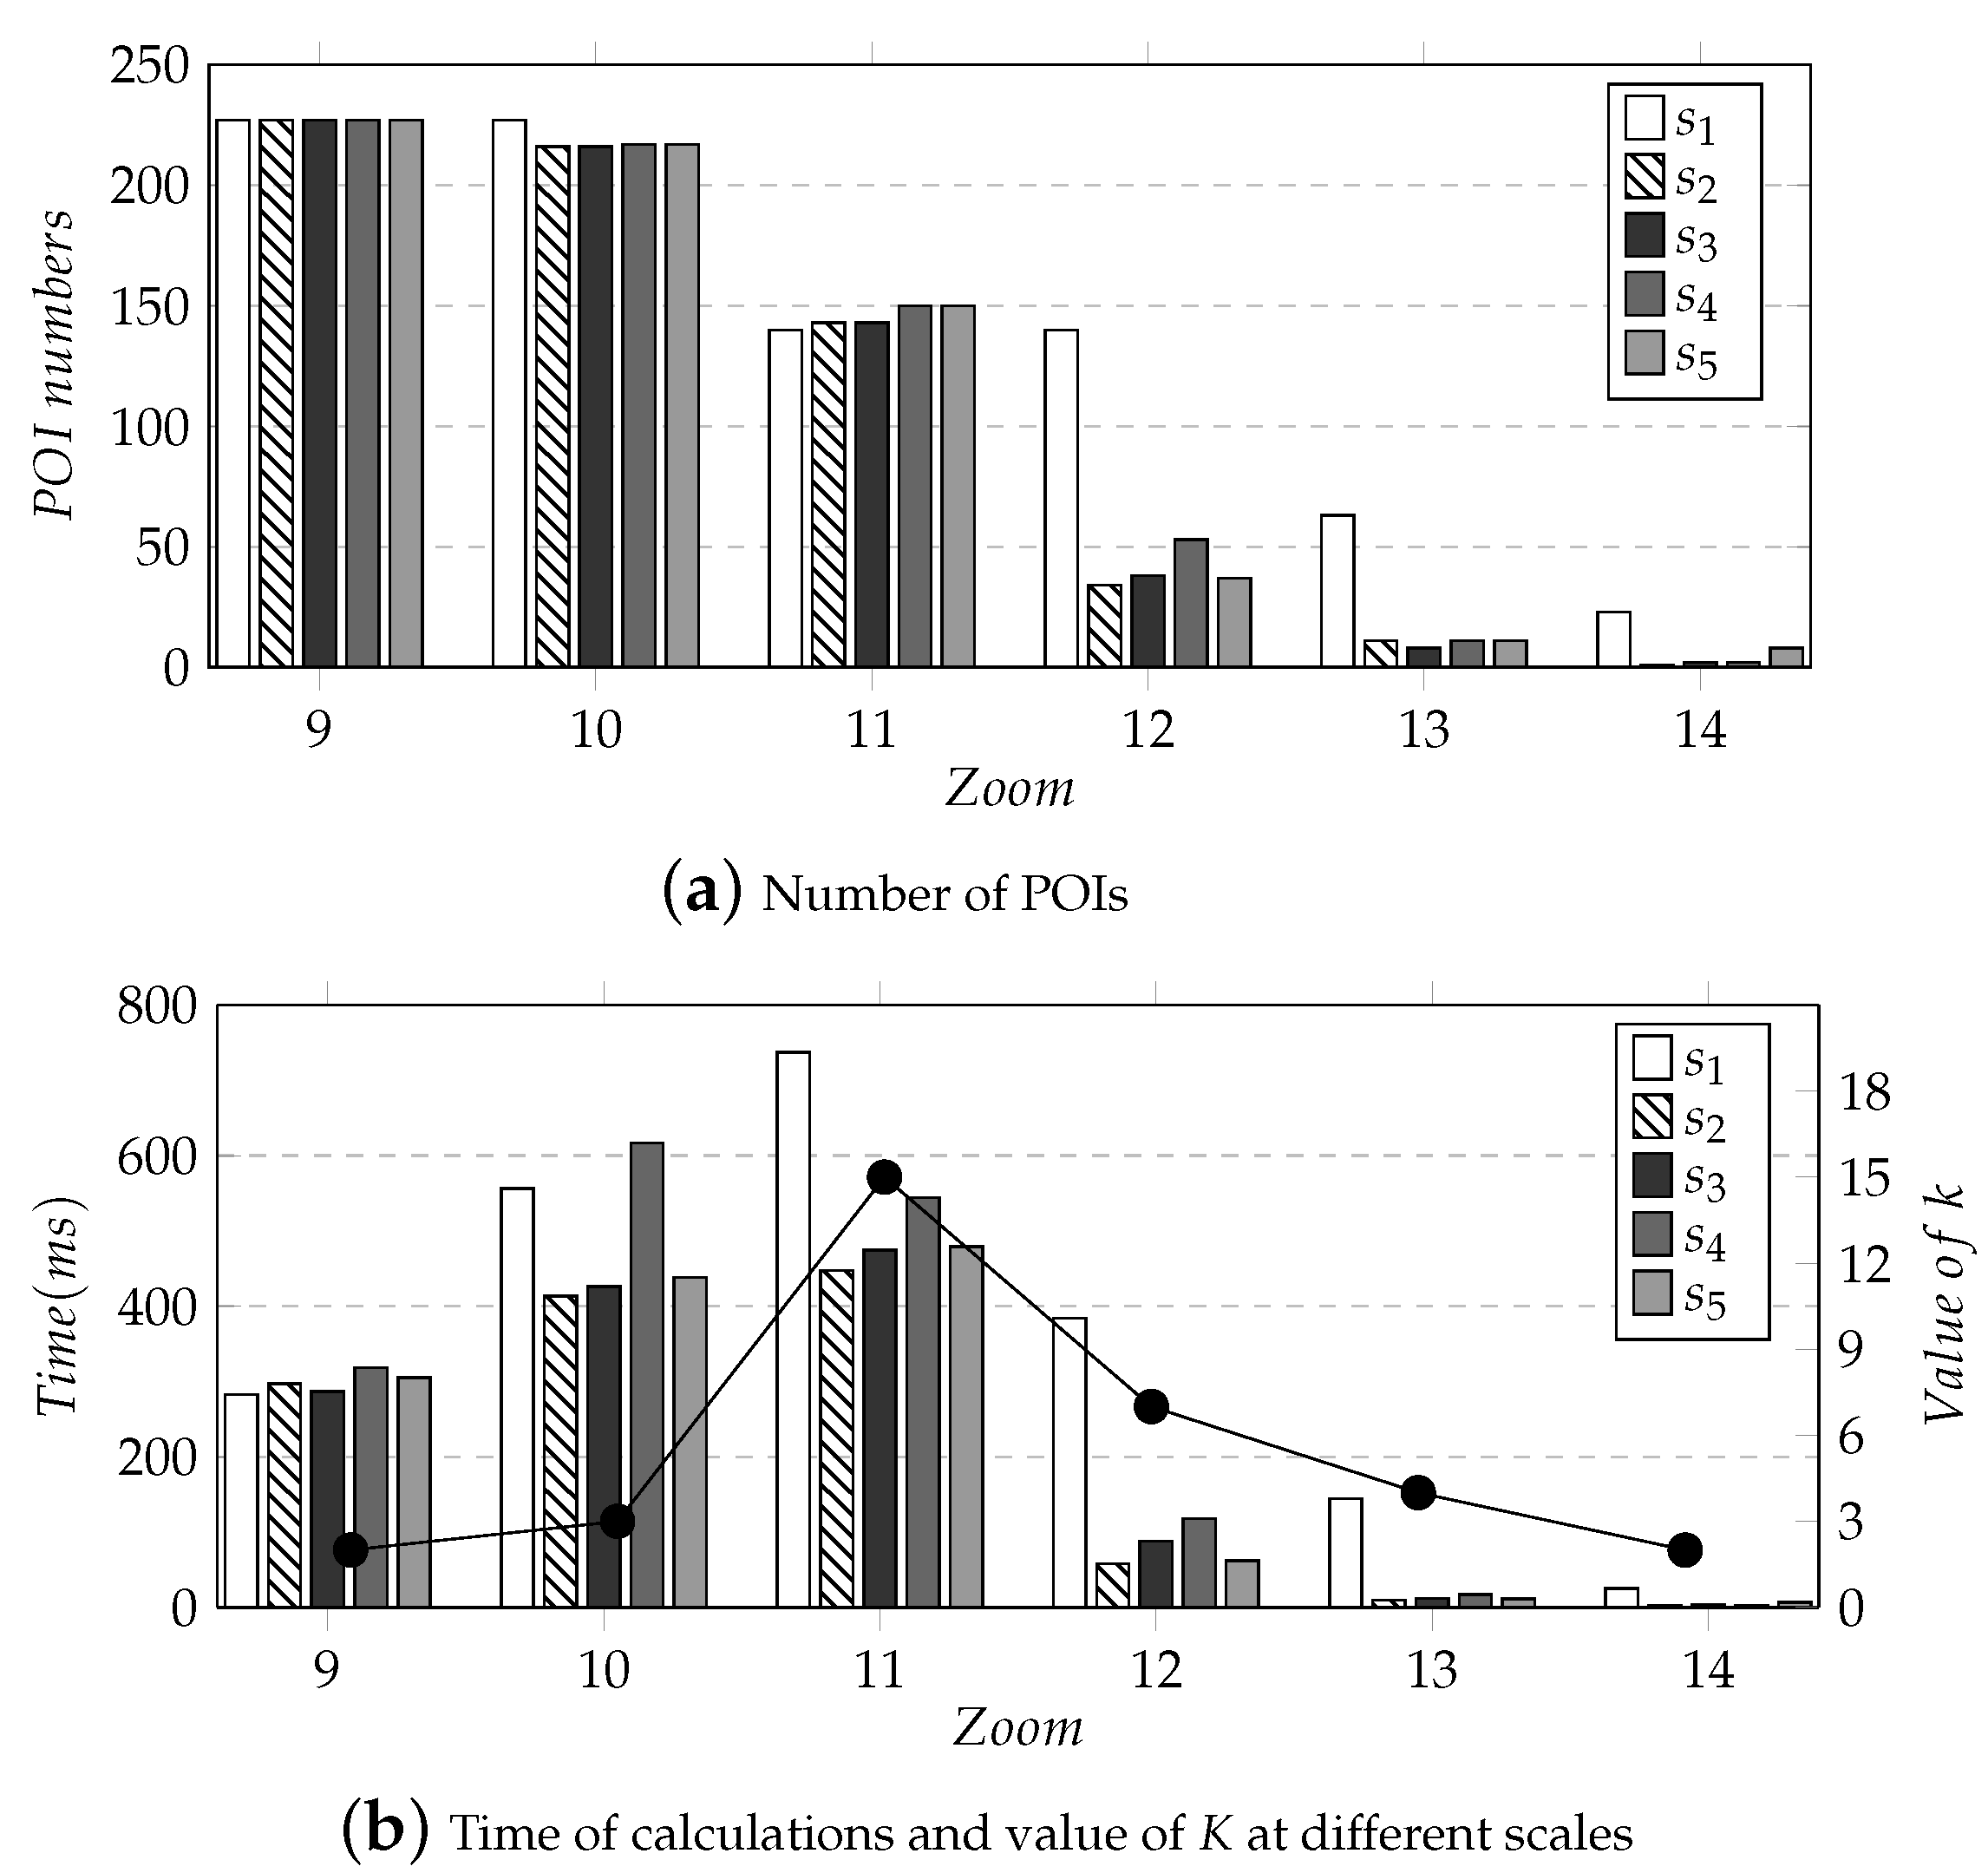
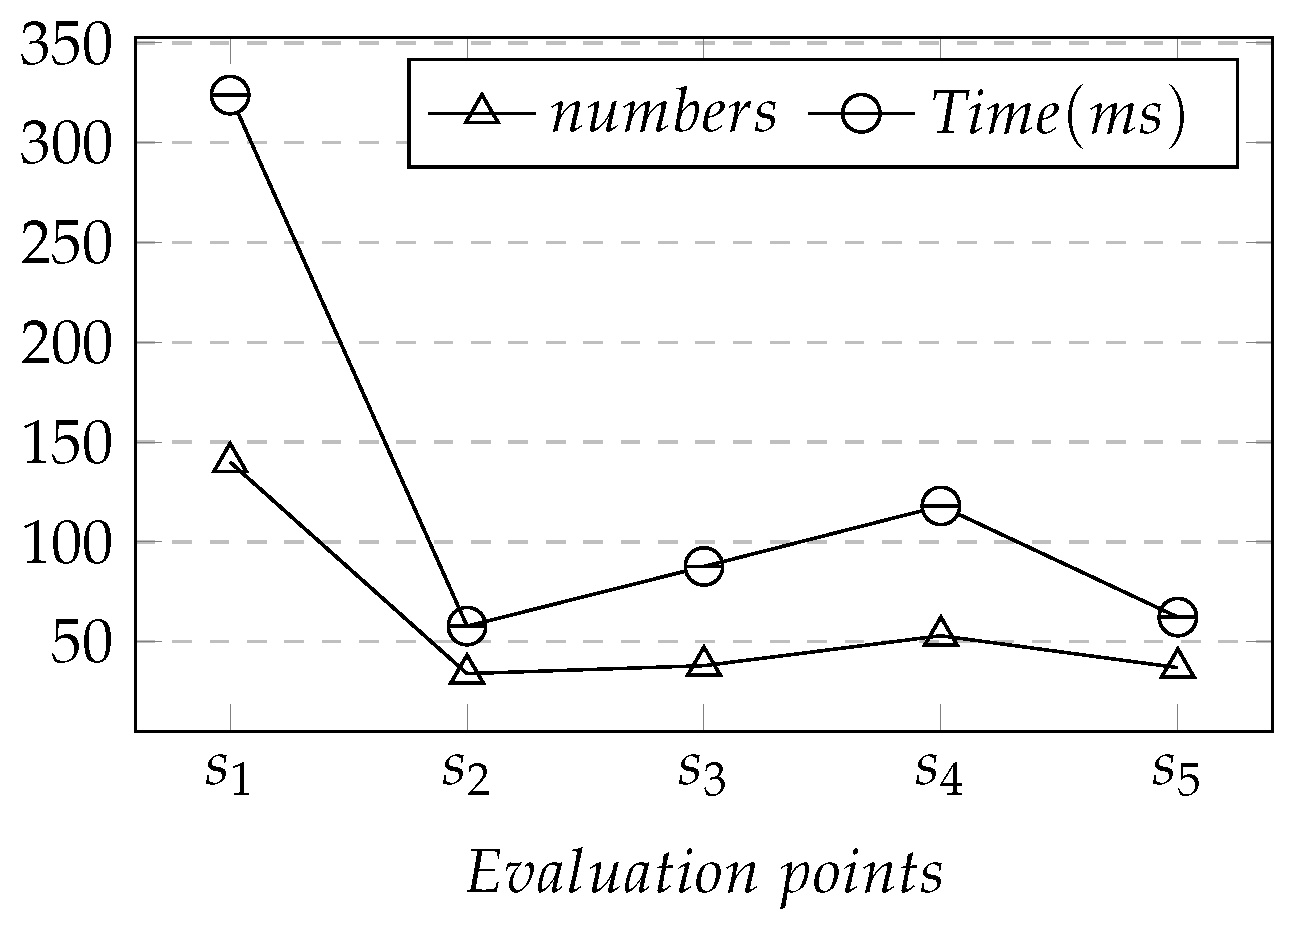
In order to reasonably evaluate the query efficiency of the experiment, five evaluation points to were used as the center position to perform experiments at different zoom levels. As we know from Section 5.2.1, when < 9, the five evaluation points to basically covered all POIs, while when > 14, the number of covered POIs was few, even when the number was 0, the levels in these two intervals did not participate in the query efficiency statistics. First, we evaluated the number of all POIs under the six different levels between 9 and 14 with the five positions as the center point. The results are shown in Figure 9a. It can be seen from Figure 9a that when the center position was fixed, as the zoom level increased, the number of POIs decreased. Simultaneously, the reduction of POIs with as the center point of the map was much smaller than that of other evaluation points.
Then, to evaluate the time required for the Skyline-based -k query in the experiment, we calculated the computational efficiency of to at different zoom levels. At the same time, it is discussed in conjunction with the k value under different zoom levels, as shown in Figure 9b. It can be seen that the growth curve of the calculation time at different zoom levels was similar to that of k values so that the calculation time had a positive correlation with the value of k at this zoom level. Comparing the calculation time of zoom levels 10 and 13, the k value of zoom level 13 was greater than that of zoom level 10. However, the calculation time of zoom level 13 was much less than that of zoom level 10, and the calculation time was positively correlated with the number of POIs. When the zoom levels were the same, the k values were equal, and the amplitude curve of the calculation time was roughly similar to that of the POI number, as shown in Figure 10. To sum up, the k value in different zoom levels, and the number of POIs in the visible range, significantly impacted the algorithm’s calculation time.
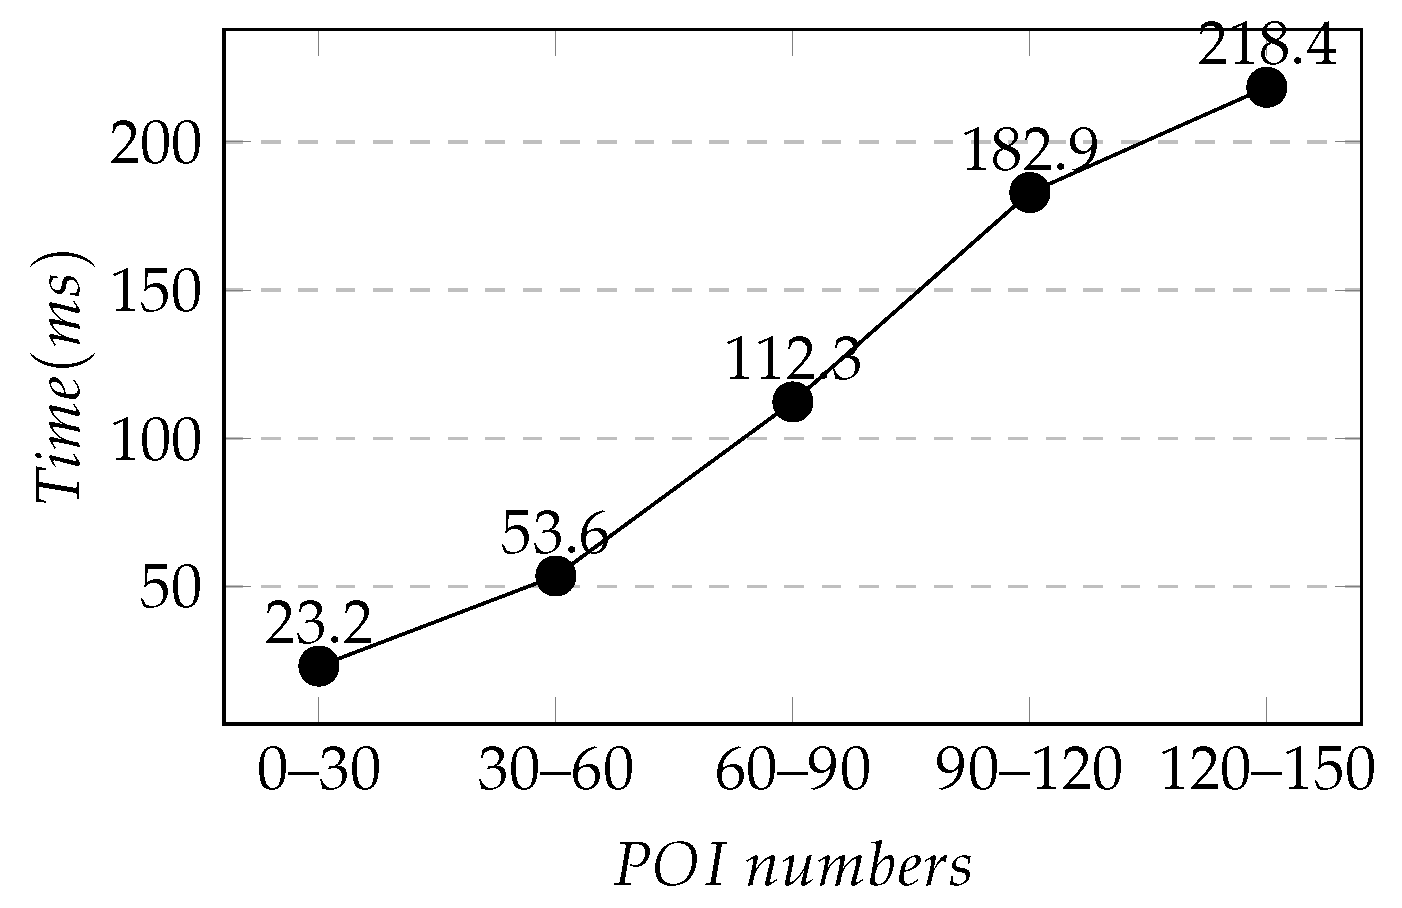
Finally, we evaluated the calculation time under dragging of the map, taking (116.3974, 39.9091) as the center of the map, and studying the relationship between the number of POIs at the end of the dragging and the algorithm running time when = 12. The number of POIs on the screen and -k query calculation time after a total of 50 times of dragging on the map were recorded. After dragging, the number of POIs on the screen fell within the interval [0, 150), so it was divided into five intervals to study, which were [0, 30), [30, 60), [60, 90), [90, 120) and [120, 150), and we calculated the average calculation time of each interval. The results are shown in Figure 11. The change of the center position caused by the dragging had an impact on the running time of the algorithm, and the running time of the algorithm was proportional to the number of POIs in the new visual range at the end of the dragging.
5.3.3. Varying , and
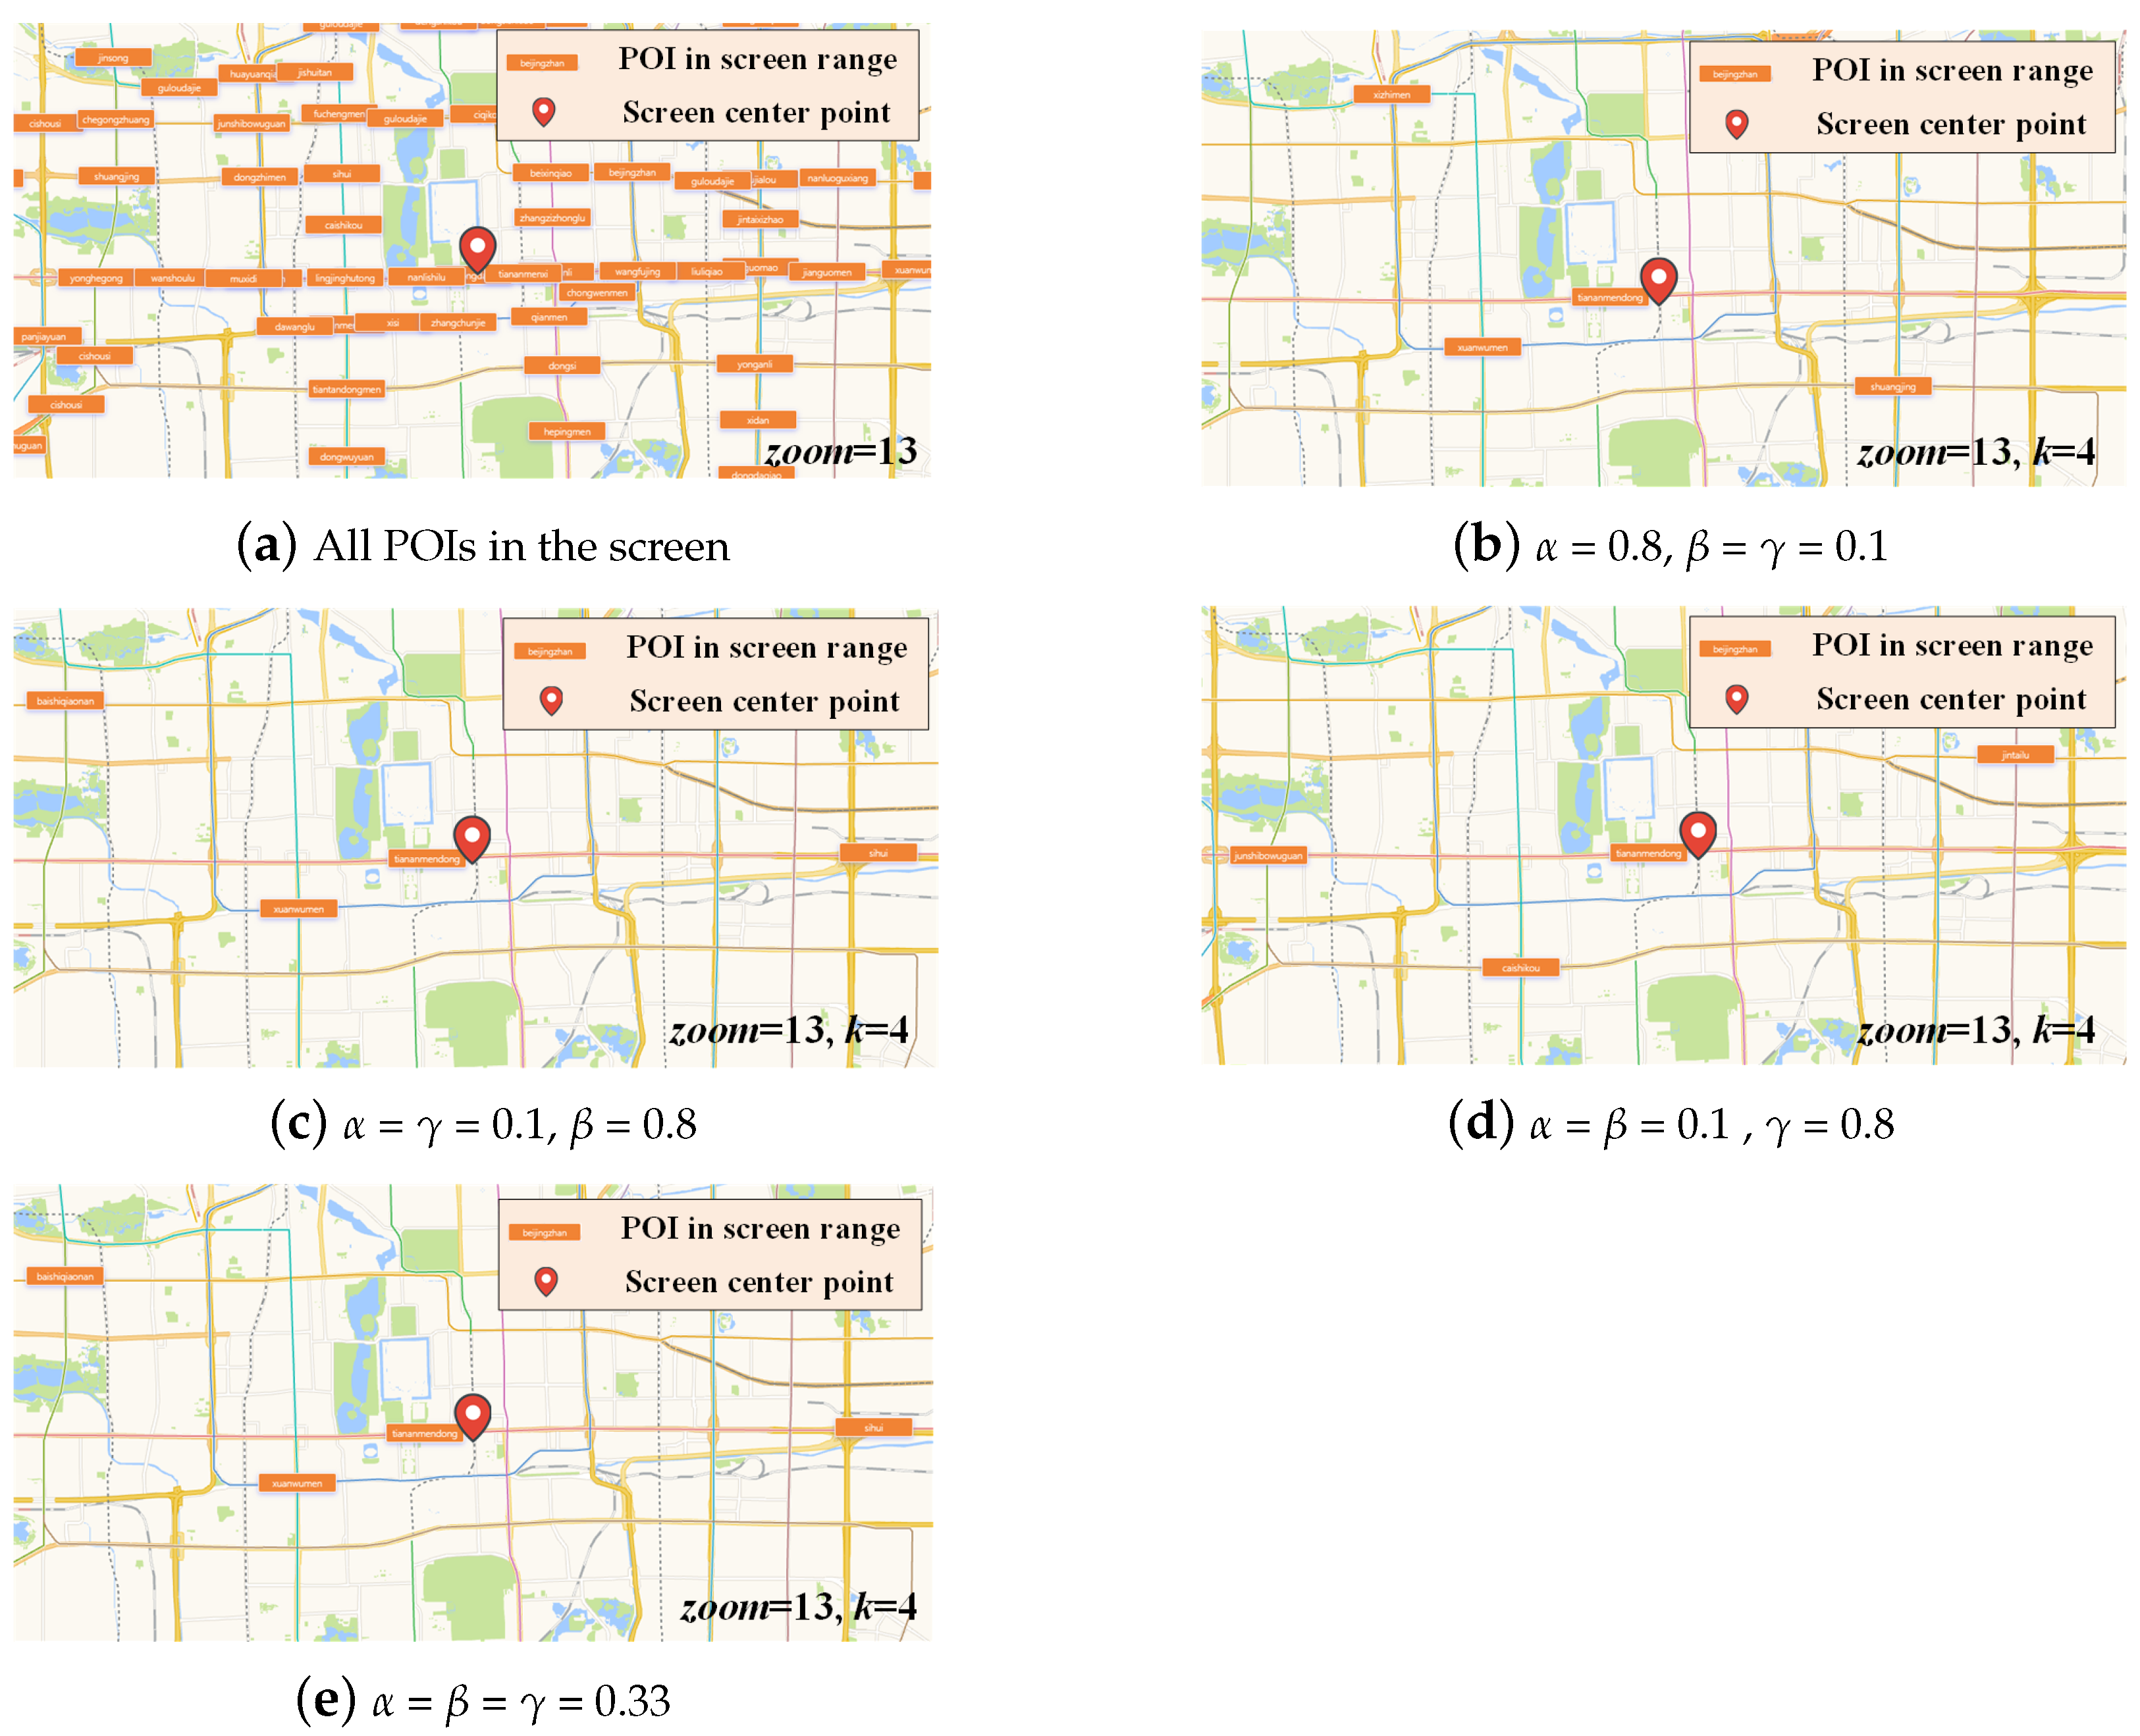
Taking as the current center position, in the case of = 13, k = 4, there were 63 subway stations in the current screen. We kept the position and the zoom level of the center point unchanged, changed the parameters , and , and evaluated the experimental results under different ratios of , and . Figure 12a shows all POIs on the screen in the current state. When = 0.8 and = = 0.1, it was the preference space constraint. After employing the skyline-based -k ranking algorithm, the -k POIs with the highest total scores were Tiananmen East, Xizhimen, Shuangjing and Xuanwumen, as shown in Figure 12b. When = = 0.1 and = 0.8, the similarity of passenger flow was preferred. The -k POIs with the highest scores were Tiananmen East, Baishiqiao South, Sihui and Xuanwumen, as shown in Figure 12c. When = = 0.1 and = 0.8, it was the preferred transfer station, and the -k POIs with the highest scores were Tiananmen East, Military Museum, Jintai Road and Caishikou, as shown in Figure 12d. When = = = 0.33, the three constraints were in equilibrium. The -k POIs obtained by our method were Tiananmen East, Baishiqiao South, Sihui, and Xuanwumen, as shown in Figure 12e.
In Table 4, to are the POIs from -1 to -4 under different , and values. The score was the score calculated by Equation (5), which represented the degree of importance, where -1 was the closest point to the center of the map in the current state, which was the basis of the ranking method, and the was set to 1.
5.3.4. Effectiveness
In order to evaluate the influence of the values of , and on user experience, and to improve the effectiveness of our method for displaying key information, we searched for and invited 15 users to score the quality of representative objects (1–10). All POIs in the screen range were scored on a scale of 0 to 1, based on their representative quality (the degree of importance of the selected object), where 0 and 1 were the lowest and highest scores, respectively. The average of the scoring results of each POI was sorted by size, and, then, the POIs and scores of the -4 POIs were calculated, as shown in Table 4. We found that the users’ scores were basically consistent with the representative objects’ scores generated by our method, which proved the effectiveness of our method for displaying the key information.
We further studied user satisfaction after zooming in (), zooming out () and panning () by asking users to evaluate the quality of representative POIs after conducting each of the three operations. The results are shown in Table 4.
6. Discussion and Conclusions
How to select the most qualified information from a large quantity of data is always an important topic in data management and information retrieval. At present, spatial data retrieval methods based on map zoom level are essential to assign a number to each spatial record, which corresponds to the zoom level of the scalable map. These schemes offer static display of POIs. At present, there is a lack of a dynamic data retrieval scheme under different map scaling levels and different center points. This paper provides a scheme that can dynamically display data sample sets in a specific geographical area and zoom level according to the target data set. Each dynamic retrieval can update and display geographic spatiotemporal data in real time according to the new POI collection, so as to make the expression of information more timely, fresh and accurate.
In order to solve the shortcomings of the existing map services of rail transit stations, and to provide people with a better service experience, this paper combined the three constraints of spatial constraint, time-sharing passenger flow analysis and whether a station is a transfer station, and proposed a Skyline-based -k sorting method which can dynamically display the k most representative traffic stations within the user’s visible range under the current screen zoom level. When the map zoom level changes, or the user drags the map, the displayed POIs are updated and adjusted. By using Beijing rail transit data and Beijing AFC data in experiments, the calculation efficiency of the method under the change of zoom level or map dragging was analyzed statistically. Finally, combined with users’ evaluations, it was demonstrated that our method could better display the key information and improve the user experience. In the future, we will further distinguish the surrounding stations based on this visualization method, and optimize the retrieval method to improve the retrieval efficiency.
Author Contributions
Conceptualization and methodology, Zhi Cai and Fangzhe Liu; experiment and evaluation, Fangzhe Liu and Qiong Qi; writing—original draft and validation, Fangzhe Liu and Qiong Qi; supervision, Xing Su; writing—review and editing, Xing Su, Limin Guo and Zhiming Ding. All authors have read and agreed to the published version of the manuscript.
Funding
This work was supported in part by the National Natural Science of Foundation of China under Grant 62072016, 62276011 and the Beijing Natural Science Foundation under Grant 4212016.
Data Availability Statement
The data presented in this study are available on request from the corresponding author.
Acknowledgments
The authors would like to thank the anonymous reviewers and the members of the editorial team for their comments and contributions. Thanks for the partial support of the National Natural Science of Foundation of China under Grant 62072016, 62276011 and the Beijing Natural Science Foundation under Grant 4212016.
Conflicts of Interest
The authors declare no conflict of interest.
References
- Hang, M.; Ningning, H.; Mingyang, C. The Development and Problems of Land Use Along Urban Rail Transit in China. IEEE 2005, 2, 537–540. [Google Scholar]
- Bernhardsen, T. Geographic information systems: An introduction; John Wiley & Sons: Hoboken, NJ, USA, 2002. [Google Scholar]
- Guo, Z.; Zhao, J.; Whong, C.; Mishra, P.; Wyman, L. Redesigning subway map to mitigate bottleneck congestion: An experiment in Washington DC using Mechanical Turk. Transp. Res. Part Policy Pract. 2017, 106, 158–169. [Google Scholar] [CrossRef]
- Seefeld, B.A.; Kanodia, N.; Windram, E.M. Displaying Layers Of Search Results On A Map. U.S. Patent 8,489,641, 16 July 2013. [Google Scholar]
- Zhou, A.Y. Location-based services: Architecture and progress. Jisuanji Xuebao (Chin. J. Comput.) 2011, 34, 1155–1171. [Google Scholar] [CrossRef]
- Cong, G.; Jensen, C.S.; Wu, D. Efficient retrieval of the top-k most relevant spatial web objects. Proc. Vldb Endow. 2009, 2, 337–348. [Google Scholar] [CrossRef] [Green Version]
- Rocha-Junior, J.B.; Gkorgkas, O.; Jonassen, S. Efficient processing of top-k spatial keyword queries. In International Symposium on Spatial and Temporal Databases; Springer: Berlin/Heidelberg, Germany, 2011; pp. 205–222. [Google Scholar]
- Shengguo, G.A.O.; Zhong, W.U. Modeling passenger flow distribution based on travel time of urban rail transit. J. Transp. Syst. Eng. Inf. Technol. 2011, 11, 124–130. [Google Scholar]
- Meng, Y.; Tian, X.; Li, Z.; Zhou, W.; Zhou, Z.; Zhong, M. Comparison analysis on complex topological network models of urban rail transit: A case study of Shenzhen Metro in China. Phys. Stat. Mech. Its Appl. 2020, 559, 125031. [Google Scholar] [CrossRef]
- Borzsony, S.; Kossmann, D.; Stocker, K. The skyline operator. In Proceedings of the 17th International Conference on Data Engineering, Heidelberg, Germany, 2–6 April 2001; IEEE: Piscataway, NJ, USA, 2001; pp. 421–430. [Google Scholar]
- Yu, C.; Ren, F.; Du, Q.; Zhao, Z.; Nie, K. Web map-based POI visualization for spatial decision support. Cartogr. Geogr. Inf. Sci. 2013, 40, 172–182. [Google Scholar] [CrossRef]
- Liu, K.; Yin, L.; Lu, F.; Mou, N. Visualizing and exploring POI configurations of urban regions on POI-type semantic space. Cities 2020, 99, 102610. [Google Scholar] [CrossRef]
- Harrower, M.; Bloch, M. MapShaper. org: A map generalization web service. IEEE Comput. Graph. Appl. 2006, 26, 22–27. [Google Scholar] [CrossRef] [PubMed]
- Jiang, B.; Liu, X.; Jia, T. Scaling of geographic space as a universal rule for map generalization. Ann. Assoc. Am. Geogr. 2013, 203, 844–855. [Google Scholar] [CrossRef] [Green Version]
- Das Sarma, A.; Lee, H.; Gonzalez, H.; Madhavan, J.; Halevy, A. Efficient spatial sampling of large geographical tables. In Proceedings of the 2012 ACM SIGMOD International Conference on Management of Data, Scottsdale, AZ, USA, 20–24 May 2012; pp. 193–204. [Google Scholar]
- Kefaloukos, P.K.; Salles, M.V.; Zachariasen, M. Declarative cartography: In-database map generalization of geospatial datasets. In Proceedings of the 2014 IEEE 30th International Conference on Data Engineering, Chicago, IL, USA, 31 March–4 April 2014; IEEE: Piscataway, NJ, USA, 2014; pp. 1024–1035. [Google Scholar]
- Liu, Z.; Jiang, C.; Wang, J.; Yu, H. The node importance in actual complex networks based on a multi-attribute ranking method. Knowl.-Based Syst. 2015, 84, 56–66. [Google Scholar] [CrossRef]
- Tan, Y.J.; Wu, J.; Deng, H.Z. Evaluation method for node importance based on node contraction in complex networks. Syst.-Eng.-Theory Pract. 2006, 11, 79–83. [Google Scholar]
- Xia, F.; Wang, J.; Kong, X.; Zhang, D.; Wang, Z. Ranking station importance with human mobility patterns using subway network datasets. IEEE Trans. Intell. Transp. Syst. 2019, 21, 2840–2852. [Google Scholar] [CrossRef]
- Chung, Y.C.; Su, I.F.; Lee, C. Efficient computation of combinatorial skyline queries. Inf. Syst. 2013, 38, 369–387. [Google Scholar] [CrossRef]
- Huang, Z.; Jensen, C.S.; Lu, H.; Ooi, B.C. Skyline queries against mobile lightweight devices in MANETs. In Proceedings of the 22nd International Conference on Data Engineering (ICDE’06), Atlanta, GA, USA, 3–7 April 2006; IEEE: Piscataway, NJ, USA, 2006; p. 66. [Google Scholar]
- Ilyas, I.F.; Beskales, G.; Soliman, M.A. A survey of top-k query processing techniques in relational database systems. ACM Computing Surveys (CSUR) 2008, 40, 1–58. [Google Scholar] [CrossRef] [Green Version]
- Lin, X.; Yuan, Y.; Zhang, Q.; Zhang, Y. Selecting stars: The k most representative skyline operator. In Proceedings of the 2007 IEEE 23rd International Conference on Data Engineering, Istanbul, Turkey, 17–20 April 2007; IEEE: Piscataway, NJ, USA, 2007; pp. 86–95. [Google Scholar]
- Li, W.; Zhou, J. The optimize management of passenger organization in transfer station based on dynamic passenger flow analysis. Procedia-Soc. Behav. Sci. 2013, 96, 1322–1328. [Google Scholar] [CrossRef] [Green Version]
- Huang, Z.; Li, Q.; Li, F.; Xia, J. A novel bus-dispatching model based on passenger flow and arrival time prediction. IEEE Access 2019, 7, 106453–106465. [Google Scholar] [CrossRef]
- Zhang, C.H.; Song, R.; Sun, Y. Kalman filter-based short-term passenger flow forecasting on bus stop. J. Transp. Syst. Eng. Inf. Technol. 2011, 11, 154–159. [Google Scholar]
- Wei, Y.; Lin, S.; Chu, R.; Tian, Q.; Fei, W. A method of grading subway stations. Procedia Eng. 2016, 137, 806–810. [Google Scholar] [CrossRef] [Green Version]
- Tang, J.; Sanderson, M. Evaluation and user preference study on spatial diversity. In Proceedings of the European Conference on Information Retrieval, Virtual, 28 March–1 April 2010; Springer: Berlin/Heidelberg, Germany, 2010; pp. 179–190. [Google Scholar]
- Chen, M.C.; Wei, Y. Exploring time variants for short-term passenger flow. J. Transp. Geogr. 2011, 19, 488–498. [Google Scholar] [CrossRef]
- Pan, H.; Li, J.; Shen, Q.; Shi, C. What determines rail transit passenger volume? Implications for transit oriented development planning. Transp. Res. Part Transp. Environ. 2017, 57, 52–63. [Google Scholar] [CrossRef]
- Sadineni, P.K. Comparative Study on Skyline Query Processing Techniques on Big Data. In Proceedings of the 2020 Fourth International Conference on I-SMAC (IoT in Social, Mobile, Analytics and Cloud) (I-SMAC), Online, 7–9 October 2020; IEEE: Piscataway, NJ, USA, 2020; pp. 1045–1050. [Google Scholar]
- Ghosh, P.; Sen, S.; Cortesi, A. Skyline computation over multiple points and dimensions. Innov. Syst. Softw. Eng. 2021, 17, 141–156. [Google Scholar] [CrossRef]
Figure 1.
Example of surrounding POIs for existing map services.

Figure 2.
Example of spatial constraints.

Figure 3.
Traveler volume over equivalent time (hourly) of entering riders.

Figure 4.
Examples of overlapping icons.

Figure 5.
Flow chart of Skyline-based top-k sorting.

Figure 6.
Area A and s1–s5.

Figure 7.
Numbers and average values of POIs of – in different scales.

Figure 8.
Comparison of POI display effect.

Figure 9.
Number of POIs and run time of – in different scales.

Figure 10.
Number of POIs and calculation time of – under level 12.

Figure 11.
Number of POIs and the calculation time after dragging the map.

Figure 12.
Selection results under different , and values.


Table 1.
The area ratio of Region A to the visible region.
| 3 | 4 | 5 | 6 | 7 | 8 | 9 | 10 | |
|---|---|---|---|---|---|---|---|---|
| 0.000068 | 0.000168 | 0.000297 | 0.000977 | 0.003959 | 0.016387 | 0.067123 | 0.265499 | |
| k | 1 | 1 | 1 | 1 | 1 | 2 | 2 | 3 |
Table 2.
k value allocation table.
| Zoom | k Value |
|---|---|
| 1 | |
| 2 | |
| 10 | 3 |
| 13 | 4 |
| 12 | 7 |
| 11 | 15 |
Table 3.
Parameters and values.
| Parameters | Values |
|---|---|
| 0.8, 0.1, 0.1, 0.33 | |
| 0.1, 0.8, 0.1, 0.33 | |
| 0.1, 0.1, 0.8, 0.33 | |
| Skyline evaluation dimensions | |
| 3–18 | |
| k | 1–15 |
Table 4.
Experiment score and user score.
| POIs | ||||||||
|---|---|---|---|---|---|---|---|---|
| Param | ||||||||
| = 0.8, = = 0.1 | Tiananmen East (1) | Xizhimen (0.90001) | Shuangjing (0.86060) | Xuanwumen (0.78215) | * | * | * | |
| = = 0.1, = 0.8 | Tiananmen East (1) | Baishiqiao South (0.20012) | Sihui (0.19513) | Xuanwumen (0.18534) | * | * | * | |
| = = 0.1, = 0.8 | Tiananmen East (1) | Military Museum (0.80004) | Jintai Road (0.80001) | Caishikou (0.79997) | * | * | * | |
| = = = 0.33 | Tiananmen East (1) | Baishiqiao South (0.70004) | Sihui (0.68524) | Xuanwumen (0.65583) | * | * | * | |
| 8/10 | 7/10 | 8/10 | 8/10 | 8/10 | 8/10 | 9/10 | ||
(1) Because the three operations of zoomin, zoomout and translation only focus on the quality of the query, the POI
score is replaced by *.
Disclaimer/Publisher’s Note: The statements, opinions and data contained in all publications are solely those of the individual author(s) and contributor(s) and not of MDPI and/or the editor(s). MDPI and/or the editor(s) disclaim responsibility for any injury to people or property resulting from any ideas, methods, instructions or products referred to in the content. |
© 2023 by the authors. Licensee MDPI, Basel, Switzerland. This article is an open access article distributed under the terms and conditions of the Creative Commons Attribution (CC BY) license (https://creativecommons.org/licenses/by/4.0/).
Share and Cite
MDPI and ACS Style
Cai, Z.; Liu, F.; Qi, Q.; Su, X.; Guo, L.; Ding, Z. Skyline-Based Sorting Approach for Rail Transit Stations Visualization. ISPRS Int. J. Geo-Inf. 2023, 12, 110. https://doi.org/10.3390/ijgi12030110
AMA Style
Cai Z, Liu F, Qi Q, Su X, Guo L, Ding Z. Skyline-Based Sorting Approach for Rail Transit Stations Visualization. ISPRS International Journal of Geo-Information. 2023; 12(3):110. https://doi.org/10.3390/ijgi12030110
Chicago/Turabian StyleCai, Zhi, Fangzhe Liu, Qiong Qi, Xing Su, Limin Guo, and Zhiming Ding. 2023. "Skyline-Based Sorting Approach for Rail Transit Stations Visualization" ISPRS International Journal of Geo-Information 12, no. 3: 110. https://doi.org/10.3390/ijgi12030110
Note that from the first issue of 2016, this journal uses article numbers instead of page numbers. See further details here.