

Novel Green Fluorescent Polyamines to Analyze ATP13A2 and ATP13A3 Activity in the Mammalian Polyamine Transport System
 , , , , , and
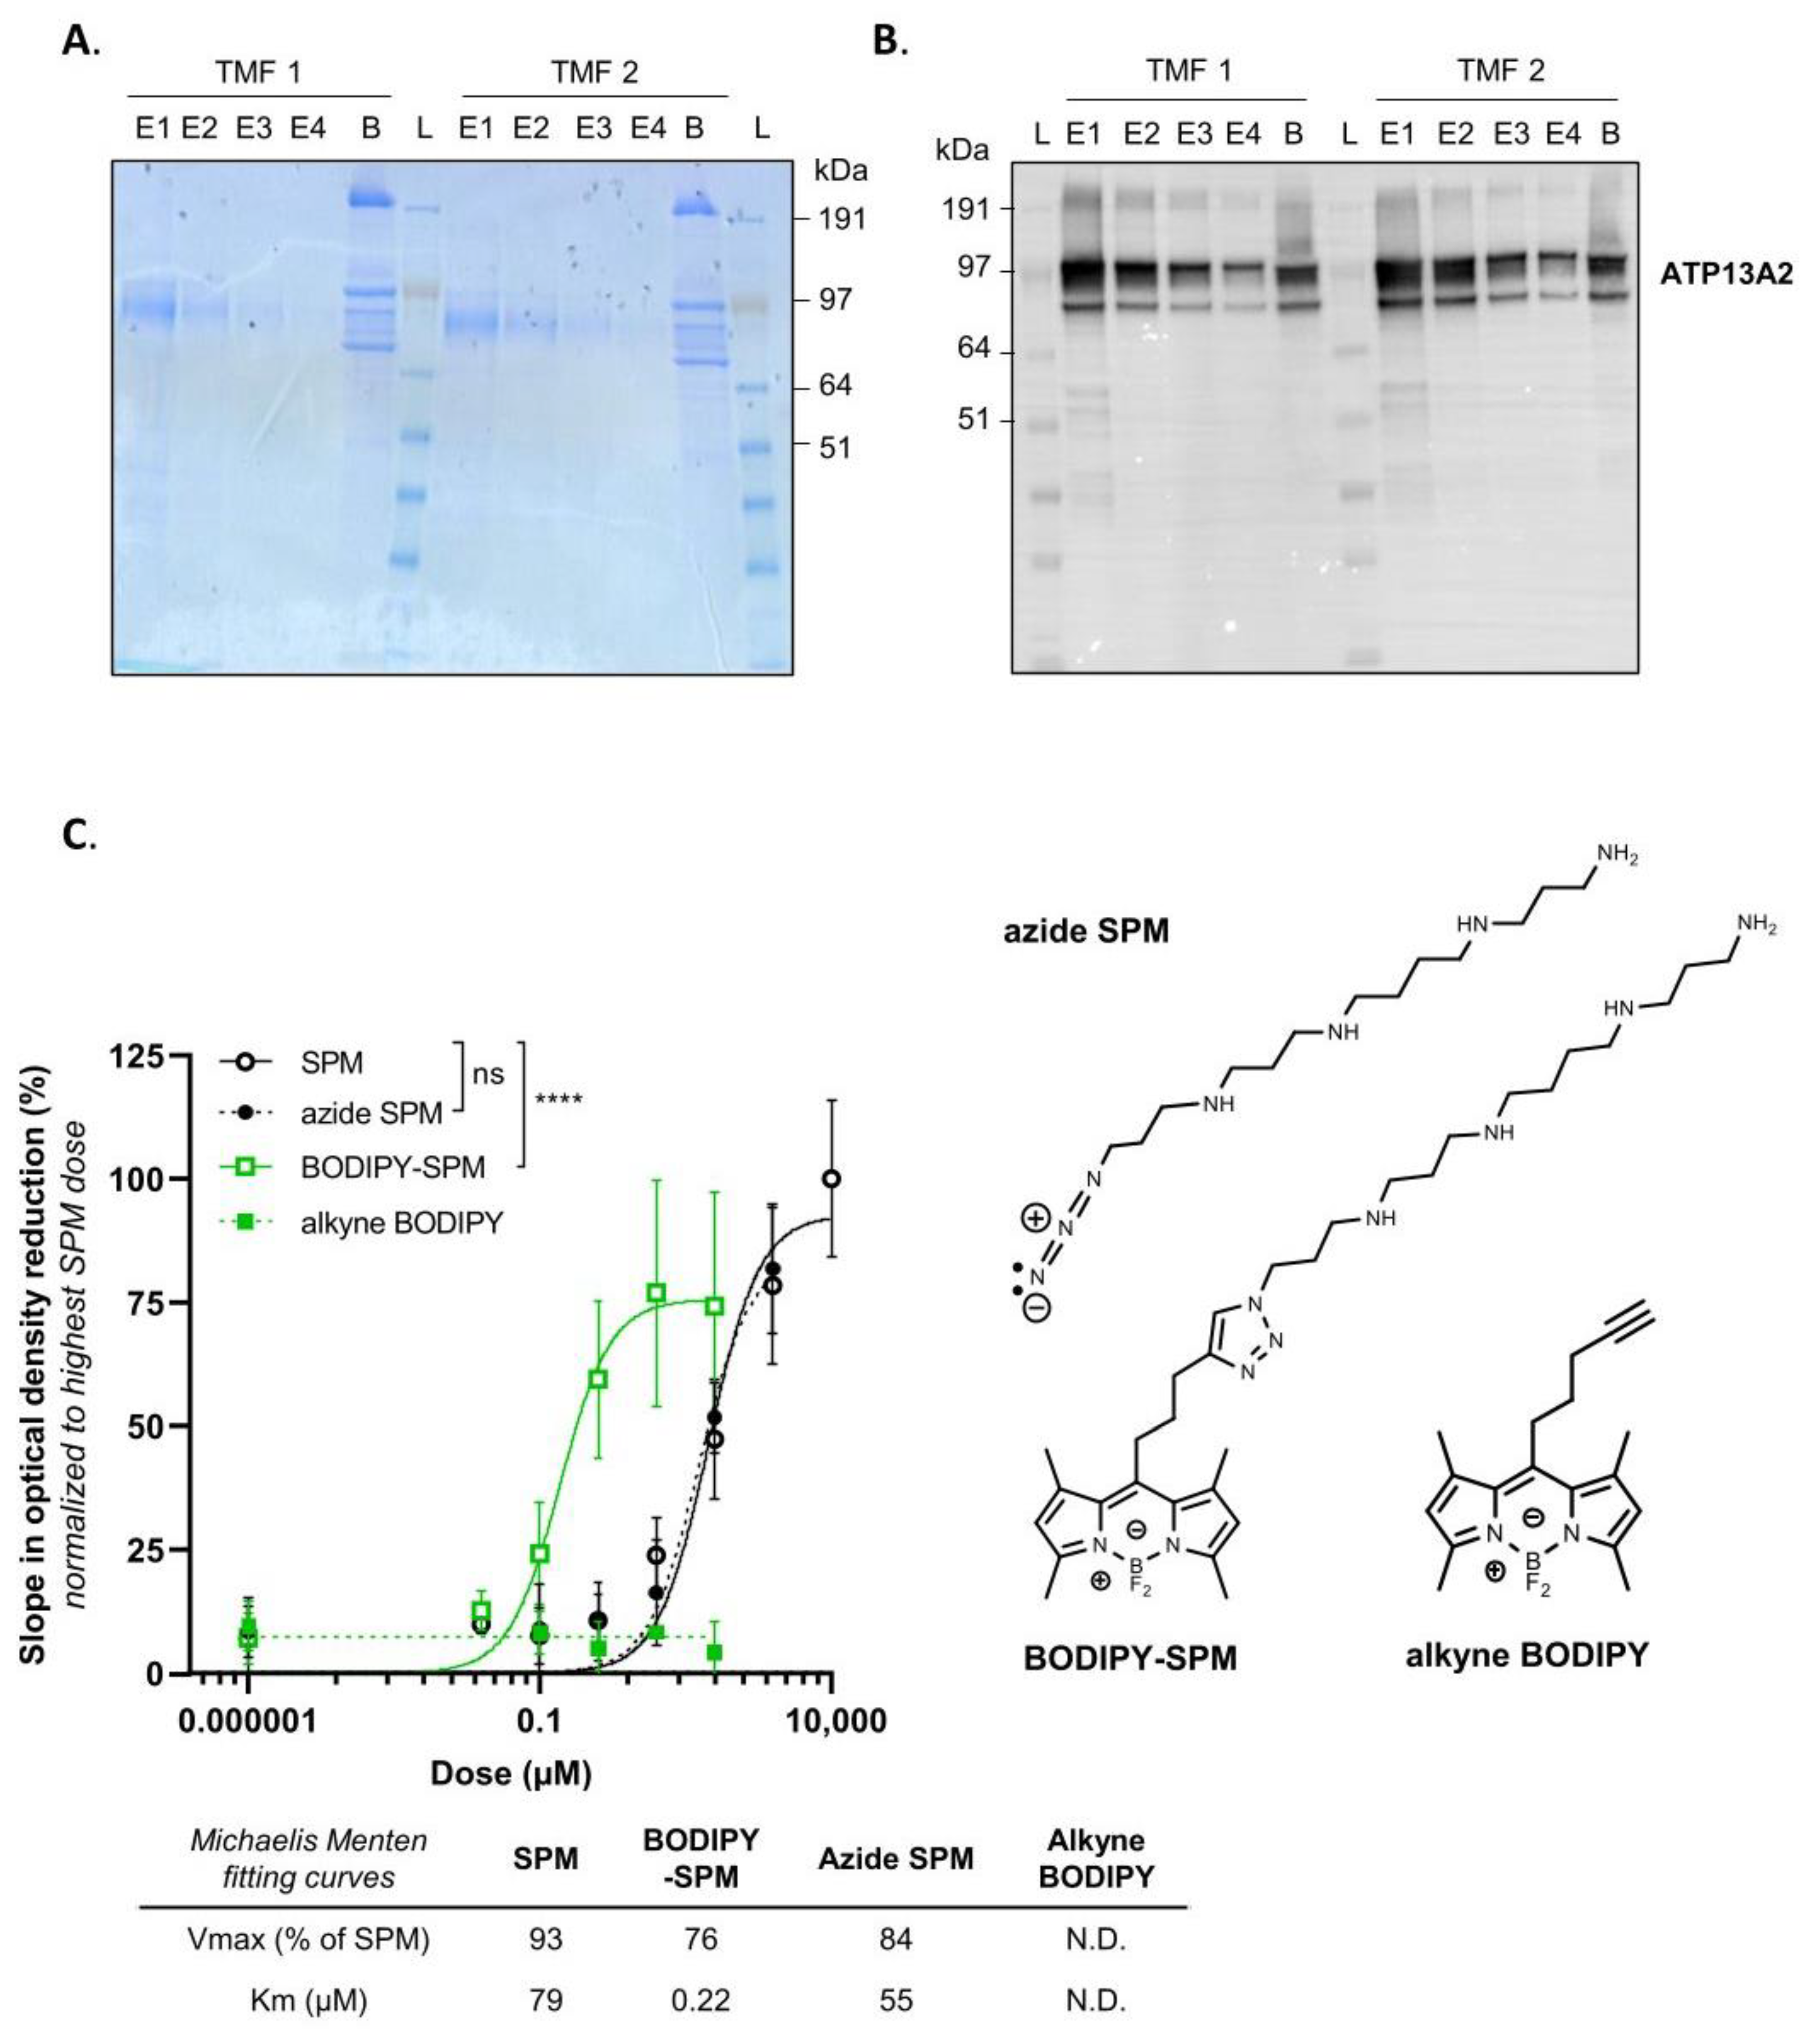
Abstract
:1. Introduction
2. Materials and Methods
2.1. Preparation of Compounds
2.2. Lentiviral Transduction and Cell Culture
2.3. Western Blotting
2.4. ATP/NADH-Enzyme Coupled ATPase Assay
2.5. Chemical Synthesis of Fluorescently Labeled Polyamines
2.6. Acquisition of Absorption and Emission Spectra
2.7. Cellular Polyamine Uptake and Endocytosis Assay
2.8. Radiolabeled Polyamine Uptake Assay
2.9. Statistics and Data Analysis
3. Results
3.1. BODIPY-Conjugated SPM Is a Genuine Transport Substrate of ATP13A2
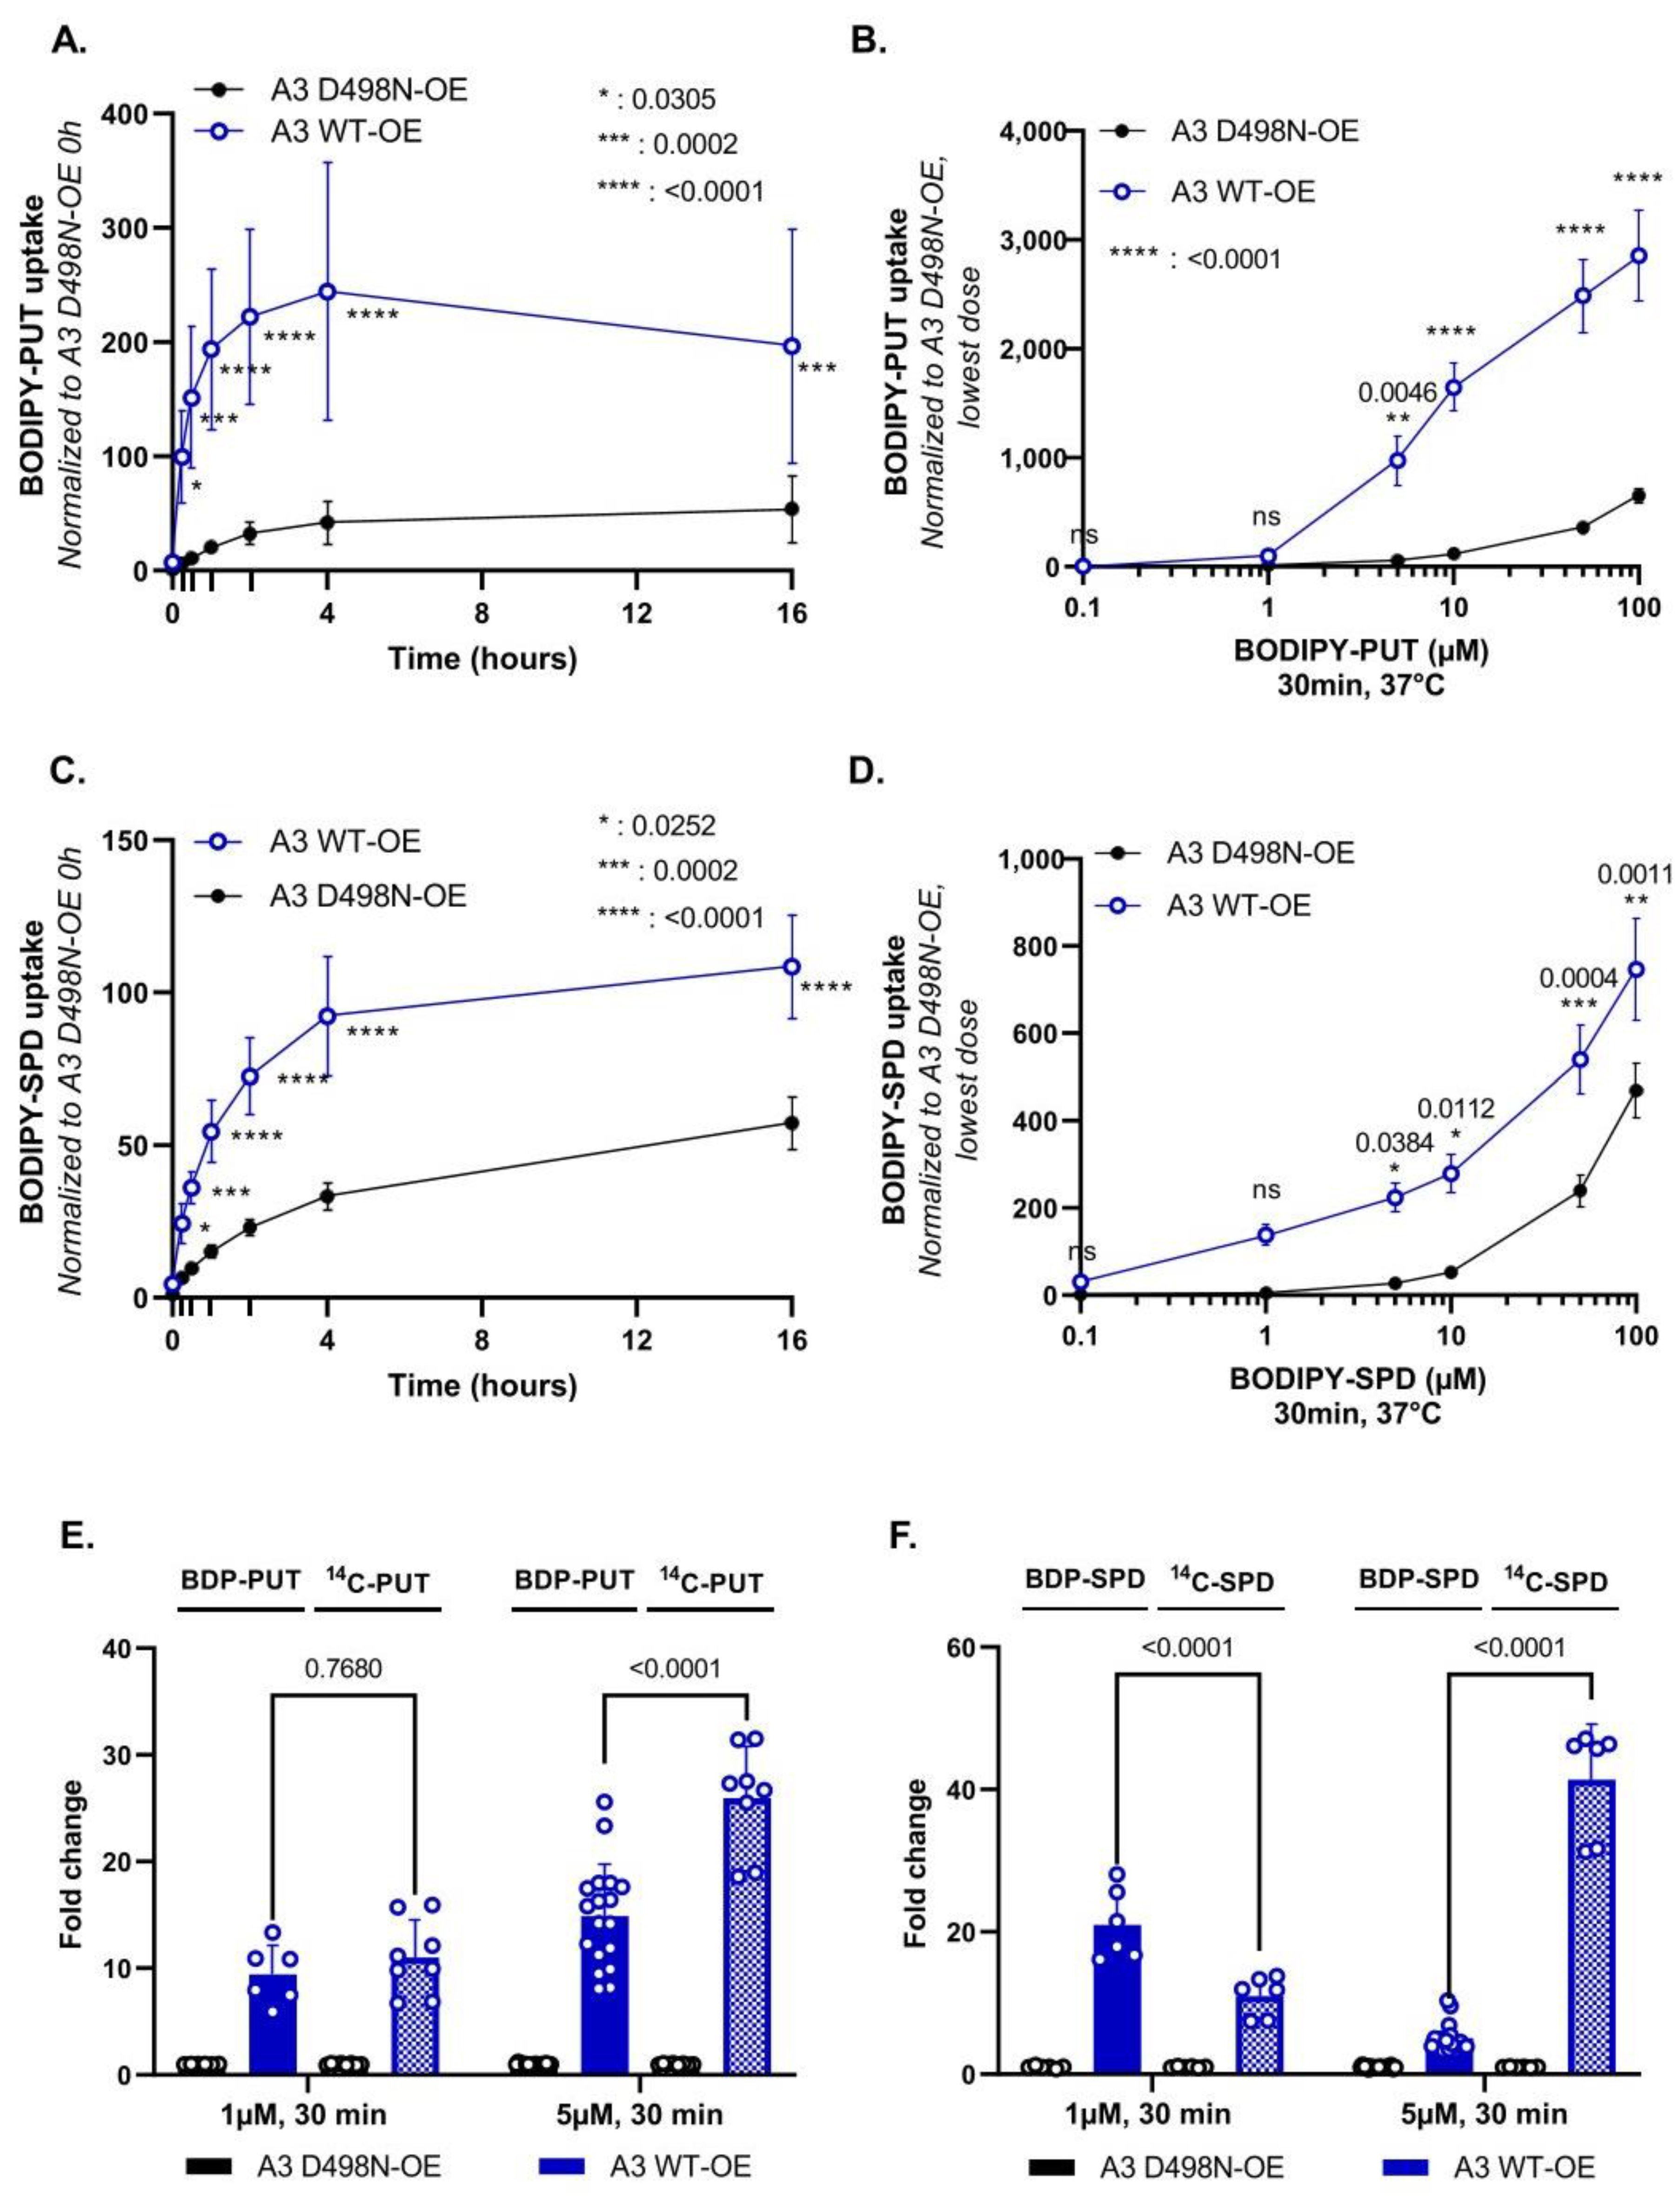
3.2. Evaluation of BODIPY-PUT and BODIPY-SPD Uptake in a New Human ATP13A3 Cell Model
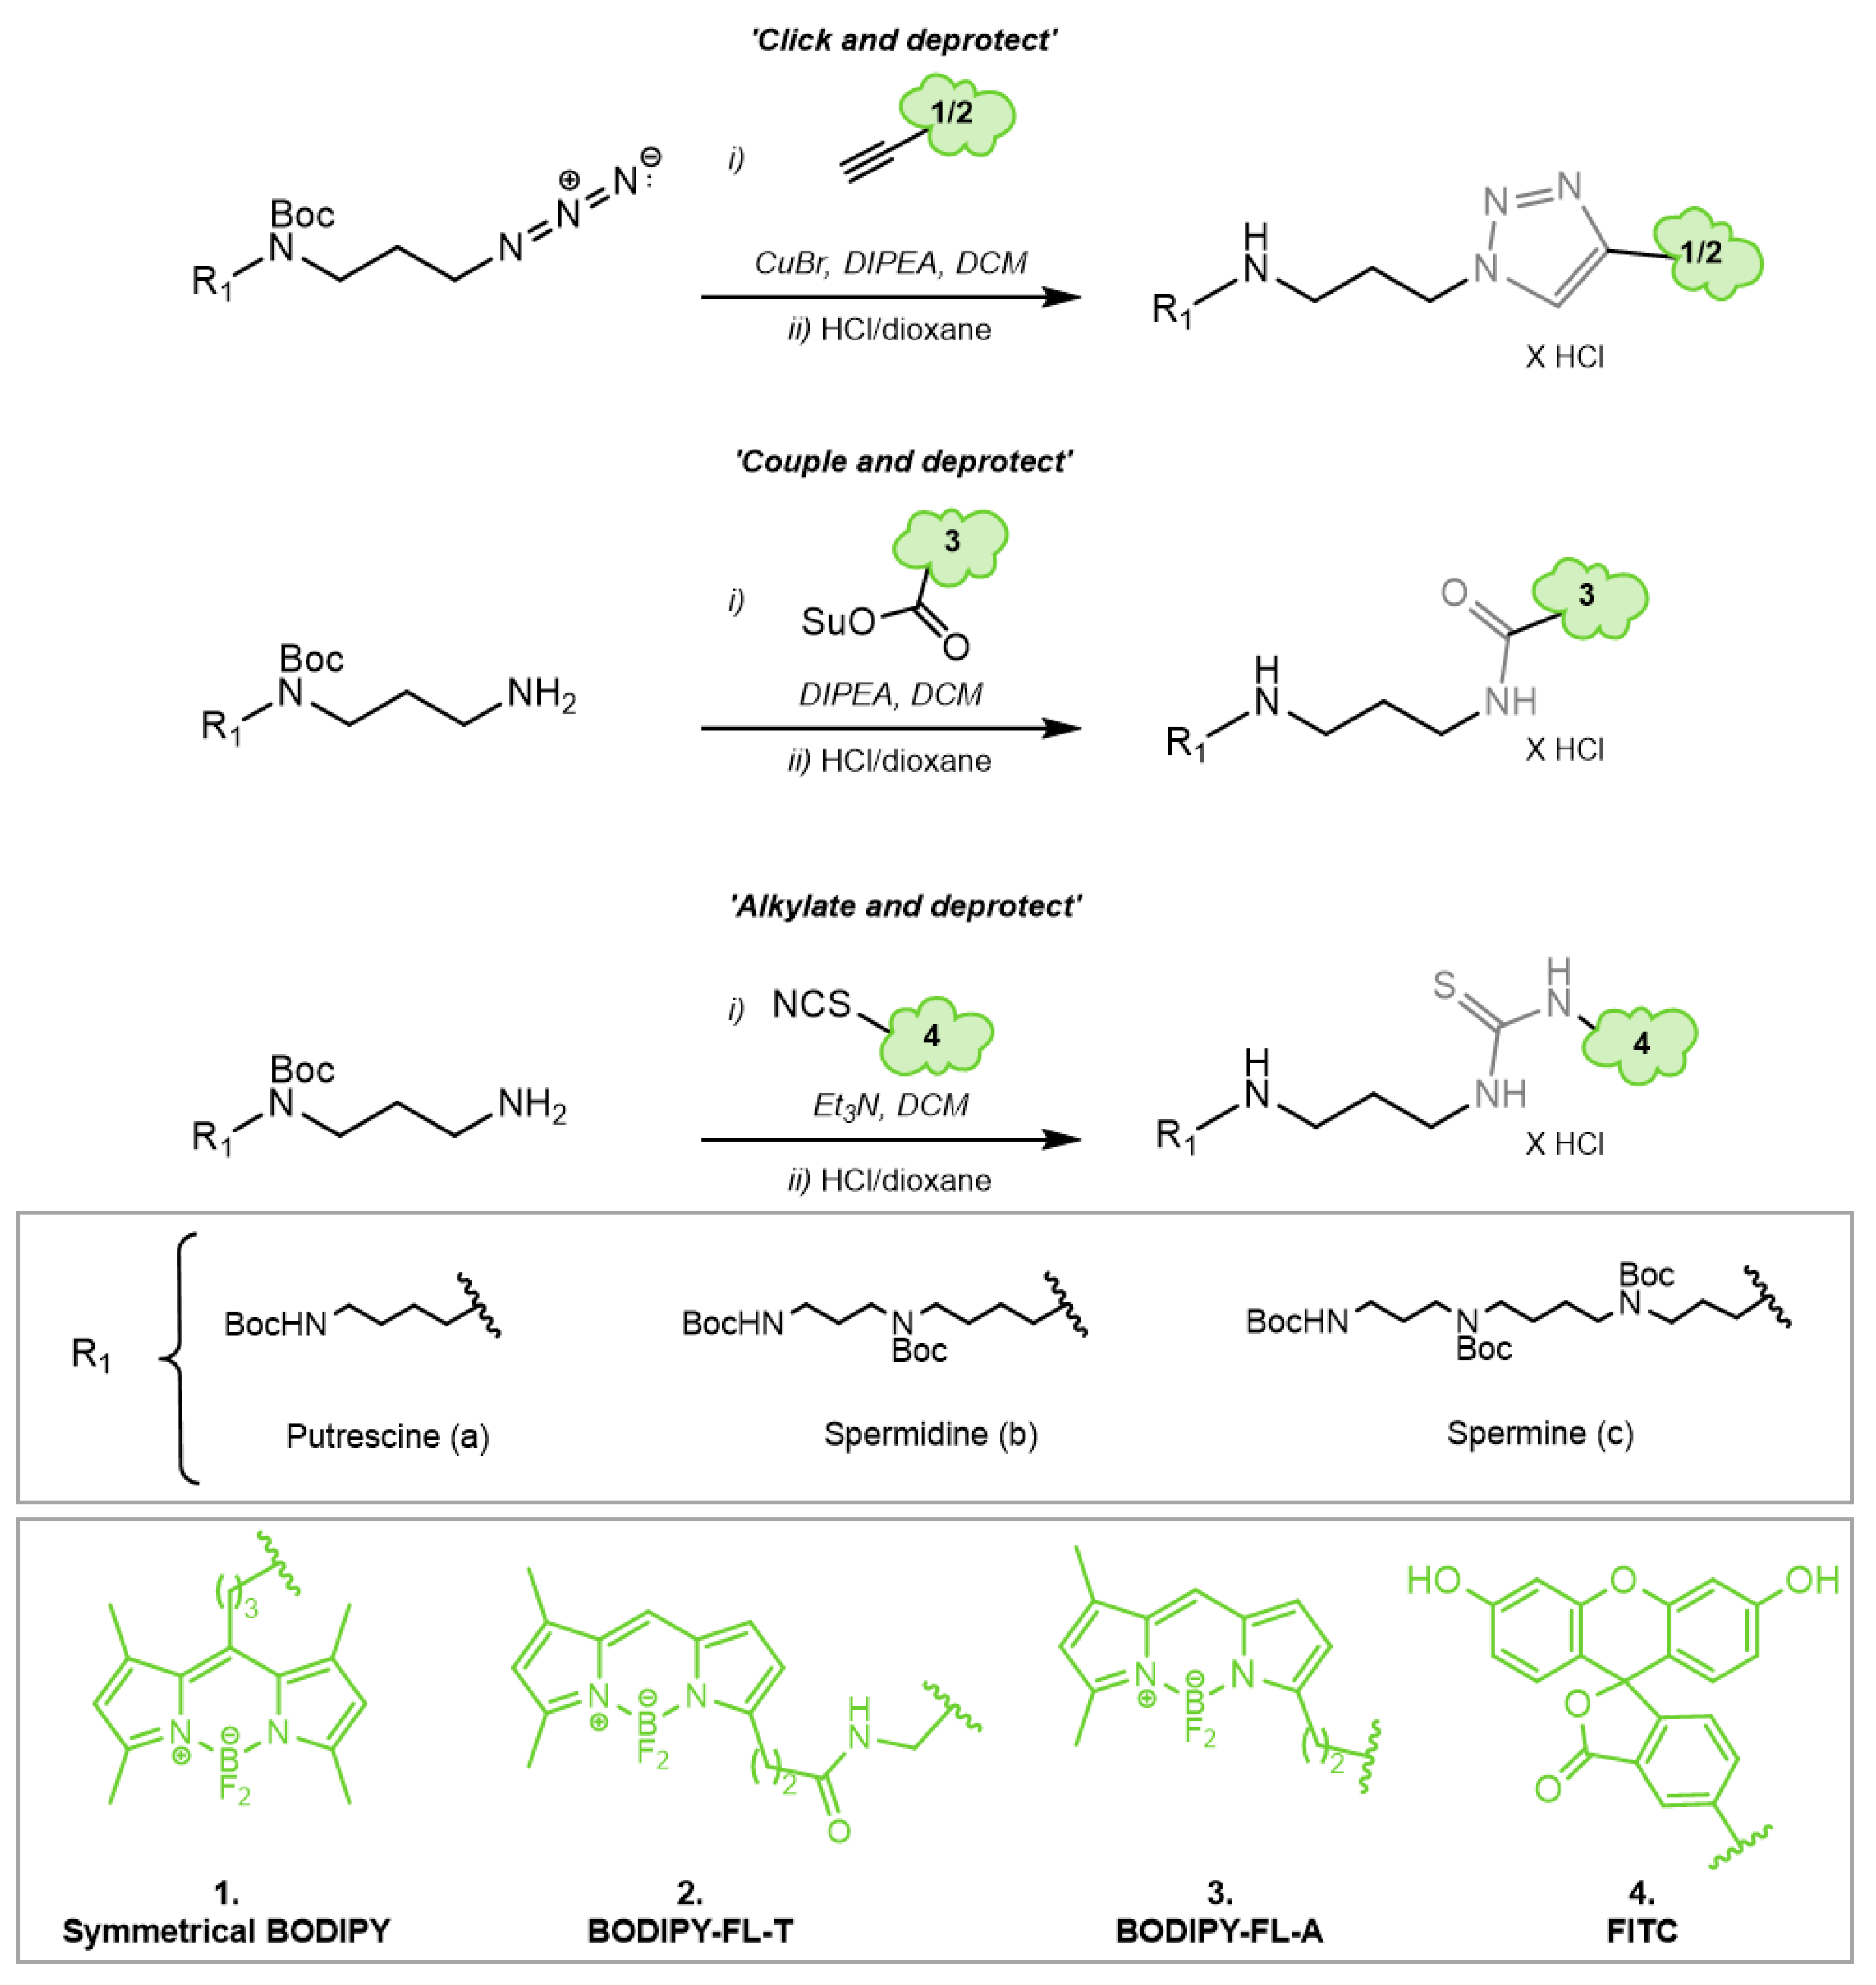
3.3. Chemical Synthesis of Novel Green Fluorescent Polyamine Conjugates
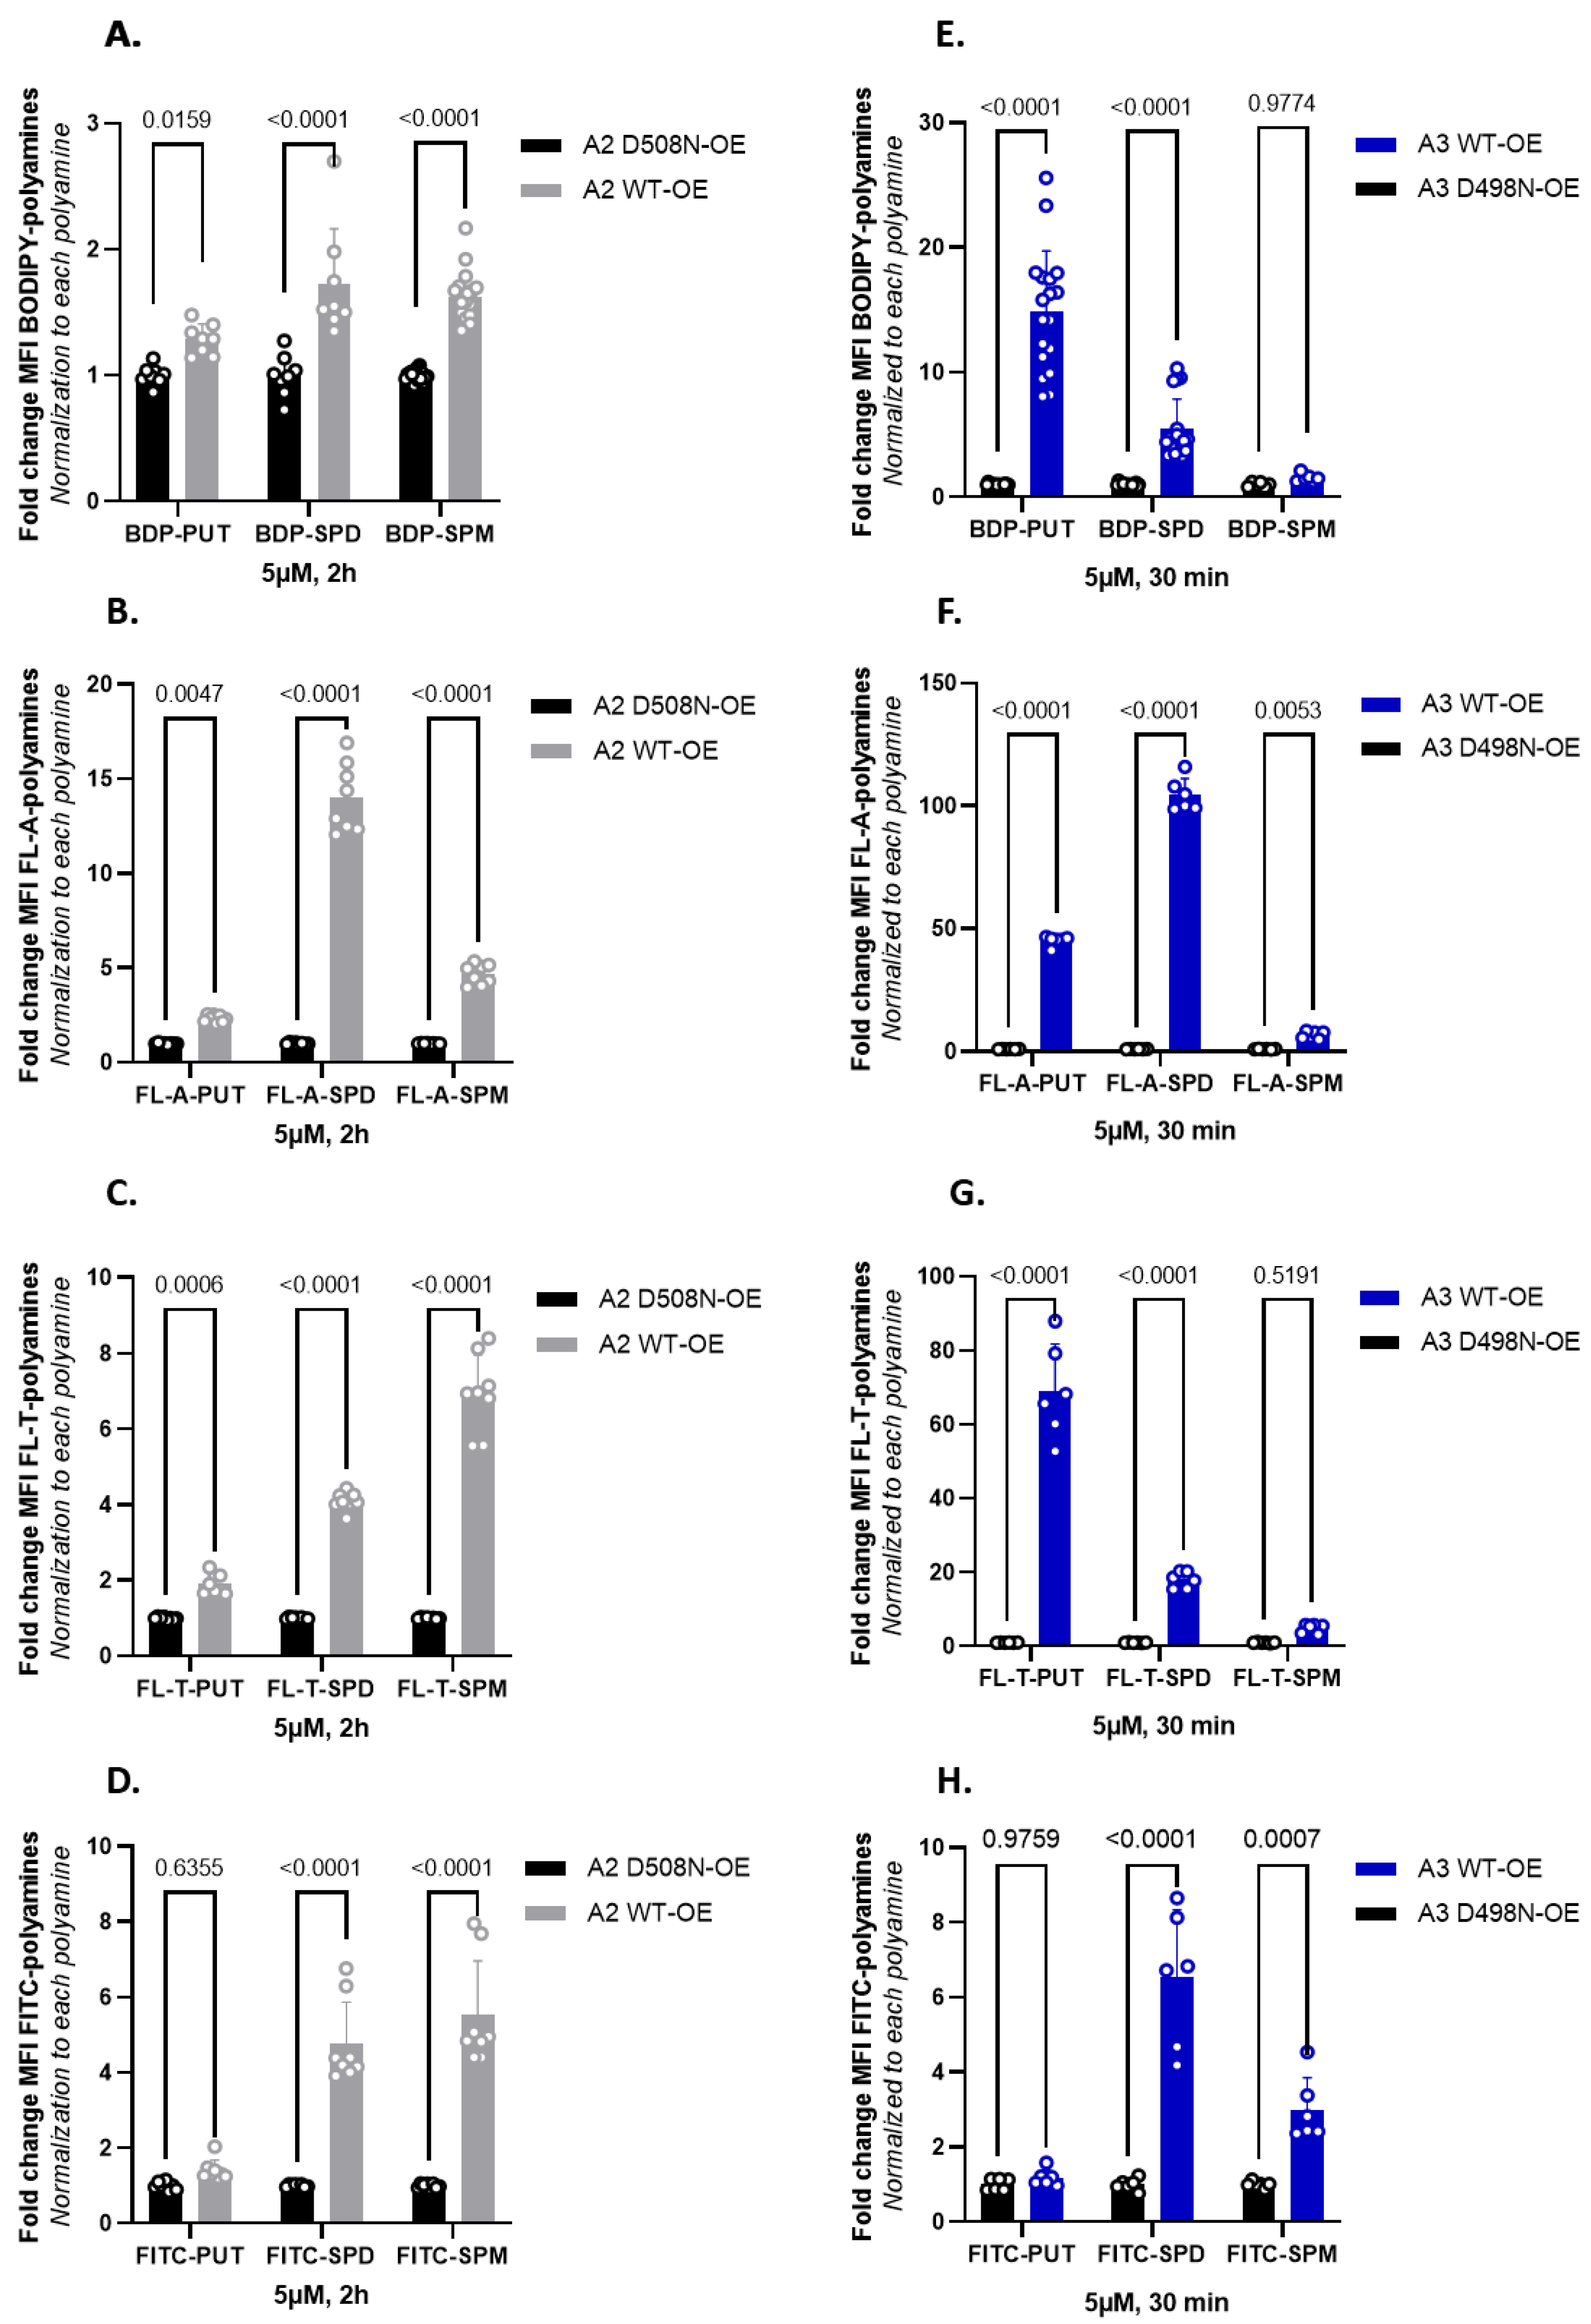
3.4. Fluorescent Polyamine Probes Present Different Structure–Function Relationships toward ATP13A2 and ATP13A3
4. Discussion
4.1. Comparison of ATP13A2 and ATP13A3 Substrate Specificity
4.2. Toward the Design of ATP13A2 and ATP13A3 Specific Polyamine Probes
4.3. Distinct Polyamine Uptake Kinetics in ATP13A2 and ATP13A3 Cells
4.4. Green Fluorescent Probes with Improved Synthesis and Properties
Supplementary Materials
Author Contributions
Funding
Institutional Review Board Statement
Informed Consent Statement
Data Availability Statement
Acknowledgments
Conflicts of Interest
References
- Minois, N.; Carmona-Gutierrez, D.; Madeo, F. Polyamines in aging and disease. Aging 2011, 3, 716–732. [Google Scholar] [CrossRef] [PubMed]
- Pegg, A.E. Mammalian polyamine metabolism and function. IUBMB Life 2009, 61, 880–894. [Google Scholar] [CrossRef] [PubMed]
- Eisenberg, T.; Abdellatif, M.; Schroeder, S.; Primessnig, U.; Stekovic, S.; Pendl, T.; Harger, A.; Schipke, J.; Zimmermann, A.; Schmidt, A.; et al. Cardioprotection and lifespan extension by the natural polyamine spermidine. Nat. Med. 2016, 22, 1428–1438. [Google Scholar] [CrossRef] [PubMed]
- Eisenberg, T.; Knauer, H.; Schauer, A.; Buttner, S.; Ruckenstuhl, C.; Carmona-Gutierrez, D.; Ring, J.; Schroeder, S.; Magnes, C.; Antonacci, L.; et al. Induction of autophagy by spermidine promotes longevity. Nat. Cell Biol. 2009, 11, 1305–1314. [Google Scholar] [CrossRef]
- Poulin, R.; Casero, R.A.; Soulet, D. Recent advances in the molecular biology of metazoan polyamine transport. Amino Acids 2012, 42, 711–723. [Google Scholar] [CrossRef]
- Belting, M.; Mani, K.; Jonsson, M.; Cheng, F.; Sandgren, S.; Jonsson, S.; Ding, K.; Delcros, J.G.; Fransson, L.A. Glypican-1 is a vehicle for polyamine uptake in mammalian cells: A pivital role for nitrosothiol-derived nitric oxide. J. Biol. Chem. 2003, 278, 47181–47189. [Google Scholar] [CrossRef]
- Cheng, F.; Fransson, L.A.; Mani, K. Common traffic routes for imported spermine and endosomal glypican-1-derived heparan sulfate in fibroblasts. Exp. Cell Res. 2018, 364, 133–142. [Google Scholar] [CrossRef]
- Palmer, A.J.; Wallace, H.M. The polyamine transport system as a target for anticancer drug development. Amino Acids 2010, 38, 415–422. [Google Scholar] [CrossRef]
- Soulet, D.; Gagnon, B.; Rivest, S.; Audette, M.; Poulin, R. A fluorescent probe of polyamine transport accumulates into intracellular acidic vesicles via a two-step mechanism. J. Biol. Chem. 2004, 279, 49355–49366. [Google Scholar] [CrossRef]
- Uemura, T.; Stringer, D.E.; Blohm-Mangone, K.A.; Gerner, E.W. Polyamine transport is mediated by both endocytic and solute carrier transport mechanisms in the gastrointestinal tract. Am. J. Physiol. Gastrointest. Liver Physiol. 2010, 299, G517–G522. [Google Scholar] [CrossRef] [Green Version]
- Hamouda, N.N.; Van den Haute, C.; Vanhoutte, R.; Sannerud, R.; Azfar, M.; Mayer, R.; Cortes Calabuig, A.; Swinnen, J.V.; Agostinis, P.; Baekelandt, V.; et al. ATP13A3 is a major component of the enigmatic mammalian polyamine transport system. J. Biol. Chem. 2021, 296, 100182. [Google Scholar] [CrossRef] [PubMed]
- Sorensen, D.M.; Holemans, T.; van Veen, S.; Martin, S.; Arslan, T.; Haagendahl, I.W.; Holen, H.W.; Hamouda, N.N.; Eggermont, J.; Palmgren, M.; et al. Parkinson disease related ATP13A2 evolved early in animal evolution. PLoS ONE 2018, 13, e0193228. [Google Scholar] [CrossRef] [PubMed]
- Van Veen, S.; Martin, S.; Van den Haute, C.; Benoy, V.; Lyons, J.; Vanhoutte, R.; Kahler, J.P.; Decuypere, J.P.; Gelders, G.; Lambie, E.; et al. ATP13A2 deficiency disrupts lysosomal polyamine export. Nature 2020, 578, 419–424. [Google Scholar] [CrossRef] [PubMed]
- Azfar, M.; van Veen, S.; Houdou, M.; Hamouda, N.N.; Eggermont, J.; Vangheluwe, P. P5B-ATPases in the mammalian polyamine transport system and their role in disease. Biochim. Biophys. Acta Mol. Cell. Res. 2022, 1869, 119354. [Google Scholar] [CrossRef] [PubMed]
- Sekhar, V.; Andl, T.; Phanstiel, O. ATP13A3 facilitates polyamine transport in human pancreatic cancer cells. Sci. Rep. 2022, 12, 4045. [Google Scholar] [CrossRef]
- Chen, X.; Zhou, M.; Zhang, S.; Yin, J.; Zhang, P.; Xuan, X.; Wang, P.; Liu, Z.; Zhou, B.; Yang, M. Cryo-EM structures and transport mechanism of human P5B type ATPase ATP13A2. Cell Discov. 2021, 7, 106. [Google Scholar] [CrossRef]
- Li, P.; Wang, K.; Salustros, N.; Gronberg, C.; Gourdon, P. Structure and transport mechanism of P5B-ATPases. Nat. Commun. 2021, 12, 3973. [Google Scholar] [CrossRef]
- Sim, S.I.; von Bulow, S.; Hummer, G.; Park, E. Structural basis of polyamine transport by human ATP13A2 (PARK9). Mol. Cell 2021, 81, 4635–4649.e4638. [Google Scholar] [CrossRef]
- Tillinghast, J.; Drury, S.; Bowser, D.; Benn, A.; Lee, K.P.K. Structural mechanisms for gating and ion selectivity of the human polyamine transporter ATP13A2. Mol. Cell 2021, 81, 4650–4662.e4654. [Google Scholar] [CrossRef]
- Tomita, A.; Daiho, T.; Kusakizako, T.; Yamashita, K.; Ogasawara, S.; Murata, T.; Nishizawa, T.; Nureki, O. Cryo-EM reveals mechanistic insights into lipid-facilitated polyamine export by human ATP13A2. Mol. Cell 2021, 81, 4799–4809.e4795. [Google Scholar] [CrossRef]
- Vanhoutte, R.; Kahler, J.P.; Martin, S.; van Veen, S.; Verhelst, S.H.L. Clickable Polyamine Derivatives as Chemical Probes for the Polyamine Transport System. ChemBioChem 2018, 19, 907–911. [Google Scholar] [CrossRef] [PubMed]
- Mandel, J.L.; Flintoff, W.F. Isolation of mutant mammalian cells altered in polyamine transport. J. Cell. Physiol. 1978, 97, 335–343. [Google Scholar] [CrossRef] [PubMed]
- Vrijsen, S.; Besora-Casals, L.; van Veen, S.; Zielich, J.; Van den Haute, C.; Hamouda, N.N.; Fischer, C.; Ghesquiere, B.; Tournev, I.; Agostinis, P.; et al. ATP13A2-mediated endo-lysosomal polyamine export counters mitochondrial oxidative stress. Proc. Natl. Acad. Sci. USA 2020, 117, 31198–31207. [Google Scholar] [CrossRef] [PubMed]
- Barozzi, C.; Galletti, M.; Tomasi, L.; De Fanti, S.; Palazzini, M.; Manes, A.; Sazzini, M.; Galie, N. A Combined Targeted and Whole Exome Sequencing Approach Identified Novel Candidate Genes Involved in Heritable Pulmonary Arterial Hypertension. Sci. Rep. 2019, 9, 753. [Google Scholar] [CrossRef]
- Graf, S.; Haimel, M.; Bleda, M.; Hadinnapola, C.; Southgate, L.; Li, W.; Hodgson, J.; Liu, B.; Salmon, R.M.; Southwood, M.; et al. Identification of rare sequence variation underlying heritable pulmonary arterial hypertension. Nat. Commun. 2018, 9, 1416. [Google Scholar] [CrossRef] [PubMed]
- Machado, R.D.; Welch, C.L.; Haimel, M.; Bleda, M.; Colglazier, E.; Coulson, J.D.; Debeljak, M.; Ekstein, J.; Fineman, J.R.; Golden, W.C.; et al. Biallelic variants of ATP13A3 cause dose-dependent childhood-onset pulmonary arterial hypertension characterised by extreme morbidity and mortality. J. Med. Genet. 2022, 59, 906–911. [Google Scholar] [CrossRef] [PubMed]
- Morrell, N.W.; Aldred, M.A.; Chung, W.K.; Elliott, C.G.; Nichols, W.C.; Soubrier, F.; Trembath, R.C.; Loyd, J.E. Genetics and genomics of pulmonary arterial hypertension. Eur. Respir. J. 2019, 53, 1801899. [Google Scholar] [CrossRef] [PubMed]
- Blagbrough, I.S.; Metwally, A.A.; Geall, A.J. Measurement of polyamine pKa values. Methods Mol. Biol. 2011, 720, 493–503. [Google Scholar] [CrossRef]
- Shukla, S.; Baumgart, T. Enzymatic trans-bilayer lipid transport: Mechanisms, efficiencies, slippage, and membrane curvature. Biochim. Biophys. Acta Biomembr. 2021, 1863, 183534. [Google Scholar] [CrossRef]
- Guminski, Y.; Grousseaud, M.; Cugnasse, S.; Brel, V.; Annereau, J.P.; Vispe, S.; Guilbaud, N.; Barret, J.M.; Bailly, C.; Imbert, T. Synthesis of conjugated spermine derivatives with 7-nitrobenzoxadiazole (NBD), rhodamine and bodipy as new fluorescent probes for the polyamine transport system. Bioorg. Med. Chem. Lett. 2009, 19, 2474–2477. [Google Scholar] [CrossRef]
- Wang, C.; Delcros, J.G.; Cannon, L.; Konate, F.; Carias, H.; Biggerstaff, J.; Gardner, R.A.; Phanstiel, O. Defining the molecular requirements for the selective delivery of polyamine conjugates into cells containing active polyamine transporters. J. Med. Chem. 2003, 46, 5129–5138. [Google Scholar] [CrossRef] [PubMed]
- Konig, S.G.; Oz, S.; Kramer, R. A polyamine-modified near-infrared fluorescent probe for selective staining of live cancer cells. Chem. Commun. 2015, 51, 7360–7363. [Google Scholar] [CrossRef] [PubMed]
- Nazifi, S.M.R.; Sadeghi-aliabadi, H.; Fassihi, A.; Saghaie, L. Structure–activity relationship of polyamine conjugates for uptake via polyamine transport system. Struct. Chem. 2019, 30, 175–184. [Google Scholar] [CrossRef]
- Traquete, R.; Ghani, R.A.; Phanstiel, O.; Wallace, H.M. Ant 4,4, a polyamine-anthracene conjugate, induces cell death and recovery in human promyelogenous leukemia cells (HL-60). Amino Acids 2013, 44, 1193–1203. [Google Scholar] [CrossRef] [PubMed]
- Niemand, J.; Burger, P.; Verlinden, B.K.; Reader, J.; Joubert, A.M.; Kaiser, A.; Louw, A.I.; Kirk, K.; Phanstiel, O.; Birkholtz, L.M. Anthracene-polyamine conjugates inhibit in vitro proliferation of intraerythrocytic Plasmodium falciparum parasites. Antimicrob. Agents Chemother. 2013, 57, 2874–2877. [Google Scholar] [CrossRef] [Green Version]


Disclaimer/Publisher’s Note: The statements, opinions and data contained in all publications are solely those of the individual author(s) and contributor(s) and not of MDPI and/or the editor(s). MDPI and/or the editor(s) disclaim responsibility for any injury to people or property resulting from any ideas, methods, instructions or products referred to in the content. |
© 2023 by the authors. Licensee MDPI, Basel, Switzerland. This article is an open access article distributed under the terms and conditions of the Creative Commons Attribution (CC BY) license (https://creativecommons.org/licenses/by/4.0/).
Share and Cite
Houdou, M.; Jacobs, N.; Coene, J.; Azfar, M.; Vanhoutte, R.; Van den Haute, C.; Eggermont, J.; Daniëls, V.; Verhelst, S.H.L.; Vangheluwe, P. Novel Green Fluorescent Polyamines to Analyze ATP13A2 and ATP13A3 Activity in the Mammalian Polyamine Transport System. Biomolecules 2023, 13, 337. https://doi.org/10.3390/biom13020337
Houdou M, Jacobs N, Coene J, Azfar M, Vanhoutte R, Van den Haute C, Eggermont J, Daniëls V, Verhelst SHL, Vangheluwe P. Novel Green Fluorescent Polyamines to Analyze ATP13A2 and ATP13A3 Activity in the Mammalian Polyamine Transport System. Biomolecules. 2023; 13(2):337. https://doi.org/10.3390/biom13020337
Chicago/Turabian StyleHoudou, Marine, Nathalie Jacobs, Jonathan Coene, Mujahid Azfar, Roeland Vanhoutte, Chris Van den Haute, Jan Eggermont, Veronique Daniëls, Steven H. L. Verhelst, and Peter Vangheluwe. 2023. "Novel Green Fluorescent Polyamines to Analyze ATP13A2 and ATP13A3 Activity in the Mammalian Polyamine Transport System" Biomolecules 13, no. 2: 337. https://doi.org/10.3390/biom13020337