Article

Chronic Exposure to Low-Molecular-Weight Polycyclic Aromatic Hydrocarbons Promotes Lipid Accumulation and Metabolic Inflammation

Department of Biology, Georgia State University, Atlanta, GA 30303, USA
*
Authors to whom correspondence should be addressed.
Biomolecules 2023, 13(2), 196; https://doi.org/10.3390/biom13020196
Submission received: 7 December 2022 / Revised: 3 January 2023 / Accepted: 5 January 2023 / Published: 18 January 2023

Abstract

:
2-naphthol is a low-molecular-weight (LMW) polycyclic aromatic hydrocarbon (PAH) and air pollutant associated with childhood obesity. There has been a recent emergence of studies on the consequences of PAHs on human health. Current epidemiological reports suggest LMW-PAHs may contribute to obesity incidences in children, yet most studies focus on high-molecular-weight PAHs. This study explores 2-naphthol’s impact on obesity and obesity-associated metabolic disorders. To investigate 2-naphthol’s effect on lipid metabolism and inflammation, we employed 3T3-L1 and BAT1 cell lines to model white and brown adipocytes, respectively, alongside a murine macrophage cell line (RAW264.7). We found that 2-naphthol increased the expression of key adipogenic and lipogenic genes while decreasing lipolytic gene expression in chronically treated 3T3-L1 and BAT1 adipocytes. In addition, chronic 2-naphthol treatment also suppressed adrenergic-stimulated thermogenic gene expression in BAT1 brown adipocytes. In consistence, an increase in lipid accumulation was demonstrated in BODIPY and Oil Red O-stained adipocytes. Additionally, 3T3-L1 adipocytes and RAW264.7 macrophages chronically exposed to 2-naphthol showed upregulated mRNA expression of major inflammatory cytokines (e.g., tumor necrosis factor α (Tnfα), interleukin-1β (Il-1β), and Il-6). In summary, chronic exposure to 2-naphthol stimulates lipid accumulation in adipocytes and inflammation in adipocytes and macrophages. These findings support previous research that demonstrates 2-naphthol has obesogenic potential.

1. Introduction

Exposure to polycyclic aromatic hydrocarbons (PAHs) is gaining recognition for their link to the increasing prevalence of metabolic dysfunction [1]. PAHs are a class of heterocyclic xenobiotics compounds produced as byproducts of burning organic matter. They are categorized based on the number of fused aromatic rings in the parent structures. There are two general classifications of PAHs: (1) low-molecular-weight (LMW) PAHs have 2 to 3 aromatic rings, and (2) high-molecular-weight (HMW) PAHs with 4 or more aromatic rings. PAH parent compounds are generally non-reactive, and most adverse health effects can be attributed to their metabolically modified derivatives [2,3]. PAH toxicity and environmental deposition are influenced by physiochemical factors such as structure, molecular weight, and solubility [4,5]. HMW-PAHs usually exist bound to particulate matter, whereas LMW-PAHs remain in the atmosphere as vapors [6,7]. The intrinsic properties of LMW-PAHs make them more pervasive than HMW-PAHs, as lipophilic LMW-PAH metabolites tend to accumulate in fatty tissues (e.g., adipose, liver, and kidneys).
Most PAHs enter the environment as atmospheric pollution from burning organic matter. Subsequently, the primary route of human exposure is inhalation [8,9]. Exposure to anthropogenic LMW-PAH sources (automobile exhaust, cigarette smoke, and industrial emissions) is rising in tandem with urban and industrial advancements; however, many studies focus on the obesogenic effects of PAH mixtures or HMW-PAHs. Interestingly, Scinicariello and Buser [10] discovered a connection between urinary naphthalene and childhood obesity. Naphthalene is structurally the simplest PAH (made up of only two benzene rings). Using urinary naphthalene metabolites as a biomarker of PAH exposure, increasing concentrations of individual naphthalene metabolites were correlated with body mass index (BMI) and waist circumference rises amongst children [10]. 2-naphthol (2-NAP), a naphthalene metabolite, was the most concentrated LMW-PAH in urine samples, and it showed positive associations with characteristics of childhood obesity [10]. Because we cannot solely rely on correlative studies as sole predictors of illness, exposure-based mechanistic studies are needed to establish causation. Limited research alongside 2-NAP’s biochemical properties hints toward its potential to influence metabolic dysfunction through immunomodulatory mechanisms. For example, studies have shown that mice exposed to a PAH mixture in utero weighed more and had increased adiposity compared to control mice including the increased expression of adipogenic and lipogenic genes in adipose tissues [11]. HMW-PAHs, benzo(a)pyrene and 1-nitropyrene, increase the expression of the proinflammatory cytokines Il-8, interferon γ (Ifnγ), and Il-1β in lung epithelial cells [12] and splenocytes [13]. Individual HMW-PAHs can also upregulate C-C motif cytokine ligand 1 (Ccl1) expression [14] alongside mRNA and protein TNFα levels in cultured human macrophage cells [15]. Additionally, activated macrophages treated with individual PAHs showed increased antigen presentation [16] and IL-1 production proportionate to lipopolysaccharide stimulation [17]. Evidence of individual PAHs activating inflammatory pathways combined with increased associations between LMW-PAHs and obesity warrants further investigation into the impact of 2-NAP on inflammation and lipid metabolism.
Thus, this research aimed to (1) investigate the role of the LMW-PAH 2-NAP on adipocyte function and lipid metabolism; and (2) determine the impact of 2-NAP exposure on inflammation. The findings of this study may lead to further exploration into the cellular pathways targeted by LMW-PAHs, increasing our understanding of how individual PAHs contribute to metabolic dysfunction.

2. Materials and Methods

2.1. Cell Culture

RAW264.7 murine macrophages (#TIB-71, ATCC, Manassas, VA, USA) were cultured in Dulbecco’s Modified Eagle’s Medium (DMEM, #11965-092, Gibco/ThermoFisher Scientific, Waltham, MA, USA) containing 10% heat-inactivated fetal bovine serum (FBS, #16000-044, Gibco/ThermoFisher Scientific) and 1% penicillin/streptomycin (P/S, #30-002-CI, CORNING, Corning, NY, USA). Cells were incubated at 37 °C in an atmosphere of 5% CO2.
3T3-L1 murine preadipocytes (#CL-173, ATCC) were cultured in an expansion medium (EM) containing DMEM supplemented with 10% calf serum (CS, #16010-159, Gibco/ThermoFisher Scientific) and 1% penicillin/streptomycin (P/S) and incubated as described above. Once preadipocytes reached confluency, cells were cultured for 48 h in differentiation media (DM), containing the growth media (DMEM + 10% FBS + 1% P/S) supplemented with 400 nM insulin (#I6634, Sigma-Aldrich, St. Louis, MO, USA), 0.5 mM 3-isobutyl-1-methylxanthine (IBMX, #I7018, Sigma-Aldrich), and 1 μM dexamethasone (DEX, #D4902, Sigma-Aldrich). Cell culture media was then replaced with maintenance medium (MM), containing the growth media (DMEM + 10% FBS + 1% P/S) supplemented with 400 nM insulin for 2 additional days following differentiation. On day 5, culture media was replaced with MM every 2 days until 3T3-L1 cells reached maturity on day 8.
BAT1 murine preadipocyte (a generous gift from Dr. Patrick Seale, University of Pennsylvania) cultures were grown in a BAT1 expansion medium (BEM) containing DMEM/Nutrient Mixture F-12 (DMEM/F12, #11330-032, Gibco/ThermoFisher Scientific) supplemented with 10% FBS and 1% P/S for 2 days and incubated as described above. Once cells reached 90% confluency, the BEM was replaced with a BAT1 differentiation media (BDM), containing BEM supplemented with 20 nM insulin, 0.5 mM IBMX, 1 μM DEX, 125 μM indomethacin (#I8280, Sigma-Aldrich, and 1 nM triiodothyronine (T3, #T5516, Sigma-Aldrich) for 2 days. After the 2-day differentiation period, the media was replaced with BAT1 maintenance medium (BMM), containing BEM supplemented with 20 nM insulin and 1 nM T3, every 2 days until day 8.

2.2. RNA Extraction and RT-PCR Analysis

Cellular RNA was extracted from cultures using the Tri Reagent kit (#RT 111, Molecular Research Center, Cincinnati, OH, USA), as described in the manufacturer’s protocol for cells grown in monolayer. ABI Universal PCR Master Mix and TaqMan primer and probe pair reagents were acquired from Applied Biosystems/ThermoFisher Scientific. Gene expression was evaluated using quantitative RT-PCR using Applied Biosystems QuantStudio 3 real-time PCR system (Applied Biosystems/ThermoFisher Scientific). Target mRNA expression levels were normalized to the expression of the housekeeping gene, cyclophilin, relative to controls. We used cyclophilin primer and probe sequences: 5′-GGTGGAGAGCACCAAGACAGA-3′(forward), 5′-GCCGGAGTCGACAATGATG-3′(reverse), and 5′-TCCTTCAGTGGCTTGTCCCGGCT-3′(probe). All other gene expression primers and probes were purchased from Applied Biosystems. Corresponding cycle threshold (Ct) values were measured, and relative mRNA level was determined using the 2(−ΔΔCt) method.

2.3. Enzyme-Linked Immunosorbent Assays (ELISA)

RAW264.7 macrophages were cultured as described above. TNF-α protein production in the cell culture medium was measured using the Mouse TNF-alpha Quantikine ELISA Kit (#MTA00B, R&D Systems™, Minneapolis, MN, USA) according to the manufacturer’s protocol.

2.4. Staining and Visualization of Neutral Lipids

Oil Red O (ORO, #O9755Sigma-Aldrich) staining was employed to visualize lipid accumulation during 3T3-L1 adipogenesis. In preparation for staining, differentiated 3T3-L1 cells were cultured in 6-well plates, washed with PBS, and fixed with 10% formalin overnight. After fixation, cells were washed twice with MilliQ ultrapure water (Sigma-Aldrich) and incubated in a 0.5% ORO solution prepared in isopropanol for 10 min at 37 °C. Plates were rinsed 4 times with ddH2O, air-dried, and photographed directly.
To visualize intracellular lipid droplets, triglycerides were labeled with 4,4-difluoro-1,3,5,7,8-pentamethyl-4-bora-3a,4a-diaza-s-indacene (BODIPY 493/503, #D3922, Thermo Fisher Scientific) as previously described [18]. 3T3-L1 adipocytes were seeded on 12 mm collagen-treated glass coverslips at a density of 5 × 10⁴ cells/well in 24-well plates. After differentiation and treatment, as indicated under the figures, cells were fixed in 4% paraformaldehyde (#P6148, Sigma-Aldrich) for 30 min at room temperature. Cells were then incubated in a 2 μM BODIPY solution in the dark for 15 min at 37 °C and washed twice with PBS to remove the residual stain. Coverslips were mounted onto glass slides with ProLong Diamond Antifade Mountant (#P36961, ThermoFisher Scientific). Slides were cured overnight in the ProLong Diamond Antifade Mountant, imaged, and immediately stored at 4 °C. Images of lipid droplets were captured at excitation/emission wavelengths 493/503 nm using an Olympus DP73 photomicroscope and CellSens software (version 1.6) (Olympus, Waltham, MA, USA).

2.5. Statistical Analysis

Reported data are expressed as the mean ± SEM. Differences between treatment groups were analyzed for statistical significance by one-way or two-way analysis of variance (ANOVA) with Dunnett’s multiple comparisons test post hoc (GraphPad Prism version 9 (GraphPad Software, La Jolla, CA, USA, www.graphpad.com, access on 27 June 2019). Significantly different group means (p < 0.05, indicated by an asterisk *) were calculated using GraphPad Prism version 9 (GraphPad Software, La Jolla, CA, USA, www.graphpad.com, accessed on 27 June 2019).

3. Results

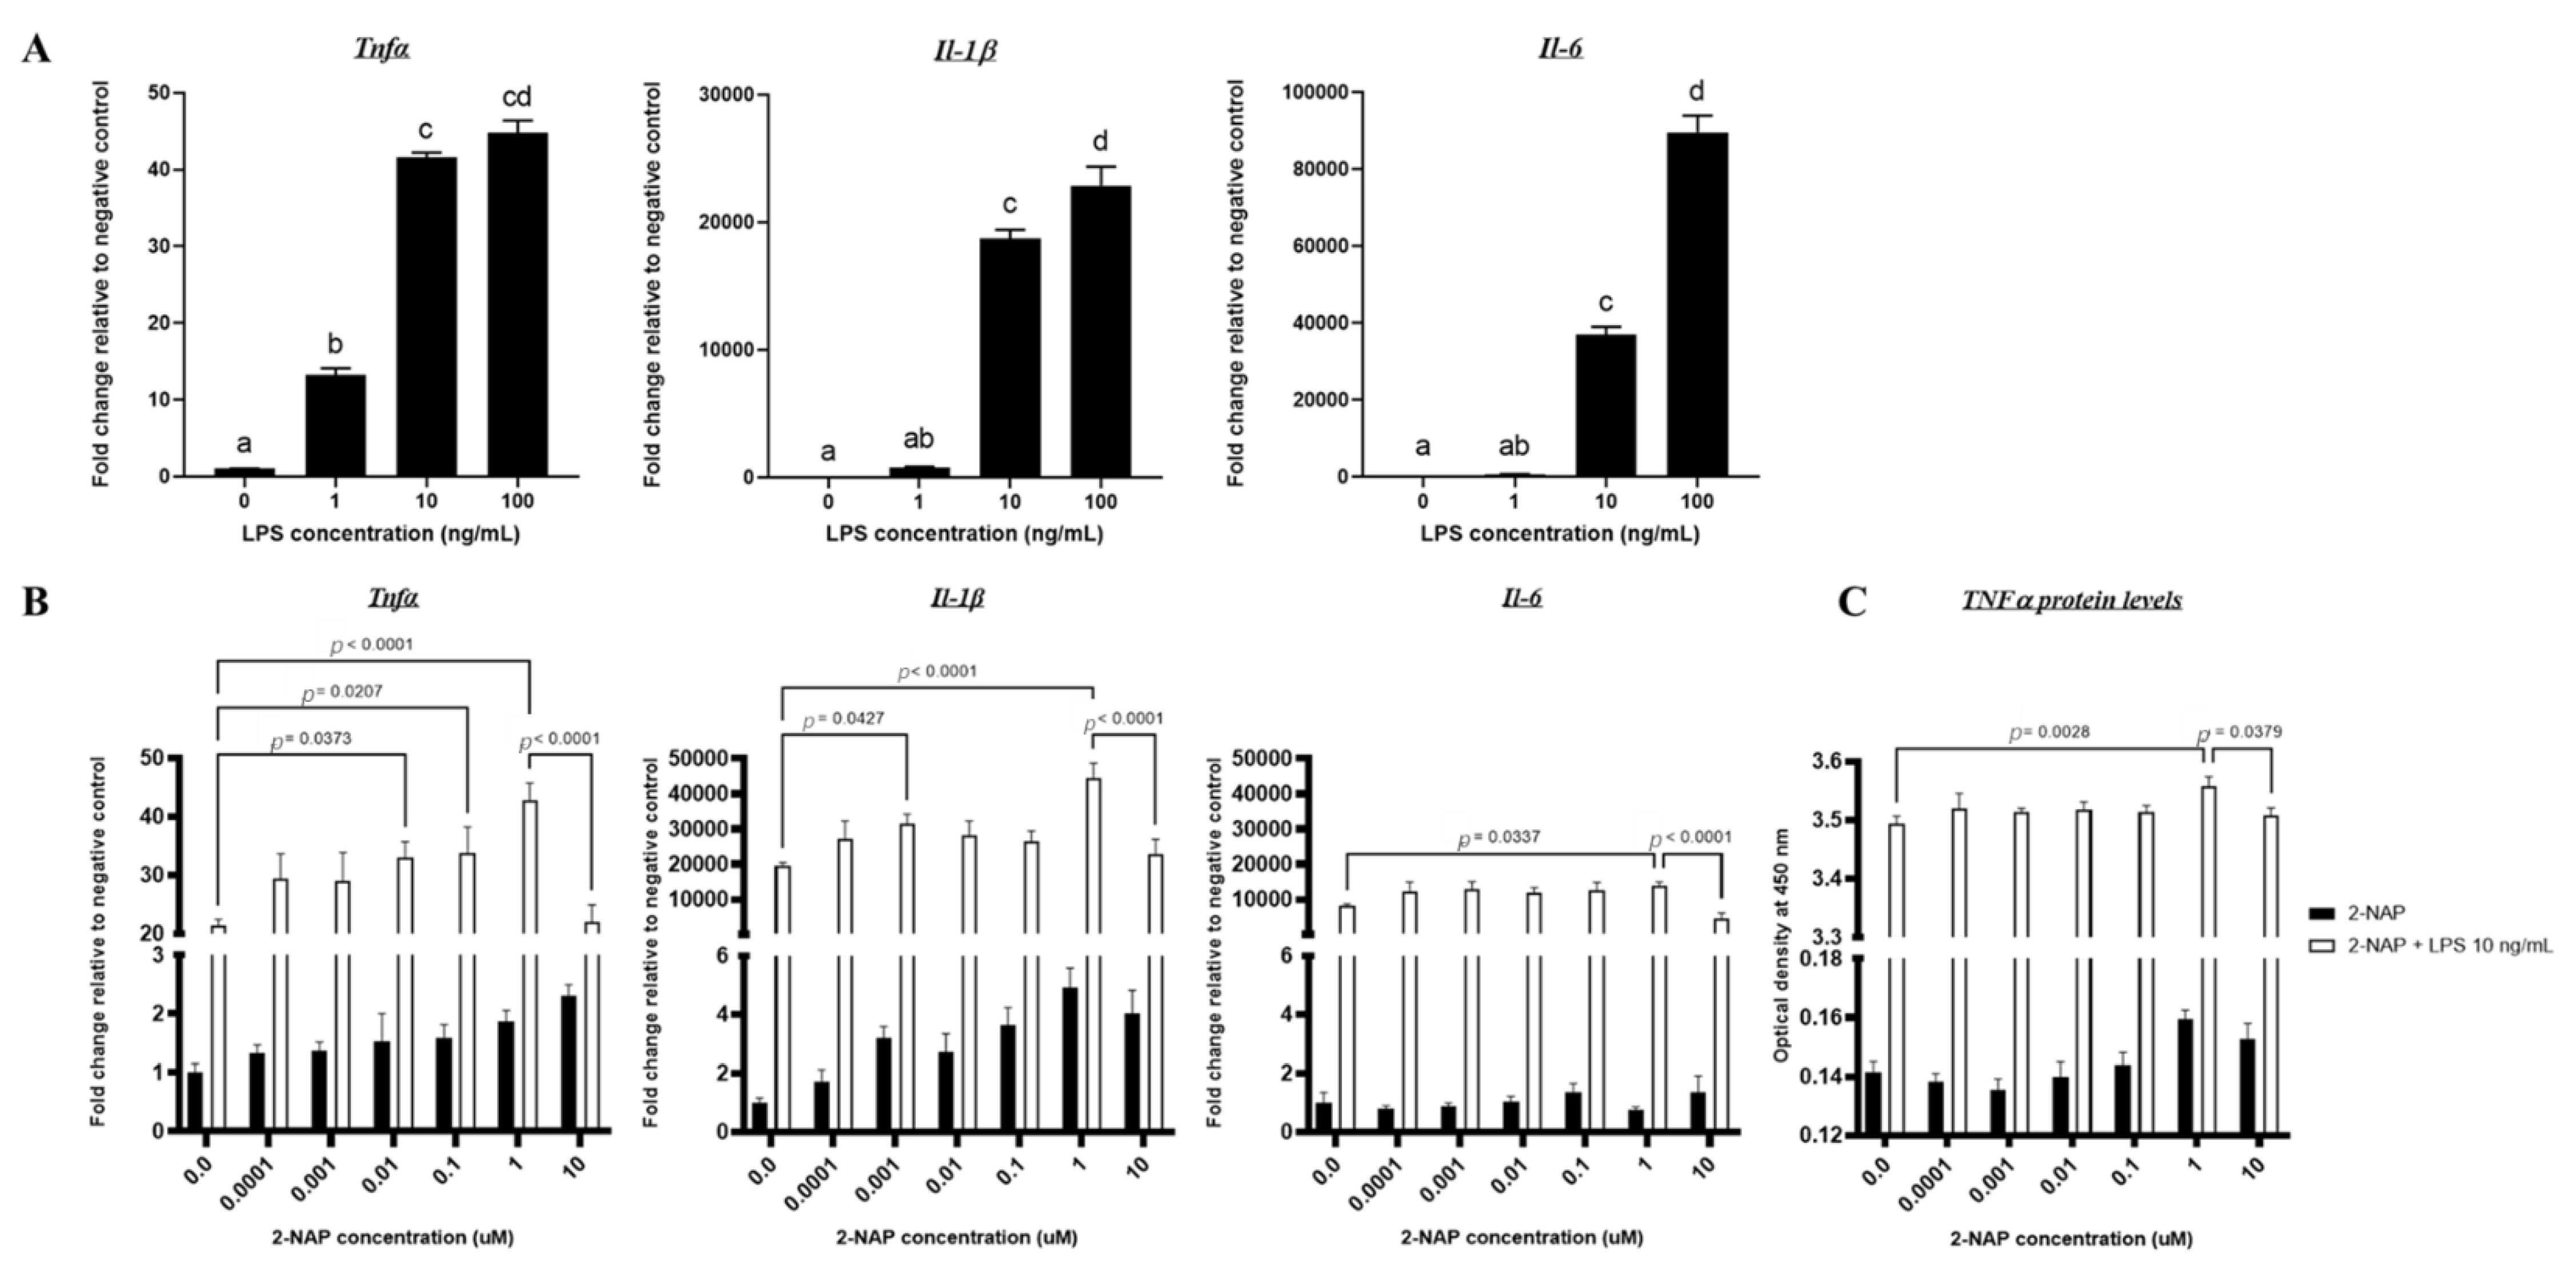
3.1. In Vitro Effects of Varying LPS Concentrations on RAW264.7 Macrophages

Lipopolysaccharide (LPS) is commonly used to stimulate proinflammatory activation of macrophages in vitro [19]. Proinflammatory cytokines TNFα, IL-1β, and IL-6, are produced by macrophages and adipocytes, the primary cells involved in obesity and metabolic disorders. Given that these cytokines are elevated under obese conditions and promote chronic low-grade inflammation in adipose tissue [20], we measured Tnfα, Il-1β, and Il-6 mRNA transcript levels to assess the consequences of LPS stimulation in macrophages., RAW264.7 cells were stimulated in vitro across a range of LPS concentrations, from 1 ng/mL to 100 ng/mL, to establish an optimal dose of LPS. As shown in Figure 1A, Tnfα and Il-1β mRNA levels displayed dose-dependent responsiveness upon LPS stimulation that peaked at a concentration of 10 ng/mL, whereas the expression of Il-6 was significantly increased across all concentrations (up to the highest LPS dose—100 ng/mL). Given that PAHs can also activate macrophages and drive proinflammatory responses, the 10 ng/mL LPS concentration was chosen to prevent saturating the proinflammatory responses of RAW264.7 cells. Thus, the LPS dosage of 10 ng/mL was used for subsequent experiments throughout this study.

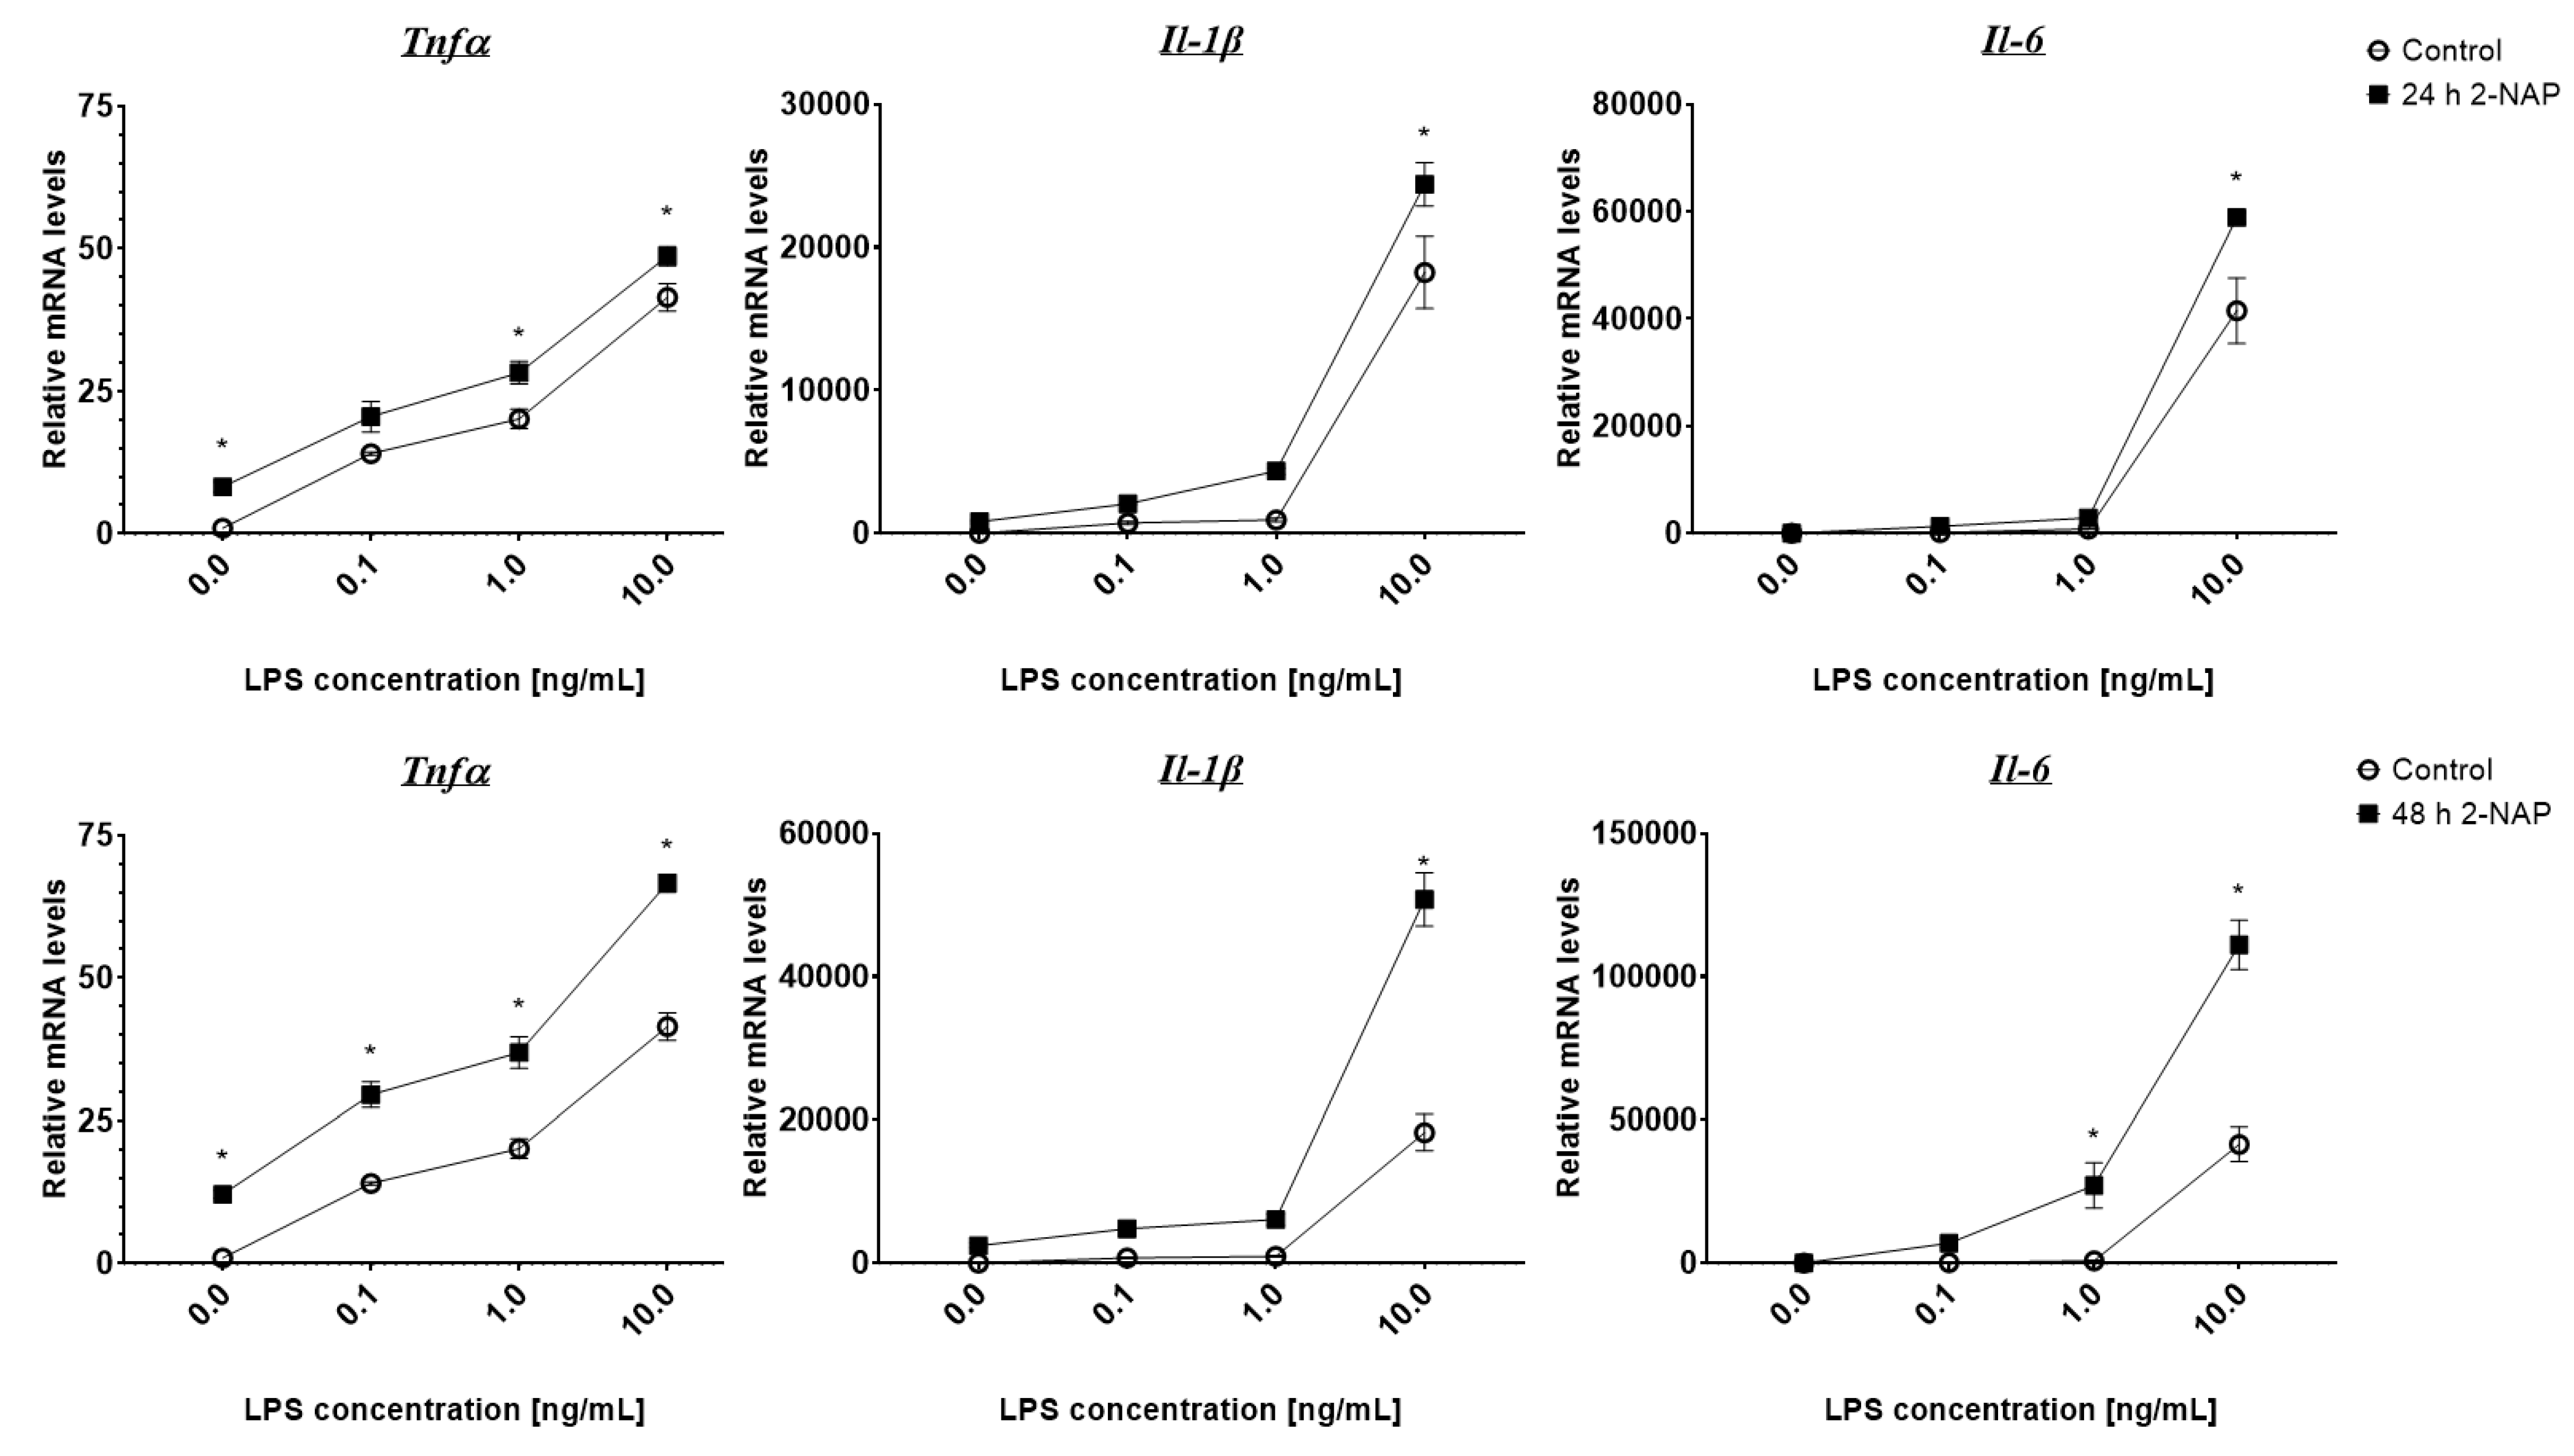
3.2. Acute 2-NAP Treatment Enhances Inflammatory Responses in RAW264.7 Macrophages

Macrophage activation is an essential feature of metabolic inflammation. To assess the effect of 2-NAP on macrophage inflammation, we measured cytokine gene expression in RAW264.7 cells across a wide range of 2-NAP concentrations (six 10-fold concentrations, 0.0001 μM–10 μM) in the absence or presence of 10 ng/mL LPS for 4 h. Results showed that acute 4-hour 2-NAP treatment in RAW 264.7 macrophages had apparent effects on basal Tnfα, Il-1β, and Il-6 expression (Figure 1B). LPS significantly stimulated the expression of these genes in RAW 264.7 macrophages; 2-NAP further enhanced LPS’ effect, with the largest expression enhancement occurring at a 2-NAP concentration of 1 µM (Figure 1B). Furthermore, ELISA analysis of supernatants of LPS-activated RAW264.7 cells treated across the same 2-NAP range revealed that 2-NAP increased basal TNFα levels and significantly enhanced LPS-stimulated TNFα secretion at a 2-NAP concentration of 1 µM level (Figure 1C). We also found that 10 µM 2-NAP treatment reduced Tnfα, Il-β, and Il-6 expression, as well as TNFα secretion as compared to that of 1 µM 2-NAP (Figure 1B,C); however, this may be due to 2-NAP’s toxicity at high doses as it was found that 10 µM 2-NAP reduced adult survival rate in Daphia magna, a model system commonly used in toxicological studies, during chronic treatment (Asia Bright, unpublished results). Thus, 1 µM 2-NAP was used in the subsequent studies.

3.3. Chronic 2-Naphthol Exposure Increases the Expression of Inflammatory Genes in Macrophages

Cytokine mRNA expression was measured in RAW264.7 macrophages cultured under chronic 2-NAP exposure conditions (Figure 2). RAW264.7 macrophages were treated with 1 µM 2-NAP for either 24 or 48 h, then challenged with various concentrations of LPS for 4 h. We found that chronic 2-NAP treatment for 24 (Figure 2A) or 48 (Figure 2B) hours significantly increased basal Tnfα expression and significantly enhanced LPS-induced inflammatory gene expression, including Tnfα, Il-1β, and Il-6 (Figure 2).

3.4. Chronic 2-Naphthol Treatment Up-Regulates An Adipogenic and Lipogenic Program Gene Expression in 3T3-L1 Cells

Next, we sought to investigate the effects of 2-NAP on adipogenesis and lipid metabolism. 3T3-L1 murine preadipocytes were induced to differentiate with a differentiation medium and were concurrently treated with either PBS or 2-NAP on days 1–2, 3–5, 6–8, or 1–8 of differentiation. Cells from all treatment groups were harvested on day 8 of differentiation. Adipocytes exposed to 2-NAP during differentiation show an overall increase in adipogenesis (Figure 3). More specifically, chronic 2-naphthol treatment, especially during the entire 1–8 days of differentiation, upregulated 3T3-L1 adipogenesis, as shown by increased mRNA expression of adipogenic markers such as peroxisome proliferator-activated receptor gamma (Pparγ), CCAAT enhancer binding protein α (Cebpα), and adipocyte protein 2/fatty acid binding protein 4 (aP2/Fabp4) (Figure 3). Additionally, chronic 2-NAP treatment from days 1–8 increased the expression of a key lipogenic enzyme, fatty acid synthase (Fasn), while coordinately downregulating genes involved in lipolysis, including the significant downregulation of hormone-sensitive lipase (Hsl) and the tendency of downregulation of patatin-like phospholipase domain containing 2/adipocyte triglyceride lipase (Pnpla2/Atgl) (Figure 3). Moreover, chronic 2-NAP treatment during differentiation significantly decreased the adipokine adiponectin (Adipoq) expression (Figure 3). In 3T3-L1 cells treated with 2-NAP during the differentiation days 6–8, there was also an increase in Fasn expression and a coordinated decrease in Hsl expression (Figure 3). Thus, our data suggest that chronic 2-NAP treatment in adipocytes may promote an adipogenic and lipogenic program by coordinated regulation of gene expression involved in adipogenesis, lipogenesis, and lipolysis.

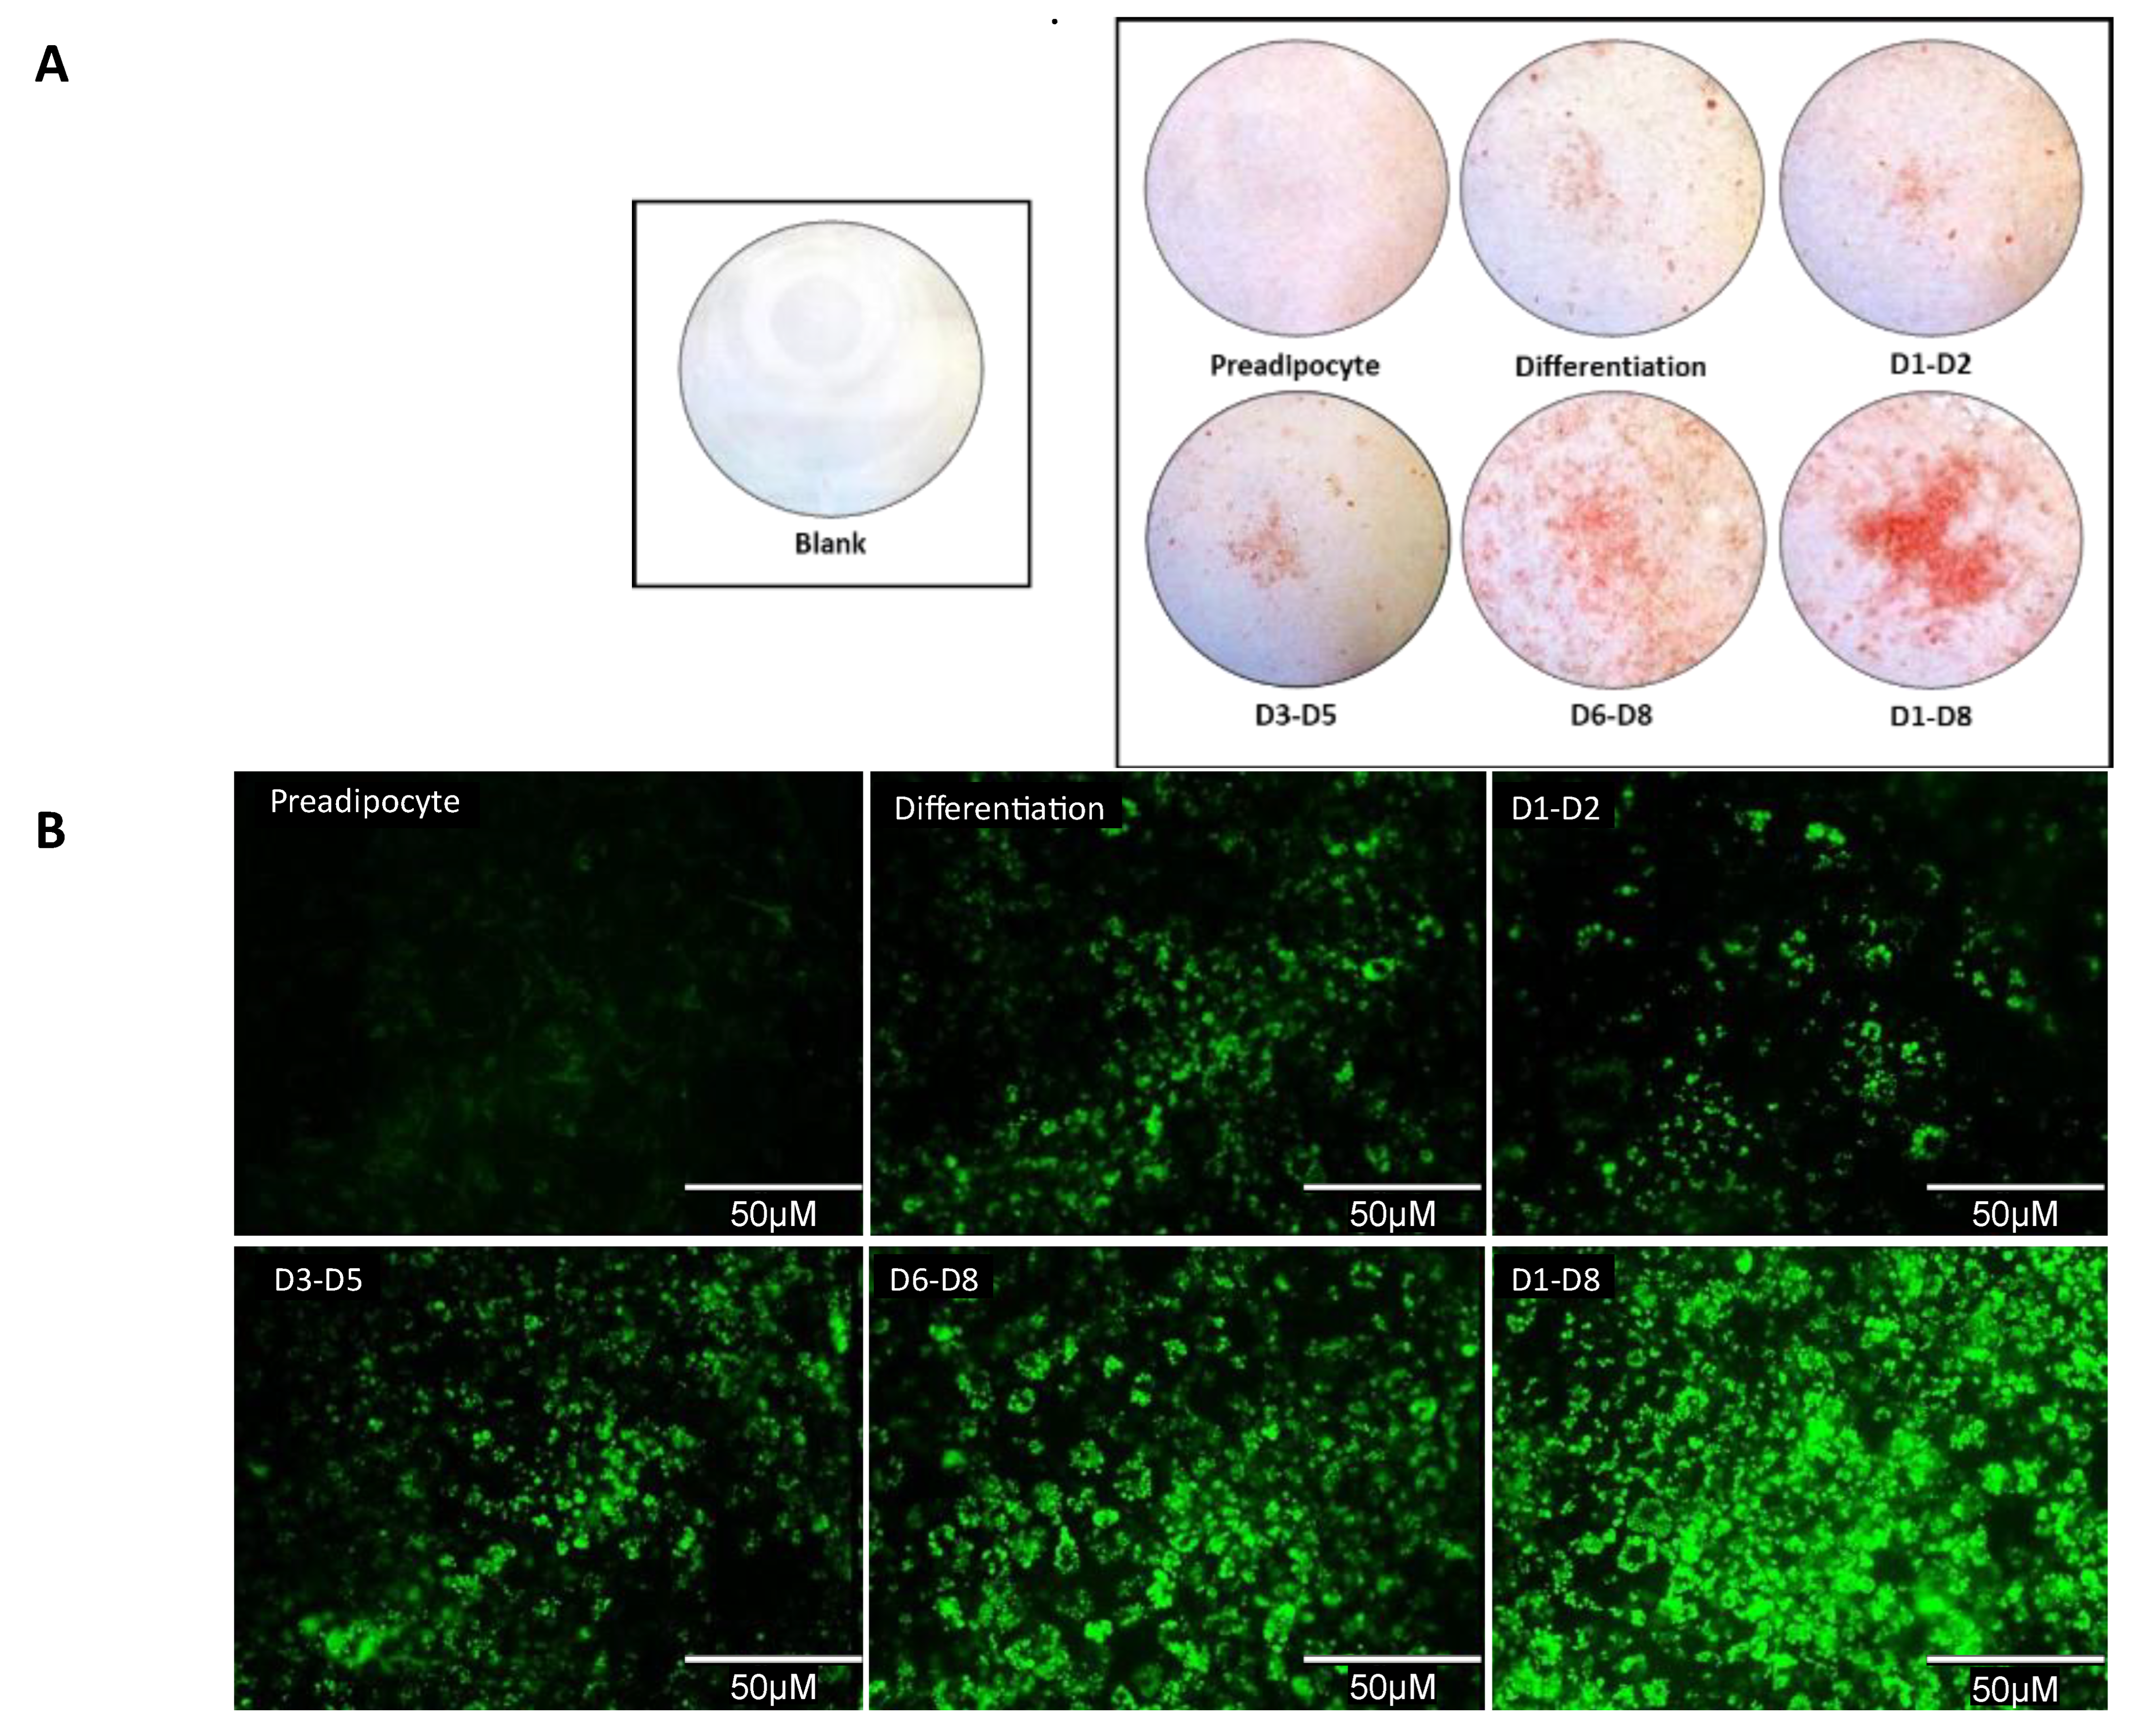
3.5. Qualitative Analysis Shows An Increase in Lipid Accumulation in 2-NAP Treated 3T3-L1 Adipocytes

We then examined lipid accumulation in 3T3-L1 adipocytes treated with 2-NAP by either oil red O (ORO) or BODIPY staining. 3T3-L1 cells were photographed directly for a whole-well view (Figure 4A) or at 40× magnification for a detailed microscopic view (Figure 4B). Consistent with results in Figure 3, both ORO and BODIPY staining revealed increased lipid accumulation in adipocytes under chronic 2-NAP treatment from days 1–8 and 6–8 (Figure 4). Adipocytes treated during the early and middle stages of differentiation (days 1–2 and 3–5) did not show a measurable increase in lipid accumulation compared to the differentiation control (Figure 4).

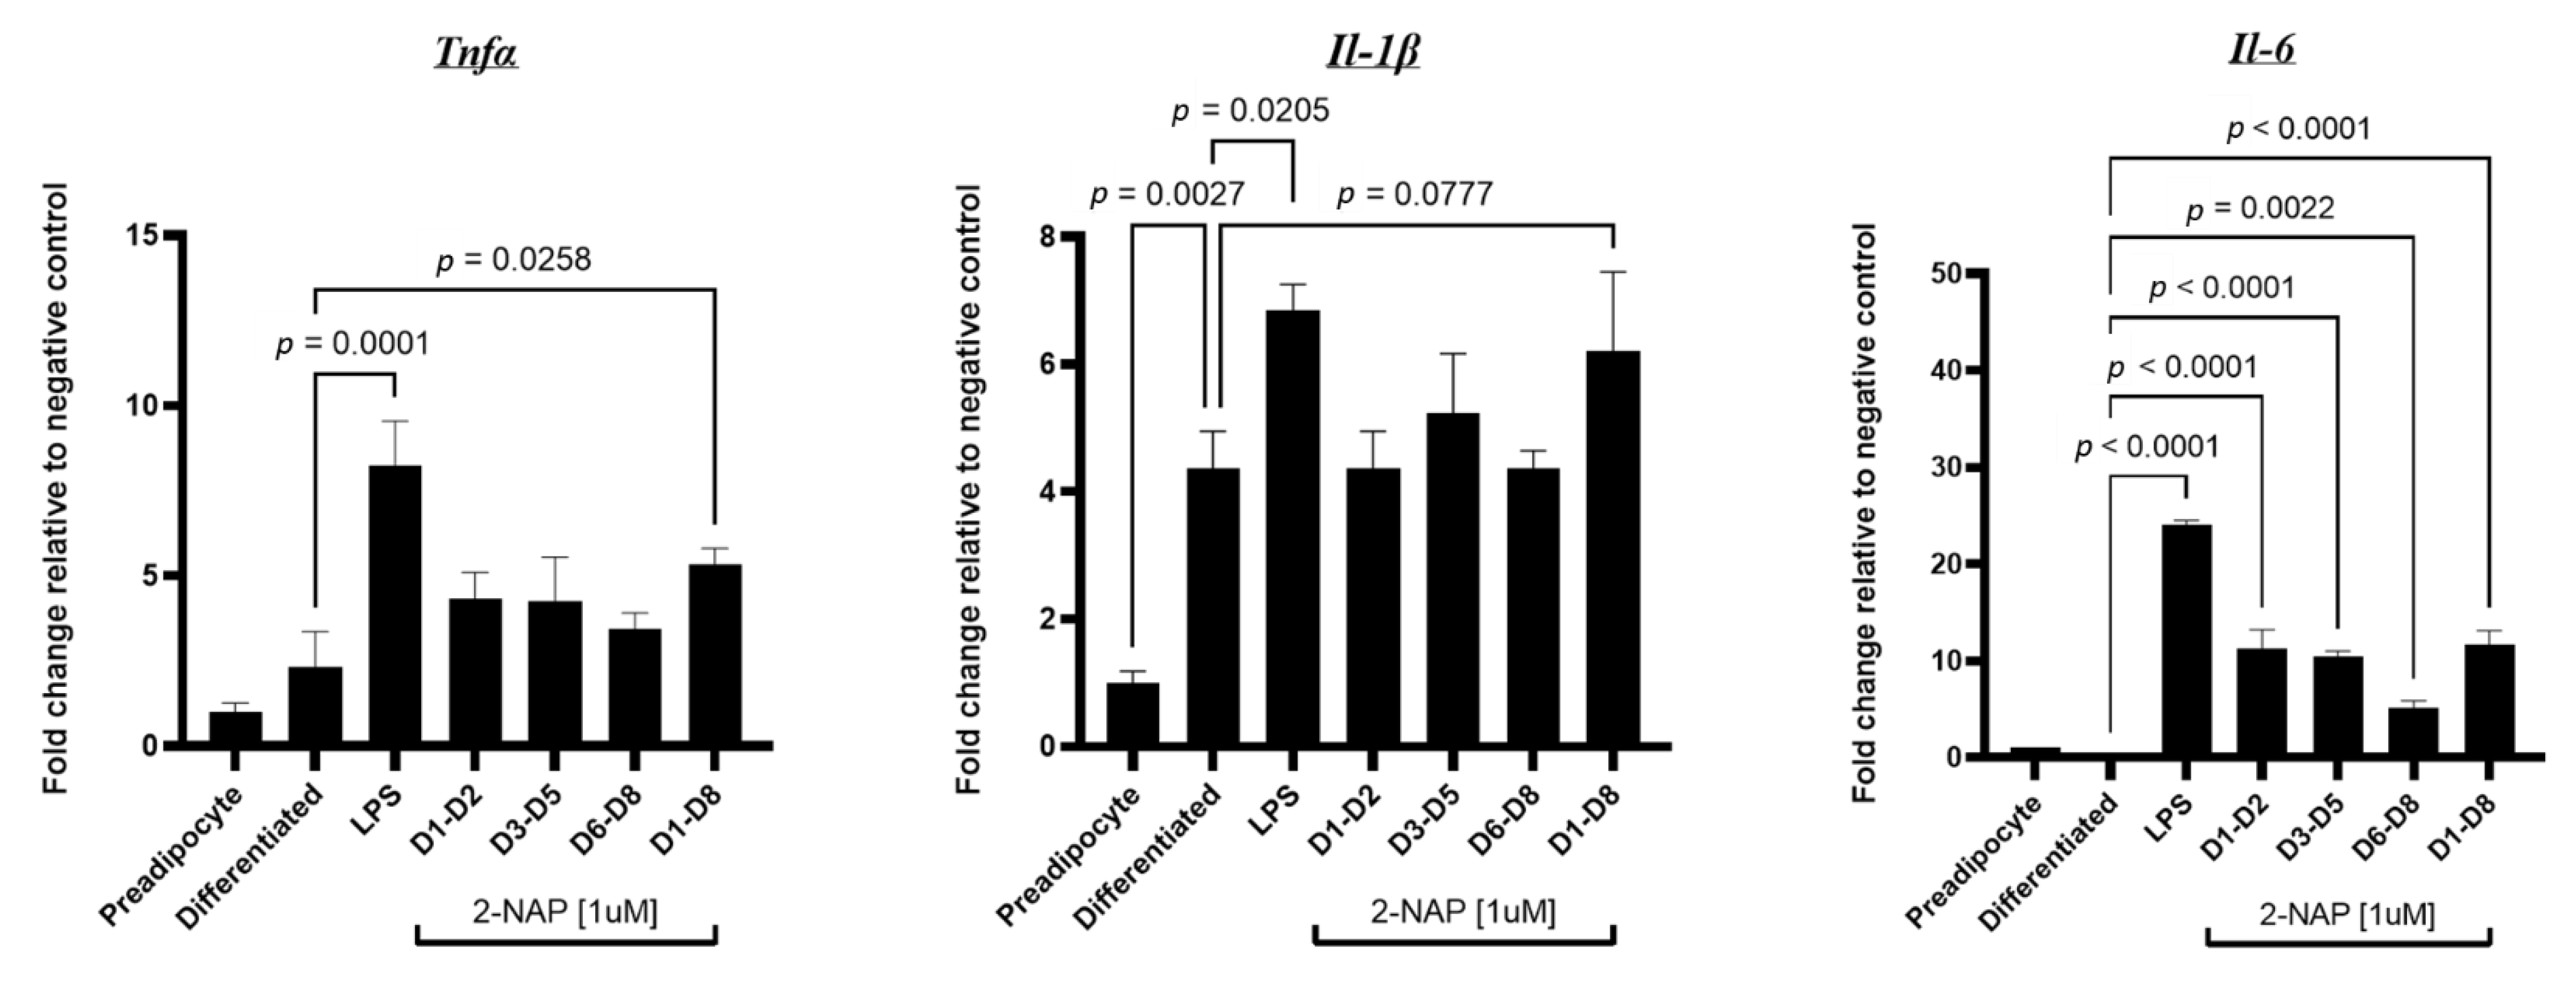
3.6. Chronic 2-NAP Exposure Increases the Expression of Inflammatory Genes in 3T3-L1 Cells

To determine whether chronic 2-NAP treatment in 3T3-L1 cells contributes to adipocyte inflammation, we treated 3T3-L1 cells with 1 µM 2-NAP at specific points during differentiation, from differentiation days 1–2, 3–5, 6–8, and 1–8. Cells were harvested on differentiation day 8 for gene expression analysis. For the positive control LPS treatment, 3T3-L1 cells were differentiated without 2-NAP treatment and treated with 10 ng/mL LPS for 4 h on differentiation day 8 before harvesting the cells. As expected, 3T3-L1 adipocytes treated with LPS significantly induced inflammatory gene expression, including Tnfα, Il-1β, and Il-6 (Figure 5). Interestingly, 3T3-L1 adipocytes chronically exposed to 2-NAP also showed a significant increase in mRNA expression of proinflammatory cytokine markers Tnfα and Il-6 and a tendency for increased Il-1β expression (Figure 5).

3.7. Brown Adipocytes Exposed to 2-NAP during Differentiation Displayed A Decrease in Thermogenesis and An Increase in Adipogenic Gene Expression

To determine the role of LMW-PAH exposure in the regulation of thermogenesis and brown-fat-specific gene expression, BAT1 cells were chronically exposed to 2-NAP at different points of differentiation from days 1–2, 3–5, 6–8, and 1–8. On day 8 of differentiation, BAT1 cells were treated with 1 µM of the β-adrenergic agonist isoproterenol (ISO) for 4 h before cells were harvested for gene expression analysis. As expected, differentiated BAT1 brown adipocytes exhibited significantly increased expression of genes in adipocyte differentiation and thermogenesis compared to that of preadipocytes, including markers of adipocyte differentiation Pparγ and Cebpα, lipogenesis marker Fasn, lipolysis markers Hsl and Atgl, adipokine adipoq, and thermogenesis markers uncoupling protein 1 (Ucp1) and PPARG coactivator 1 alpha (Pgc1α) (Figure 6). ISO-treated BAT1 cells showed increased expression of thermogenic and lipolytic markers Ucp1, Pgc1α, and Hsl (Figure 6). Similar to 3T3-L1 cells, BAT1 cells treated with 2-NAP across the entire cellular differentiation process (days 1–8) showed increased expression of adipogenesis genes, including the adipocyte differentiation markers Pparγ and Cebpα and the lipogenesis marker Fasn. 2-NAP treatment during BAT1 differentiation resulted in significant downregulation of adipoq (Figure 6). BAT1 brown adipocytes treated with 2-NAP during days 1–8 of differentiation resulted in a downregulation in basal expression of Pgc1α and a tendency of downregulation in basal expression of Atgl. Furthermore, chronic 2-NAP treatment during BAT1 cell differentiation significantly downregulated ISO-stimulated Ucp1, Pgc1α, Hsl, and Atgl expression (Figure 6).

4. Discussion

We are exposed daily to polycyclic aromatic hydrocarbons (PAH). Researchers have previously discovered associations between the presence of PAH metabolites in our body and the incidence of obesity and obesity-related comorbidities [10,21,22]. Most studies focus on HMW-PAH; however, little is known about the effects of individual LMW-PAHs such as naphthalene, which is more pervasive and easier metabolized into bioactive compounds (1-naphthol and 2-naphthol). In vivo and in vitro studies have revealed the obesogenic potential LMW-PAHs such as 2-NAP [9,23]. On the basis of this previous research, we aimed to identify the cellular pathways LMW-PAHs may influence, contributing to metabolic dysfunction associated with obesity. This work investigated how 2-NAP exposure impacts adipocyte and macrophage physiologies using RAW264.7, 3T3-L1, and BAT1 murine cell lines to model key regulators of adipose tissue health. These in vitro models represent macrophages, white adipocytes, and brown adipocytes, respectively. These models allowed us to analyze the effect of 2-NAP on the overall inflammatory status and at distinct stages of adipocyte differentiation. Using these models, we investigated (1) the role of 2-NAP on adipocyte function and lipid metabolism; and (2) the impact of 2-NAP exposure on adipose inflammation.
Adipogenesis, the process by which new adipocytes are generated, is defined by sequences of cellular recruitment, expansion, differentiation, and maturation of committed preadipocytes [24]. Distinct transcriptional events mark these developmental stages. Key transcription factors, Pparγ and Cebpα, are upregulated during early differentiation. This research reveals that Pparγ and Cebpα mRNA are significantly increased in white adipose and brown adipose tissues chronically exposed to 2-NAP (Figure 3 and Figure 6.) The stimulation of these transcription factors activates a battery of other target genes during late differentiation, including aP2, a marker specific to mature adipocytes, lipogenic marker Fasn, lipolysis markers Hsl and Atgl, and the adipokine adipoq. Interestingly, we found that 2-NAP treatment during 3T3-L1 white adipocyte differentiation and BAT1 brown adipocyte differentiation significantly stimulated the expression of Pparγ and Cebpα. In addition, 2-NAP treatment significantly increased the expression of Fasn, an important enzyme involved in lipogenesis, and coordinately downregulated the expression of Hsl and Atgl, enzymes involved in lipolysis. This coordinated regulation in adipogenic, lipogenic, and lipolytic gene expression could contribute to the increased lipid accumulation observed in 2-NAP-treated adipocytes (Figure 4), which supports our hypothesis of 2-NAP as a potential obesogen. Interestingly, we found that continuous 2-NAP presence rather than transient treatment during the differentiation process may be required for 2-NAP’s obesogenic function, as transient treatment of 2-NAP during the early and mid-stage of differentiation did not enhance lipid accumulation in either 3T3-L1 white adipocytes or BAT1 brown adipocytes.
The observed decrease in adipoq mRNA expression aligns with previous work showing decreased adipoq mRNA expression in ob/ob mice compared to lean ob/+ mice [25]. Furthermore, serum adiponectin levels in wild-type mice on a high-fat diet or db/db mice are decreased compared with control animals [26]. Similar trends of adipoq dysregulation were discovered upon examination of the plasma from obese humans [27]. Adiponectin has been shown to contribute to a beneficial metabolic phenotype through various functions, including suppressing hepatic glucose production, stimulating fatty acid oxidation in muscle, and inhibiting inflammation in various tissues [28,29]. Thus, inhibiting adiponectin (adipoq) expression in both 3T3-L1 white adipocytes and BAT1 brown adipocytes using 2-NAP may contribute to the impact of 2-NAPon metabolic dysregulation.
While the function of white adipocytes is to store excess energy as fat, that of brown adipocytes is to dissipate energy as heat through adaptive thermogenesis due to its unique expression of Ucp1 in the mitochondria inner membrane [30,31]. UCP1 acts to uncouple oxidative phosphorylation from ATP synthesis, dissipating energy as heat and profoundly increasing overall energy expenditure [32,33]. Brown adipocyte thermogenesis is regulated by catecholamine signaling. Catecholamines released by sympathetic nerve terminals in response to cold stimulate lipolysis and activate BAT/beige thermogenesis via β-adrenergic receptors [34,35]. Our findings showed that 2-NAP significantly suppressed the β-adrenergic receptor agonist isoproterenol-stimulated Ucp1 expression in BAT1 brown adipocyte cells, which may contribute to its obesogenic potential.
Obesity is associated with a chronic low-grade inflammatory state, and adipose tissue inflammation is causatively linked to obesity-associated metabolic disorders, including insulin resistance and type 2 diabetes [36,37]. An essential feature of obesity-induced inflammation is the infiltration of macrophages into adipose tissue, which, together with inflamed adipocytes, contributes to obesity-associated chronic inflammation [38,39]. We found that chronic 2-NAP treatment in macrophages and adipocytes significantly increased the expression of proinflammatory cytokines. Thus, chronic exposure to the obesogen 2-NAP may further precipitate metabolic disorders by enhancing macrophage and adipocyte inflammation.
It has been well documented that long-term high fat diet (HFD) feeding causes white adipose tissue (WAT) remodeling, as evidenced by enlarged adipocytes, exaggerated inflammation, and increased fibrosis, leading to WAT dysfunction [40,41]. Although little is known about whether LMW PAHs contribute to adipose tissue fibrosis, evidence from the literature suggests a potential link between air pollutant exposure and fibrogenesis and tissue dysfunction. For example, PM2.5 is a type of air pollutant that contains particulate matter with a diameter of 2.5 micrometers or less. Studies have shown that PAHs make up a significant proportion of the chemical concentration in PM2.5 samples from most urban atmospheres [42]. Mice on a high-fat diet exposed to air pollution mixtures via inhalation showed increased levels of collagen type 1 protein and fibrosis development in the liver [43]. In addition, RAW264.7 cells exposed to the same mixture upregulated TGFβ mRNA expression [43]. PM2.5 exposure also induced the onset of a non-alcoholic steatohepatitis-like phenotype in mice [44]. As naphthalene and 2-naphthalene are components of PM2.5 mixtures, they may potentially promote fibrogenesis in inflamed adipose tissue, leading to adipose tissue dysfunction.
Overall, our findings show that 2-NAP significantly enhances adipocyte lipid accumulation by upregulating adipogenic (Pparγ, Cebpα) and lipogenic (Fasn) biomarkers while downregulating markers of lipolysis (Hsl, Atgl) in a differentiation stage-dependent fashion. In addition, we found that 2-NAP downregulates adiponectin expression in white and brown adipocytes and inhibits ISO-stimulated thermogenic expression in brown adipocytes. Moreover, 2-NAP also significantly stimulates proinflammatory cytokine expression in white adipocytes and macrophages. Data collected from this study will help characterize the role of PAHs in metabolism, obesity, and inflammation. Further characterization of this pathway may have significant implications for developing preventative and therapeutic strategies for many metabolic disorders.

Author Contributions

A.B. performed experiments, data analysis, and wrote the initial manuscript; F.L. and M.M. contributed technical expertise to the design and executed experimental protocols; B.X. and H.S. designed the study, revised and finalized the manuscript. All authors have read and agreed to the published version of the manuscript.

Funding

This work is supported by NIH grants R01DK125081 to BX, and R01DK118106 to B.X. and H.S.

Institutional Review Board Statement

Not applicable.

Informed Consent Statement

Not applicable.

Data Availability Statement

All datasets will be available upon request to the corresponding authors Hang Shi and Bingzhong Xue.

Acknowledgments

We thank Haoran Li and Tingting Hong for their input in the study.

Conflicts of Interest

The authors have no conflict of interest to declare.

References

  1. Liu, C.; Ying, Z.; Harkema, J.; Sun, Q.; Rajagopalan, S. Epidemiological and Experimental Links between Air Pollution and Type 2 Diabetes. Toxicol. Pathol. 2013, 41, 361–373. [Google Scholar] [CrossRef] [PubMed] [Green Version]
  2. Grover, P.L.; Sims, P.; Huberman, E.; Marquardt, H.; Kuroki, T.; Heidelberger, C. In vitro transformation of rodent cells by K-region derivatives of polycyclic hydrocarbons. Proc. Natl. Acad. Sci. 1971, 68, 1098–1101. [Google Scholar] [CrossRef] [PubMed] [Green Version]
  3. Lavoie, E.J.; Tulley, L.; Bedenko, V.; Hoffmann, D. Mutagenicity of methylated fluorenes and benzofluorenes. Mutat. Res. Lett. 1981, 91, 167–176. [Google Scholar] [CrossRef]
  4. Nisbet, I.C.T.; LaGoy, P.K. Toxic equivalency factors (TEFs) for polycyclic aromatic hydrocarbons (PAHs). Regul. Toxicol. Pharmacol. 1992, 16, 290–300. [Google Scholar] [CrossRef] [PubMed]
  5. Zhu, L.; Lu, H.; Chen, S.; Amagai, T. Pollution level, phase distribution and source analysis of polycyclic aromatic hydrocarbons in residential air in Hangzhou, China. J. Hazard. Mater. 2009, 162, 1165–1170. [Google Scholar] [CrossRef] [PubMed]
  6. Baek, S.O.; Goldstone, M.E.; Kirk, P.W.W.; Lester, J.N.; Perry, R. Phase distribution and particle size dependency of polycyclic aromatic hydrocarbons in the urban atmosphere. Chemosphere 1991, 22, 503–520. [Google Scholar] [CrossRef]
  7. Cautreels, W.; Van Cauwenberghe, K. Experiments on the distribution of organic pollutants between airborne particulate matter and the corresponding gas phase. Atmospheric Environ. 1978, 12, 1133–1141. [Google Scholar] [CrossRef]
  8. Mumtaz, M.; George, J. Toxicological profile for polycyclic aromatic hydrocarbons; Agency for Toxic Substances and Disease Registry (ATSDR): Atlanta, GA, USA, 1995; pp. 1–458.
  9. El-Masri, H.; Mumtaz, M.; Todd, D.G.; McClure, P.; Marable, B.; Singh, M. Toxicological Profile for Naphthalene, 1-Methylnaphthalene, and 2- Methylnaphthalene (Update); Agency for Toxic Substances and Disease Registry (ATSDR): Atlanta, GA, USA, 2005; pp. 1–291.
  10. Scinicariello, F.; Buser, M.C. Urinary Polycyclic Aromatic Hydrocarbons and Childhood Obesity: NHANES (2001–2006). El-Masri 2014, 122, 299–303. [Google Scholar] [CrossRef] [Green Version]
  11. Yan, Z.; Zhang, H.; Maher, C.; Arteaga-Solis, E.; Champagne, F.A.; Wu, L.; McDonald, J.D.; Yan, B.; Schwartz, G.J.; Miller, R.L. Prenatal Polycyclic Aromatic Hydrocarbon, Adiposity, Peroxisome Proliferator-Activated Receptor (PPAR) γ Methylation in Offspring, Grand-Offspring Mice. PLoS ONE 2014, 9, e110706. [Google Scholar] [CrossRef] [Green Version]
  12. Pei, X.-H.; Nakanishi, Y.; Inoue, H.; Takayama, K.; Bai, F.; Hara, N. Polycyclic aromatic hydrocarbons induce IL-8 expression through nuclear factor kB activation in A549 cell line. Cytokine 2002, 19, 236–241. [Google Scholar] [CrossRef]
  13. Vandebriel, R.J.; Meredith, C.; Scott, M.P.; Roholl, P.J.M.; Van Loveren, H. Effects of in Vivo Exposure to Bis(tri-n-butyltin)oxide, Hexachlorobenzene, and Benzo(a)pyrene on Cytokine (Receptor) mRNA Levels in Cultured Rat Splenocytes and on IL-2 Receptor Protein Levels 1 Effects of in Vivo Exposure to Bis(tri-n-butyltin)oxide, He. Toxicol. Appl. Pharmacol. 1998, 148, 126–136. [Google Scholar] [CrossRef]
  14. Ndiaye, M.; Le Ferrec, E.; Lagadic-Gossmann, D.; Bastien Corre, S.; Gilot, D.; Rie Lecureur, V.; Monteiro, P.; Rauch, C.; Galibert, M.-D.; Fardel, O. Aryl Hydrocarbon Receptor-and Calcium-dependent Induction of the Chemokine CCL1 by the Environmental Contaminant Benzo[a]pyrene. J. Biol. Chem. 2006, 281, 19906–19915. [Google Scholar] [CrossRef] [PubMed] [Green Version]
  15. Lecureur, V.; Le Ferrec, E.; N'Diaye, M.; Le Vee, M.; Gardyn, C.; Gilot, D.; Fardel, O. ERK-dependent induction of TNFα expression by the environmental contaminant benzo(a)pyrene in primary human macrophages. FEBS Lett. 2005, 579, 1904–1910. [Google Scholar] [CrossRef] [PubMed] [Green Version]
  16. Myers, M.J.; Schook, L.B.; Bick, P.H. Mechanisms of Benzo(A)Pyrene-lnduced Modulation of Antigen Presentation. J. Pharmacol. Exp. Ther. 1987, 242, 399–404. [Google Scholar]
  17. Lyte, M.; Bick, P.H. Modulation of interleukin-1 production by macrophages following benzo(a)pyrene exposure. Int. J. Immunopharmacol. 1986, 8, 377–381. [Google Scholar] [CrossRef] [PubMed]
  18. Qiu, B.; Simon, C.M. BODIPY 493/503 Staining of Neutral Lipid Droplets for Microscopy and Quantification by Flow Cytometry. Bio Protoc. 2016, 6, 1–6. [Google Scholar] [CrossRef] [PubMed] [Green Version]
  19. Baris, E.; Efe, H.; Gumustekin, M.; Arici, A.; Tosun, M. Varenicline Prevents LPS-Induced Inflammatory Response via Nicotinic Acetylcholine Receptors in RAW 264.7 Macrophages. Front. Mol. Biosci. 2021, 8, 1–9. [Google Scholar] [CrossRef] [PubMed]
  20. Kim, J.; Bajaj, M. Normal Adipose Tissue Biology: Adipocytokines and Inflammation. Pathobiol. Hum. Dis. A Dyn. Encycl. Dis. Mech. 2014, 488–497. [Google Scholar] [CrossRef]
  21. Diggs, D.L.; Huderson, A.C.; Harris, K.L.; Myers, J.N.; Banks, L.D.; Rekhadevi, P.V.; Niaz, M.S.; Ramesh, A. Polycyclic Aromatic Hydrocarbons and digestive tract cancers-a perspective. J. Environ. Sci. Heal. Part C. 2011, 29, 324–357. [Google Scholar] [CrossRef] [Green Version]
  22. Marris, C.R.; Kompella, S.N.; Miller, M.R.; Incardona, J.P.; Brette, F.; Hancox, J.C.; Sørhus, E.; Shiels, H.A. Polyaromatic hydrocarbons in pollution: A heart-breaking matter. J. Physiol. 2020, 598, 227–247. [Google Scholar] [CrossRef]
  23. Kilanowicz, A.; Czerski, B.; Sapota, A. The disposition and metabolism of naphthalene in rats. Int. J. Occup. Med. Environ. Health 1999, 12, 209–219. [Google Scholar]
  24. Berry, D.C.; Stenesen, D.; Zeve, D.; Graff, J.M. The developmental origins of adipose tissue. Development 2013, 140, 3939–3949. [Google Scholar] [CrossRef] [PubMed]
  25. Hu, E.; Liang, P.; Spiegelman, B.M. AdipoQ is a novel adipose-specific gene dysregulated in obesity. J. Biol. Chem. 1996, 271, 10697–10703. [Google Scholar] [CrossRef] [PubMed] [Green Version]
  26. Yamauchi, T.; Kamon, J.; Waki, H.; Terauchi, Y.; Kubota, N.; Hara, K.; Mori, Y.; Ide, T.; Murakami, K.; Tsuboyama-Kasaoka, N.; et al. The fat-derived hormone adiponectin reverses insulin resistance associated with both lipoatrophy and obesity. Nat. Medi-Cine Vol. 2001, 7, 941–946. [Google Scholar] [CrossRef] [PubMed]
  27. Arita, Y.; Kihara, S.; Ouchi, N.; Takahashi, M.; Maeda, K.; Miyagawa, J.I.; Hotta, K.; Shimomura, I.; Nakamura, T.; Miyaoka, K.; et al. Paradoxical decrease of an adipose-specific protein, adiponectin, in obesity. Biochem. Biophys. Res. Commun. 1999, 257, 79–83. [Google Scholar] [CrossRef]
  28. Wang, Z.V.; Scherer, P.E. Adiponectin, the past two decades. J. Mol. Cell Biol. 2016, 8, 93–100. [Google Scholar] [CrossRef] [Green Version]
  29. Stern, J.H.; Rutkowski, J.M.; Scherer, P.E. Adiponectin, Leptin, and Fatty Acids in the Maintenance of Metabolic Homeostasis through Adipose Tissue Crosstalk. Cell Metab. 2016, 23, 770–784. [Google Scholar] [CrossRef] [Green Version]
  30. Kajimura, S.; Seale, P.; Spiegelman, B.M. Transcriptional Control of Brown Fat Development. Cell Metab. 2010, 11, 257–262. [Google Scholar] [CrossRef] [Green Version]
  31. Wang, W.; Seale, P. Control of brown and beige fat development. Nat. Rev. Mol. Cell Biol. 2016, 17, 691–702. [Google Scholar] [CrossRef] [Green Version]
  32. Cannon, B.; Nedergaard, J. The biochemistry of an inefficient tissue: Brown adipose tissue. Essays in Biochem. 1985, 20, 110–164. [Google Scholar]
  33. Cannon, B.; Nedergaard, J. Nonshivering thermogenesis and its adequate measurement in metabolic studies. J. Exp. Biol. 2011, 214, 242–253. [Google Scholar] [CrossRef] [Green Version]
  34. Cannon, B.; Nedergaard, J.A.N. Brown Adipose Tissue: Function and Physiological Significance. Physiol. Rev. 2004, 277–359. [Google Scholar] [CrossRef] [PubMed]
  35. Cinti, S. The adipose organ. Prostaglandins Leukot. Essent. Fat. Acids 2005, 73, 9–15. [Google Scholar] [CrossRef]
  36. Hotamisligil, G.S. Inflammation and metabolic disorders. Nature 2006, 444, 860–867. [Google Scholar] [CrossRef] [PubMed]
  37. Olefsky, J.M.; Glass, C.K. Macrophages, Inflammation, and Insulin Resistance. Annu. Rev. Physiol. 2010, 72, 219–246. [Google Scholar] [CrossRef] [PubMed]
  38. Weisberg, S.P.; McCann, D.; Desai, M.; Rosenbaum, M.; Leibel, R.L.; Ferrante, A.W., Jr. Obesity is associated with macrophage accumulation in adipose tissue. J. Clin. Investig. 2003, 112, 1796–1808. [Google Scholar] [CrossRef] [PubMed]
  39. Xu, H.; Barnes, G.T.; Yang, Q.; Tan, G.; Yang, D.; Chou, C.J.; Sole, J.; Nichols, A.; Ross, J.S.; Tartaglia, L.A.; et al. Chronic inflammation in fat plays a crucial role in the development of obesity-related insulin resistance. J. Clin. Investig. 2003, 112, 1821–1830. [Google Scholar] [CrossRef]
  40. Crewe, C.; An, Y.A.; Scherer, P.E. The ominous triad of adipose tissue dysfunction: Inflammation, fibrosis, and impaired angiogenesis. J. Clin. Investig. 2017, 127, 74. [Google Scholar] [CrossRef] [Green Version]
  41. Sun, K.; Kusminski, C.M.; Scherer, P.E. Adipose tissue remodeling and obesity. J. Clin. Investig. 2011, 121, 2094–2101. [Google Scholar] [CrossRef] [Green Version]
  42. Fu, H.; Liu, X.; Li, W.; Zu, Y.; Zhou, F.; Shou, Q.; Ding, Z. PM2.5 Exposure Induces Inflammatory Response in Macrophages via the TLR4/COX-2/NF-κB Pathway. Inflammation 2020, 43, 1948–1958. [Google Scholar] [CrossRef]
  43. Zheng, Z.; Zhang, X.; Wang, J.; Dandekar, A.; Kim, H.; Qiu, Y.; Xu, X.; Cui, Y.; Wang, A.; Chen, L.C.; et al. Exposure to fine airborne particulate matters induces hepatic fibrosis in murine models. J. Hepatol. 2015, 63, 1397–1404. [Google Scholar] [CrossRef] [PubMed] [Green Version]
  44. Zheng, Z.; Xu, X.; Zhang, X.; Wang, A.; Zhang, C.; Hüttemann, M.; Grossman, L.I.; Chen, L.C.; Rajagopalan, S.; Sun, Q.; et al. Exposure to ambient particulate matter induces a NASH-like phenotype and impairs hepatic glucose metabolism in an animal model. J. Hepatol. 2013, 58, 148–154. [Google Scholar] [CrossRef] [PubMed]
Figure 1. Acute 2-NAP treatment of RAW264.7 macrophages upregulates proinflammatory cytokine expression. (A) The effect of LPS on proinflammatory gene expression in RAW264.7 macrophages. Cells were stimulated with LPS for 4 h. Following stimulation, mRNA was extracted and assayed for relative gene expression of Tnfα, Il-1β, and Il-6 by RT-PCR. The values shown represent the mean ± SEM of replicate samples from one experiment (n = 4). Groups labeled with different letters (a, b, c, and d) are statistically different from each other. (B) Macrophages were either treated with 2-NAP alone–six 10-fold concentrations (10 pM–10 μM concentrations) or stimulated with LPS (10 ng/mL) alongside 2-NAP treatment. LPS was used to mimic chronic inflammatory (M1-like) conditions. Solvent control—DMEM + 0.01% ethanol (EtOH); LPS control—DMEM + LPS 10 ng/mL. Upon experimental termination, mRNA was extracted and relative gene expression of Tnfα, Il-1β, and Il-6 mRNA was then determined by RT-PCR (n = 4). The values shown represent the mean ± SEM. A p-value of p < 0.05 indicates statistical significance between two groups. (C) Protein expression of TNF-α extracted from cellular supernatants (n = 4). The optical density of each sample represents readings of TNFα levels secreted into the medium by ELISA assay and was measured using a microplate reader set to 450 nm. Wavelength correction was set to 570 nm. The values shown represent the mean ± SEM. A p-value of p < 0.05 indicates statistical significance between two groups.
Biomolecules 13 00196 g001
Figure 2. Chronic 2-NAP treatment of RAW264.7 macrophages upregulates mRNA expression of proinflammatory cytokines. (A,B) Relative mRNA expression levels of proinflammatory markers (Tnfα, Il-1β, and Il-6) in cells treated with 2-NAP (1 µM) for 24 (A) and 48 (B) hours. RAW264.7 macrophages were first treated with or without 1 µM 2-NAP for 24 (A) or 48 (B) hours, and then challenged with different concentrations of LPS as indicated for 4 h. Upon experimental termination, mRNA was extracted and relative gene expression of Tnfα, Il-1β, and Il-6 mRNA was then determined by RT-PCR (n = 4). The values shown represent the mean ± SEM. * Denotes p < 0.05 when compared with controls.
Biomolecules 13 00196 g002
Figure 3. Chronic 2-naphthol treatment regulates adipogenic, lipogenic, and lipolytic gene expression in 3T3-L1 adipocytes. Relative mRNA expression of genes encoding for adipogenic transcription factors (A) Pparγ and (B) Cebpα; adipocyte-specific marker (C) ap2/Fabp4, lipogenic and lipolytic markers (D) Fasn(E) Hsl and (F) Atgl; and the adipokine (G) Adipoq was measured in preadipocytes and differentiated 3T3-L1 adipocytes treated with 1 µM 2-NAP at different differentiation stages as indicated. Upon experimental termination, mRNA was extracted and relative gene expression was then determined by RT-PCR (n = 4). The values shown represent the mean ± SEM. A p-value of p < 0.05 indicates statistical significance between two groups.
Biomolecules 13 00196 g003
Figure 4. Phenotypic analysis of 2-naphthol’s effect on adipocyte differentiation and lipid accumulation by oil red O and BODIPY staining. Upon experimental termination, 3T3-L1 cells were fixed, stained, and photographed either directly (whole-well view) or at ×40 magnification (microscopic view). (A) Whole-well imaging comparing ORO (red) stained 3T3-L1 preadipocytes differentiated under chronic 2-NAP treatments versus their controls. (B) Confocal microscopic images of BODIPY 493/503 (green) stained neutral lipid content in 3T3-L1 cells under chronic 2-NAP treatment. The scale bar spans 50 μM.
Biomolecules 13 00196 g004
Figure 5. Chronic 2-NAP exposure increases the expression of inflammatory genes in 3T3-L1 cells. Relative mRNA expression of inflammatory genes (Tnfα, Il-1β, and Il-6) in 3T3-L1 adipocytes chronically treated with 1 µM 2-NAP as indicated. LPS (1 ng/mL) was used as a positive control. Upon experimental termination, mRNA was extracted and relative gene expression was then determined by RT-PCR (n = 4). The values shown represent the mean ± SEM. A p-value of p < 0.05 indicates statistical significance between two groups.
Biomolecules 13 00196 g005
Figure 6. Effect of 2-NAP on thermogenic and adipogenic genes in BAT1 cells. Relative mRNA expression of adipogenic transcription factors (A) Pparγ and (B) Cebpα; markers of lipogenesis and lipolysis (C) Fasn; (D) Hsl, and (E) Atgl; the adipokine (F) Adipoq; and thermogenic genes (G) Ucp1 and (H) Pgc1α was measured in BAT1 brown adipocytes chronically treated with 1 µM 2-NAP as indicated. On day 8, half of the cells were further treated with 1 µM isoproterenol (Iso) for 4 h. Upon experimental termination, mRNA was extracted and relative gene expression was then determined by RT-PCR (n = 4). The values shown represent the mean ± SEM. A p-value of p < 0.05 indicates statistical significance between two groups.
Biomolecules 13 00196 g006
Disclaimer/Publisher’s Note: The statements, opinions and data contained in all publications are solely those of the individual author(s) and contributor(s) and not of MDPI and/or the editor(s). MDPI and/or the editor(s) disclaim responsibility for any injury to people or property resulting from any ideas, methods, instructions or products referred to in the content.

