
A New Laboratory Workflow Integrating the Free Light Chains Kappa Quotient into Routine CSF Analysis
 , , and
Abstract
:1. Introduction
2. Materials and Methods
2.1. Standard Protocol Approvals and Patient Consent
2.2. Patient Samples and Cohorts
2.3. Laboratory Analyses
2.4. Statistical Analysis
3. Results
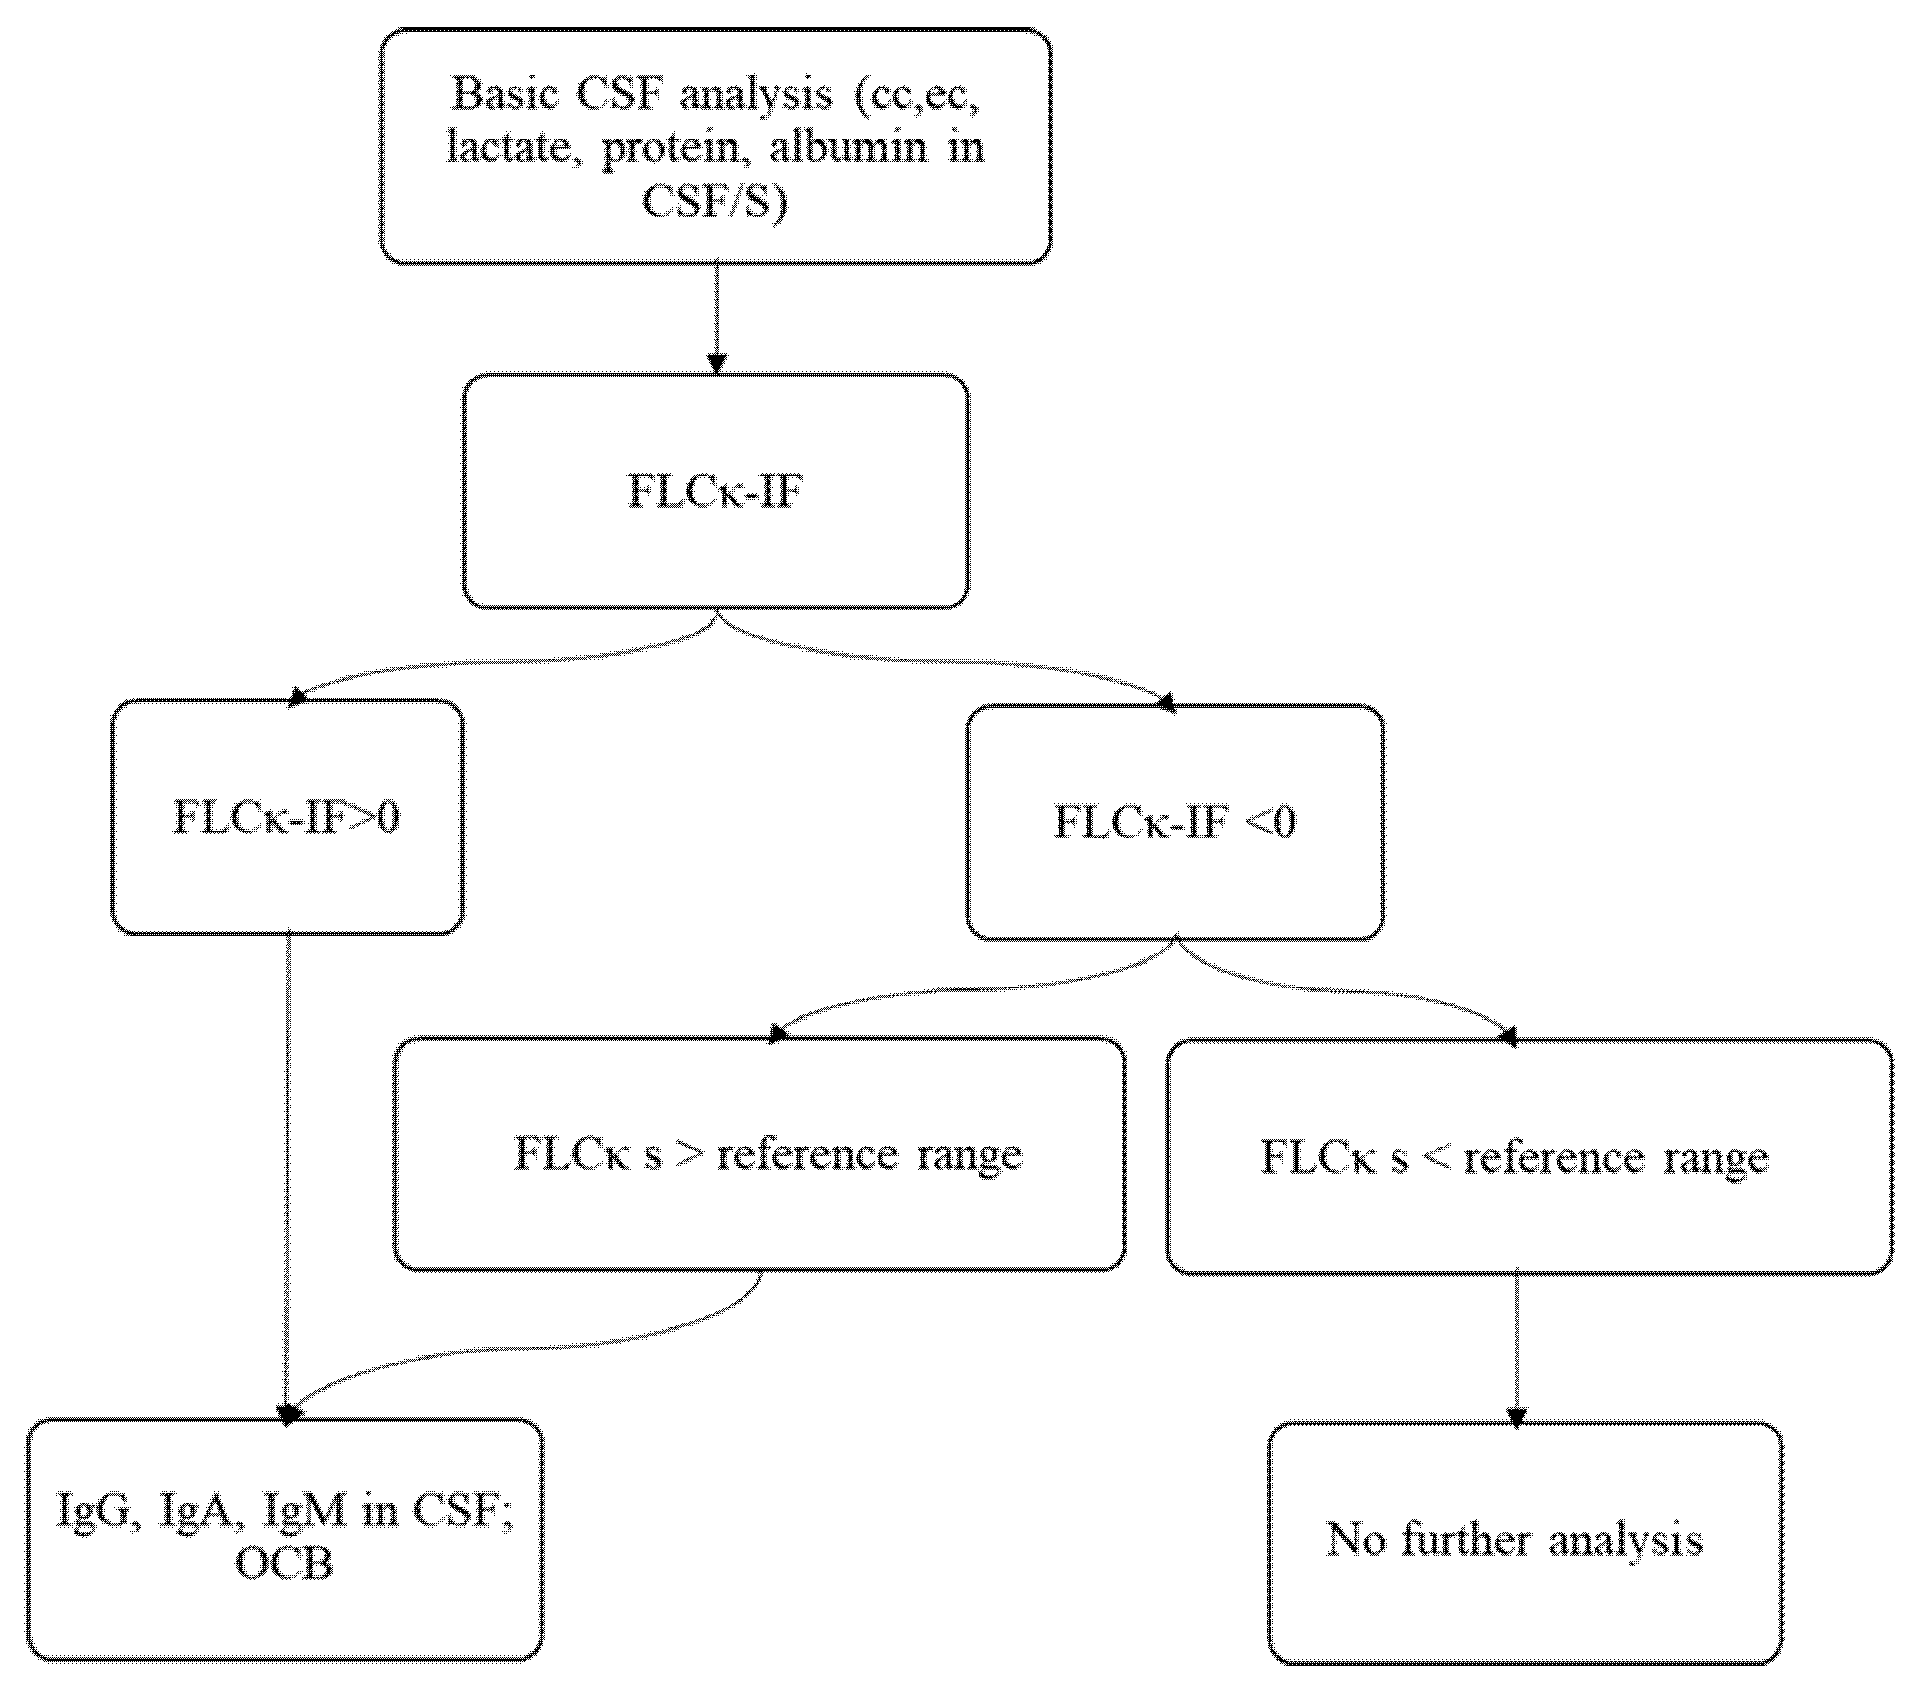
3.1. Establishing a New Diagnostic Workflow Integrating FLCκ-IF as a First Line Analysis for an Intrathecal Humoral Immune Response
3.2. Part II: Evaluation of the Laboratory Workflow in a Prospective Validation Cohort
4. Discussion
5. Conclusions
Supplementary Materials
Author Contributions
Funding
Institutional Review Board Statement
Informed Consent Statement
Data Availability Statement
Conflicts of Interest
Appendix A
References
- Reiber, H. Proteins in cerebrospinal fluid and blood: Barriers, CSF flow rate and source-related dynamics. Restor. Neurol. Neurosci. 2003, 21, 79–96. [Google Scholar] [PubMed]
- Reiber, H. Flow rate of cerebrospinal fluid (CSF)—A concept common to normal blood-CSF barrier function and to dysfunction in neurological diseases. J. Neurol. Sci. 1994, 122, 189–203. [Google Scholar] [CrossRef]
- Reiber, H.; Zeman, D.; Kusnierova, P.; Mundwiler, E.; Bernasconi, L. Diagnostic relevance of free light chains in cerebrospinal fluid-The hyperbolic reference range for reliable data interpretation in quotient diagrams. Clin. Chim. Acta 2019, 497, 153–162. [Google Scholar] [CrossRef] [PubMed]
- Ramsden, D.B. Multiple sclerosis: Assay of free immunoglobulin light chains. Ann. Clin. Biochem. 2017, 54, 5–13. [Google Scholar] [CrossRef] [PubMed] [Green Version]
- Susse, M.; Hannich, M.; Petersmann, A.; Zylla, S.; Pietzner, M.; Nauck, M.; Dressel, A. Kappa free light chains in cerebrospinal fluid to identify patients with oligoclonal bands. Eur. J. Neurol. 2018, 25, 1134–1139. [Google Scholar] [CrossRef] [PubMed]
- Senel, M.; Mojib-Yezdani, F.; Braisch, U.; Bachhuber, F.; Lewerenz, J.; Ludolph, A.C.; Otto, M.; Tumani, H. CSF Free Light Chains as a Marker of Intrathecal Immunoglobulin Synthesis in Multiple Sclerosis: A Blood-CSF Barrier Related Evaluation in a Large Cohort. Front. Immunol. 2019, 10, 641. [Google Scholar] [CrossRef] [PubMed] [Green Version]
- Saez, M.S.; Rojas, J.I.; Lorenzon, M.V.; Sanchez, F.; Patrucco, L.; Miguez, J.; Azcona, C.; Sorroche, P.; Cristiano, E. Validation of CSF free light chain in diagnosis and prognosis of multiple sclerosis and clinically isolated syndrome: Prospective cohort study in Buenos Aires. J. Neurol. 2019, 266, 112–118. [Google Scholar] [CrossRef] [PubMed]
- Gurtner, K.M.; Shosha, E.; Bryant, S.C.; Andreguetto, B.D.; Murray, D.L.; Pittock, S.J.; Willrich, M.A.V. CSF free light chain identification of demyelinating disease: Comparison with oligoclonal banding and other CSF indexes. Clin. Chem. Lab. Med. 2018, 56, 1071–1080. [Google Scholar] [CrossRef]
- Konen, F.F.; Schwenkenbecher, P.; Jendretzky, K.F.; Gingele, S.; Witte, T.; Suhs, K.W.; Grothe, M.; Hannich, M.J.; Susse, M.; Skripuletz, T. Kappa Free Light Chains in Cerebrospinal Fluid in Inflammatory and Non-Inflammatory Neurological Diseases. Brain. Sci. 2022, 12, 475. [Google Scholar] [CrossRef]
- Susse, M.; Reiber, H.; Grothe, M.; Petersmann, A.; Nauck, M.; Dressel, A.; Hannich, M.J. Free light chain kappa and the polyspecific immune response in MS and CIS-Application of the hyperbolic reference range for most reliable data interpretation. J. Neuroimmunol. 2020, 346, 577287. [Google Scholar] [CrossRef]
- Susse, M.; Feistner, F.; Grothe, M.; Nauck, M.; Dressel, A.; Hannich, M.J. Free light chains kappa can differentiate between myelitis and noninflammatory myelopathy. Neurol. Neuroimmunol. Neuroinflamm. 2020, 7, 5. [Google Scholar] [CrossRef] [PubMed]
- Susse, M.; Feistner, F.; Holbe, C.; Grothe, M.; Nauck, M.; Dressel, A.; Hannich, M.J. Diagnostic value of kappa free light chains in patients with one isolated band in isoelectric focusing. Clin. Chim. Acta 2020, 507, 205–209. [Google Scholar] [CrossRef] [PubMed]
- Hannich, M.J.; Dressel, A.; Budde, K.; Petersmann, A.; Nauck, M.; Susse, M. Kappa Free Light Chains in the Context of Blood Contamination, and Other IgA- and IgM-Related Cerebrospinal Fluid Disease Pattern. Cells 2021, 10, 616. [Google Scholar] [CrossRef] [PubMed]
- Rosenstein, I.; Rasch, S.; Axelsson, M.; Novakova, L.; Blennow, K.; Zetterberg, H.; Lycke, J. Kappa free light chain index as a diagnostic biomarker in multiple sclerosis: A real-world investigation. J. Neurochem. 2021, 159, 618–628. [Google Scholar] [CrossRef]
- Brettschneider, J.; Claus, A.; Kassubek, J.; Tumani, H. Isolated blood-cerebrospinal fluid barrier dysfunction: Prevalence and associated diseases. J. Neurol. 2005, 252, 1067–1073. [Google Scholar] [CrossRef]
- Schwenkenbecher, P.; Konen, F.F.; Wurster, U.; Witte, T.; Gingele, S.; Suhs, K.W.; Stangel, M.; Skripuletz, T. Reiber’s Diagram for Kappa Free Light Chains: The New Standard for Assessing Intrathecal Synthesis? Diagnostics 2019, 9, 194. [Google Scholar] [CrossRef] [Green Version]
- Link, H. Immunoglobulin G and low molecular weight proteins in human cerebrospinal fluid. Chemical and immunological characterisation with special reference to multiple sclerosis. Acta Neurol. Scand. 1967, 43 (Suppl. 28), 21–136. [Google Scholar]
- Nakano, T.; Matsui, M.; Inoue, I.; Awata, T.; Katayama, S.; Murakoshi, T. Free immunoglobulin light chain: Its biology and implications in diseases. Clin. Chim Acta 2011, 412, 843–849. [Google Scholar] [CrossRef]
- Reiber, H. Knowledge-base for interpretation of cerebrospinal fluid data patterns. Essentials in neurology and psychiatry. Arq. Neuropsiquiatr. 2016, 74, 501–512. [Google Scholar] [CrossRef] [Green Version]
- Hegen, H.; Zinganell, A.; Auer, M.; Deisenhammer, F. The clinical significance of single or double bands in cerebrospinal fluid isoelectric focusing. A retrospective study and systematic review. PLoS ONE 2019, 14, e0215410. [Google Scholar] [CrossRef] [Green Version]
- Sanz Diaz, C.T.; de Las Heras Florez, S.; Carretero Perez, M.; Hernandez Perez, M.A.; Martin Garcia, V. Evaluation of Kappa Index as a Tool in the Diagnosis of Multiple Sclerosis: Implementation in Routine Screening Procedure. Front. Neurol. 2021, 12, 676527. [Google Scholar] [CrossRef] [PubMed]
- Crespi, I.; Sulas, M.G.; Mora, R.; Naldi, P.; Vecchio, D.; Comi, C.; Cantello, R.; Bellomo, G. Combined use of Kappa Free Light Chain Index and Isoelectrofocusing of Cerebro-Spinal Fluid in Diagnosing Multiple Sclerosis: Performances and Costs. Clin. Lab. 2017, 63, 551–559. [Google Scholar] [CrossRef] [PubMed]
- Jenner, E. Serum free light chains in clinical laboratory diagnostics. Clin. Chim. Acta 2014, 427, 15–20. [Google Scholar] [CrossRef]
 ) or Ig synthesis in the corresponding quotient diagram (
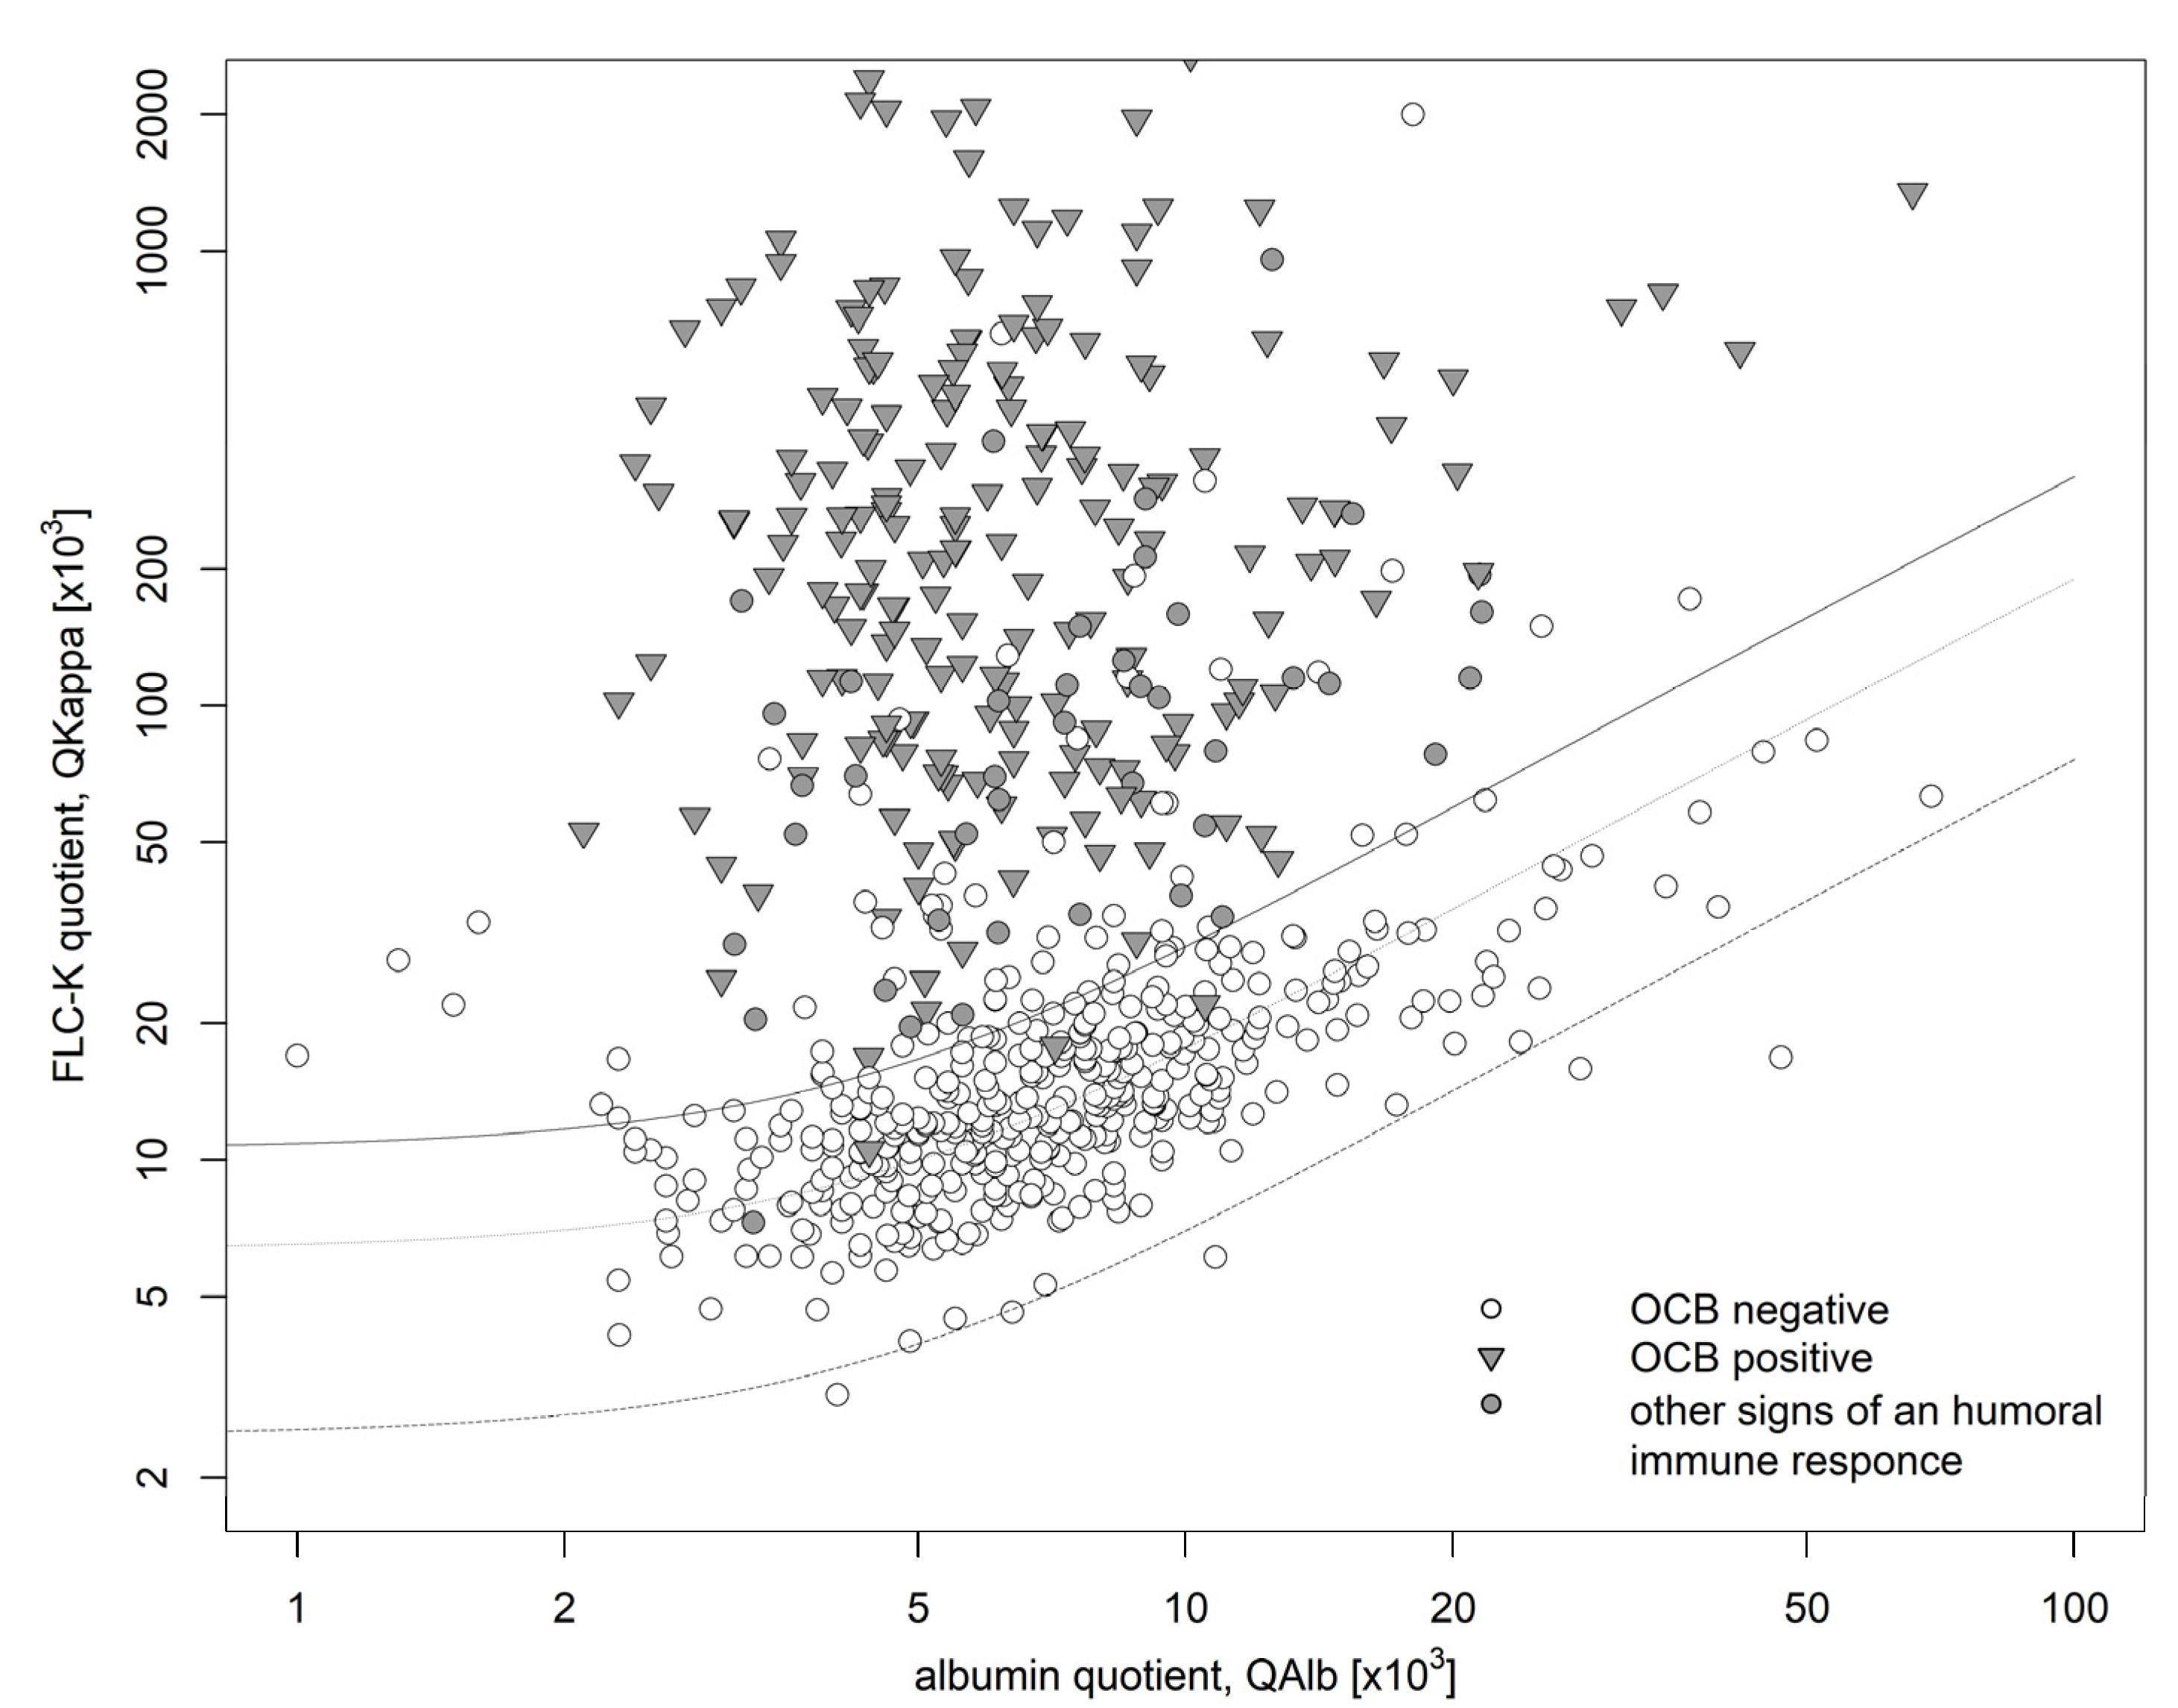
 )) of which 4 lacked an intrathecal FLCκ synthesis (IF FLCκ < 0). FLCκ: free light chains kappa, Q: quotient, Alb: albumin.
) or Ig synthesis in the corresponding quotient diagram ()) of which 4 lacked an intrathecal FLCκ synthesis (IF FLCκ < 0). FLCκ: free light chains kappa, Q: quotient, Alb: albumin.
)) of which 4 lacked an intrathecal FLCκ synthesis (IF FLCκ < 0). FLCκ: free light chains kappa, Q: quotient, Alb: albumin.
) or Ig synthesis in the corresponding quotient diagram ()) of which 4 lacked an intrathecal FLCκ synthesis (IF FLCκ < 0). FLCκ: free light chains kappa, Q: quotient, Alb: albumin.
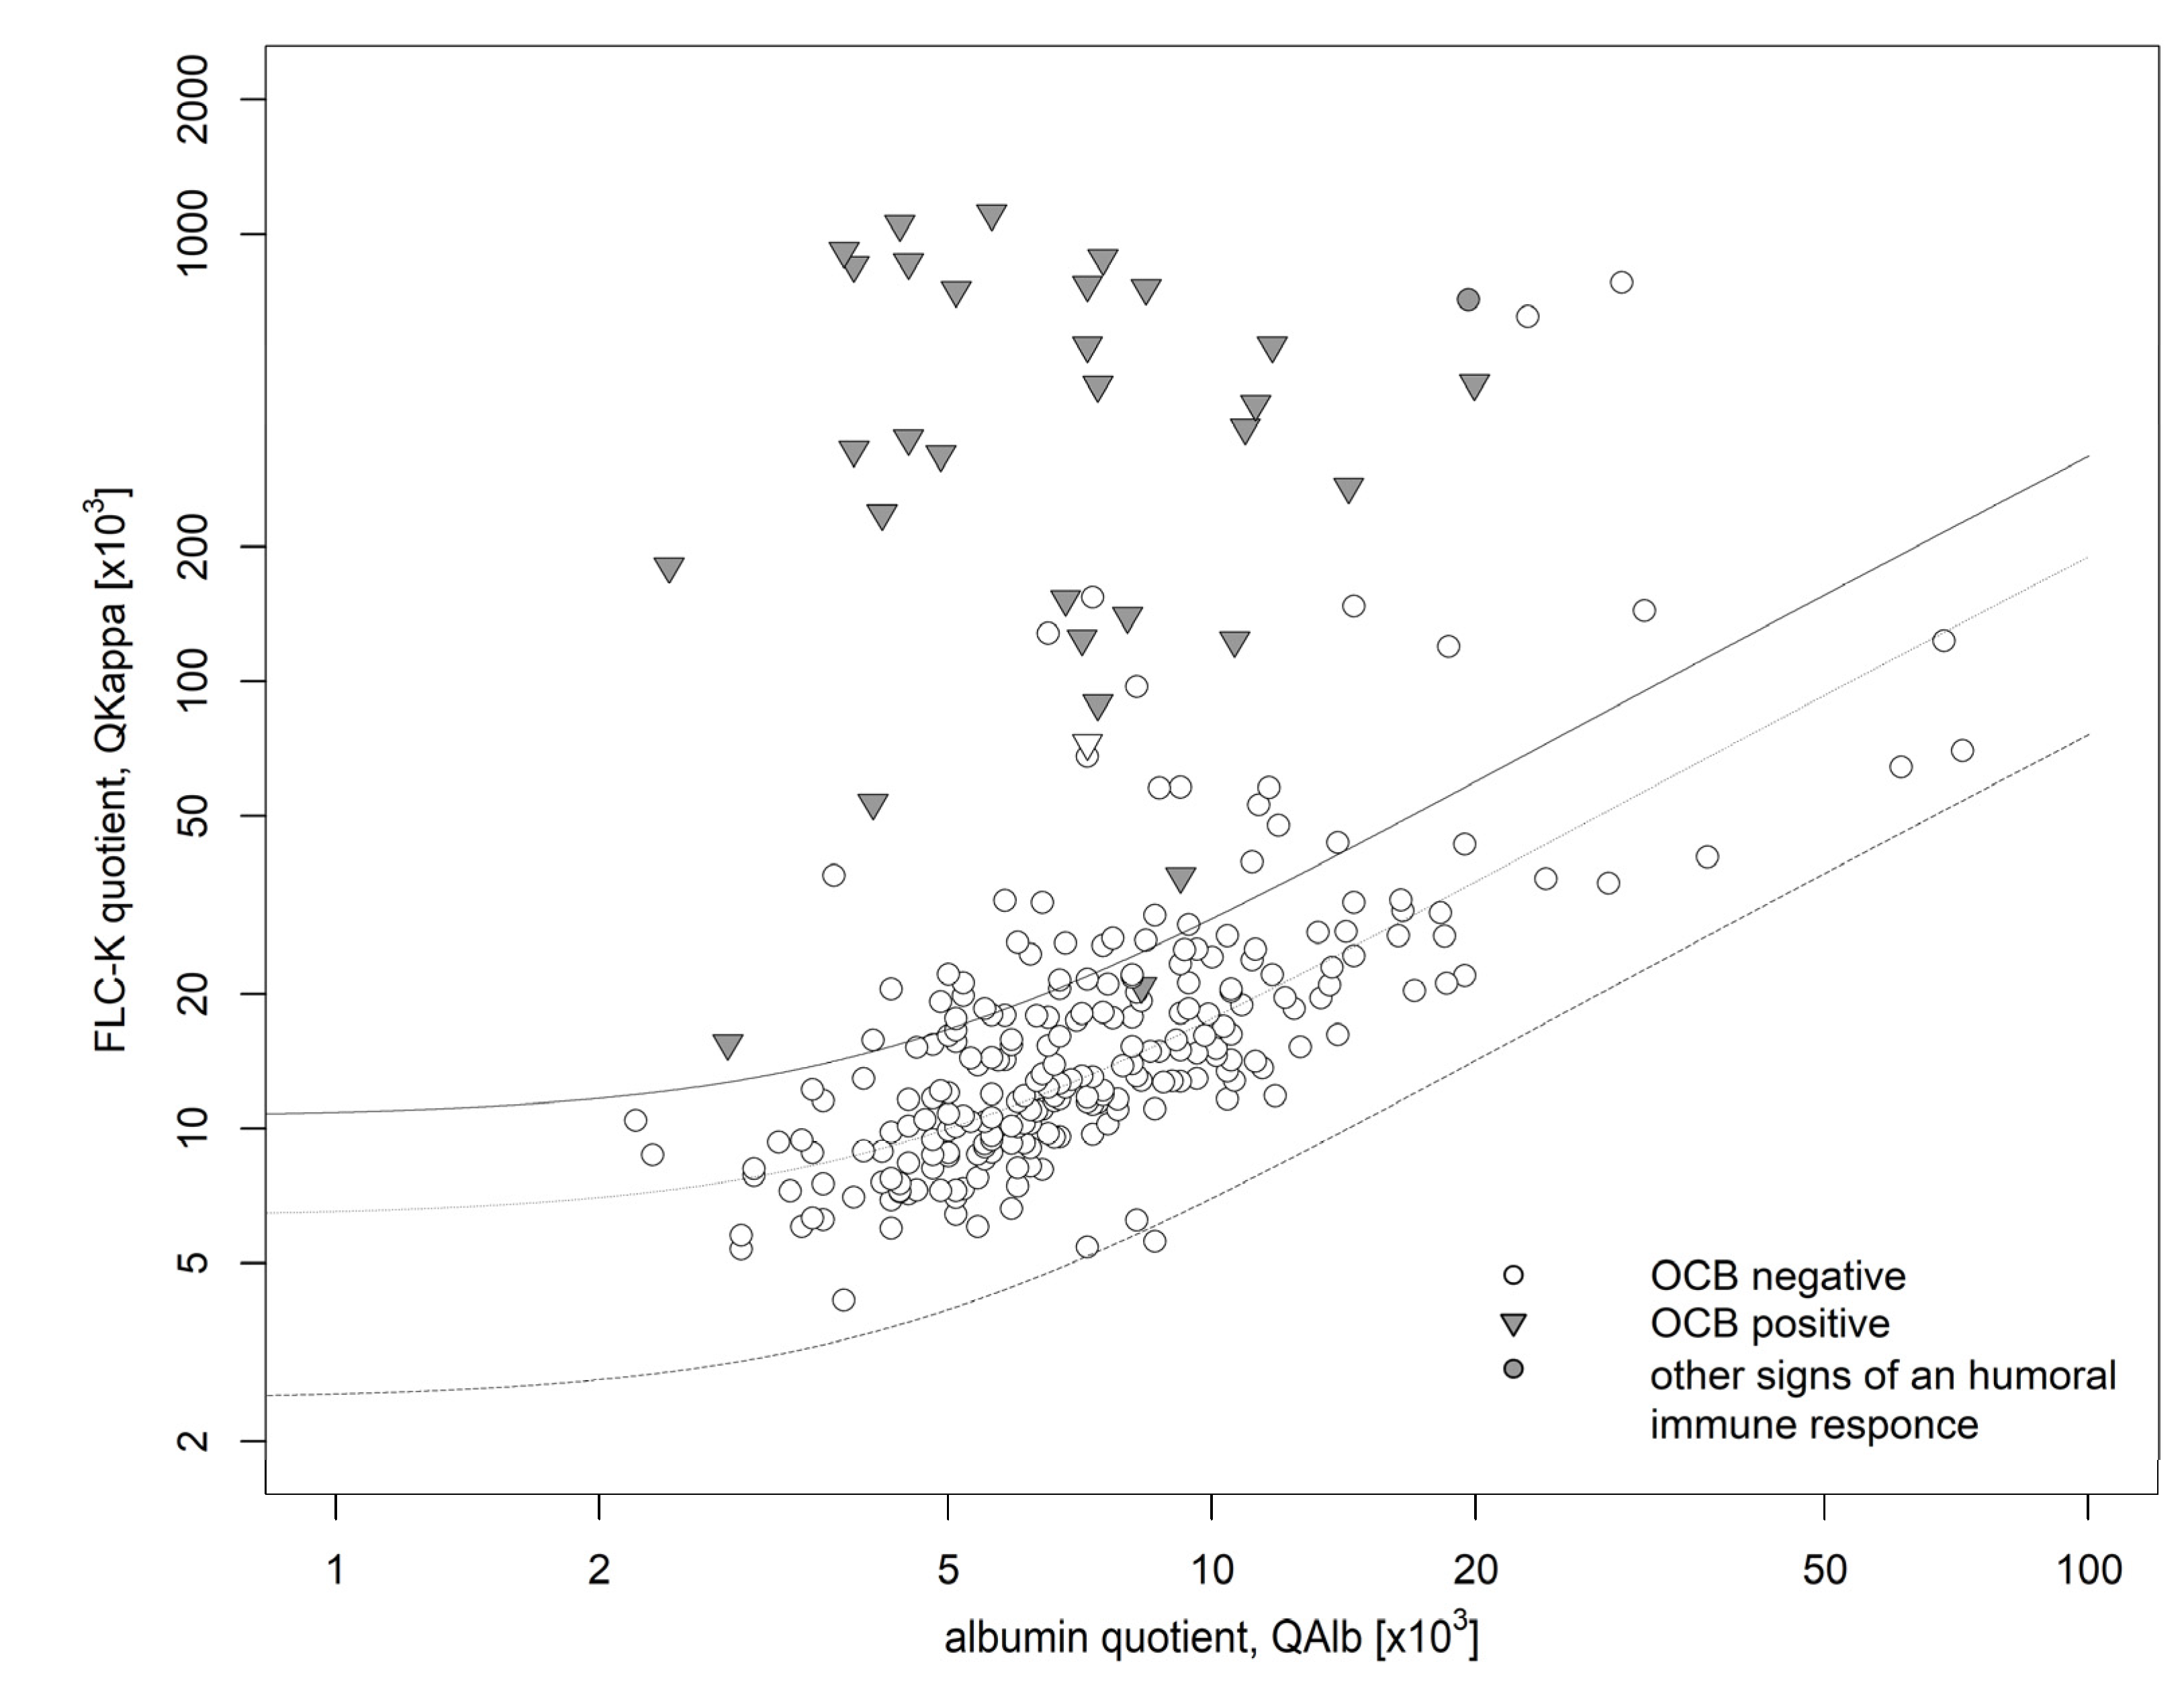
 ) or Ig synthesis in the corresponding quotient diagram ()) of which one lacked an intrathecal FLCκ synthesis (QFLCκ > QLim (FLCκ)). FLCκ free light chains kappa, Q quotient, Alb albumin.
) or Ig synthesis in the corresponding quotient diagram ()) of which one lacked an intrathecal FLCκ synthesis (QFLCκ > QLim (FLCκ)). FLCκ free light chains kappa, Q quotient, Alb albumin.
) or Ig synthesis in the corresponding quotient diagram ()) of which one lacked an intrathecal FLCκ synthesis (QFLCκ > QLim (FLCκ)). FLCκ free light chains kappa, Q quotient, Alb albumin.

| Discovery Cohort (n = 679) | Validation Cohort (n = 278) | |
|---|---|---|
| Age (y) | 52 (36; 65) | 56 (41; 69) |
| QAlb | 6.4 (4.7; 9.1) | 6.7 (5.1; 9.4) |
| QIgG | 3.6 (2.5; 5.1) | 3.1 (2.3; 4.5) |
| QIgA | 1.9 (1.2; 2.9) | 1.7 (1.2; 2.7) |
| QIgM | 0.4 (0.2; 0.8) | 0.3 (0.2; 0.7) |
| One-class Ig immune response | ||
| IgG-synthesis; n (%) | 71 (10) | 12 (4) |
| IgA-synthesis; n (%) | 10 (1.4) | 0 |
| IgM-synthesis; n (%) | 19 (2.7) | 1 (0.3) |
| Two-class Ig immune response | ||
| IgG/M-synthesis; n (%) | 31 (4.5) | 6 (2) |
| IgA/M-synthesis; n (%) | 12 (1.8) | 1 (0.3) |
| IgG/A-synthesis; n (%) | 9 (1.3) | 1 (0.3) |
| Three-class Ig immune response | 4 (0.05) | 2 (0.7) |
| Artificial blood Contamination, n (%) | 18 (2.3) | 1 (0.3) |
| CSF specific OCB; n (%) | 204 (30) | 31 (11) |
| CC/µL | 1 (1; 4) | 1 (1; 2) |
| FLCκ IF > 0%; n (%) | 302 (44) | 67 (24) |
| FLCκ serum (mg/L) | 13.1 (10.2; 18) | 13.1 (9.81; 17.97) |
| FLCκ CSF (mg/L) | 0.363 (0.189; 1.63) | 0.23 (0.12; 0.48) |
| QFLCκ | 21.5 (12.04; 111.38) | 15.21 (10.29; 26.28) |
| Evidence of Intrathecal Humoral Immune Response (OCB and/or IF IgG/A/M > 0%) | No Evidence of Intrathecal Humoral Immune Response (OCB and IF IgG/A/M < 0%) | |||
|---|---|---|---|---|
| Discovery cohort | FLCκ-IF > 0% | 244 | 60 | PPV: 80% |
| FLCκ-IF < 0% | 4 | 374 | NPV: 99% | |
| Sensitivity: 98 % | Specificity: 86 % | |||
| Validation cohort | FLCκ-IF > 0% | 32 | 36 | PPV: 47% |
| FLCκ-IF < 0% | 1 | 211 | NPV: 99% | |
| Sensitivity: 97 % | Specificity: 85 % | |||
Publisher’s Note: MDPI stays neutral with regard to jurisdictional claims in published maps and institutional affiliations. |
© 2022 by the authors. Licensee MDPI, Basel, Switzerland. This article is an open access article distributed under the terms and conditions of the Creative Commons Attribution (CC BY) license (https://creativecommons.org/licenses/by/4.0/).
Share and Cite
Hannich, M.J.; Abdullah, M.R.; Budde, K.; Petersmann, A.; Nauck, M.; Dressel, A.; Süße, M. A New Laboratory Workflow Integrating the Free Light Chains Kappa Quotient into Routine CSF Analysis. Biomolecules 2022, 12, 1690. https://doi.org/10.3390/biom12111690
Hannich MJ, Abdullah MR, Budde K, Petersmann A, Nauck M, Dressel A, Süße M. A New Laboratory Workflow Integrating the Free Light Chains Kappa Quotient into Routine CSF Analysis. Biomolecules. 2022; 12(11):1690. https://doi.org/10.3390/biom12111690
Chicago/Turabian StyleHannich, Malte Johannes, Mohammed R. Abdullah, Kathrin Budde, Astrid Petersmann, Matthias Nauck, Alexander Dressel, and Marie Süße. 2022. "A New Laboratory Workflow Integrating the Free Light Chains Kappa Quotient into Routine CSF Analysis" Biomolecules 12, no. 11: 1690. https://doi.org/10.3390/biom12111690