Article

Transitional Strength under Plasma: Precise Estimations of Astrophysically Relevant Electromagnetic Transitions of Ar7+, Kr7+, Xe7+, and Rn7+ under Plasma Atmosphere

1
Department of Physics, Vidyasagar University, Midnapore 721102, India
2
Department of Physics, University of Haifa, Haifa 3498838, Israel
3
Haifa Research Center for Theoretical Physics and Astrophysics, University of Haifa, Haifa 3498838, Israel
4
Department of Physics, Indian Institute of Technology Kharagpur, Kharagpur 721302, India
*
Author to whom correspondence should be addressed.
Atoms 2023, 11(6), 87; https://doi.org/10.3390/atoms11060087
Submission received: 26 March 2023 / Revised: 9 May 2023 / Accepted: 16 May 2023 / Published: 25 May 2023

Abstract

:

Highlights

What are the main findings?
  • Atomic spectroscopy for Ar7+, Kr7+, Xe7+, and Rn7+ ions with high accuracy.
  • Plasma screened ionization potential, atomic transition amplitudes and rates.
  • Ionisation potential depression parameters.
What is the implication of the main finding?
  • Properties of the astrophysical medium.
  • Properties of laboratory plasma.

Abstract

The growing interest in atomic structures of moderately stripped alkali-like ions in the diagnostic study and modeling of astrophysical and laboratory plasma makes an accurate many-body study of atomic properties inevitable. This work presents transition line parameters in the absence or presence of plasma atmosphere for astrophysically important candidates Ar7+, Kr7+, Xe7+, and Rn7+. We employ relativistic coupled-cluster (RCC) theory, a well-known correlation exhaustive method. In the case of a plasma environment, we use the Debye Model. Our calculations agree with experiments available in the literature for ionization potentials, transition strengths of allowed and forbidden selections, and lifetimes of several low-lying states. The unit ratios of length and velocity forms of transition matrix elements are the critical estimation of the accuracy of the transition data presented here, especially for a few presented for the first time in the literature. We do compare our findings with the available recent theoretical results. Our reported data can be helpful to the astronomer in estimating the density of the plasma environment around the astronomical objects or in the discovery of observational spectra corrected by that environment. The present results should be advantageous in the modeling and diagnostics laboratory plasma, whereas the calculated ionization potential depression parameters reveal important characteristics of atomic structure.

1. Introduction

Barlow et al. [1] first observed noble gas molecules in the interstellar medium. The other detections of noble gas elements, either in diatomic [2,3,4,5] or ionic forms [6] in space at UV and IR spectra, motivate further observations of these species in the universe. It is well known that the atomic and spectroscopic processes are valuable diagnostics for plasma atmosphere in the laboratory or Astronomy. Noble gas atoms are known to be chemically inactive and require high energy to ionize. However, once ionized, their reaction rates are rather fast. Over the years, spectroscopic properties of ionized noble gas atoms have become popular, and observers have started to detect them in space [7]. On the other hand, alkali-like ions have emerged as the standard test beds for detailed investigation of current relativistic atomic calculations due to their adequately simple but highly correlated electronic structures [8,9,10,11,12]. Accurate theoretical and experimental determinations of the transition line parameters and excited-state lifetimes of highly stripped ions are collaborative with the astronomer to investigate dynamics, chemical compositions, opacity, density, and temperature distributions of the distant galaxy [13], planetary nebulae, and even the entire interstellar medium [14,15,16,17,18,19,20,21,22,23,24]. Furthermore, one requires the accurate atomic data of different isotopes of noble gas elements to understand the production of heavy elements in the stellar medium by radiative r- and s-processes [25,26]. The data of energy spectra of moderate to high-stripped ions are required for precise astrophysical and laboratory plasma modeling. All these physical facts and figures motivate us to investigate the transition line parameters and lifetimes of septuple ionized astrophysically pertinent inert gases, such as Ar 7 + , Kr 7 + , Xe 7 + , and Rn 7 + .
In the series, Ar 7 + is well studied in the literature. Berry et al. [27] observed 74 lines of Ar 7 + using the beam-foil technique. In 1982, Striganov and Odintsova [28] published the observed lines of Ar + through Ar 8 + . The authors of [29,30,31] applied the multi-configuration Dirac–Fock (MCDF) method to calculate the autoionization spectrum, energy levels, transition rates, oscillator strengths, and lifetimes of Ar 7 + . Saloman [32] identified the energy spectra of Ar + to Ar 17 + , which he studied from the year 2006 to 2009, employing beam foil Spectroscopy (BFS), an electron beam ion trap (EBIT), laser-excited plasmas, fusion devices, astronomical observations, and ab initio calculations with quantum electrodynamic corrections.
Similarly, krypton ion spectra were detected in the interstellar medium [33,34], the galactic disc [35], and the planetary nebulae [36]. Fine structure intervals, fine structure inversions, and core-polarization study of the Kr 7 + ion were performed by different groups [37,38,39] including third-order many-body perturbation theory and Møller–Pleset perturbation theory [40,41] for the energy levels.
It is found that Cu I isoelectronic sequence ions are prominent impurities at high-temperature magnetically confined plasmas [42], and their emission spectra are observed under the spark sources [43,44,45,46] of the laser-produced plasma [47,48] and in the beam-foil excitations [49,50,51]. The abundance of photospheric lines of trans-iron group elements in the emission spectra of the white dwarfs opens a new way of studying their radiative transfer mechanism [52]. The presence of the spectral lines of Cu-like ions motivates more accurate determination of atomic data of the radiative properties of these ions for modeling the chemical abundances. These studies are essential for deducing the stellar parameters necessary to investigate the environmental condition of the white dwarfs. There are studies of electronic properties for Xe 7 + using various many-body methods [53,54,55,56,57]. Dimitrijevc et al. [24] identified the importance of Stark broadening at the spectral lines observed in extremely metal-poor halo PNH4-1 in primordial supernova [58]. However, we study Ar + 7 , Kr 7 + , and Xe 7 + here again to mitigate the lack of all-order many-body calculations or precise experiments and to estimate their spectroscopic properties under a plasma environment. Recently, one of the present authors [59] studied Xe 7 + exclusively as a single valance system without the plasma screening effect.
Unlike other noble gas ions, studies of radon ions are rare. However, there are a few many-body calculations on Rn + [60] and Rn 2 + [61]. The observation of several forbidden lines of Kr and Xe ions in the planetary nebula NGC 7027 was reported recently [62]. For Rn 7 + , only Migdalek [63] computed a few energy levels and oscillator strengths of allowed transitions using the Dirac–Fock method corrected by the core-polarisation effect.
The aim of this paper is to estimate (a) energies of the ground and low-lying excited states, (b) the oscillator strengths of electromagnetically allowed transitions, (c) transition probabilities of the forbidden transitions, and (d) lifetimes for a few excited states of Ar 7 + , Kr 7 + , Xe 7 + , and Rn 7 + using the relativistic coupled-cluster (RCC) method [64,65,66]. The accuracies of the RCC calculations are well established by our group for different applications [67,68,69,70,71,72,73,74,75,76]. The all-order structure of electron correlation in the RCC theory has been elaborated in our earlier paper [77] and the review article by Bartlett [78]. Our special effort here is to study the plasma screening effect on the radiative transition parameters. It is obvious that the nuclear attraction to the bound electrons of atoms or ions immersed in plasma is screened by the neighboring ions and the free electrons. The essential feature to note is that the electron correlation of atomic systems in this environment is remarkably different from their corresponding isolated candidate. Therefore, the screening estimations on the transition parameters play a crucial role in the precise diagnostics of plasma temperature and density in the emitting region. In the plasma environment, the ionization potentials decrease gradually with the increasing strength of plasma screening [79] until they become zero at some critical parameter of plasma. Beyond these critical values of plasma, the states become a continuum state. The corresponding ionization potential beyond which instability occurs is known as ionization potential depression (IPD) according to the Stewart–Pyatt (SP) model [80]. Accurate determination of the IPD can infer much useful information about the plasma atmosphere, such as providing the proper equation of the state, estimating the radiate opacity of stellar plasma, internal confinement fusion plasma, etc. We have investigated the change in spectroscopic properties of Ar 7 + , Kr 7 + , Xe 7 + , and Rn 7 + in the plasma environment.

2. Theory

Precise generation of wave functions is important for accurately estimating the atomic properties of few-electron monovalent ions presented in this paper. Here, we employ a non-linear version of the well-known RCC theory, a many-body approach which exhaustively pools together correlations. Initially, we solve the Dirac–Coulomb Hamiltonian H, satisfying the eigenvalue equation H | Φ = E 0 | Φ to generate closed-shell atomic wave function under the potential of ( N 1 ) electrons where
H = i c α i · p i + ( β i 1 ) c 2 + V n u c ( r i ) + j < i 1 r i j .
Here, α i and β are the usual Dirac matrices and V n u c ( r i ) is the potential at the site of the i-th electron due to the atomic nucleus.The rest mass energy of the electron is subtracted from the energy eigenvalues. The last term corresponds to the Coulomb interaction between the i-th electron and j-th electron. A single valence reference state for the RCC calculation is generated by adding a single electron in the v-th orbital following Koopman’s theorem [81]. In RCC formalism, the single valence correlated state | Ψ v is connected with the single valence reference state | Φ v as
| Ψ v = e T { 1 + S v } | Φ v , where | Φ v = a v | Φ .
The operator T deals with the excitations from core orbitals and can generate core-excited configurations from closed-shell Dirac–Fock state | Φ . Whereas, S v excites at least one electron from the valence orbital, giving rise to valence and core-valence excited configurations [64]. The operator S v can yield the valence and core-valence excited configurations with respect to the open-shell Dirac–Fock state | Φ v [69]. Here, we generate single- and double-excited correlated configurations from Equation (1). The amplitudes of these excitations are solved from the energy eigenvalue equations of the closed-shell and open-shell systems, which are H e T | Φ = E e T | Φ and H v e T | Φ v = E v e T | Φ v , respectively [82]. In the present method, these amplitudes are solved following the Jacobi iteration scheme, which is considered all-ordered. The initial guesses of the single- and double-excitation amplitudes are made consistent with the first order of the perturbation theory [83]. In the present version of RCC theory, we also consider some important triple excitations and hence the abbreviation is used RCCSD(T).
The matrix elements of an arbitrary operator can be written as
O k i = Ψ k | O ^ | Ψ i Ψ k | Ψ k Ψ i | Ψ i = Φ k | { 1 + S k } e T O ^ e T { 1 + S i } | Φ i Φ k | { 1 + S k } e T e T { 1 + S k } | Φ k Φ i | { 1 + S i } e T e T { 1 + S i } | Φ i .
The detailed derivations and explanations of the matrix elements associated with electric dipole ( E 1 ), electric quadrupole ( E 2 ), and magnetic dipole ( M 1 ) transitions can be found in the literature [84]. Emission transition probabilities (s 1 ) for the E 1 , E 2 , and M 1 from | Ψ k to | Ψ i state are [85]
A k i E 1 = 2.0261 × 10 6 λ 3 ( 2 J k + 1 ) S E 1 ,
A k i E 2 = 1.12 × 10 22 λ 5 ( 2 J k + 1 ) S E 2 ,
a n d A k i M 1 = 2.6971 × 10 11 λ 3 ( 2 J k + 1 ) S M 1 .
where, λ is in cm and S is the square of the transition matrix elements of O (corresponding transition operator) in atomic unit of e 2 a 0 2 (e is the charge of an electron and a 0 is the Bohr radius). The oscillator strength for the E 1 transition is related to the corresponding transition probability (s 1 ) with the following equation [86]
f k i o s c i = 1.4992 × 10 16 A k i g k g i λ 2 ,
where g k and g i are the degeneracies of the final and initial states, respectively. The lifetime of the k-th state is calculated by considering all transition probabilities to the lower energy states (i-th) and is given by
τ k = 1 i A k i .
In order to incorporate the plasma screening effect on the atomic spectroscopic properties, the Dirac–Coulomb potential takes the form as
H eff D = H + V eff D ( r i ) .
Here, V eff D ( r i ) is the effective potential of the nucleus on the i-th electron due to the presence of the plasma environment. The Debye–Hückle potential is considered to examine the effect of the screening of the nuclear coulomb potential due to the presence of ions and free electrons in plasma [87,88]. In the case of a weekly interacting plasma medium, the effective potential experienced by the i-th electron is given as
V eff D ( r i ) = Z e μ r i r i .
The nuclear charge Z and the Debye screening parameter μ are related to the ion density n i o n and plasma temperature T through the following relation
μ = 4 π ( 1 + Z ) n i o n K B T 2 ,
where, k B is the Boltzmann constant. Therefore, a given value of μ represents a range of plasma conditions with different ion densities and temperatures.

3. Results and Discussions

The single-particle Dirac–Fock (DF) wavefunctions are the building blocks of the RCC calculations yielding the many-electron correlation energies and correlated wavefunctions. We calculate the bound Dirac–Hartree–Fock orbitals as accurately as possible using a sophisticated numerical approach, GRASP92 [89]. Further, we apply the basis-set expansion technique [90] in the self-consistent field approach to obtain the Gaussian-type DF orbital (GTO) used in the RCC calculations. The radial part of each basis function has two parameters, α 0 , and β , as exponents [91] to be optimized. The parameters are required to optimize due to the finite size of the basis set. The exponent parameters are optimized compared to the DF bound orbitals obtained from GRASP92, discussed in detail in our old papers [12,66]. In the basis optimization method, we consider 33, 30, 28, 25, 21, and 20 basis functions for s, p, d, f, g, and h symmetries, respectively. This basis set is considered for all the ions. However, the choice of the active orbitals in the RCC calculation relies on the convergence of the correlation contribution to the closed-shell energy with the increasing number of the orbitals [66,92]. Therefore, the active orbitals for the converged correlation contribution to the closed-shell energy are found to be distinct for different ions investigated in this work.
In this article, we calculate the ionization potential of Ar 7 + , Kr 7 + , Xe 7 + , and Rn 7 + using the RCC method and compare them in Table 1 with the results published in the National Institute of Standards and Technology (NIST) [93] wherever available. The NIST estimations are considered to have the best accuracy. We find that our calculated ground state energies of Ar 7 + , Kr 7 + , and Xe 7 + are in excellent agreement with NIST results, and deviations are estimated to be 0.01 % , 0.45 % , and 0.03 % , respectively. Table 1 presents the ionization potential of the low-lying excited states of these ions with average deviations around 0.08 % , 0.42 % , and 0.30 % , respectively. In these cases, the maximum difference is 0.23 % and occurred for the 5 p 3 / 2 state of Ar 7 + , 0.60 % for 5 g 7 / 2 , 9 / 2 of Kr 7 + , and 1.2 % for 6 d 3 / 2 , 5 / 2 of Xe 7 + .
Our calculated energies agree well with estimations by Fischer et al. [31], who computed energy levels of Ar 7 + using the core polarization effect on the Dirac–Hartree–Fock (CP-DHF) theory. Cheng and Kim [37] tabulated the energy levels of Kr 7 + from the relativistic Hartree–Fock (RHF) calculations. As expected, our RCC calculated results are found to be in better agreement with the NIST values. For Rn 7 + , we have not found any experimental measurement in the literature nor NIST compiled values. Only one theoretical calculation based on the CP-DHF method by [63] is available with the average deviation of IP being 0.66 % from our calculations.
The percentage of electron correlation correction, i.e., ( RCC - DF ) × 100 % DF in IP of the ground state monotonically increases from Ar 7 + to Rn 7 + with the values 0.39 % , 0.52 % , 1.81 % , and 1.87 % , respectively.
Now, we investigate the impact of the plasma screening potential on the energy levels of the considered ions. Table 1 shows that IP monotonically decreases with the increase in the μ value. The bold values for each ion in the table represent the limiting case beyond which the system becomes unbound. 
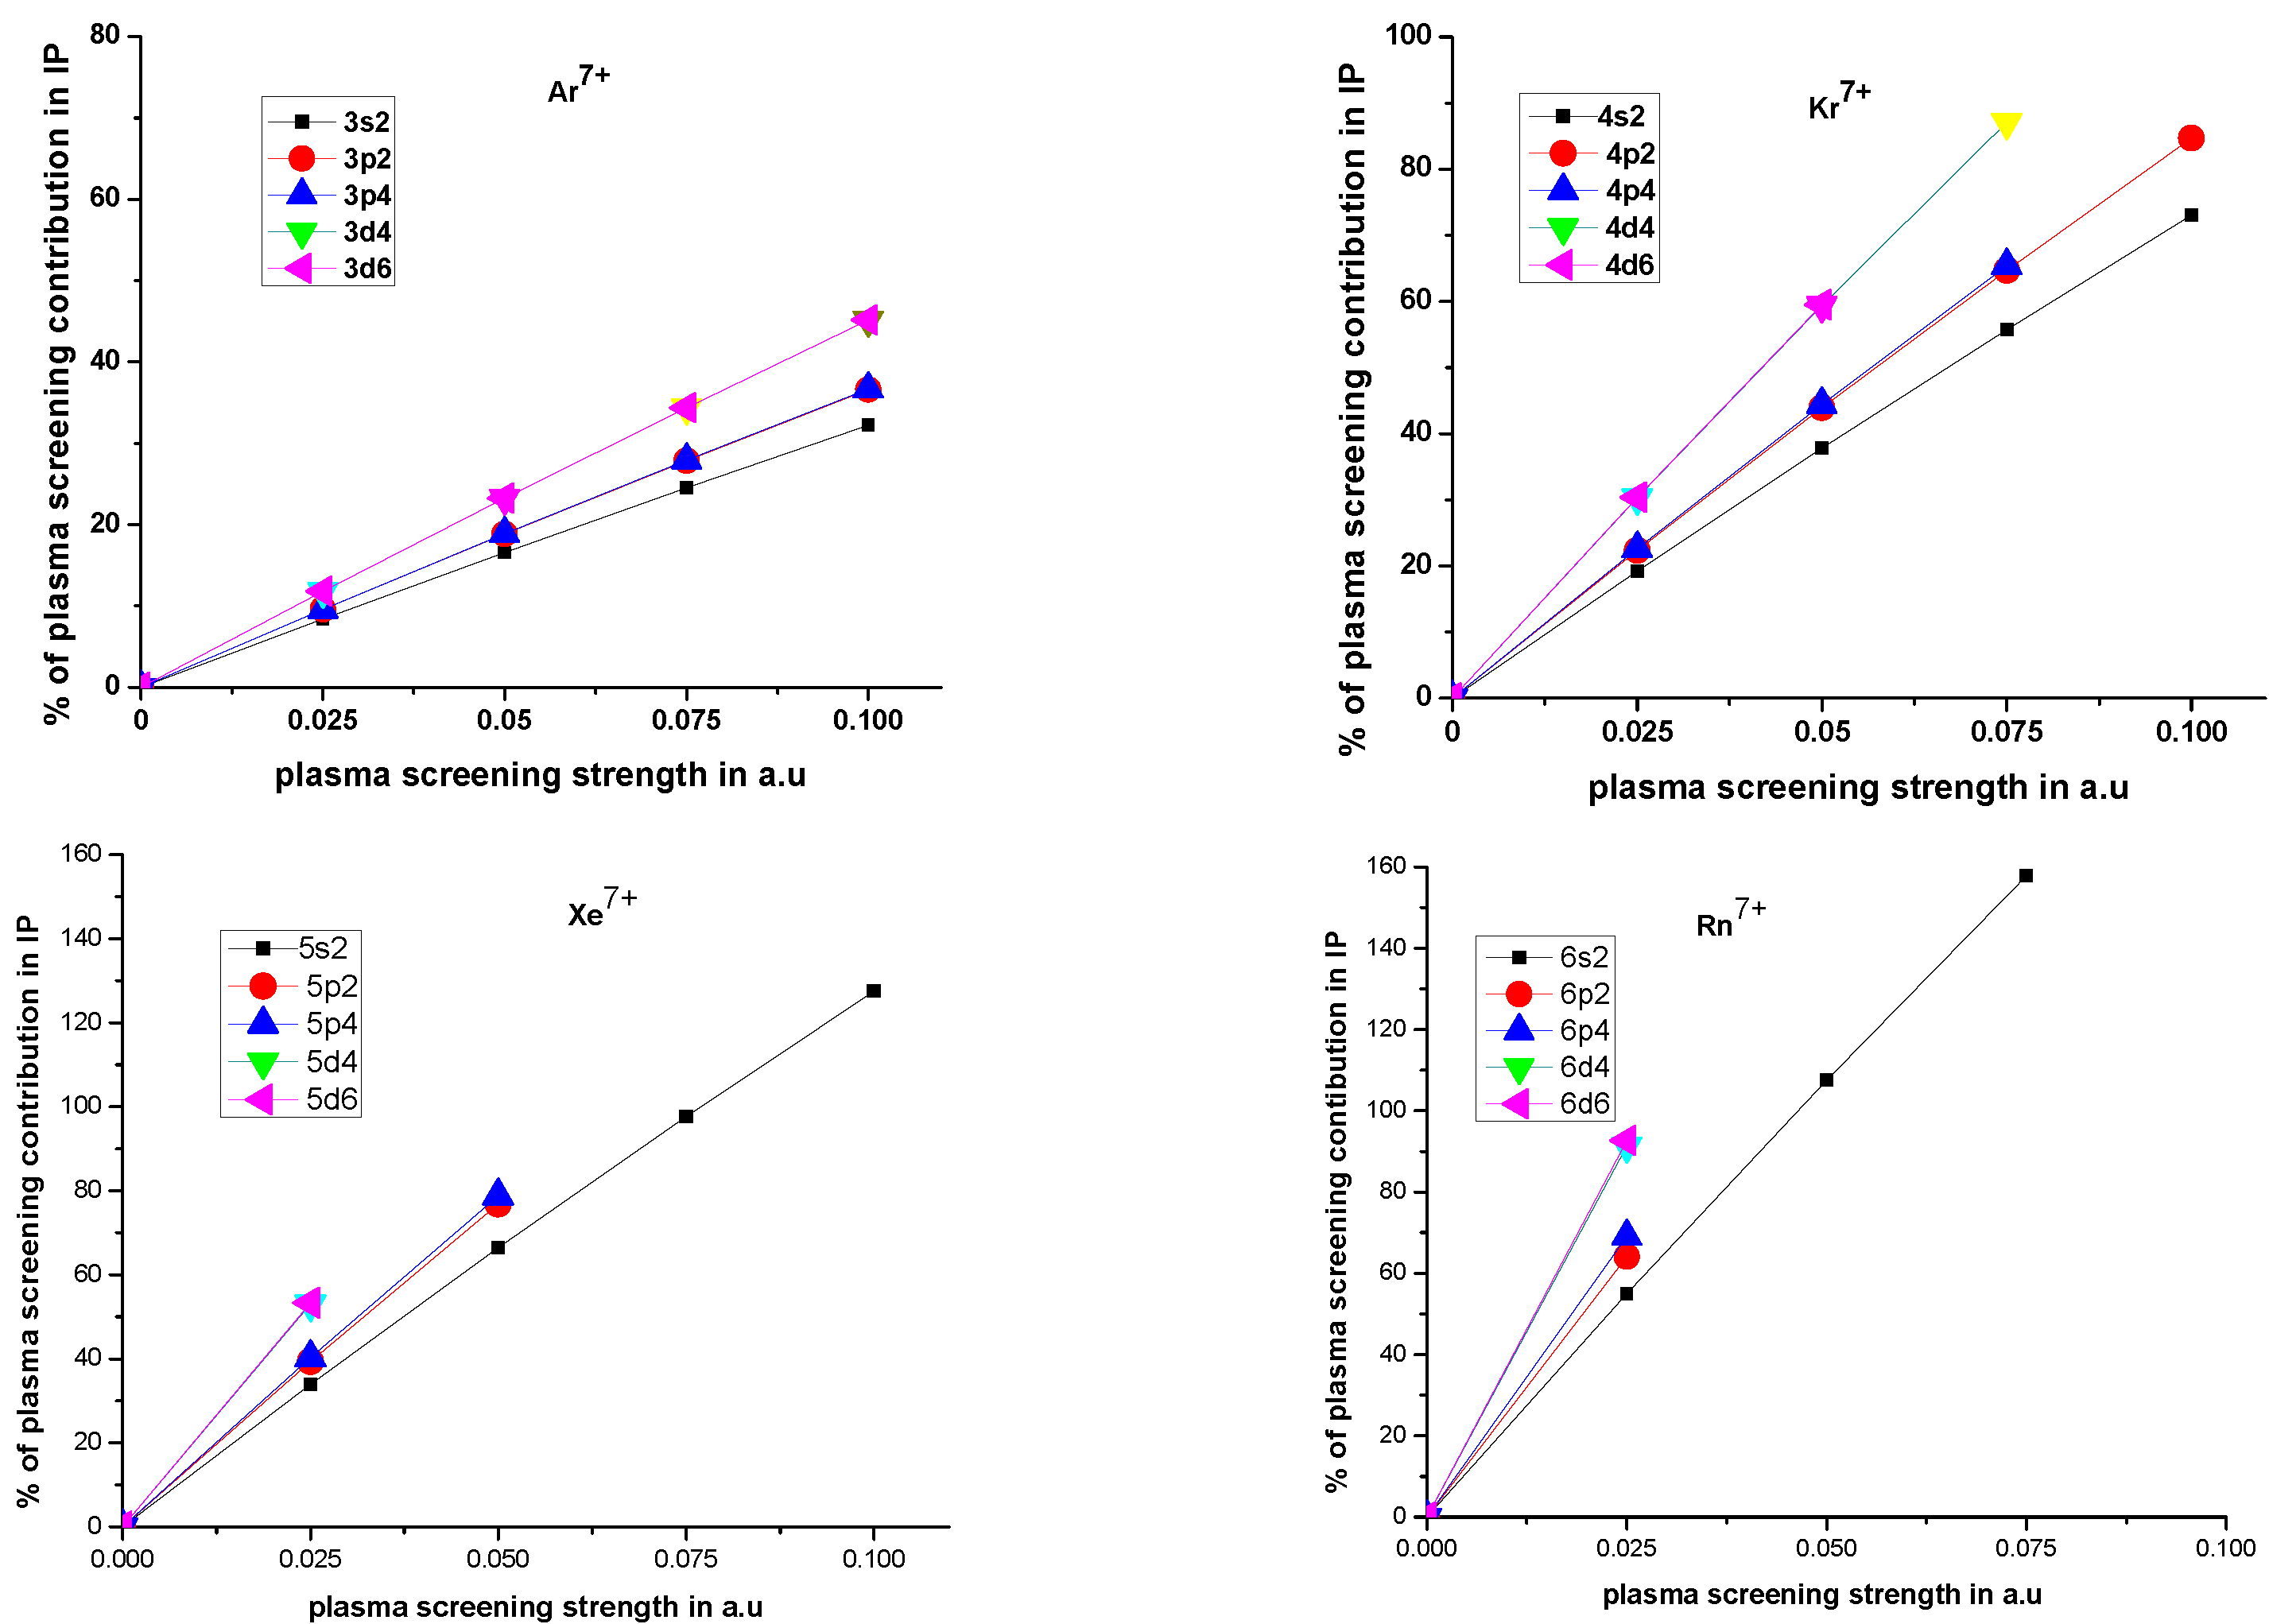
Figure 1 presents the plasma screening contribution in IP for a few low-lying states, such as ground state S 1 / 2 , excited P 1 / 2 , 3 / 2 , and D 3 / 2 , 5 / 2 states of Ar 7 + , Kr 7 + , Xe 7 + , and Ra 7 + ions. The panels of the figure show the plasma screening contribution increases from the ground to higher excited states, as the latter states are less bound by the Coulomb attraction. For Xe 7 + and Rn 7 + , we could plot the effect up to a certain value of μ as most of the states become continuum states beyond that. We observe that the plasma screening effect is practically strong for fine structure levels for Ar 7 + and Kr 7 + ions and weak for Xe 7 + , and Ra 7 + ions.
We present the electric dipole matrix elements for the ions in the plasma medium in Table 2. The table also displays our computed DF values of the matrix elements to reveal the correlation contributions. The separate presentation of the DF and RCC values over the span of the plasma screening parameter, μ 
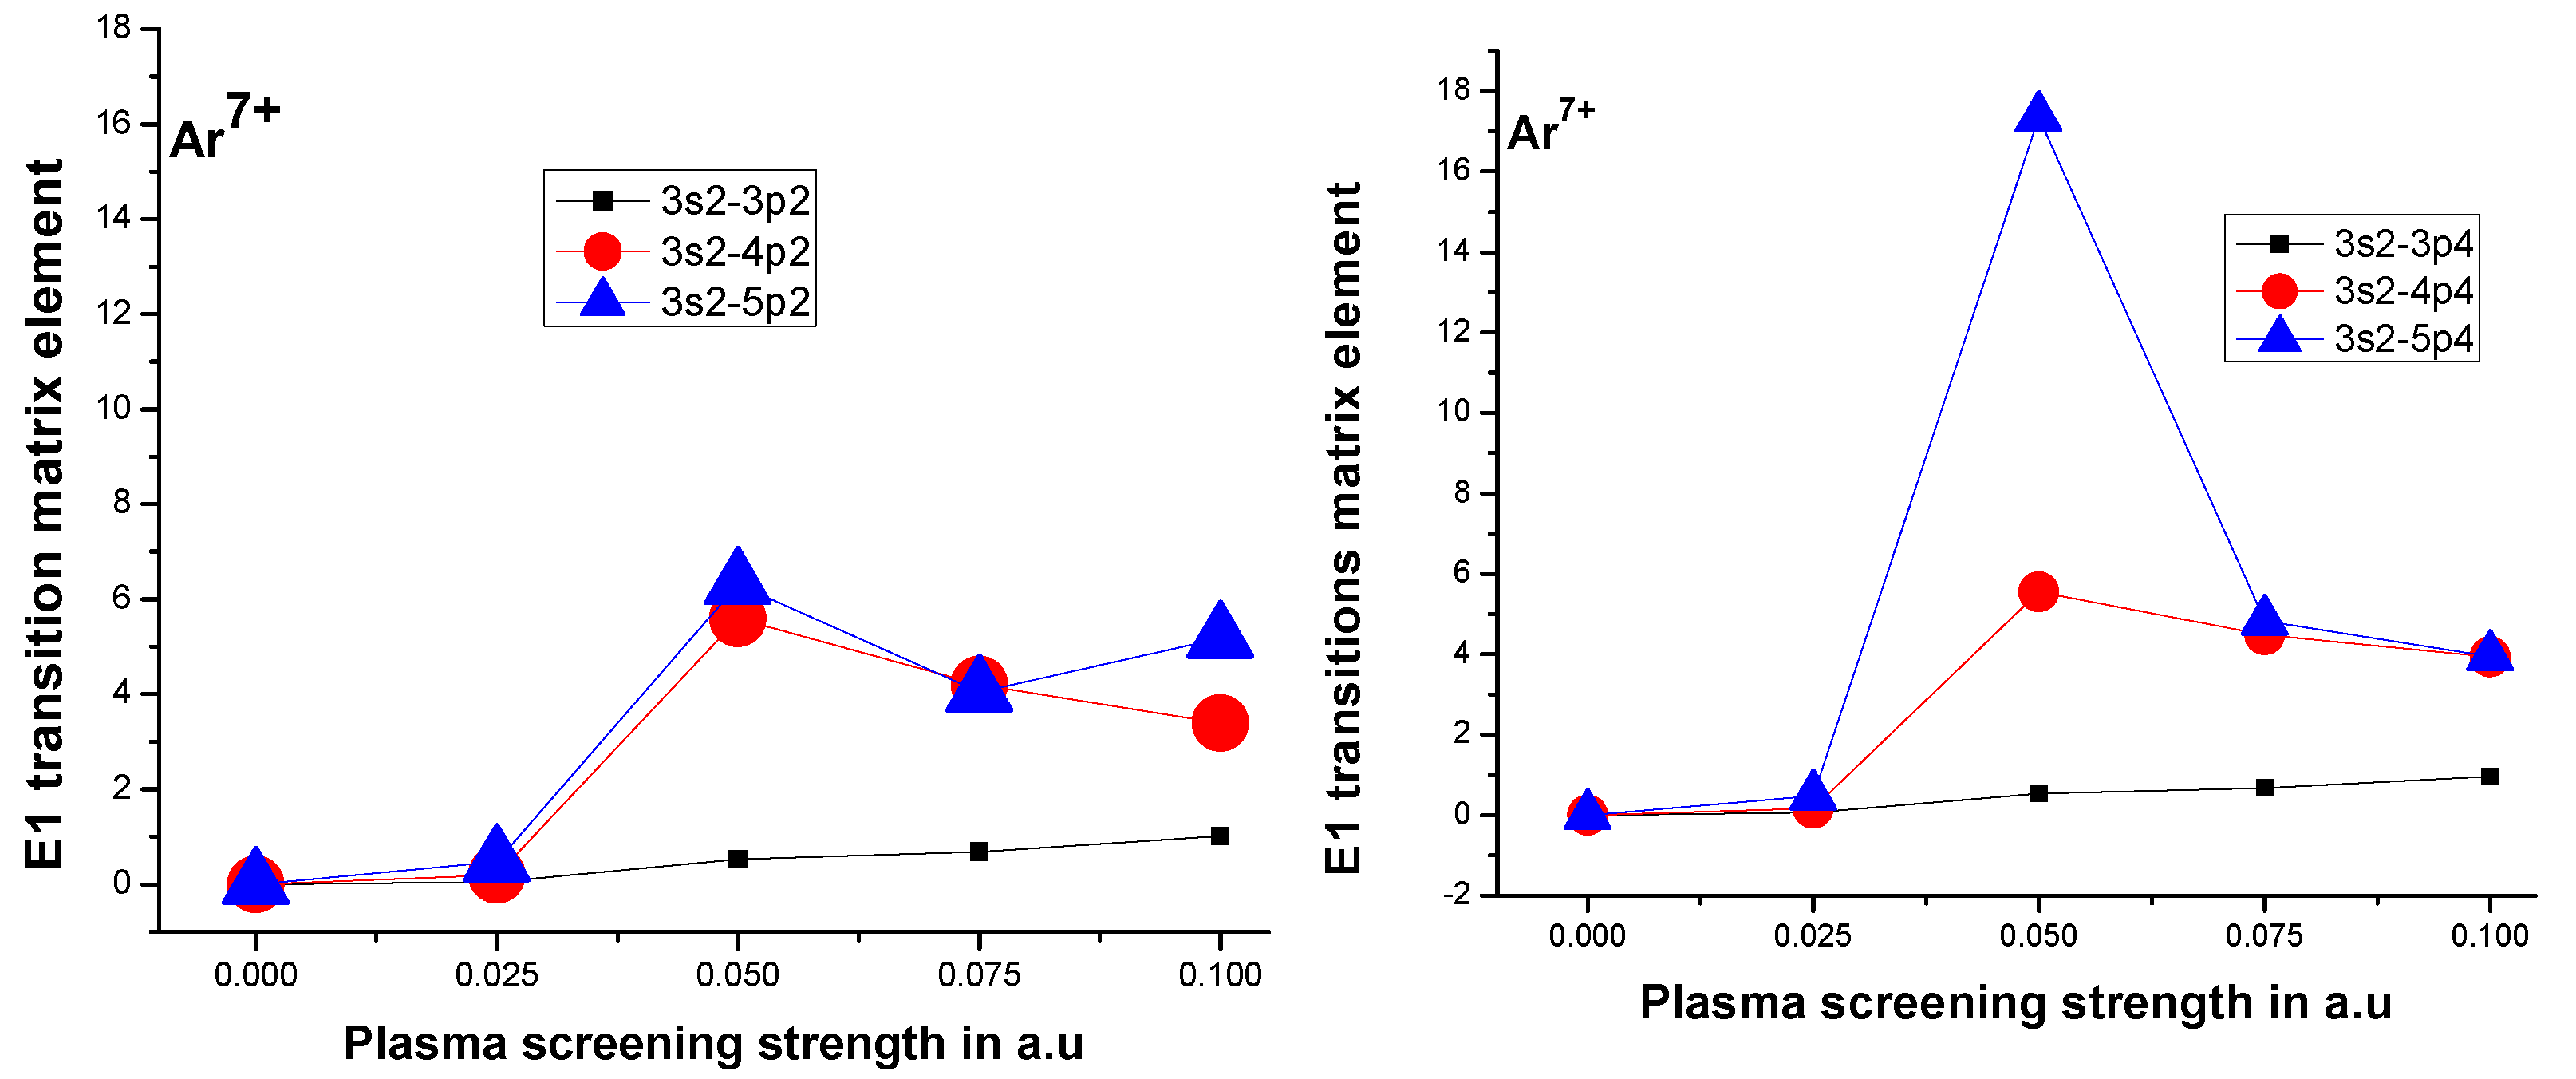
, in the table is an intentional move. Here, we want to highlight that the plasma screening impacts the DF and the RCC correlation parts differently. In the case of Ar 7 + , the average changes in the matrix element due to the increasing values of the plasma screening parameter are less than 1%. However, Figure 2 shows significant changes for 3 s 1 / 2 4 p 1 / 2 , 3 / 2 and 3 s 1 / 2 5 p 1 / 2 , 3 / 2 for finite values of μ , especially for μ = 0.05 . This is true for any n 2 S 1 / 2 n 2 P 1 / 2 , 3 / 2 of this ionic series. However, apart from such a few transitions, the plasma effects lie between 1% and 2% for most of the other transitions in the series. Table 2 shows that the average correlations (for the non-plasma environment) in the transition amplitudes for Ar 7 + , Kr 7 + , Xe 7 + , and Rn 7 + are 0.3858 % , 4.0831 % , 7.6074 % , and 11.6379 % apart from the 4 d 3 / 2 5 f 5 / 2 transition where the correlation is 67.11 % .
For observational astronomy and laboratory spectroscopy, we present a tabulation of a list of our computed oscillator strengths ( f RCC ) of E 1 transitions along with their previously reported theoretical and experimental values in Table 3. Most of the transitions fall in the far and mid-UV regions of the electromagnetic spectrum. f RCC is calculated using the RCC transition amplitudes in length gauge [94] form presented in Table 2 and the NIST [93] wavelengths, wherever available (in the case of Rn 7 + , our computed RCC wavelengths are used). The ratios between the length and velocity gauge amplitudes of our calculated E 1 transitions are also displayed in table to show the accuracy of our RCC wavefunctions, which is close to unity for all the cases, confirming the accuracy of our correlated atomic wavefunctions. However, we find that the ratio is almost two for 2 F 2 D transitions of Xe 7 + and Rn 7 + . A point to note is that this disagreement is also available in the ratio at the DF level, where we also employed the numerically accurate GRASP92 Code [89]. One of the reasons for this outcome is due to the strong correlation effect from the d- and f-states, as so in similar alkali systems [95]. In addition, the consistency of the accuracy of our calculations can be drawn from the approximate consistency of the ratios 3:2:1 among the transition matrix estimations of 2 P 3 / 2 2 D 5 / 2 : 2 P 1 / 2 2 D 3 / 2 : 2 P 3 / 2 2 D 3 / 2 [96].
The E 1 Oscillator strengths for Ar 7 + are well studied in the literature [31,97,98,99,100,101,102,103,104,105], and they are in good agreement with our estimations based on the correlation exhaustive RCC method. Table 3 shows that the same is true for Kr 7 + . For Ar 7 + , our calculations for f RCC are almost as accurate as those found from other sophisticated theoretical approaches, such as the relativistic many-body perturbation theory [102], and for the most latest theoretical results employing the multiconfigurational Dirac–Hartree–Fock approximation [31]. To the best of our knowledge, in the case of Kr 7 + , we could not find any correlation-exhaustive many-body result of E 1 transition. There have been experiments, mostly using beam-foil experiments, on the E 1 transition from the ground state to the first excited states of Ar 7 + [97], and Kr 7 + [49,50,51,106,107]. Our estimations are well within the uncertainty limit of the latest experiments. We also see that some of the old calculations either underestimate or overestimate the oscillator strength values due to non-appropriate considerations of correlations and relativistic effects.
Table 3. Our RCC oscillator strengths of electric dipole transitions. We compare our results with other estimations available in the recent literature (experimental endeavors are highlighted with “exp” subscript). Our results (“RCC”) are obtained using the RCC calculations, except NIST wavelengths are used for μ = 0 wherever available. Transition states are designated with the outermost orbital followed by ( 2 J + 1 ) of the state. Values at the parenthesis in the second column are ratios between length- and velocity-gauged dipole matrix elements.
μ = 0 μ = 0.025 μ = 0.050 μ = 0.075 μ = 0.1
Transition RCC Other
Ar 7 +
3s2 → 3p20.1857 (0.99) 0.183 ( 4 ) e x p a 1 , 0.188 b 1 ,0.18590.18750.18780.1887
0.193 c 1 , 0.186 d 1 , 0.1864 e 1 ,
0.185 f 1 , i 1 , 0.187 g 1 , 0.196 h 1
3s2 → 3p40.3795 (0.99) 0.398 ( 10 ) e x p a 1 , 0.385 b 1 , 0.394 c 1 ,0.38040.38370.38400.3854
0.381 d 1 , g 1 , 0.3811 e 1 , 0.379 f 1 ,
0.401 h 1 , 0.378 i 1
3s2 → 4p20.0418 (1.00) 0.0414 b 1 , 0.0401 c 1 , 0.0376 d 1 ,0.04160.04620.04450.0432
0.0415 e 1 , 0.0385 h 1 , 0.0432 i 1
3s2 → 4p40.0803 (1.00) 0.0829 b 1 , 0.0766 c 1 , 0.0751 d 1 ,0.07930.08770.08590.0838
0.0798 e 1 , 0.0739 h 1 , 0.0836 i 1
3s2 → 5p20.0143 (0.98) 0.0146 b 1 , e 1 0.01410.01230.01490.0121
3s2 → 5p40.0271 (1.00) 0.0292 b 1 , 0.0284 e 1 0.02700.01840.02910.0278
4s2 → 4p20.2810 (1.01) 0.2821 e 1 , 0.2824 i 1 0.28290.28710.28160.2777
4s2 → 4p40.5736 (1.01) 0.5755 e 1 , 0.5759 i 1 0.57820.58830.57480.5645
3p2 → 4s20.0880 (1.00) 0.0876 e 1 , 0.0884 i 1 0.08790.07650.07630.0760
3p4 → 4s20.0900 (1.01) 0.0896 e 1 , 0.08947 i 1 0.08990.07800.07830.0783
3p2 → 5s20.0163 (1.01) 0.0161 e 1 0.01630.01620.01280.0154
3p4 → 5s20.0166 (1.01) 0.0164 e 1 0.01660.02020.01330.0130
3p2 → 3d40.5074 (0.96) 0.532 c 1 , 0.5097 e 1 , 0.5074 g 1 0.50910.51070.51150.5180
0.508 i 1 , 0.47 j 1
3p4 → 3d40.0502 (0.96) 0.0527 c 1 , 0.0504 e 1 , 0.0501 g 1 0.05030.05050.05050.0512
0.0502 i 1 , 0.046 j 1
3p4 → 3d60.4556 (0.96) 0.475 c 1 , 0.4539 e 1 , 0.4517 g 1 0.45340.45420.45490.4571
0.452 i 1 , 0.42 j 1
3p2 → 4d40.1326 (1.05) 0.1310 e 1 , 0.1344 i 1 0.13120.12910.12750.1024
3p4 → 4d40.0137 (1.03) 0.0135 e 1 , 0.0136 i 1 0.01350.01310.01320.0109
3p4 → 4d60.1226 (1.03) 0.1212 e 1 , 0.1228 i 1 0.12140.11800.11870.1159
4p2 → 4d40.8067 (0.95) 0.8085 i 1 0.80700.80200.79300.8035
4p4 → 4d40.0798 (0.98) 0.0796 i 1 0.07970.07980.07860.0787
4p4 → 4d60.7192 (0.98) 0.7177 i 1 0.71850.72150.70790.7009
3d4 → 4p20.0663 (0.98) 0.0657 e 1 , 0.0663 i 1 0.06630.06950.06300.0678
3d4 → 4p40.0130 (1.00) 0.0129 e 1 , 0.0131 i 1 0.01300.01330.01240.0134
3d6 → 4p40.0784 (0.97) 0.0778 e 1 , 0.0786 i 1 0.07840.07620.07470.0720
3d4 → 4f60.8812 (1.00) 0.8776 i 1 0.87770.87020.85840.8762
3d6 → 4f60.0424 (1.00) 0.0418 i 1 0.04180.04150.04090.0401
3d6 → 4f80.8397 (1.00) 0.8360 i 1 0.83640.82970.81490.7796
Kr 7 +
4s2 ⟶ 4p20.2543 (1.00) 0.25 ( 1 ) e x p a 2 , f 2 , 0.24 ( 2 ) e x p b 2 , 0.246 c 2 ,0.26330.27180.27050.2673
0.2781 d 2 , 0.278 e 2 , 0.28 g 2 ,
0.2578 h 2 , 0.220 i 2 , 0.2448 j 2
4s2 ⟶ 4p40.5466 (0.97)0.53 ( 2 ) e x p a 2 , 0.47 ( 4 ) e x p b 2 , 0.526 c 2 ,0.56610.58250.58330.5829
0.5965 d 2 , 0.60 e 2 , 0.59 ( 9 ) e x p f 2 ,
0.59 g 2 , 0.554 h 2 , 0.473 i 2
0.5265 j 2
4s2 ⟶ 5p20.0227 (1.01) 0.0176 d 2 0.02060.0191
4s2 ⟶ 5p40.0354 (1.00) 0.0265 d 2 0.03130.0275
4p2 → 5s20.1281 (1.02) 0.1212 d 2 0.12610.1187
4p4 → 5s20.1392 (1.02) 0.1321 d 2 0.13510.1302
4p2 → 4d40.9888 (1.00) 1.057 d 2 1.05621.05831.1068
4p4 → 4d40.0972 (1.00) 0.1038 d 2 0.09980.10150.1045
4p4 → 4d60.8796 (1.00) 0.9395 d 2 0.90510.92000.9480
4p2 → 6s20.0237 (1.06) 0.0208 d 2 0.02270.0181
4p4 → 6s20.0253 (1.07) 0.0220 d 2 0.02430.0197
4d4 → 4f61.0811 (0.98) 1.126 d 2 1.08761.0890
4d6 → 4f60.0514 (0.98) 0.0535 d 2 0.05080.0509
4d6 → 4f81.0277 (0.98) 1.0700 d 2 1.03261.0340
4d4 → 5p20.1828 (1.00) 0.1784 d 2 0.17810.1697
4d4 → 5p40.0352 (1.03) 0.0344 d 2 0.03450.0329
4d6 → 5p40.2135 (1.00) 0.2088 d 2 0.20780.1984
4d4 → 5f60.0001 (1.09) 0.0001 d 2 0.0005
4f6 → 5d40.1647 (0.98) 0.1638 d 2 0.15820.1485
4f6 → 5d60.0117 (0.98) 0.0117 d 2 0.01130.0106
4f8 → 5d60.1759 (0.98) 0.1750 d 2 0.16890.1582
4f6 → 5g81.2447 (1.00) 1.261 d 2 1.2185
4f8 → 5g80.0346 (1.00) 0.0350 d 2 0.0339
4f8 → 5g101.2103 (1.00) 1.226 d 2 1.1841
5p2 → 5d41.4023 (1.00) 1.401 d 2 1.38251.3467
5p4 → 5d40.1393 (1.01) 0.1383 d 2 0.13690.1335
5p4 → 5d61.2582 (1.01) 1.249 d 2 1.23911.2062
4d6 → 5f60.00002 (0.28) 0.00003 d 2 0.00001
4d6 → 5f80.0003 (0.29) 0.0007 d 2 0.0003
5p2 → 6s20.2322 (1.07) 0.2023 d 2 0.2229
5p4 → 6s20.2529 (1.08) 0.2179 d 2 0.2422
Xe 7 +
5s2 → 5p20.2436 (1.01) 0.294 a 3 , 0.234 b 3 , 0.242 c 3 0.24710.2482
0.253 d 3 , 0.237 e 3 , 0.237 f 3
0.232 g 3 , 0.223 h 3 , 0.232 i 3
5s2 → 5p40.5724 (1.01) 0.697 a 3 , 0.550 b 3 , 0.569 c 3 0.58010.5816
0.596 d 3 , 0.560 e 3 , 0.563 f 3 ,
0.543 g 3 , 0.522 h 3 , 0.537 i 3
5p2 →5d41.0195 (1.02) 1.189 a 3 , 0.977 b 3 , 1.020 c 3 1.0204
1.025 d 3 , 1.003 e 3 , 1.000 f 3
1.057 i
5p4 →5d40.0992 (1.02) 0.095 b 3 , 0.089 c 3 , 0.099 d 3 0.0993
0.097 e 3 , 0.097 f 3 , 0.095 i 3
5p4 →5d60.9064 (1.02) 0.523 a 3 , 0.868 b 3 , 0.904 c 3 0.9066
0.907 d 3 , 0.889 e 3 , 0.886 f 3
0.875 i 3
5p2 → 6s20.1539 (1.05) 0.160 c 3 , 0.156 d 3 , 0.155 e 3 0.1539
0.153 f 3 , 0.199 i 3
5p4 → 6s20.1816 (1.05) 0.188 c 3 , 0.186 d 3 , 0.184 e 3 0.1817
0.182 f 3 , 0.186 i 3
4f6 → 5d40.0577 (2.35) 0.130 a 3 , 0.058 b 3 , 0.060 i 3 0.0560
4f6 → 5d60.0043 (2.12) 0.0044 b 3 0.0042
4f8 → 5d60.0651 (2.19) 0.075 a 3 , 0.065 b 3 , 0.068 i 3 0.0633
4f6 → 5g80.3890 (1.02) 0.3646 b 3 , 0.354 i 3
4f8 → 5g80.0109 (1.02) 0.0102 b 3
4f8 → 5g100.3826 (1.02) 0.3595 b 3 , 0.343 i 3
5d4 → 5f61.1437 (1.04) 1.099 i 3 1.1259
5d6 → 5f60.0550 (1.04) 0.052 i 3 0.0813
5d6 → 5f81.0981 (1.04) 1.032 i 3 1.0812
5f6 → 5g81.0583 (0.99) 1.071 i 3
5f8 → 5g80.0293 (0.99) 0.030 i 3
5f8 → 5g101.0246 (0.99) 1.035 i 3
6s2 → 6p20.4778 (1.13) 0.4921
6s2 → 6p41.0555 (1.13) 1.1260
6p2 → 6d41.6248 (1.11) 1.5953
6p4 → 6d61.4527 (1.11) 1.4249
6p4 → 6d40.1601 (1.11) 0.1566
Rn 7 +
6s2 → 6p20.2372 (1.00) 0.234 a 4 0.2379
6s2 → 6p40.6880 (1.02) 0.689 a 4 0.6922
6p2 → 7s20.1634 (1.06) 0.173 a 4
6p4 → 7s20.2472 (1.07) 0.259 a 4
6p2 →6d41.0154 (1.01) 1.059 a 4 1.0113
6p4 →6d40.1001 (1.01) 0.103 a 4 0.0999
6p4 →6d60.9234 (1.01) 0.956 a 4 0.9170
5f6 → 6d40.0660 (2.13) 0.0753 a 4 0.0578
5f8 → 6d60.0842 (1.83) 0.0981 a 4 0.0755
5f6 → 6d60.0057 (1.73) 0.0069 a 4 0.0051
5f6 → 5g80.6982 (1.00)
7s2 → 7p20.4182 (1.11) 0.414 a 4
7s2 → 7p41.1727 (1.12) 1.126 a 4
6d4 → 7p20.2940 (1.05) 0.292 a 4
6d4 → 7p40.0513 (1.04) 0.052 a 4
6d6 → 7p40.3207 (1.05) 0.33 a 4
a 1 ⇒Beam-foil technique [97]; b 1 ⇒ calculations are based on high level methods such as the R-matrix method and asymptotic techniques developed by Seaton [98]; c 1 ⇒ Single Configuration Interaction Hartree–Fock method using a pseudopotential [99]; d 1 ⇒ non-relativistic WKB approaches (Klein–Gordon dipole matrix) [100]; e 1 ⇒single configuration Dirac–Fock method [101]; f 1 ⇒relativistic many-body perturbation theory [102]; g 1 ⇒realistic model potential [103]; h 1 ⇒relativistic Hartree–Fock method [104]; i 1 ⇒multiconfiguration Dirac–Hartee-Fock approximation [31]; j 1 ⇒relativistic effective orbital quantum number [105]; a 2 ⇒jointly analyzed decay curves: beam-foil [106]; b 2 ⇒multiexponential fits: beam-foil [106]; c 2 ⇒Non-Relativistic Multi Configuration Hartree–Fock approximation [108]; d 2 ⇒ relativistic Hartree–Fock [37]; e 2 ⇒Hartree-Fock oscillator strength using the Dirac correction factor [109]; f 2 ⇒Arbitrarily Normalized Decay curve method for cascade-correction in beam-foil [107]; g 2 ⇒Hartree–Fock with relativistic correction [110]; h 2 ⇒semi-empirical Coulomb approximation [111]; i 2 ⇒model potential [112]; j 2 ⇒Hartree-Slater method [23]; a 3 ⇒RPTMP [57]; b 3 ⇒RMBPT(3) [55]; c 3 ⇒DF+CP [54]; d 3 ⇒DX+CP method with SCE model potential [54]; e 3 ⇒DX+CP method with CAFEGE model potential [54]; f 3 ⇒DX+CP method with HFEGE model potential [54]; g 3 ⇒CIDF method with integer occupation number [56]; h 3 ⇒CIDF(q) method with non-occupation number [56]; i 3 ⇒HFR+CP method [53]; a 4 ⇒relativistic core-polarization corrected Dirac–Fock method (DF+CP) [63].
Over the last two decades, a few of the low-lying E 1 transitions of Xe 7 + are estimated using core-polarization or model potential as an effective means of correlation calculations, apart from third-order perturbation calculations [55]. It is known that our RCC method is an all-order extension of many-body perturbation theory [83]. Further, it includes most of the correlation features, including core correlation, pair correlation, and higher order correlation effects [69] for a given level of excitation. For Rn 7 + , we find only one theoretical endeavor [63] using the model potential. The presence of d- and f-orbitals for Xe 7 + and Rn 7 + ions in the core makes these two ions highly correlated. Because of the large atomic number and highly stripped configurations, we expect a strong relativistic effect in their spectroscopy. Therefore, it is necessary to do relativistic ab initio correlation exhaustive calculations for them and our computations exactly mitigate that requirement. In Table 3, we also present the effect of the plasma atmosphere on the oscillator strengths for observational and laboratory spectroscopy. The oscillator strengths for μ > 0 are calculated using the E 1 matrix elements presented in Table 2 and the corresponding transition wavelengths computed from RCC theory. The table exhibits the significant effects of plasma screening parameters on the oscillator strengths.
Table 4 and Table 5 present transition probabilities for the relatively strong forbidden transitions governed by the electric quadruple ( E 2 ) and the magnetic dipole ( M 1 ) moments. Similar to oscillator strength in Table 3, here we use NIST wavelengths for the transition probability wherever available. For Rn 7 + , we use the RCC calculated transition wavelengths. We do not find any estimation of the forbidden transitions in the literature of this ionic series which fall either in the ultraviolet or in the near infra-red regions of the electromagnetic spectrum. Transitions falling in the ultraviolet region are significant in astronomical observation and plasma research [113,114,115,116]. In comparison, the infra-red transitions have applications in astronomy using space-based telescopes ([117]). Moreover, infrared spectroscopy provides major information about cool astronomical regions in space, such as interstellar medium [118] and planetary nebulae [119]. It is found that 5 p 1 / 2 4 f 5 / 2 of Kr 7 + and 5 p 1 / 2 5 p 3 / 2 of Xe 7 + emit orange and green lights, respectively, which can be used in laser spectroscopy [120,121,122,123,124].
It is found from Table 5 that the M 1 transition probability is stronger among fine-structure levels than the E 2 transition. Table 4 reveals that the maximum M 1 transition probability, A R C C M 1 , occurs for the transition 3 p 1 / 2 3 p 3 / 2 of Ar 7 + , 4 p 1 / 2 4 p 3 / 2 of Kr 7 + , 4 f 7 / 2 5 f 7 / 2 of Xe 7 + and 6 p 1 / 2 6 p 3 / 2 of Rn 7 + , and they have values of 0.17949, 8.4000, 158.33 and 1137.7, respectively. Moreover, our estimations of M 1 transition probability for the 4 f 5 / 2 4 f 7 / 2 transition of Xe 7 + has excellent agreement with the calculations using the multi-configuration Dirac–Hartree–Fock method [125,126]. Table 6 presents the lifetime of the low-lying states of this series. We compare our results with other experimental and theoretical estimations wherever available and find good agreement with the recent endeavors. We provide lifetimes of many excited states calculated for the first time in the literature to our knowledge.
Table 5. Magnetic dipole transition rate (in s 1 ) in plasma screened and unscreened medium. Note: the notation P ( Q ) in the case of transition rates means P × 10 Q . For 4 f 5 / 2 4 f 7 / 2 (Xe 7 + ), transition rates 1.9227 (−03) and 1.9277 (−03) are available in the literature (a) using the multiconfiguration Dirac–Fock method without and with Breit interaction plus the quantum electrodynamics effect, respectively.
Transitions μ = 0 μ = 0.025 μ = 0.050 μ = 0.075 μ = 0.1
Ar 7 +
3p2 → 3p41.7951 (−01)1.9857 (−01)1.9603 (−01)1.9165 (−01)1.8570 (−01)
3p4 → 4f63.7845 (−02)3.7248 (−02)3.5575 (−02)3.2958 (−02)2.9561 (−02)
3d6 → 5g81.0634 (−02)1.0124 (−02)8.8719 (−03)7.0637 (−03)
Kr 7 +
4s2→ 4d49.0675 (−03)7.2173 (−03)8.2040 (−03)6.7390 (−03)
4p2 → 4p48.4015 (00)8.2789 (00)7.9664 (00)7.4776 (00)6.8397 (00)
4d4 → 4d62.5436 (−02)3.2234 (−02)3.0177 (−02)2.7000 (−02)
5p2 → 5p44.7841 (−01)5.3517 (−01)4.6911 (−01)
5d4 → 5d61.7080 (−03)1.0904 (−03)2.2682 (−03)
Xe 7 +
5p2 → 5p45.7437 (+01)5.7875 (+01)5.3500 (+01)
5p4 → 5f66.3588 (−03)5.7557 (−03)
4f6 → 5f65.0459 (+01)4.9605 (+01)
4f6 → 5f84.9212 (−01)5.3389 (−01)
4f8 → 5f61.1142 (+01)1.0620 (+01)
4f8 → 5f81.5833 (+02)1.5517 (+02)
5d4 → 5d62.7070 (−01)2.6538 (−01)2.2900 (−01)
Rn 7 +
6p2 → 6p41.2442 (+03)1.2212 (+03)
6d4 → 6d64.5873 (00)4.1847 (00)
5f6 → 5f86.6129 (−02)3.4422 (−02)
6s2 → 7s21.0113 (00)
7p2 → 7p48.1938 (+01)
6p2 → 7p27.2065 (−02)
6p4 → 7p42.4557 (00)
5f6 → 7p42.4281 (−03)
[125,126].
The comparisons of our computed results with the other estimations obtained from correlation exhaustive ab initio theoretical computations or precise experiments are one of the measures of accuracy of our calculations. Further, the differences between the calculated matrix elements in the length and velocity gauge forms are characteristic of the preciseness of our calculations. A recent piece of literature [95] also claims that the difference in length gauge and velocity gauge is a measure of accuracy. Another factor of accuracy in ab initio calculations arises from the DF wavefunctions used for correlation calculations. In addition, we should consider the uncertainty that arises from the other correlation terms (which we did not consider in this article) and the quantum electrodynamics effect, which is at most 2 % in total. Taking all these into account, the maximum calculated uncertainties for Ar 7 + , Kr 7 + , Xe 7 + , and Rn 7 + are about 5.6 % , 5.37 % , 5 % and 5.01 % , respectively.
To understand the critical effect of the plasma atmosphere on the ionization potential of the ions, we highlight the IPD values in bold fonts in Table 1 for different values of screening length, μ . These IPD values reflect critical electron or plasma density at a particular temperature for the ionic system when a few of the bound ionic states are elevated to continuum states.
Table 1 also reveals that the fine structure splittings (FSS) are suppressed as the screening strength increases from μ = 0 to 1.0. For example, the energy differences between 4 p 3 / 2 and 4 p 1 / 2 of Kr 7 + are evaluated as 9774 a.u, 9732 a.u, 9608 a.u., and 9407 a.u. for μ = 0, 0.025, 0.05, and 0.075 a.u., respectively. This phenomenon is consistent with earlier calculations for sodium D line [127] and hydrogen-like atoms [128]. The suppression of the transition rate among the fine-structure levels is mainly arising from the energy quench.
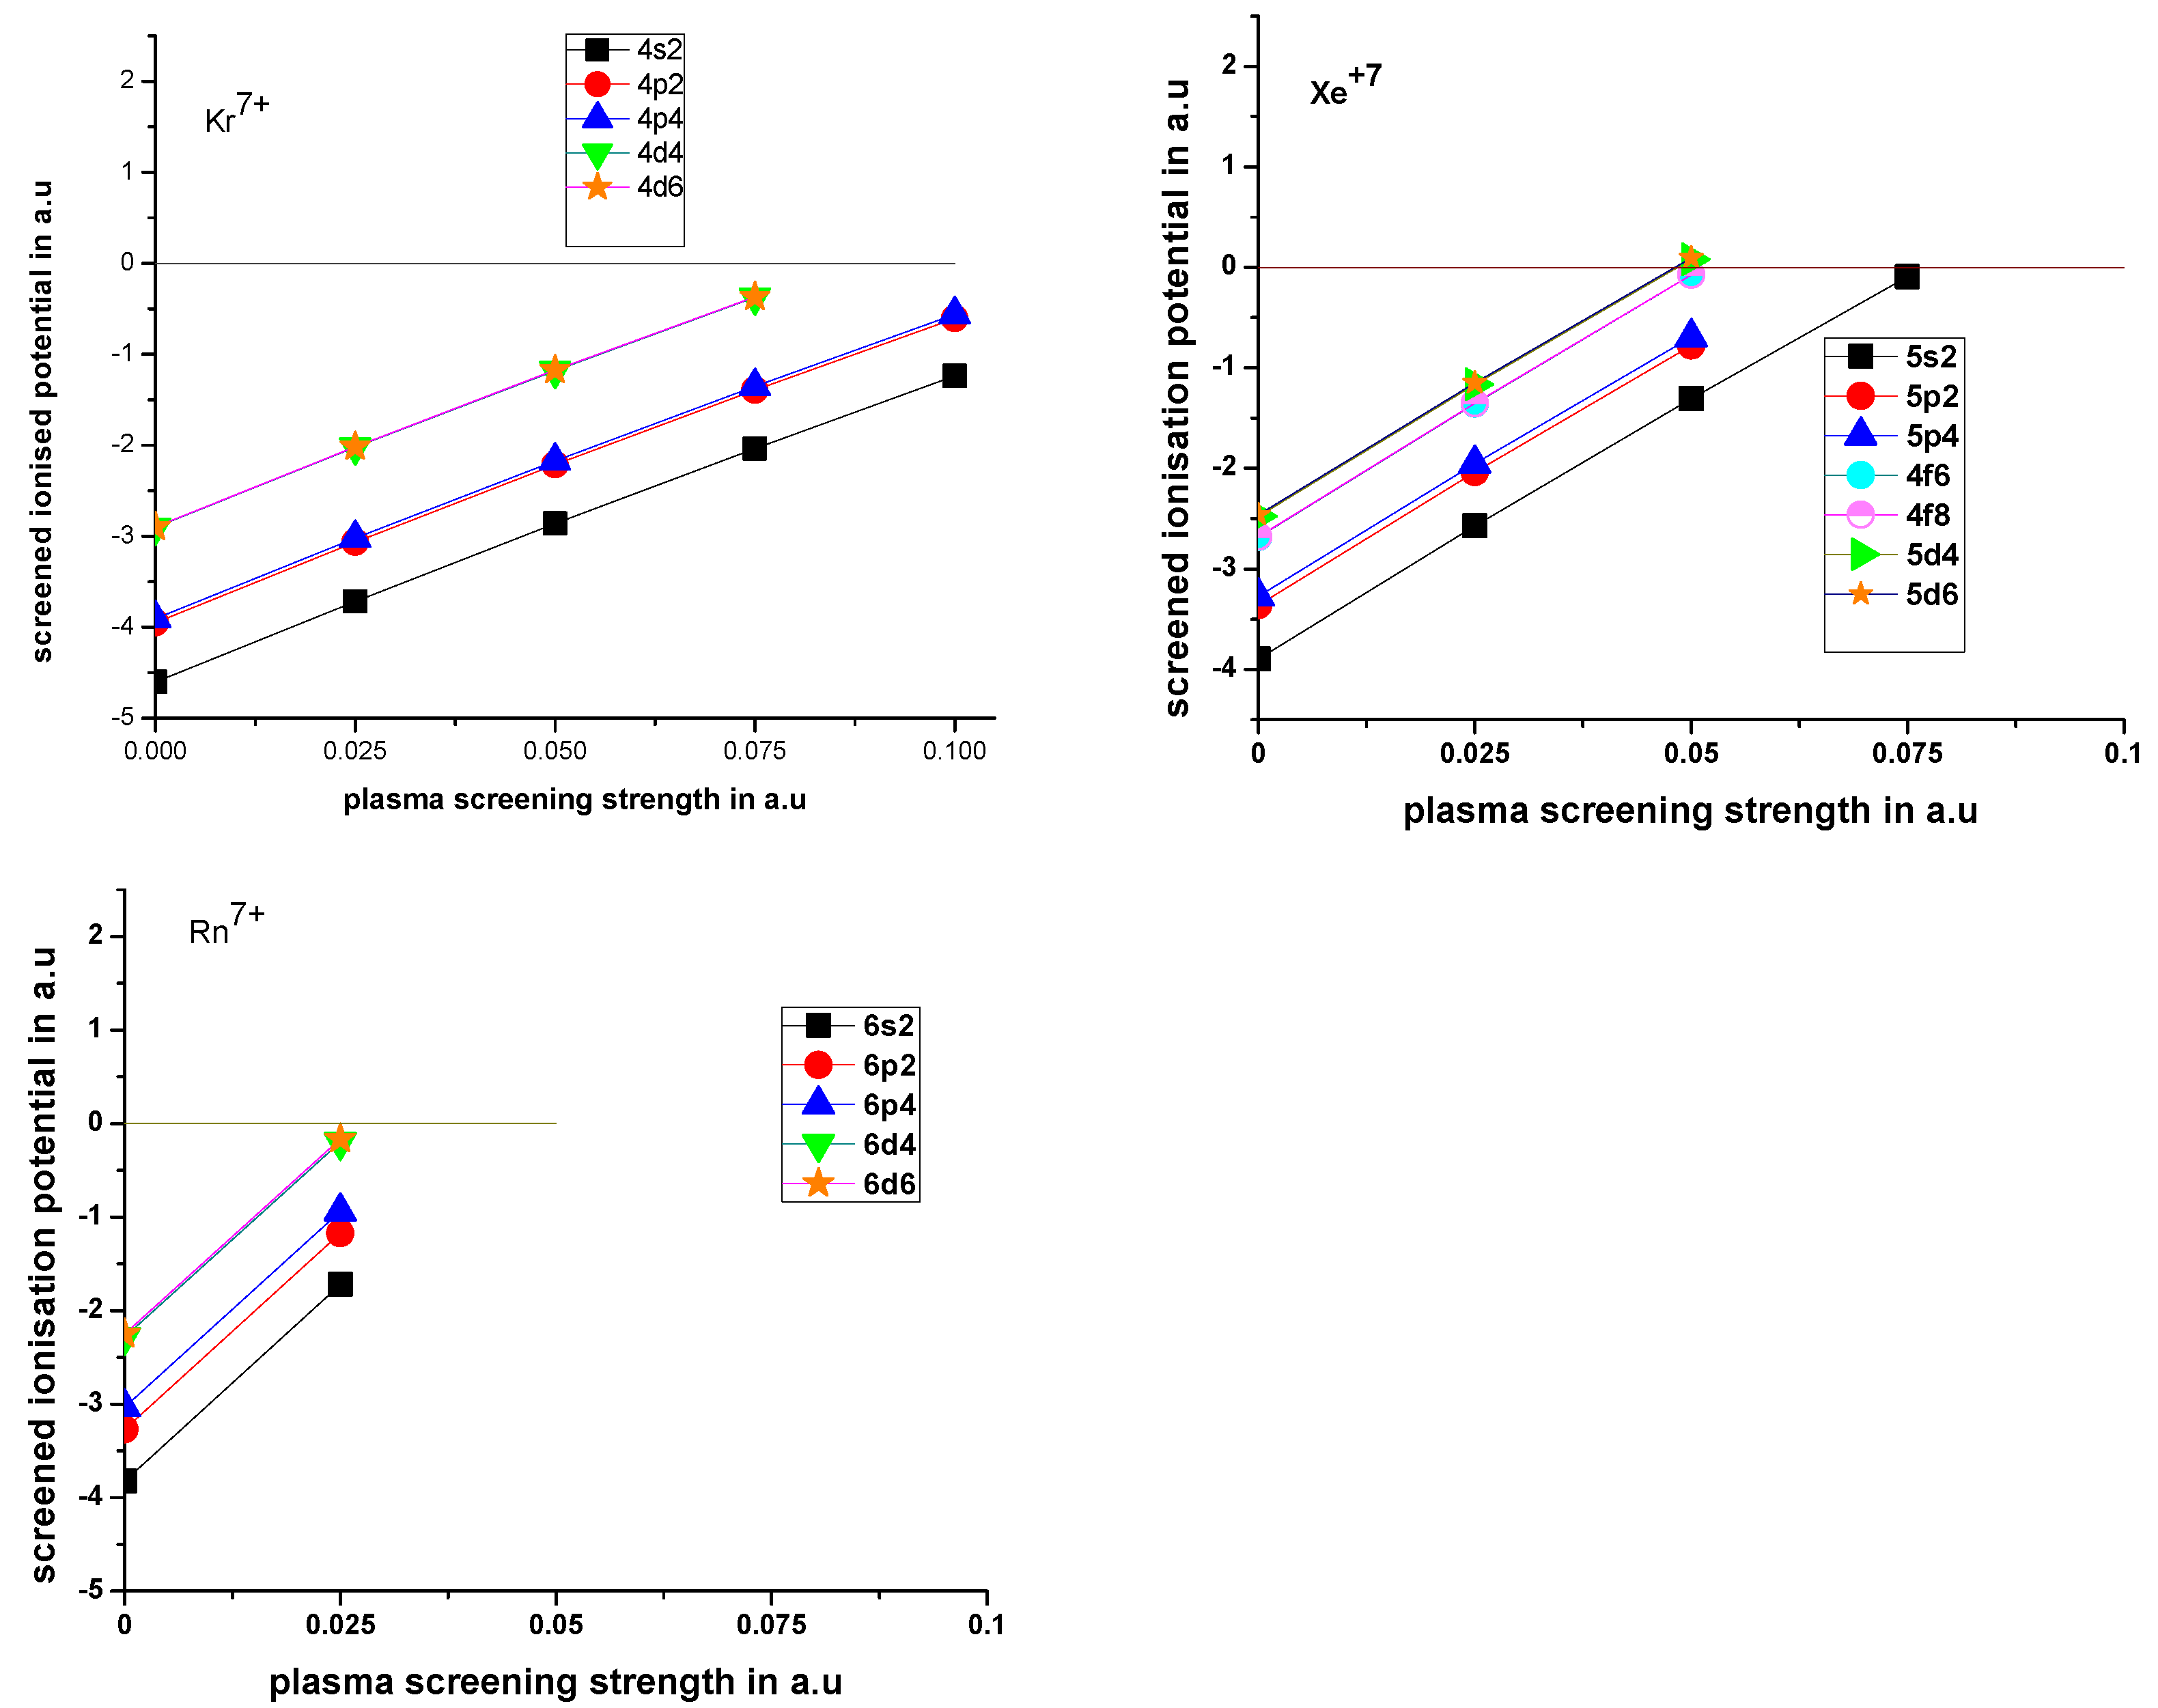
From Figure 3, we pictorially estimate the critical values of plasma screening strength ( μ c ) where the ionization potential becomes zero for a particular atomic state. We also tabulate these values in Table 7. The critical screening strength is essential in photo-ionization cross-section, which increases with increasing μ until μ = μ c . This increment is obvious due to the decrease in bound state energy leading to the increase in radial expansion of the bound state wavefunction [128]. This phase shift of bound state to continuum state is induced by the plasma atmosphere, and the ionization threshold decreases with the Debye screening length ( μ 1 ). In terms of the photo-ionization cross-section [129], the plasma decreases the threshold cross-section, and the discrete bound wavefunctions become diffused. Therefore, critical screening strength plays an important role in atomic structure. However, we have not found any spectroscopic data in the literature for these ions in plasma medium to compare with our results.
Table 6. Lifetimes in ns of few low-lying states.
LevelPresent WorkOther Work (Experiment)Other Work (Theory)
Ar 7 +
3p20.4110.417 ± 0.010 a , 0.423 ± 0.040 b , 0.413 c , 0.407 d , 0.397 e , 0.409 f
0.48 ± 0.05 g , 0.49 ± 0.05 h 0.389 i , 0.408 j , 0.4121 k
0.55 ± 0.03 l , 0.53 ± 0.11 m
3p40.3870.389 ± 0.010 a , 0.421 ± 0.030 b , 0.389 c , 0.382 d , 0.373 e , 0.386 f
0.428 ± 0.027 g , 0.48 ± 0.06 h 0.366 i , 0.388 j , 0.3872 k
0.54 ± 0.02 l , 0.527 ± 0.018 m
3d40.1320.170 ± 0.010 a , 0.130 ± 0.005 b , 0.127 e , 0.134 f , 0.133 j , 0.1318 k
0.158 ± 0.008 g ,
3d60.1370.166 ± 0.008 a , 0.131 ± 0.005 b , 0.131 e , 0 . 138   f , j , 0.1361 k
0.160 ± 0.008 g
4f60.003
4f80.002
Kr 7 +
4p20.2930.41 ± 0.04 n , 0.291 ± 0.012 o 0.282 p , 0.29653 q
0.290 ± 0.015 g , 0.401 ± 0.018 l
4p40.2350.33 ± 0.03 n , 0.243 ± 0.01 o 0.230 p , 0.24176 q
0.218 ± 0.033 g , 0.331 ± 0.011 l
4d40.048 0.05019 q
4d60.052 0.048 ± 0.004 o 0.05388 q
4f60.055
4f80.055
Xe 7 +
5p20.45 0.52 ( 3 ) r , 0.50 ± 0.05 s , 0.37 t , 0.47 u , 0.48 v , 0.53 w
0.380 ± 0.040 g
5p40.29 0.35 ( 2 ) r , 0.33 ± 0.03 s , 0.23 t , 0.30 u , 0.31 v , 0.33 w
0.272 ± 0.037 g
5d40.08 0.10 ( 2 ) r 0.07 t , 0.07 v , 0.06 w
5d60.08 0.14 ( 2 ) r 0.14 t , 0.08 v , 0.07 w
Rn 7 +
6p20.429
6p40.144
6d40.056
6d60.082
a⇒Beam-foil technique [97]; b⇒ [130]; c⇒third-order many-body perturbation theory [131]; d⇒ R-matrix theory [98]; e⇒single Configuration interaction Hartree–Fock method using a pseudo potential [99]; f⇒ relastic model potential [103]; g⇒Arbitrarily Normalized Decay curve method for cascade-correction in beam-foil [107]; h⇒beam-foil technique in the vacuum u.v [132]; i⇒Multiconfiguration Dirac–Fock method [104]; j⇒charge expansion technique [133]; k⇒multiconfiguration Dirac–Hartree–Fock theory including core polarization [31]; l⇒beam-foil [50]; m⇒beam-foil [134]; n⇒beam-foil [49]; o⇒foil excitation [106]; p⇒Coulomb approximation [111]; q⇒Hartree–Slater method [23]; r⇒beam-foil spectroscopy [53]; s⇒relativistic Hartree–Fock method [135]; t⇒relativistic perturbation theory with a zero approximation model potential [57]; u⇒relativistic many-dody perturbation theory(RMBPT(3)) [55]; v⇒relativistic HFR+CP [53]; w⇒relativistic MCDF [53].

4. Conclusions

The continuous progress in astrophysical and astronomical observations demands accurate theoretical transition data in a realistic environment. In many cases, the experiment is difficult to extract the data used to estimate the abundance of the ions in the stellar chemical composition. Here, the highly correlated relativistic coupled-cluster theory is applied to precisely determine the excitation energies of a few low-lying states of astrophysically relevance such as Ar 7 + , Kr 7 + and Xe 7 + , and Rn 7 + . Furthermore, we calculate various properties of allowed and forbidden transitions, such as transition probabilities, oscillator strengths, and lifetimes, and compare them with previously reported data in the literature. We found an overall good agreement between our results with the other theoretical and experimental results. Moreover, the concurrence between the length and velocity gauge allowed transition amplitudes signifies the exact calculations of our correlated wavefunctions. We found that most of the transitions shown here fall in the ultraviolet region of the electromagnetic spectrum, useful for astrophysical plasma research and telescope-based astronomy. A few transitions, such as 4 d 3 / 2 4 f 5 / 2 , 4 d 5 / 2 4 f 5 / 2 and 4 d 5 / 2 4 f 7 / 2 of Ar 7 + , 5 p 1 / 2 4 f 5 / 2 of Kr 7 + and 5 p 1 / 2 5 p 3 / 2 of Xe 7 + emit the visible light, which can have application in laser spectroscopy. Our presented transition line parameters of Rn 7 + may help the astronomer identify the ion’s unknown lines. To the best of our knowledge, some of the oscillator strengths of allowed transitions and most of the transition rates of the forbidden transitions are reported here for the first time in the literature.
The main focus of this paper is to evaluate the above spectroscopic properties under a realistic astronomical atmosphere. We showed that the variation of our results for different values of Debye screening lengths and ionization potential depression values for each atomic state are useful for atomic structure characterization.

Author Contributions

S.B. and S.M. have visualize and conceptualize the problem, S.B. has augmented the code for plasma environment, did former analysis, and data curation. S.B., A.D., A.B., R.R.P. and S.M. worked on the manuscript writing. S.M. has supervised the total work. All authors have read and agreed to the published version of the manuscript.

Funding

This research received no external funding.

Data Availability Statement

Not applicable.

Conflicts of Interest

The authors declare no conflict of interest.

References

  1. Barlow, M.J.; Swinyard, B.M.; Owen, P.J.; Cernicharo, J.; Gomez, H.L.; Ivison, R.J.; Krause, O.; Lim, T.L.; Matsuura, M.; Miller, S.; et al. Detection of a Noble Gas Molecular Ion 36ArH+. Science 2013, 342, 1343–1345. [Google Scholar] [CrossRef]
  2. Güsten, R.; Wiesemeyer, H.; Neufeld, D.; Menten, K.; Graf, U.; Jacobs, K.; Klein, B.; Ricken, O.; Risacher, C.; Stutzki, J. Astrophysical detection of the helium hydride ion HeH+. Nature 2019, 568, 357–359. [Google Scholar] [CrossRef] [PubMed]
  3. Benna, M.; Mahaffy, P.R.; Halekas, J.S.; Elphic, R.C.; Delory, G.T. Variability of helium, neon, and Argom in the lunar exosphere as observed by the LADEE NMS instrument. Geophys. Res. Lett. 2015, 42, 3723. [Google Scholar] [CrossRef]
  4. Müller, H.S.P.; Muller, S.; Schilke, P.; Bergin, E.A.; Black, J.H.; Gerin, M.; Lis, D.C.; Neufeld, D.A.; Suri, S. Detection of extragalatic argonium ArH+, towards PKS 1830-211. Astron. Astrophys. 2015, 582, L4. [Google Scholar] [CrossRef]
  5. Schilke, P.; Neufeld, D.; Mueller, H.; Comito, C.; Bergin, E.; Lis, D.; Gerin, M.; Black, J.H.; Wolfire, M.; Indriolo, N.; et al. Ubiquitous argonium (ArH+) in the diffuse interstellar medium: A molecular tracer of almost purely atomic gas. Astron. Astrophys. 2014, 566, A29. [Google Scholar] [CrossRef]
  6. Taresch, G.; Kudritzki, R.P.; Hurwitz, M.; Bowyer, S.; Pauldrach, A.W.A.; Puls, J.; Butler, K.; Lennon, D.J.; Haser, S.M. Quantitative analysis of the FUV, UV and optical spectrum of the O3 star HD 93129A. Astron. Astrophys. 1997, 321, 531–548. [Google Scholar]
  7. Pérez-Montero, E.; Hägele, G.F.; Contini, T.; Díaz, Á.I. Neon and Argon optical emission lines in ionized gaseous nebulea: Implications and aplications. Mon. Not. R. Astron. Soc. 2007, 381, 125–135. [Google Scholar] [CrossRef]
  8. Panigrahy, S.N.; Dougherty, R.W.; Das, T.P.; Andriessen, J. Theory of hyperfine interactions in lithiumlike systems. Phys. Rev. A 1989, 40, 1765. [Google Scholar] [CrossRef]
  9. Owusu, A.; Yuan, X.; Panigrahy, S.N.; Doughetry, R.W.; Das, T.P.; Andriessen, J. Theory of hyperfine interactions in potassium and Sc2+ Sion: Trends in system isoelectronic with Potassium. Phys. Rev. A 1977, 55, 2644. [Google Scholar] [CrossRef]
  10. Xiao, L.W.; Kai-Zhi, Y.; Bing-Cong, G.; Meng, Z. Calculation on the hyperfine constants of the ground states for Lithium-like system. Chin. Phys. 2007, 16, 2389. [Google Scholar] [CrossRef]
  11. Roy, S.N.; Rodgers, J.E.; Das, T.P. Hyperfine interactions in stripped atoms isoelectronic with alkali atoms. Phys. Rev. A 1976, 13, 1983. [Google Scholar] [CrossRef]
  12. Dutta, N.N.; Majumder, S. Electron-correlation trends in the hyperfine A and B constant of Na isoelectronic sequence. Phys. Rev. A 2013, 88, 062507. [Google Scholar] [CrossRef]
  13. Herrnstein, J.R.; Moran, J.M.; Greenhill, L.J.; Dimond, P.J.; Inoue, M.; Nakai, N.; Miyoshi, M.; Henkel, C.; Riess, A. A geometric distance to the Galaxy NGC4258 from orbital motions in a nuclear gas disc. Nature 1999, 400, 539–541. [Google Scholar] [CrossRef]
  14. Dimitrijevć, M.S. Stark broadening in astrophysics. Astron. Astrophys. Trans. 2003, 22, 389–412. [Google Scholar] [CrossRef]
  15. Eldén, B. Die deutung der Emissionslinien im spektrum der sonnenkorona. Z. Astrophys. 1942, 22, 30. [Google Scholar]
  16. Eidelsberg, M.; Crifo-Magnant, F.; Zeippen, C.J. Forbidden lines in hot astronomical sources. Astron. Astrophys. Suppl. Ser. 1981, 43, 455–471. [Google Scholar]
  17. Mcwhirter, R.W.P.; Summers, H.P. Atomic radiation from low density plasma. Appl. At. Collission Phys. 1983, 2, 51. [Google Scholar]
  18. Eldén, B. Forbidden lines in hot plasma. Phys. Scr. 1984, 26, 71. [Google Scholar] [CrossRef]
  19. Sterling, N.C.; Dinerstein, L.H.; Charles, B.W. Discovery of enhanced Germanium abundances in planetary nebulae with the far ultraviolet spectroscopic explorer. Astrophys. J. 2002, 578, L55. [Google Scholar] [CrossRef]
  20. O’Toole, S.J. beyond the iron group: Heavy metals in hot subdwarfs. Astron. Atrophys. 2004, 423, L25–L28. [Google Scholar] [CrossRef]
  21. Chayer, P.; Vennes, S.; Dupuis, J.; Kruk, J.W. Abundance of elements beyond the Iron group in cool DO white Dwarfs. Astrophys. J. 2005, 630, L169. [Google Scholar] [CrossRef]
  22. Vennes, S.; Chayer, P.; Dupuis, J. Discovery of photospheric Germanium in Hot DA White Dwarfs. Astrophys. J. 2005, 622, L121. [Google Scholar] [CrossRef]
  23. Curtis, L.J.; Theodosiou, C.E. Comprehensive calculations of 4p and 4d lifetimes for the Cu sequence. Phys. Rev. A 1989, 39, 605. [Google Scholar] [CrossRef] [PubMed]
  24. Dimitrijevć, M.S.; Simić, Z.; Kovačević, A.; Valjarević, A.; Sahal-Bréchot, S. Stark broadening of Xe VIII spectral lines. Mon. Not. R. Astron. Soc. 2015, 454, 1736–1741. [Google Scholar] [CrossRef]
  25. Beer, H.; Käppeler, F.; Reffo, G.; Venturini, G. Neutron capture cross-sections of stable xenon isotopes and their application in stellar nucleosynthesis. Astrophys. Space Sci. 1983, 97, 95. [Google Scholar] [CrossRef]
  26. Clayton, D.D.; Ward, R.A. S process studies: Xenon and krypton isotopic abundances. Astrophys. J. 1978, 224, 1000. [Google Scholar] [CrossRef]
  27. Berry, H.G.; Hallin, R.; Sjödin, R.; Gaillard, M. Beam -foil observations of Na 1 doubly-excited states. Phys. Lett. 1974, 50A, 191. [Google Scholar] [CrossRef]
  28. Striganov, A.R.; Odintsova, G.A. Tables of Spectral Lines of Atom and Ions; Energy: Moscow, Russia, 1982. [Google Scholar]
  29. Jupén, C.; Engström, L.; Hutton, R.; Reistad, N.; Westrlind, M. Analysis of core-excited n = 3 configurations in S VI, Cl VII, Ar VIII, and Ti XII. Phys. Scr. 1990, 42, 44. [Google Scholar] [CrossRef]
  30. Biémont, E.; Frémat, Y.; Quinet, P. Ionization potentials of atoms and ions from Lithium to Tin (z = 50). At. Nucl. Data Tables 1999, 71, 117. [Google Scholar] [CrossRef]
  31. Fischer, C.F.; Tachiev, G.; Irimia, A. Relativistic energy levels, lifetimes, and transition probabilities for the sodium-like to argon-like sequences. At. Nucl. Data Tables 2006, 92, 607. [Google Scholar] [CrossRef]
  32. Saloman, E.B. Energy levels and observed spectral lines of ionized Argon, Ar II through Ar XVIII. J. Phys. Chem. Ref. Data 2010, 39, 033101. [Google Scholar] [CrossRef]
  33. Cardelli, J.A.; Mayer, D.M. The Abundance of Interstellar krypton. Astrophys. J. 1997, 477, L57. [Google Scholar] [CrossRef]
  34. Cardelli, J.A.; Sarage, B.D.; Ebbets, D.C. Interstellar Gas phase Abundance Carbon, Oxygen, Nitrogen, Copper, Gallium, Germanium, and Krypton toward zeta ophiuchi. Astrophys. J. Lett. 1991, 383, L23. [Google Scholar] [CrossRef]
  35. Cartledge, S.I.B.; Meyer, D.M.; Lauroesch, J.T. The Homogeneity of Interstellar Krypton in the Galactic Disk. Astrophys. J. 2003, 597, 408–413. [Google Scholar] [CrossRef]
  36. Dinerstein, H.L. Neutron-Capture Elements in Planetary Nebulae: Identification of two near-Infrared Emission Lines as [Kr III]. Astrophy. J. 2001, 550, L223–L226. [Google Scholar] [CrossRef]
  37. Cheng, K.-T.; Kim, Y.-K. Energy levels, wavelengths, and transition probabilities of Cu-like ions. At. Data Nucl. Data Tables 1978, 22, 547–563. [Google Scholar] [CrossRef]
  38. Reader, J.; Acquista, N.; Kaufman, V. Spectrum and energy levels of seven-times-ionized Krypton (Kr VIII) and resonance lines of eight-times-ionized Krypton (Kr VIII). J. Opt. Soc. Am. B 1991, 8, 538–547. [Google Scholar] [CrossRef]
  39. Boduch, P.; Chantepie, M.; Hennecart, D.; Husson, X.; Lecler, D.; Druetta, M.; Wilson, M. Spectroscopic analysis of visible and near UV light emitted in 120-kev Kr8+-He and Kr8+-H2 collisions. Phys. Scr. 1992, 46, 337. [Google Scholar] [CrossRef]
  40. Johnson, W.R.; Blundell, S.A.; Sapirstein, J. Many-body perturbation-theory calculations of energy levels along the copper isoelectronic sequence. Phys. Rev. A 1990, 42, 1087. [Google Scholar] [CrossRef]
  41. Vilkas, M.J.; Ishikawa, Y.; Hirao, K. Ionization energies and fine structure splitting of highly correlated systems: Zn, zinc-like ions and Copper-like ions. Chem. Phys. Lett. 2000, 321, 243–252. [Google Scholar] [CrossRef]
  42. Hinnov, E. Highly ionized atoms in tokamak discharges. Phys. Rev. A 1976, 14, 1533. [Google Scholar] [CrossRef]
  43. Alexander, E.; Even-Zohar, M.; Fraenkel, B.S.; Goldsmith, S. Classification of transitions in the EUV spectra of Y ix-xiii, Zn x-xiv, Nb xi-xv and Mo xii-xvi. J. Opt. Soc. Am. 1971, 61, 508. [Google Scholar] [CrossRef]
  44. Reader, J.; Acquista, N. 4s-4p resonance transitions in highly charged Cu- and Zn-like ions. Phys. Rev. Lett. 1977, 39, 184. [Google Scholar] [CrossRef]
  45. Curtis, L.J.; Lindgård, A.; Eldén, B.; Martinson, I.; Nielsen, S.E. Energy levels and transition probabilities in Mo XIV. Phys. Scr. 1977, 1977 16, 72. [Google Scholar] [CrossRef]
  46. Joshi, Y.N.; Van Kleef, T.A.M. The sixth spectrum of selenium: Se VI. Physica B+C 1978, 94, 270–274. [Google Scholar] [CrossRef]
  47. Reader, J.; Luther, G.; Acquista, N. Spectrum and energy levels of thirteen-times ionized Molybdenum Mo XIV. J. Opt. Soc. Am. 1979, 69, 144–149. [Google Scholar] [CrossRef]
  48. Mansfield, M.W.D.; Peacock, N.J.; Smith, C.C.; Hobby, M.G.; Cowan, R.D. The XUV spectra of highly ionized Molybdenum. J. Phys. B Atom. Mol. Phys. 1978, 11, 1521–1544. [Google Scholar] [CrossRef]
  49. Druetta, M.; Buchet, J.P. Beam-foil study of krypton between 400 and 800 Å. J. Opt. Soc. Am. 1976, 66, 433. [Google Scholar] [CrossRef]
  50. Irwin, D.J.G.; Karnahan, J.A.; Pinnington, E.H.; Livingston, A.E. Beam-foil mean-life measurements in krypton. J. Opt. Soc. Am. 1976, 66, 1396–1400. [Google Scholar] [CrossRef]
  51. Knystautas, E.J.; Drouin, R. Oscillator strength of resonance lines in Br(VI), (VII) and Kr(VII), (VIII). J. Quant. Spectrosc. Radiat. Transfer. 1977, 17, 551–553. [Google Scholar] [CrossRef]
  52. Werner, K.; Rauch, T.; Ringat, E.; Kruk, J.W. First detection of Krypton and Xenon in a white dwarf. Astrophys. J. Lett. 2012, 753, L7. [Google Scholar] [CrossRef]
  53. Biémont, E.; Clar, M.; Fivet, V.; Garnir, H.-P.; Palmeri, P.; Quinet, P.; Rostohar, D. Lifetime and transition probability determination in xenon ions. Eur. Phys. J. D 2007, 44, 23–33. [Google Scholar] [CrossRef]
  54. Migdalek, J.; Garmulewicz, M. The relativistic ab initio model potential versus Dirac–Fock oscillator strengths for silver and gold isoelectronic sequences. J. Phys. B At. Mol. Opt. Phys. 2000, 33, 1735. [Google Scholar] [CrossRef]
  55. Safronova, U.I.; Savukov, I.M.; Safronova, M.S.; Johnson, W.R. Third-order relativistic many-body calculations of energies and lifetimes of levels along the silver isoelectronic sequence. Phys. Rev. A 2003, 68, 062505. [Google Scholar] [CrossRef]
  56. Glowacki, L.; Migdałek, J. Relativistic configuration-interaction Oscillator strength for lowest E1 transitions in silver and gold isoelectronic sequences. Phys. Rev. A 2009, 80, 042505. [Google Scholar] [CrossRef]
  57. Ivanova, E.P. Transitions probabilities for 5s-5p, 5p-5d, 4f-5d, and 5d-5f transitions in Ag-like ions with Z = 50–86. At. Data Nucl. Data Tables 2011, 97, 1–22. [Google Scholar] [CrossRef]
  58. Otsuka, M.; Tajitsu, A. Chemical abundances in the Carbon-rich and Xenon-rich halo planetary nebula H4-1. Astrophys. J. 2013, 778, 146. [Google Scholar] [CrossRef]
  59. Bhowmik, A.; Dutta, N.N.; Roy, S. Precise calculations of Astrophysically Important Allowed and Forbidden Transitions of Xe VIII. Astrophys. J. 2017, 836, 125. [Google Scholar] [CrossRef]
  60. Pernpointner, M.; Zobel, J.P.; Kryzhevoi, N.V. Strong configuration interaction in the double ionization spectra of noble gases studied by the relativistic propagator method. Phys. Rev. A 2012, 85, 012505. [Google Scholar] [CrossRef]
  61. Eser, S.; Özdemir, L. Energies and lifetimes of levels for doubly ionized Xenon and Radon. Phys. Pol. A 2018, 133, 1324. [Google Scholar] [CrossRef]
  62. Pequignot, D.; Baluteau, J.-P. The identification of krypton, xenon and other elements of rows 4, 5, and 6 of the periodic table in the planetary nebula NGC 7027. Astron. Astrophys. 1994, 283, 593–625. [Google Scholar]
  63. Migdalek, J. Core-polarisation corrected relativistic energy and radiative data for one- electron spectra of Bi v through U XIV. Can. J. Phys. 2018, 96, 610. [Google Scholar] [CrossRef]
  64. Lindgren, I.; Mukherjee, D. On the connectivity criteria in the open shell coupled-cluster theory for general model spaces. Phys. Rep. 1987, 151, 93–127. [Google Scholar] [CrossRef]
  65. Bishope, R.F. An overview of coupled cluster theory and it’s applications in physics. Theor. Chim. Acta 1991, 80, 95–148. [Google Scholar] [CrossRef]
  66. Roy, S.; Majumder, S. Ab initio estimations of the isotope shift for the first three elements of the K isoelectronic sequence. Phys. Rev. A 2015, 92, 012508. [Google Scholar] [CrossRef]
  67. Dutta, N.N.; Majumder, S. Accurate estimations of stellar and interstellar transition lines of triply ionized germanium. Astrophys. J. 2011, 737, 25. [Google Scholar] [CrossRef]
  68. Dutta, N.N.; Majumder, S. Ab initio studies of electron correlation and Gaunt interaction effects in the boron isoelectronic sequence using coupled cluster theory. Phys. Rev. A 2012, 85, 032512. [Google Scholar] [CrossRef]
  69. Dutta, N.N.; Majumder, S. Ab initio calculations of spectroscopic properties of Cr5+ using coupled cluster-theory. Indian J. Phy. 2016, 90, 373. [Google Scholar] [CrossRef]
  70. Bhowmik, A.; Roy, S.; Dutta, N.N.; Majumder, S. Study of Coupled-Cluster correlations on electromagnetic transitions and hyperfine structure constants of W VI. J. Phys. B At. Mol. Opt. Phys. 2017, 50, 125005. [Google Scholar] [CrossRef]
  71. Bhowmik, A.; Dutta, N.N.; Majumder, S. Magic wavelengths for trapping with focused Laguerre-Gaussian beams. Phy. Rev. A 2018, 97, 022511. [Google Scholar] [CrossRef]
  72. Bhowmik, A.; Dutta, N.N.; Majumder, S. Vector polarizability of an atomic state induced by a linearly polarized vortex beam. External control of magic tune-out wavelengths and heteronuclear spin oscillations. Phy. Rev. A 2020, 102, 063116. [Google Scholar] [CrossRef]
  73. Bhowmik, A.; Dutta, N.N.; Das, S. Role of vector polarizability induced by a linearly polarized focused Lagueree-Gaussian light:application in optical trapping and ultracold spinor mixture. Eur. Phys. J. D 2022, 76, 139. [Google Scholar] [CrossRef]
  74. Biswas, S.; Das, A.; Bhowmik, A.; Majumder, S. Accurate estimations of electromagnetic transitions of Sn IV for stellar and interstellar media. Mon. Not. R. Astron. Soc. 2018, 477, 5605. [Google Scholar] [CrossRef]
  75. Das, A.; Bhowmik, A.; Dutta, N.N.; Majumder, S. Many-body calculations and hyperfine-interaction effect on dynamic polarizabilities at low-lying energy levels of Y2+. Phys. Rev. A 2020, 102, 012801. [Google Scholar] [CrossRef]
  76. Das, A.; Bhowmik, A.; Dutta, N.N.; Majumder, S. Two-Photon Polarizability of Ba+ ion: Control of Spin-Mixing Process in an Ultracold 137Ba+. Atoms 2022, 10, 109. [Google Scholar] [CrossRef]
  77. Sahoo, B.K.; Majumder, S.; Chaudhuri, R.K.; Das, B.P.; Mukherjee, D. Ab initio determination of the lifetime of the 62P3/2 state for 207Pb+ by relativistic many-body theory. J. Phys. B 2004, 37, 3409. [Google Scholar] [CrossRef]
  78. Bartlett, R.J. Modern Electronic Structure Theory; Yarkony, D.R., Ed.; World Scientific: Singapore, 1995; Volume II, p. 1047. [Google Scholar]
  79. Mondal, P.K.; Dutta, N.N.; Majumder, S. Effect of screening on spectroscopic properties of Li-like ions in a plasma medium. Phys. Rev. A 2013, 87, 062502. [Google Scholar] [CrossRef]
  80. Stewart, J.C.; Pyatt, K.D., Jr. Lowering of ionization potential in plasmas. Astrophys. J. 1966, 144, 1203. [Google Scholar] [CrossRef]
  81. Szabo, A.; Ostlund, N.S. Modern Quantum Chemistry: Int roduction to Advanced Elec-tronic Structure Theory; Courier Corporation: Dover, Mineola, 1996. [Google Scholar]
  82. Dixit, G.; Sahoo, B.K.; Chaudhuri, R.K.; Majumder, S. Ab initio calculations of forbidden transition amplitudes and lifetimes of the low-lying states in V4+. Phy. Rev. A 2007, 76, 059901. [Google Scholar] [CrossRef]
  83. Lindgren, I.; Morrison, J. Atomic Many-Body Theory; Springer: Berlin/Heidelberg, Germany, 1986; Volume 3. [Google Scholar] [CrossRef]
  84. Savukov, I.M.; Johnson, W.R.; Safronova, U.I. Multipole(E1, M1, E2, M2) transition wavelength and rates between states with n ≤ 6 in He-like Carbon, Nitrogen, Oxygen, Neon, Silicon and Argon. At. Data Nucl. Data Tables 2003, 85, 83–167. [Google Scholar] [CrossRef]
  85. Shore, B.W.; Menzel, D.H. Principles of ATOMIC SPECTRA; John Wiley and Sons: New York, NY, USA, 1968. [Google Scholar]
  86. Kelleher, D.E.; Podobedova, L.I. Atomic transition probabilities of Sodium and Magnetium. A critical compilation. J. Phys. Chem. Ref. Data 2008, 37, 267. [Google Scholar] [CrossRef]
  87. Ichimaru, S. Strongly coupled plasmas: High-density classical plasmas and degenerate electron liquids. Rev. Mod. Phys. 1982, 54, 1017. [Google Scholar] [CrossRef]
  88. Akhiezer, A.I.; Akhiezer, I.A.; Polovin, R.V.; Sitenko, A.G.; Stepano, K.N. Plasma Electrodynamics. Volume 1. Linear Theory; Pergamon Press: New York, NY, USA, 1975; 431p. [Google Scholar]
  89. Parpia, F.A.; Fischer, C.F.; Grant, I.P. GRASP92 a package for large-scale relativistic atomic structure calculations. Comput. Phys. Commun. 2006, 175, 745. [Google Scholar] [CrossRef]
  90. Clementi, E. (Ed.) Modern Techniques in Computational Chemistry: MOTECC-90; Springer: Amsterdam, The Netherlands, 1990. [Google Scholar]
  91. Huzinaga, S.; Klobukowski, M. Well-tempered gaussian bassis set for the calculation of matrix Hartree-fock wave function. Chem. Phys. Letts. 1993, 212, 260–264. [Google Scholar] [CrossRef]
  92. Roy, S.; Dutta, N.N.; Majumder, S. Relativistic coupled-cluster calculations on hyperfine structures and electromagnetic transition amplitudes of In III. Phys. Rev. A 2014, 89, 042511. [Google Scholar] [CrossRef]
  93. Kramida, A.; Ralchenko, Y.; Reader, J.; NIST ASD Team. NIST Atomic Spectra Database (Ver. 5.10); National Institude of Standards and Technology: Gaithersburg, MD, USA, 2022. Available online: http://physics.nist.gov/asd (accessed on 10 March 2023).
  94. Dutta, N.N.; Roy, S.; Dixit, G.; Majumder, S. Ab initio calculations of transition amplitudes and hyperfine A and B constants of Ga III. Phys. Rev. A 2013, 87, 012501. [Google Scholar] [CrossRef]
  95. Jyoti, K.H.; Arora, B.; Sahoo, B.K. Radiative properties of Cu-isoelectronic As, Se, and Br ions for astrophysical applications. Mon. Not. R. Astron. Soc. 2022, 511, 1999–2007. [Google Scholar] [CrossRef]
  96. Cowan, R.D. The Theory of Atomic Structure and Spectra; University of California Press: Berkeley, CA, USA, 1981. [Google Scholar]
  97. Reistad, N.; Engström, L.; Berry, H.G. Oscillator strength measurements of resonance transitions in Sodium- and Magnesium-like Argon. Phys. Scr. 1986, 34, 158. [Google Scholar] [CrossRef]
  98. Verner, D.A.; Verner, E.M.; Ferl, G.J. Atomic data for permitted resonance lines of atoms and ions from H to Si and S, Ar, Ca, and Fe. At. Data Nucl. Data Tables 1996, 64, 180. [Google Scholar] [CrossRef]
  99. Féret, L.; Pascale, J. Study of the multi charged ion Ar6+ by a configuration interaction Hartee Fock method using a pseudopotential. J. Phys. Rev. B At. Mol. Opt. Phys. 1999, 32, 4175. [Google Scholar] [CrossRef]
  100. Lagmago, K.G.; Nana Engo, S.G.; Kwato Njock, M.G.; Oumarou, B. Consistent description Klein-Gordon dipole matrix elements. J. Phys. B At. Mol. Opt. Phys. 1998, 31, 963. [Google Scholar] [CrossRef]
  101. Siegel, W.; Migdalek, J.; Kim, Y.K. Dirac–Fock oscillator strengths for E1 transition in the sodium isoelectronic sequence(Na I-Ca X). At. Data Nucl. Data Tables 1988, 68, 303–322. [Google Scholar] [CrossRef]
  102. Guet, C.; Blundell, S.A.; Johnson, W.R. Relativistic Many-body calculations of oscillator strength for sodium-like ions. Phys. Lett. A 1990, 143, 384. [Google Scholar] [CrossRef]
  103. Theodosiou, C.E.; Curtis, L.J. Accurate calculations of 3p and 3d lifetimes in the Na sequence. Phys. Rev. A 1988, 38, 4435. [Google Scholar] [CrossRef] [PubMed]
  104. Kim, Y.-K.; Cheng, K.-T. Transition probabilities for the resonance transitions of Na-like ions. J. Opt. Soc. Am. 1978, 68, 836. [Google Scholar] [CrossRef]
  105. Gruzdev, P.F.; Sherstyuk, A.I. Relativistic generalization of the effective orbital quantum number method. Opt. Spectrosc. 1979, 46, 353–355. [Google Scholar]
  106. Livingston, A.E.; Curtis, L.J.; Schectman, R.M.; Berry, H.G. Energies and lifetimes of excited states in Copper like Kr VIII. Phys. Rev. A 1980, 21, 771. [Google Scholar] [CrossRef]
  107. Pinnington, E.H.; Gosselin, R.N.; O’Neill, J.A.; Kernahan, J.A.; Donnely, K.E.; Brooks, R.L. Beam-foil lifetime measurements using ANDC analysis for the resonance doublet in A VIII, Kr VIII and Xe VIII. Phys. Scr. 1979, 20, 151. [Google Scholar] [CrossRef]
  108. Fischer, C.F. Oscillator strength of 2S2P transitions in the copper sequence. J. Phys. B 1977, 10, 1241. [Google Scholar] [CrossRef]
  109. Weiss, A.W. Hartree–Fock line strength for the Lithium, Sodium, and Copper isoelectronic sequences. J. Quant. Spectrosc. Radiat. Transf. 1977, 18, 481–490. [Google Scholar] [CrossRef]
  110. Cowan, R.D. Los Alamos Report No. LA-6679, MS, National Information Service; Spring: London, UK, 1977. [Google Scholar]
  111. Lindgård, A.; Curtis, L.J.; Matrinson, I.; Nielsen, S.E. Semi-Empirical Oscillator Strengths for Cu I Isoelectronic sequence. Phys. Scr. 1980, 21, 47. [Google Scholar] [CrossRef]
  112. Migdalek, J.; Baylis, W.E. Influence of core polarization on oscillator strength along the Copper isoelectronic sequence. J. Phys. B Atom. Mol. Phys. 1979, 12, 1113. [Google Scholar] [CrossRef]
  113. Saloman, E.B. Energy levels and observed spectral lines of Xenon, Xe I through Xe LIV. J. Phys. Chem. Ref. Data 2004, 33, 765. [Google Scholar] [CrossRef]
  114. Morita, S.; Goto, M.; Katai, R.; Dong, C.; Sakaue, H.; Zhou, H. Observation of Magnetic dipole forbiden transition in LHD and its application to burning plasma diagnostics. Plasma Sci. Technol. 2010, 12, 341. [Google Scholar] [CrossRef]
  115. Fahy, K.; Sokell, E.; O’Sullivan, G.; Aguilar, A.; Pomeroy, J.M.; Tan, J.N.; Gillaspy, J.D. Extreme-ultraviolet spectroscopy of highly charged xenon created using an electron-beam ions trap. Phys. Rev. A 2007, 75, 032520. [Google Scholar] [CrossRef]
  116. Morgan, C.A.; Serpa, F.G.; Takacs, E.; Meyer, E.S.; Gillaspy, J.D.; Sugar, J.; Roberts, J.R.; Brown, C.M.; Feldman, U. Observation of visible and uv magnetic dipole transition in highly charged Xenon and Barium. Phys. Rev. Lett. 1995, 74, 1716. [Google Scholar] [CrossRef] [PubMed]
  117. Kessler, M.F.; Steinz, J.A.; Anderegg, M.E.; Clavel, J.; Drechsel, G.; Estaria, P.; Faelker, J.; Riedinger, J.R.; Robson, A.; Taylor, B.G.; et al. The Infrared Space Observatory (ISO) Mission. Astron. Astrophys. 1996, 315, L27–L31. [Google Scholar] [CrossRef]
  118. Feuchtgruber, H.; Lutz, D.; Beintema, D.A.; Valentijn, E.A.; Bauer, O.H.; Boxhoorn, D.R.; De Graauw, T.; Haser, T.N.; Haerendel, G.; Heras, A.M. New wavelength determination of mid-infrared fine structure lines by infrared space observatory short wavelength spectrometer. Astrophys. J. 1997, 487, 962. [Google Scholar] [CrossRef]
  119. Liu, X.-W.; Barlow, M.J.; Cohen, M.; Danziger, I.J.; Luo, S.-G.; Baluteau, J.P.; Cox, P.; Emery, R.J.; Lim, T.; Péquignot, D. ISO LWS observations of planetary nebula fine-structure lines. Mon. Not. R. Astron. Soc. 2001, 323, 343–361. [Google Scholar] [CrossRef]
  120. Ponciano-Ojeda, F.; Hernández-Gómez, S.; López-Hernández, O.; Mojica-Casique, C.; Colín-Rodríguez, R.; Ramírez-Martínez, F.; Flores-Mijangos, J.; Sahagún, D.; Jáuregui, R.; Jiménez-Mier, J. Observation of the 5p3/2→6p3/2 electric-dipole-forbidden transition in atomic rubidium using optical-optical double-resonance spectroscopy. Phys. Rev. A 2015, 92, 042511. [Google Scholar] [CrossRef]
  121. Ponciano-Ojeda, F.; Hernández-Gómez, S.; López-Hernández, O.; Mojica-Casique, C.; Colín-Rodríguez, R.; Ramírez-Martínez, F.; Flores-Mijangos, J.; Sahagún, D.; Jáuregui, R.; Jiménez-Mier, J. Laser spectroscopy of the 5P3/2→6Pj (j = 1/2 and 3/2) electric dipole forbidden transitions in atomic rubidium. AIP Conf. Proc. 2018, 1950, 030001. [Google Scholar] [CrossRef]
  122. Ponciano-Ojeda, F.; Hernández-Gómez, S.; López-Hernández, O.; Mojica-Casique, C.; Colín-Rodríguez, R.; Ramírez-Martínez, F.; Flores-Mijangos, J.; Sahagún, D.; Jáuregui, R.; Jiménez-Mier, J. One step beyond the electric dipole approximation: An experiment to observe the 5p→6p forbidden transition in atomic rubidium. Am. J. Phys. 2018, 86, 7. [Google Scholar] [CrossRef]
  123. Bhattacharya, M.; Haimberger, C.; Bigelow, N.P. Forbidden Transitions in a Magneto-Optical Trap. Phys. Rev. Letts. 2003, 91, 213004. [Google Scholar] [CrossRef] [PubMed]
  124. Preston, D.W. Doppler-free saturated absorption: Laser spectroscopy. Am. J. Phys. 1996, 64, 1432. [Google Scholar] [CrossRef]
  125. Grumer, J.; Zhao, R.; Brage, T.; Li, W.; Huldt, S.; Hutton, R.; Zou, Y. Coronal lines and the importance of deep-core-valence correlation in Ag-like ions. Phys. Rev. A 2014, 89, 062511. [Google Scholar] [CrossRef]
  126. Ding, X.B.; Koike, F.; Murakami, I. M1 transition energies and probabilities between the multiplets of the ground states of Ag-like ions with Z = 47–92. J. Phys. B 2012, 45, 035003. [Google Scholar] [CrossRef]
  127. Basu, J.; Ray, D. Suppression of fine-structure splitting and oscillator strength of sodium D-line in a Debye plasma. Phys. Plasmas 2014, 21, 013301. [Google Scholar] [CrossRef]
  128. Xie, L.Y.; Wang, J.G.; Janev, R.K. Relativistic effects in the photoionization of hydrozen-like ions with screened coulomb interaction. Phys. Plasmas 2014, 21, 063304. [Google Scholar] [CrossRef]
  129. Sahoo, S.; Ho, Y.K. On the appearance of a Cooper Minimum in the Photoionization Cross Section of the Plasma-Embedded Li Atom. Res. Lett. Phys. 2009, 2009, 832413. [Google Scholar] [CrossRef]
  130. Buchet-Poulizac, M.C.; Buchet, J.P.; Ceyzeriat, P. Spectroscopic et durees de vie dand Ar VI-VII. Nucl. Instrum. Methods 1982, 202, 13–18. [Google Scholar] [CrossRef]
  131. Johnson, W.R.; Liu, Z.W.; Sapirstein, J. Transition rates for lithium-like ions, sodium-like ions, and neutral alkali-metal atoms. At. Data Nucl. Data Tables 1996, 64, 279–300. [Google Scholar] [CrossRef]
  132. Knystautas, E.J.; Drouin, R.; Druetta, M. Nouvelles identification et mesures de durees de vie dans l’argon hautement ionise. J. Phys. Colloques 1979, 40, C1-186–C1-189. [Google Scholar] [CrossRef]
  133. Crossley, R.J.S.; Dalgarno, A. An expansion method for calculating atomic properties, V. Transition probabilities of M shell electrons. Proc. R. Soc. A 1965, 286, 510–518. [Google Scholar] [CrossRef]
  134. Livingston, A.E.; Irwin, D.J.G.; Pinnington, E.H. Lifetime measurement in Ar II-Ar VIII. J. Opt. Soc. Am. 1972, 62, 1303–1308. [Google Scholar] [CrossRef]
  135. Cheng, K.-T.; Kim, Y.-K. Excitation energy and oscillator strength in the silver isoelectronic sequence. J. Opt. Soc. Am. 1979, 69, 125. [Google Scholar] [CrossRef]
Figure 1. The plasma contribution in IP of low-lying septuple ionized atoms: % variation of IP with plasma screening strength. Energy levels are indicated as n L ( 2 J + 1 ) . Results are calculated from IP μ = 0 IP μ > 0 IP μ = 0 × 100 .
Atoms 11 00087 g001
Figure 2. The contribution of plasma screening in E1 matrix elements of Ar 7 + of transitions 2 S 1 / 2 3 P 1 / 2 , 3 / 2 . The figures display % variation of the E1 matrix elements vs. plasma screening strength.
Atoms 11 00087 g002
Figure 3. Determination of the value of critical plasma screening strength.
Atoms 11 00087 g003
Table 1. Comparison of our RCC ionization potential (in cm 1 ) with NIST data and our estimations of plasma screening effect on them. Estimations for 5 g states of Rn 7 + were not available in the literature (a) [63]. Plasma screening strength ( μ ) is in a.u. unit. Energy levels are indicated as n L ( 2 J + 1 ) . The bold values indicate that beyond which the system becomes unbound.
StateNIST μ = 0 μ = 0.025 μ = 0.05 μ = 0.075 μ = 0.1
Ar 7 +
3s21,157,0561,157,2011,059,866965,330873,513784,345
3p21,016,9611,016,995919,704825,299733,697644,828
3p41,014,2481,014,184916,898822,505730,924642,084
3d4824,447824,210726,923632,529540,956452,148
3d6824,302824,027726,741632,349540,779451,974
4s2581,098581,069485,070394,397308,793228,054
4p2528,815528,528432,658342,356257,356177,460
4p4527,813527,428431,565341,287256,323176,473
4d4459,524459,475363,709273,714189,240110,134
4d6 459,435 459,386 363,620273,627189,156110,055
4f6440,204440,190344,137253,339167,61886,891
4f8440,181440,159344,107253,309167,59086,865
5s2349,750349,752255,504169,77091,96121,742
5p2324,795323,193229,236144,33267,862557
5p4324,307322,543228,611143,76967,376
5d4291,782291,699197,867113,35237,637
5d6291,778291,652197,818113,30237,591
5f6281,727281,736187,657102,48725,846
5f8281,707281,720187,642102,47325,833
5g8281,051281,015186,38999,68420,685
5g10281,037281,015186,38099,67620,678
Kr 7 +
4s21,014,6651,010,099815,902628,237446,944271,892
4p2870,969867,027673,080486,149306,059132,689
4p4861,189857,253663,348476,541296,652123,557
4d4640,619636,965443,698258,76281,89186,678
4d6639,288635,514442,257257,35280,623
5s2524,578523,198331,842152,41315,482
5p2467,984465,448274,59296,629
5p4464,221461,406270,63092,891
4f6451,900450,180257,83175,655
4f8451,934450,186257,83775,660
5d4373,589371,922182,1117230
5d6373,048371,273181,4766635
6s2322,147321,635133,95734,847
5f6289,666288,637100,173
5f8289,661288,634100,170
5g8281,574281,38792,121
5g10281,572281,37992,114
Xe 7 +
5s2854,769854,995564,858286,73120,272
5p2738,302737,059447,391170,64393,515
5p4719,717718,263428,759152,487
4f6589,608588,730297,59916,588
4f8589,058588,088296,97016,085
5d4544,881543,506255,20317,518
5d6541,953540,549252,295
6s2459,272455,364170,155
6p2411,391406,318121,973
6p4403,996398,801114,717
5f6357,190356,37670,683
5f8356,751355,92270,245
6d4327,344323,45041,320
6d6325,975322,17640,102
7s2289,473276,902451
5g8284,501283,609
5g10284,501283,617
Rn 7 + (a)
6s2834,624839,362377,92363,552
6p2712,821718,015257,667
6p4661,071665,627205,616
5f6536,092531,07969,545
5f8534,720529,29168,106
6d4498,636501,23543,424
6d6491,240493,69936,116
7s2446,847445,5778041
7p2397,883398,535
7p4377,435377,332
5g8 287,997
5g10 288,252
Table 2. Our DF and RCC matrix element (a.u.), in length gauge, of electric dipole ( E 1 ) transitions in plasma medium. Energy levels are indicated as n L ( 2 J + 1 ) .
μ = 0 μ = 0.025 μ = 0.05 μ = 0.075 μ = 0.1
Ar 7 +
TransitionsDFRCCDFRCCDFRCCDFRCCDFRCC
3s2→3p20.96170.93410.96230.93460.96380.93900.96630.94050.96970.9436
3s2→3p41.36191.32281.36261.32361.36481.32991.36831.33171.37321.3355
3s2→4p20.20020.20930.19990.20890.19890.22100.19730.21810.19500.2164
3s2→4p40.27700.28980.27650.28930.27510.30590.27280.30280.26980.3012
3s2→5p20.10110.10620.10060.10570.09920.09950.09720.11050.09440.1007
3s2→5p40.13970.14700.13900.14630.13720.12150.13450.15410.13070.1528
4s2→4p21.89581.88131.89961.88511.91051.90591.92841.89871.95371.9012
4s2→4p42.68272.66222.68792.66752.70332.70062.72862.68572.76442.6844
3p2→4s20.36040.36460.36080.36490.36190.34190.36370.34370.36610.3432
3p4→4s20.51720.52310.51780.52360.51930.48980.52190.49430.52530.4952
3p2→5s20.12370.12690.12400.12710.12460.12750.12520.11440.12530.1274
3p4→5s20.17710.18160.17750.18190.17830.20210.17920.16530.17930.1659
3p2→3d41.35341.31741.35471.31861.35831.32071.36421.32181.37251.3305
3p4→3d40.60600.58990.60660.59050.60820.59160.61090.59180.61460.5956
3p4→3d61.81841.77001.82011.77201.82501.77361.83301.77501.84421.7795
3p2→4d40.38570.39570.38420.39420.38000.39250.37300.39260.36290.3551
3p4→4d40.17560.18010.17500.17940.17310.17700.16990.17910.16540.1645
3p4→4d60.52620.53940.52420.53750.51850.53210.50910.53720.49560.5357
4p2→4d42.78912.76872.79662.77612.81812.77372.85362.77372.90382.8032
4p4→4d41.24961.24051.25291.24381.26261.24701.27851.24201.30101.2498
4p4→4d63.74903.72173.75903.73163.78803.78803.83573.72553.90333.7279
3d4→4p20.54110.54340.54260.54490.54700.56160.55420.54070.56440.5701
3d4→4p40.23950.24060.24020.24120.24870.24500.24540.23950.24990.2530
3d6→4p40.71930.72250.72130.72440.72710.71930.73680.72010.75040.7184
3d4→4f61.77071.73781.77051.73771.77021.73841.76911.74011.76631.7778
3d6→4f60.47340.46710.47340.46460.47330.46490.47300.46530.47220.4658
3d6→4f82.11722.0782.11712.07792.11662.07932.11542.07682.11212.0799
4d4→4f63.15463.14953.16863.16343.21003.15083.27963.15043.38223.1414
4d6→4f60.84300.84160.84680.84540.85780.84200.87640.84190.90870.8423
4d6→4f83.77063.76443.78743.78123.76523.76443.92013.77784.04273.7790
Kr 7 +
 DFRCCDFRCCDFRCCDFRCCDFRCC
4s2→4p21.13481.07941.13631.10171.14051.12231.14751.10881.15751.1245
4s2→4p41.60951.53141.61151.56321.61751.59001.62751.57241.64161.6085
4s2→5p20.14880.16550.14790.15840.14510.1537
4s2→5p40.18120.20570.17990.19440.17610.1839
4p2→4d41.75391.68121.75691.74121.76571.75061.78041.7422
4p4→4d40.79400.76160.79540.77340.79950.78360.80640.7771
4p4→4d62.38182.28472.38602.32182.39842.35112.41902.3301
4p2→5s20.48840.49340.48940.48920.49250.4838
4p4→5s20.73160.73790.73310.73250.73770.7272
4p2→6s20.16550.16860.16540.16640.16460.1624
4p4→6s20.24470.24860.24450.24600.24270.2424
4d4→4f62.82432.74662.83402.77592.86232.7985
4d6→4f60.75650.73580.75910.74360.76680.7499
4d4→5p21.17401.16301.18091.17761.20151.1742
4d4→5p40.50900.51240.51200.51070.52120.5168
4d6→5p41.54151.55221.55071.54641.57861.5435
4d6→4f83.38363.29163.39533.32573.42973.3529
4d4→5f60.05960.04270.05820.0445
4d6→5f60.01330.00910.01750.0089
4d6→5f80.05920.04180.07790.0394
4f6→5g83.85763.79933.86883.8112
4f8→5g80.74220.73110.74440.7340
4f8→5g104.39144.32564.40424.3380
4f6→5d42.04212.03872.07282.03182.16832.0704
4f6→5d60.54300.54200.55120.54010.57660.5498
4f8→5d62.42742.42322.46412.41372.57802.4567
5p2→5d43.16833.12753.18673.13733.24013.1494
5p4→5d41.44071.42261.44891.42711.47281.4325
5p4→5d64.31724.26294.34174.27814.41314.2912
5p2→6s21.02201.02391.02771.0215
5p4→6s21.52781.53101.53471.5276
Xe 7 + DFRCCDFRCCDFRCCDFRCCDFRCC
5s2→5p21.37581.17361.37911.17691.38891.1866
5s2→5p41.95161.67051.95621.67521.97001.6890
5p2→5d42.11351.86292.11971.8697
5p4→5d40.97680.86460.97990.8679
5p4→5d62.92522.59112.93442.6011
5p2→6s20.58660.60260.58930.6046
5p4→6s20.94490.95820.94940.9619
4f6→5d41.79521.59581.81771.6155
4f6→5d60.47610.42370.48220.4291
4f8→5d62.13921.90752.16631.9313
4f6→5g81.80791.58691.78851.5731
4f8→5g80.34950.30730.34570.3046
4f8→5g102.06841.8192.04621.8032
5d4→5f62.97322.83282.96872.8347
5d6→5f60.80500.76700.80400.7676
5d6→5f83.59223.42333.58763.4252
6s2→6p22.74362.53262.56402.5931
6s2→6p43.33463.50523.61333.6569
6p2→6d43.72533.59303.75203.6089
6p4→6d41.72771.67251.73991.6762
6p4→6d65.16354.99665.19945.0147
5f6→5g85.59265.3626
5f6→5g81.07721.0330
5f8→5g106.37256.1114
Rn 7 + DFRCCDFRCCDFRCCDFRCCDFRCC
6s2→6p21.41591.13441.42101.1414
6s2→6p41.99021.61471.99691.6264
6p2→7s20.61840.62840.61890.6678
6p4→7s21.25121.21621.26571.2024
6p2→6d42.08871.75622.09781.7629
6p4→6d41.04930.89531.05560.9008
6p4→6d63.12002.65963.13802.6691
5f6→6d42.33622.09002.37942.0911
5f6→6d60.61180.55000.62360.5478
5f8→6d62.77092.49622.82342.4931
5f6→5g82.70422.3829
5f8→5g80.52630.4650
5f8→5g103.11742.7455
7s2→7p22.57502.4195
7s2→7p43.56483.3636
6d4→7p22.00981.9415
6d4→7p40.75250.7381
6d6→7p42.41122.3331
Table 4. Transition rate (in s 1 ) of E2 ( A R C C E 2 ) in plasma screened and unscreened medium. Here, we have used our RCC matrix element (in a.u) and RCC wavelength (in Å). Note that the notation P ( Q ) in the case of transition rates means P × 10 Q .
Transitions μ = 0 μ = 0.025 μ = 0.050 μ = 0.075 μ = 0.1
Ar 7 +
3p4 → 4f61.4501 (+06)1.4349 (+06)1.3927 (+06)1.3250 (+06)1.2333 (+06)
3p4 → 4f86.5288 (+06)6.4605 (+06)6.2705 (+06)5.9658 (+06)5.5526 (+06)
3s2→ 3d42.1840 (+05)2.2032 (+05)2.2179 (+05)2.2417 (+05)2.2742 (+05)
3s2⟶ 3d62.1919 (+05)2.2126 (+05)2.2256 (+05)2.2494 (+05)2.2819 (+05)
3d4 → 5g82.7225 (+06)2.6258 (+06)2.3685 (+06)1.9874 (+06)
3d6 → 5g83.0252 (+05)2.9179 (+05)2.6352 (+05)2.2077 (+05)
3d6 → 5g103.0267 (+06)2.9190 (+06)2.6362 (+06)2.2085 (+06)
Kr 7 +
4s2⟶ 4d48.9514 (+05)8.7868 (+05)8.6208 (+05)8.3473 (+05)
4s2⟶ 4d69.1180 (+05)8.9640 (+05)8.7912 (+05)8.5066 (+05)
5p2 → 4f67.0537 (−01)8.9779 (−01)3.0592 (00)
5p4 → 4f82.3536 (−01)2.9840 (−01)1.4702 (00)
5d6 → 5g82.7840 (+03)2.6100 (+03)
5d6 → 5g102.9352 (+04)2.6114 (+04)
Xe 7 +
5s2→ 5d46.6714 (+05)6.7116 (+05)
5s2→ 5d66.9674 (+05)7.0069 (+05)
5p2 → 5p46.0045 (−01)6.1555 (−01)5.6058 (−01)
5p2 → 4f68.5467 (+03)2.7288 (+04)3.3098 (+04)
5p4 → 4f61.2882 (+03)2.0657 (+03)2.6049 (+03)
5p4 → 4f85.9866 (+03)1.2836 (+04)1.6523 (+04)
5p2→ 5f61.6471 (+06)1.5379 (+06)
5p4→ 5f64.3300 (+05)4.0395 (+05)
5p4→ 5f81.9479 (+06)1.8169 (+06)
4f6 → 5f65.9296 (+04)5.4103 (+04)
4f6 → 5f87.4168 (+03)6.7680 (+03)
4f8 → 5f69.9224 (+03)9.0350 (+03)
4f8 → 5f86.2129 (+04)5.6576 (+04)
5d4→ 6s25.3813 (+03)
5d4 → 5g81.1670 (+06)
5d6 → 5g81.2597 (+05)
5d6→ 5g101.2601 (+06)
5d6→ 6s27.0259 (+03)
Rn 7 +
6s2 → 6d41.0243 (+06)9.8377 (+05)
6s2 → 6d61.0371 (+06)9.9749 (+05)
6p2 → 5f65.0885 (+04)5.4520 (+04)
6p4 → 5f63.2019 (+03)3.5290 (+03)
6p4 → 5f81.5773 (+04)1.7127 (+04)
6d4 → 5g86.3782 (+05)
6d6 → 5g86.2707 (+04)
6d6 → 5g106.2238 (+05)
6p2 → 6p41.2855 (+02)1.2763 (+02)
7p2 → 7p41.5299 (+01)
6p4 → 7p42.3245 (+05)
5f6 → 7p21.4611 (+04)
5f6 → 7p43.0317 (+03)
5f8 → 7p41.7756 (+04)
Table 7. Critical values of plasma screening strength ( μ c ) in a.u. for the following ions.
Kr 7 + Xe 7 + Rn 7 +
State μ c State μ c State μ c
4d40.0871525s20.0769875s20.046401
4d60.0869565p20.0661496p20.039652
5p40.0644746p40.036763
4f60.0515266d40.027521
4f80.0514866d60.027100
5d40.048395
5d60.048139
Disclaimer/Publisher’s Note: The statements, opinions and data contained in all publications are solely those of the individual author(s) and contributor(s) and not of MDPI and/or the editor(s). MDPI and/or the editor(s) disclaim responsibility for any injury to people or property resulting from any ideas, methods, instructions or products referred to in the content.

