
Stabilizing Frequency of a Diode Laser to a Reference Transition of Molecular Iodine through Modulation Transfer Spectroscopy

1
CSIR—National Physical Laboratory, Dr. K. S. Krishnan Marg, New Delhi 110012, India
2
Academy of Scientific and Innovative Research (AcSIR), Ghaziabad 201002, India
3
Inter-University Centre for Astronomy and Astrophysics (IUCAA), Post Bag 4, Pune 411007, India
*
Authors to whom correspondence should be addressed.
†
These authors contributed equally to this work.
Atoms 2023, 11(5), 83; https://doi.org/10.3390/atoms11050083
Submission received: 5 March 2023
/
Revised: 5 May 2023
/
Accepted: 10 May 2023
/
Published: 12 May 2023
(This article belongs to the Special Issue Recent Advances in Atomic and Molecular Spectroscopy)
Abstract
:We report the frequency stabilization of an external cavity diode laser (ECDL) to a reference molecular iodine (I2) transition at 13,531.18 cm−1 (739.03382 nm). Using the Modulation Transfer Spectroscopy (MTS) method for the highly sensitive detection of weak absorption signals, the Doppler-free absorption peaks of I2 corresponding to the hot band transition R(78) (1–11) are resolved. The ECDL’s frequency is stabilized with respect to one of the lines lying within the reference absorption band. For this, the iodine vapor cell is heated to 450 °C and the corresponding circularly polarized pump and probe beam powers are maintained at 10 mW and 1 mW, respectively, to avoid power broadening. The short (100 ms) and long-term (50 h) linewidths of the frequency stabilized laser are measured to be 0.75(3) MHz and 0.5(2) MHz, respectively, whereas the natural linewidth of the specific I2-transitions lie within a range of tens of MHz.
1. Introduction
The frequency stabilization of lasers is a pre-requisite to perform any laser spectroscopy measurements and the requirements become stringent for precision spectroscopy-based experiments, such as, for example, the development of optical clocks, quantum computation, exploring fundamental physics, etc. [1,2,3,4,5,6]. Significant advancement has indeed been achieved in this field, and at present, several simple to set up and state-of-the-art complex techniques for stabilizing a laser’s frequency are attainable. One commonly used technique is based on frequency referencing with respect to a Doppler-free absorption peak, which is an atomic reference, obtained through Saturated Absorption Spectroscopy (SAS) of an atomic or molecular transition [7,8,9]. Another widespread technique is frequency locking to a Fabry–Perot cavity [10,11,12] by virtue of the Pound–Drever–Hall (PDH) frequency stabilization method [13,14]. This is further modified to suit the transfer cavity technique, which allows the simultaneous stabilization of multiple laser frequencies [15,16,17,18]. Software-based locking is also another ready-to-use approach that is in use in various experiments [19,20,21]. Furthermore, optical frequency combs provide accurate references, which are widely used for simultaneous and long-term locking of multiple laser frequencies. The choice of a locking technique depends on experimental demand. For example, the probing of an optical clock transition demands relative frequency instabilities of 10 or better whereas the laser cooling of atoms can be performed with ≤10 fractional frequency instability. The present work describes the frequency stabilization of an external cavity diode laser (ECDL) operating at 739.05 nm using SAS of molecular iodine (I2) transitions and characterizes the stability of the laser frequency. Additionally, the effects of varying cell temperature and laser intensity on the amplitude of Doppler-free peaks have been investigated.
In recent years, there has been extensive advancement in research works on building quantum computers/simulators, clocks and sensors. Of the many ionic candidates, Ytterbium ion (Yb+) is in prime focus, and its isotopes Yb171, Yb172 and Yb174 are used for the accomplishment of frequency metrology, quantum information processing, quantum computation and simulation [1,22,23]. For the successful realization of all such experiments, minimizing the inherent motion of the trapped Yb+ is an indispensable step that is achieved by probing its cooling transition 2S→P at 369.526 nm. To ensure good repeatability of the measurands and good statistical analysis, stabilizing the cooling laser is vital. The cooling wavelength at 369.526 nm is produced by generating the second harmonic of a laser with a fundamental wavelength of 739.052 nm. The iodine spectrum consists of an absorption line at 405,654 GHz corresponding to 739.033 nm, which is 10 GHz away from 739.052 nm. In our article, the studied range of wavelength 739.03–739.06 nm is within the vicinity of this wavelength. The iodine molecule, therefore, serves as a convenient frequency reference for stabilizing the diode laser. Therefore, the described iodine-SAS-based laser frequency stabilization technique, while using a frequency-doubled light to generate lasing at the desired 369.526 nm wavelength, which is typically, if not always, the scenario, can be widely used for any Yb+-based experiment. The presented set-up is reasonably compact and easy to construct and is tested to be robust. Therefore, this simple setup together with extracted spectroscopic information of the iodine lines within the 739.03–739.06 nm wavelength can be of advantage for many users experimenting on Yb+. Additional lasers used in the trapped Yb+ research for photoionization and repump purposes can also be simultaneously locked to the iodine-stabilised laser using various techniques, thus rendering a concise optical setup.
2. Iodine Spectra
I2 is one of the most commonly used species for reference absorption lines over the wavelength range 514 nm (19,455 cm−1) to 892 nm (11,211 cm−1) and have been extensively studied by various groups [24,25,26,27,28,29,30]. It has closely spaced transitions ranging from visible to near-infrared wavelengths [30,31]. Figure 1 shows the absorption lines over a frequency range of ≈15 GHz starting from ≈ 405,640.22 GHz, i.e., ≈739.06 nm or ≈13,532 cm−1.
The stabilization of a laser’s output frequency to a desired reference frequency requires a feedback control that is directly related to the offset of the operating frequency with respect to the reference frequency. The feedback control signal is commonly known as the error signal as it is related to the detuning or offset of the laser frequency from its desired operational frequency. The feedback control signal or the error signal is connected to the laser controller for introducing the desired frequency corrections when required. In the present study, the transition frequency of molecular iodine has been used as the reference frequency. The resonance lines of iodine around 739.05 nm are a result of a hot band transition R(78) (1–11). Since this transition results due to excitation from a non-ground vibrational level to further higher energy levels, it is therefore necessary to heat the iodine cell to about 450 °C to sufficiently populate the desired higher vibrational level to achieve appreciable signal strength [32,33]. To perform Doppler-free spectroscopy, a counterpropagating pair of laser beams, one more intense (pump beam) than the other (probe beam) but of the same frequency, are allowed to interact with the molecules of the vapor cell while being swept over a frequency range. Both probe and pump beams interact with the gas molecules over a certain velocity range. The overlap between these two velocity ranges gives a subset of molecules that interact with both beams. The pump beam, being more intense, excites a greater population of these molecules, leaving them unavailable for the probe beam to interact with. The Doppler-broadened absorption signal, therefore, encounters Doppler-free dips corresponding to this velocity class range. Thus, instead of locking a laser’s frequency to an absorption spectrum of some hundreds of MHz, it can be stabilized with respect to that of a few tens of MHz. As the Doppler-free signals that we are trying to detect are a result of temperature-dependent transition, the resulting signal is weak. We therefore perform Modulation Transfer Spectroscopy (MTS) for their effective detection, which gives a derivative of SAS with a usable signal-to-noise (S/N) ratio [34,35,36,37] and the resulting error signals’ zero crossings are centered on the corresponding maximum absorption. In this method, the frequency of the pump beam is modulated using an acousto-optical modulator (AOM), whereas that of the probe remains unmodulated. The work of J. J. Snyder et al. explains the interaction of the probe and frequency modulated pump beam by considering saturation spectroscopy as a nearly degenerate four-wave mixing process [38]. If is the laser/probe frequency and and be the AOM’s operating frequency and the low frequency at which the pump beam is modulated, respectively, Doppler-free resonance is achieved when
Thus, the pump beam’s interaction with vaporized I2 in the cell transfers the frequency-modulated sidebands to the counter-propagating probe beam [34]. At this laser frequency, the signal generated from four-wave mixing is ± . Hence, the phase-sensitive detection of the probe beam results in the Doppler-free features of the transition lines [39,40]. For the demodulation of the signal, a lock-in amplifier is used.
3. Experimental Setup
In this section, the arrangements and equipment used for carrying out the experiment and optimizing the desired signal are discussed. The iodine cell (from Precision Glassblowing, Colorado, United States)used in the experiment has a path length of 30 cm, a clear diameter of 25 mm with fused silica Brewster’s angle windows and a 15 cm long cold finger towards one end of the cell. To ensure uniform heating, the iodine cell is wrapped with a fiberglass-insulated heat tape followed by numerous layers of aluminium foil and glass wool and kept inside an aluminium container. The cell temperature is carefully increased so as to avoid any sudden expansion or contraction. The entire I2 oven is stored inside a multi-layer heat shield so that its outer part remains at room temperature even if the cell is at ≈700 °C. In this arrangement, the cold finger stays outside at room temperature. To keep a trail of the cell temperature, a pair of J-type thermocouples connected to a digital thermometer are kept in contact with either end of the cell. The cold finger is kept at room temperature so that, due to the huge difference in temperatures of the cell and the finger, the pressure difference results in pushing some iodine molecules towards the cold finger where they eventually crystallize. This narrows down collisional probability between molecules and hence reduces pressure broadening. A copper mesh is wrapped around the cold finger to conduct heat away from the surroundings. The iodine vapor pressure at room temperature can be controlled through the cold finger but for producing high vapor pressure, the iodine cell is heated to a higher temperature (up to 700 °C).
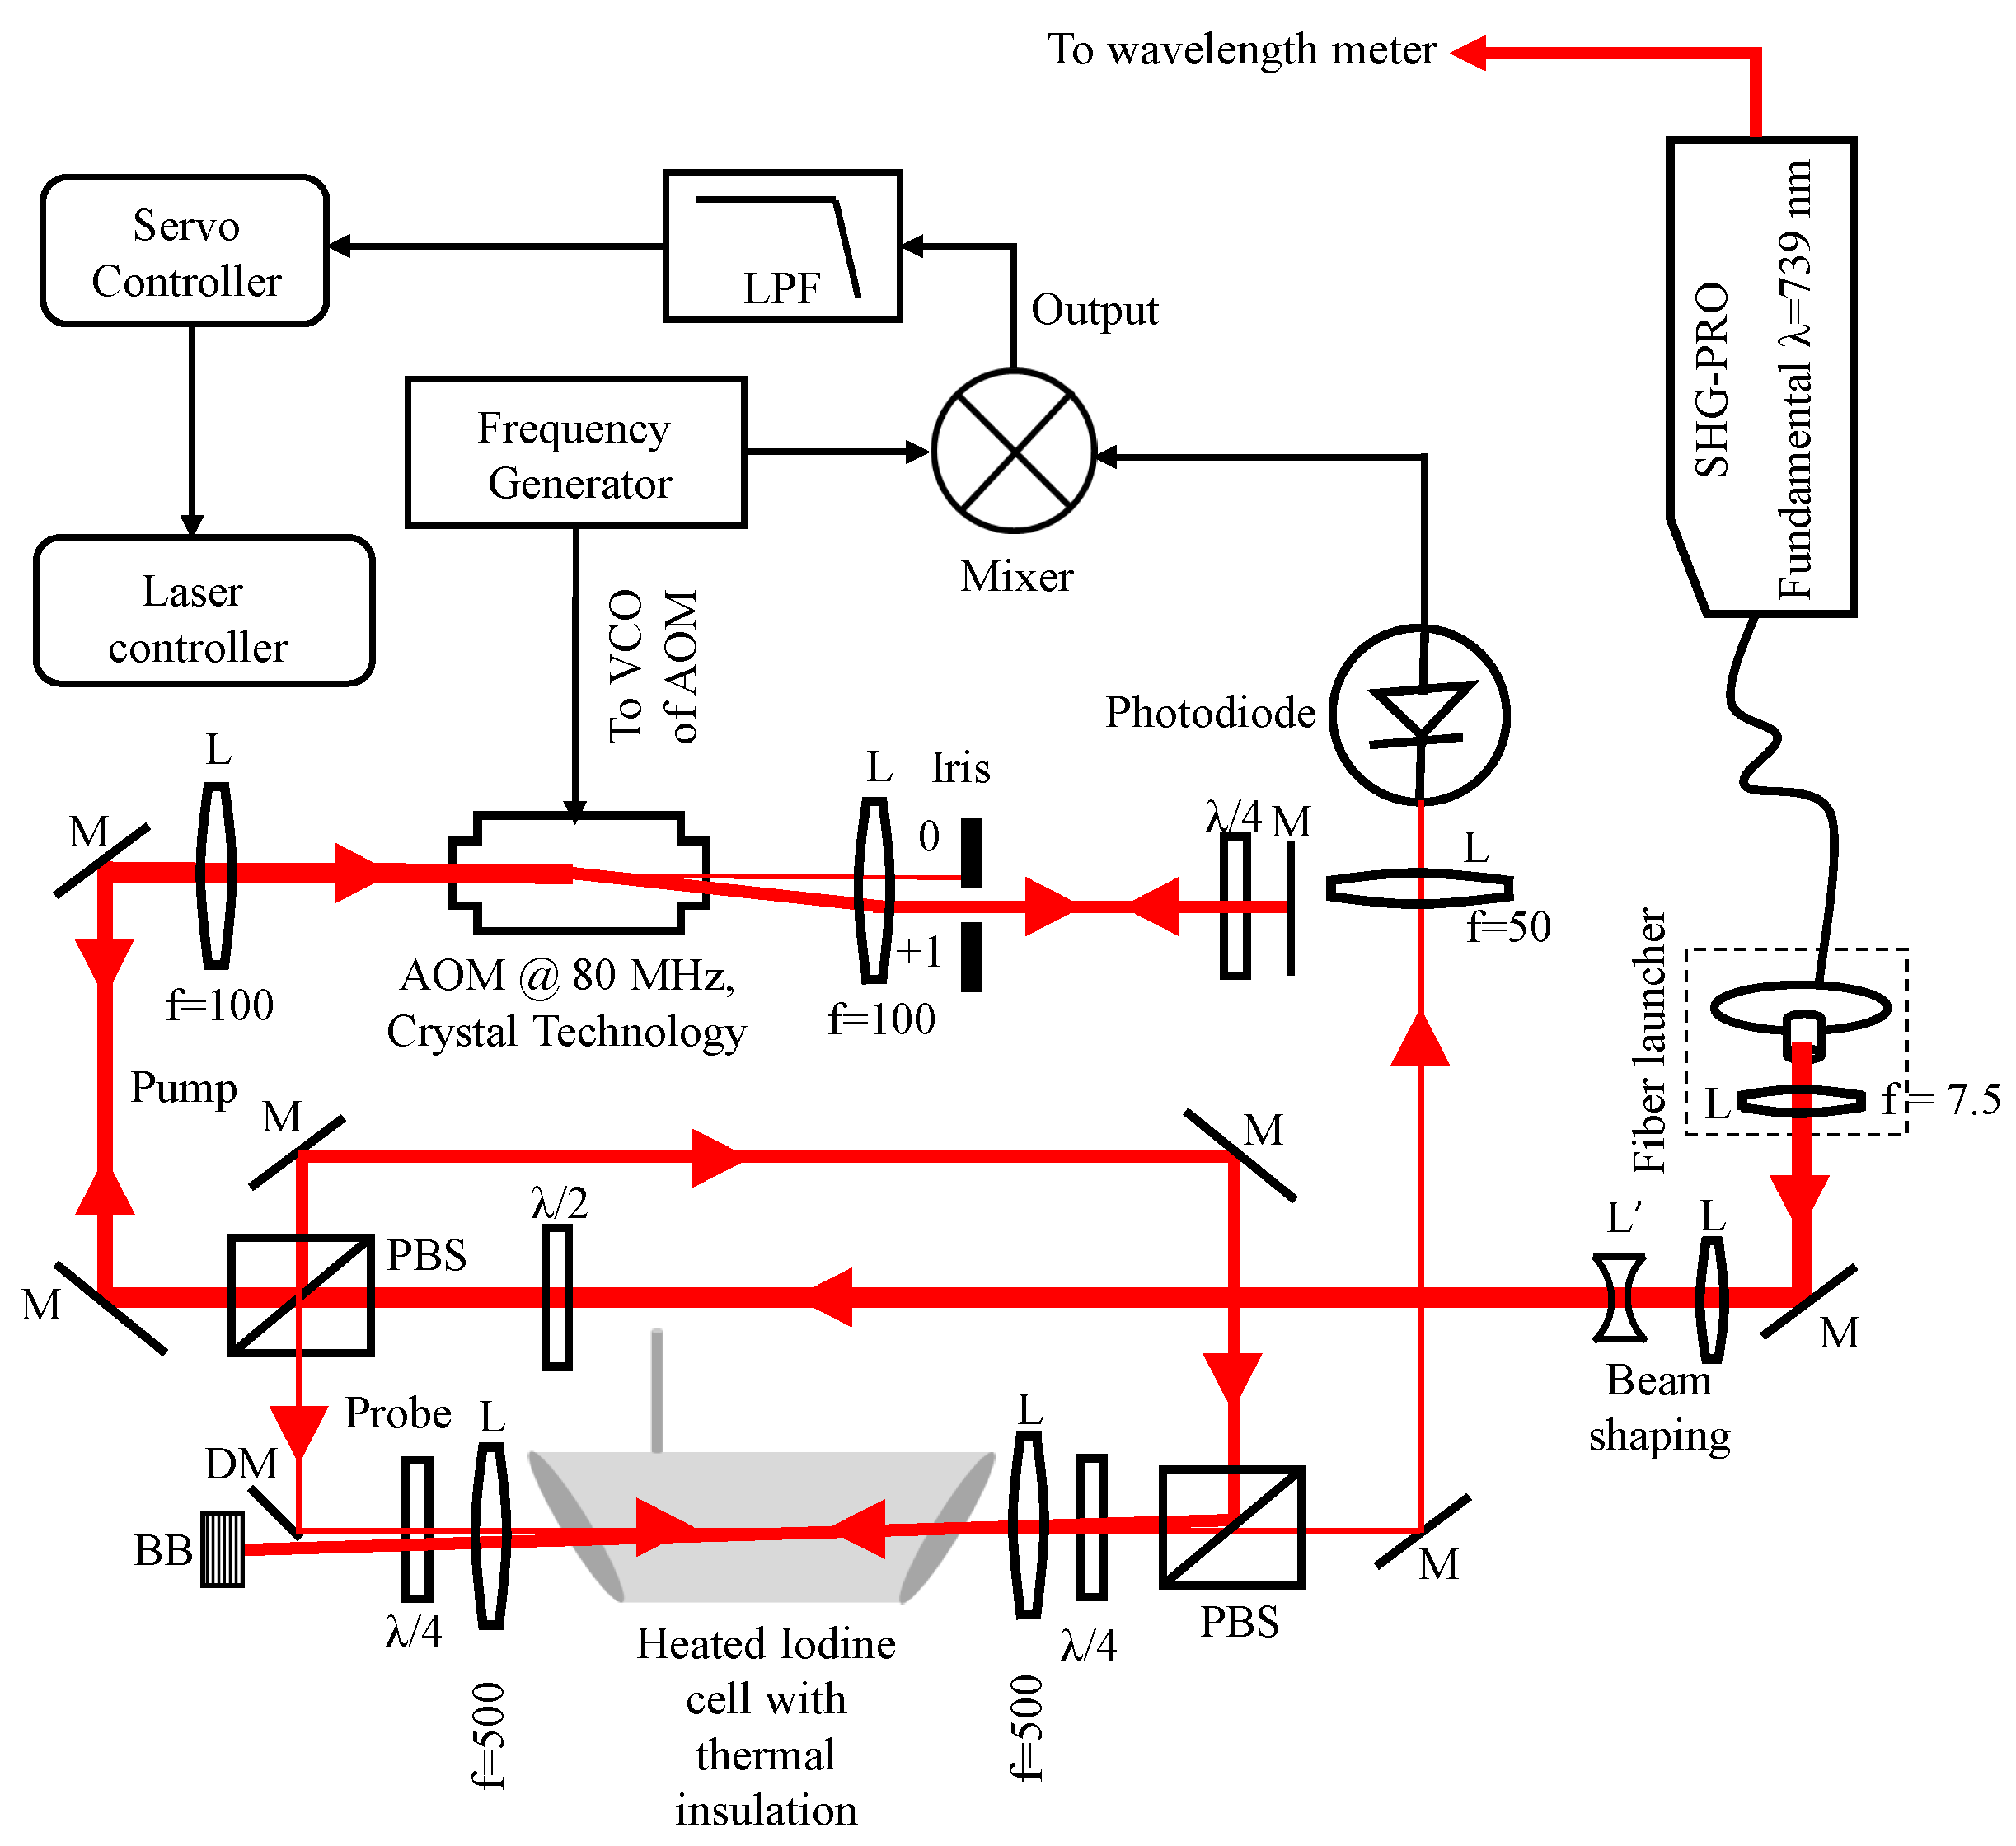
A schematic of the experimental setup for achieving SAS of iodine molecules is demonstrated in Figure 2. The frequency doubled laser system (TA-SHG Pro, Toptica, Munich, Germany) with 739.05 nm as its fundamental wavelength has three outputs. Of these, the 3 mW fundamental output is used for monitoring the laser’s wavelength using a commercial wavelength meter (WS7, High Finesse). The second fundamental output of power 30 mW is used for the SAS experiment and is split into probe (reflected part) and pump (transmitted part) beams using a polarizing beam splitter (PBS), as shown in Figure 2. A half waveplate after the PBS allows us to adjust the power distribution between the probe and pump beams. The probe beam entering the iodine cell is circularly polarized and the pump beam is passed through an AOM (R46080-1-LTD, Gooch & Housego, Ilminster, England) arranged in a double-pass configuration [41] and is operated at 80 MHz. This is used for frequency modulation of the pump beam as well as for fine-tuning its frequency in locked conditions. On passing twice the quarter waveplate placed behind AOM, the polarization of the pump beam changes and so while retracing back the path to PBS, it now gets reflected. The reflected pump beam is again passed through a combination of PBS and a quarter waveplate, it thus enters the iodine cell as a circularly polarized beam. The double-pass configuration exterminates the requirement of re-aligning the optics on varying operating frequencies of the AOM. As required by the MTS technique, the pump beam is frequency modulated at 60 kHz by feeding a sinusoidal wave to the home-made AOM driver [15]. The modulation frequency is chosen such that the error signal is obtained with a good S/N ratio. The power of the pump and probe beams are kept at a ratio of 10:1 and finally sent into the cell in a nearly counter-propagating direction with maximum relative overlapping.
The S/N opted from an SAS experiment depends on the efficient overlapping of the probe and pump beams; otherwise, the depletion of particular velocity-class atoms caused by the pump beam will not influence the absorption of the probe beam. To maximize the interaction between the laser and the iodine molecules and better overlapping, we initially attempted experimenting with collimated pump and probe beams of larger diameter inside the iodine cell (for example, beam diameter = 15 mm, pump beam power = 10 mW, pump beam intensity = 5.6 mW/cm2) for the spectroscopy. This, however, proved to be ineffective as a larger beam diameter results in lower laser intensity; hence, the pump beam may not have an intensity high enough to saturate the iodine molecules. To have a lesser beam waist and hence higher intensities, we focused down the counter-propagating beams into the cell using two bi-convex lenses of focal length 500 mm. The probe beam after passing through the cell is focused onto a fast photodiode (APD430A/M, Thorlabs, New Jersey, United States) for signal detection. For signal demodulation, we use a Digital laser locking module (DigiLock 110, Toptica, Munich, Germany) to which the photodiode signal is fed and the error signal is obtained. The laser controller is used for scanning the output frequency of the laser.
4. Results and Discussions
In this section, we discuss the relevant outcomes of the experiment.
4.1. SAS Signal
The output of the laser was scanned over a frequency range of ≈1 GHz from 739.0332 nm to 739.0349 nm to probe the R(78) (1–11) lines containing 15 components a1 to a15. Figure 3a shows the experimentally obtained Doppler-broadened signal in the absence of the pump beam and the SAS signal. For any comparison with the theoretically estimated signals, we used the program IodineSpec5 [42], which was developed by H. Knckel and E. Tiemann and based on iodine atlas [26,27,28,29,33,43,44,45,46,47,48]. The theoretically estimated Doppler-broadened signal at 450 °C has a full width at half maximum (FWHM) of ≈856 MHz and that obtained from our experiment is 903(3) MHz. Figure 3b depicts the hyperfine transitions as obtained from IodineSpec5 for the same wavelength range. For a better identification of the Doppler-free spectra and comparison with the theoretically estimated lines, the experimental Doppler-broadened signal was subtracted from the Doppler-free spectra, and the same is illustrated in Figure 3b. The analysis of the obtained spectra shows a total of six Doppler-free features of R(78) (1–11) line as labeled in the figure; their measured transition frequencies and FWHM are given in Table 1 and compared with those obtained from IodineSpec5. Additionally, all the observed peaks are in perfect alignment with their corresponding first derivatives in the lock signal. The experimental signals were obtained with 1 mW probe power and 10 mW pump power. As can be seen from the error signals in Figure 3b, the Doppler-free spectra 1, 4 and 6 are clearly distinct whereas spectra 2, 3 and 5 are results of not properly resolved four, four and three hyperfine peaks, respectively. The hyperfine lines for feature 3 are almost resolved, and three and two of them are resolved for peaks 2 and 5, respectively. The output of the diode laser can preferably be locked to any of the resolved peaks 1, 4 or 6 having an FWHM of 23(3) MHz, 21(2) MHz and 23(4) MHz, respectively, as compared to hundreds of MHz of a Doppler-broadened signal.
The intensity distribution pattern of the Doppler-free profile ignoring any inhomogenous broadening is of the form
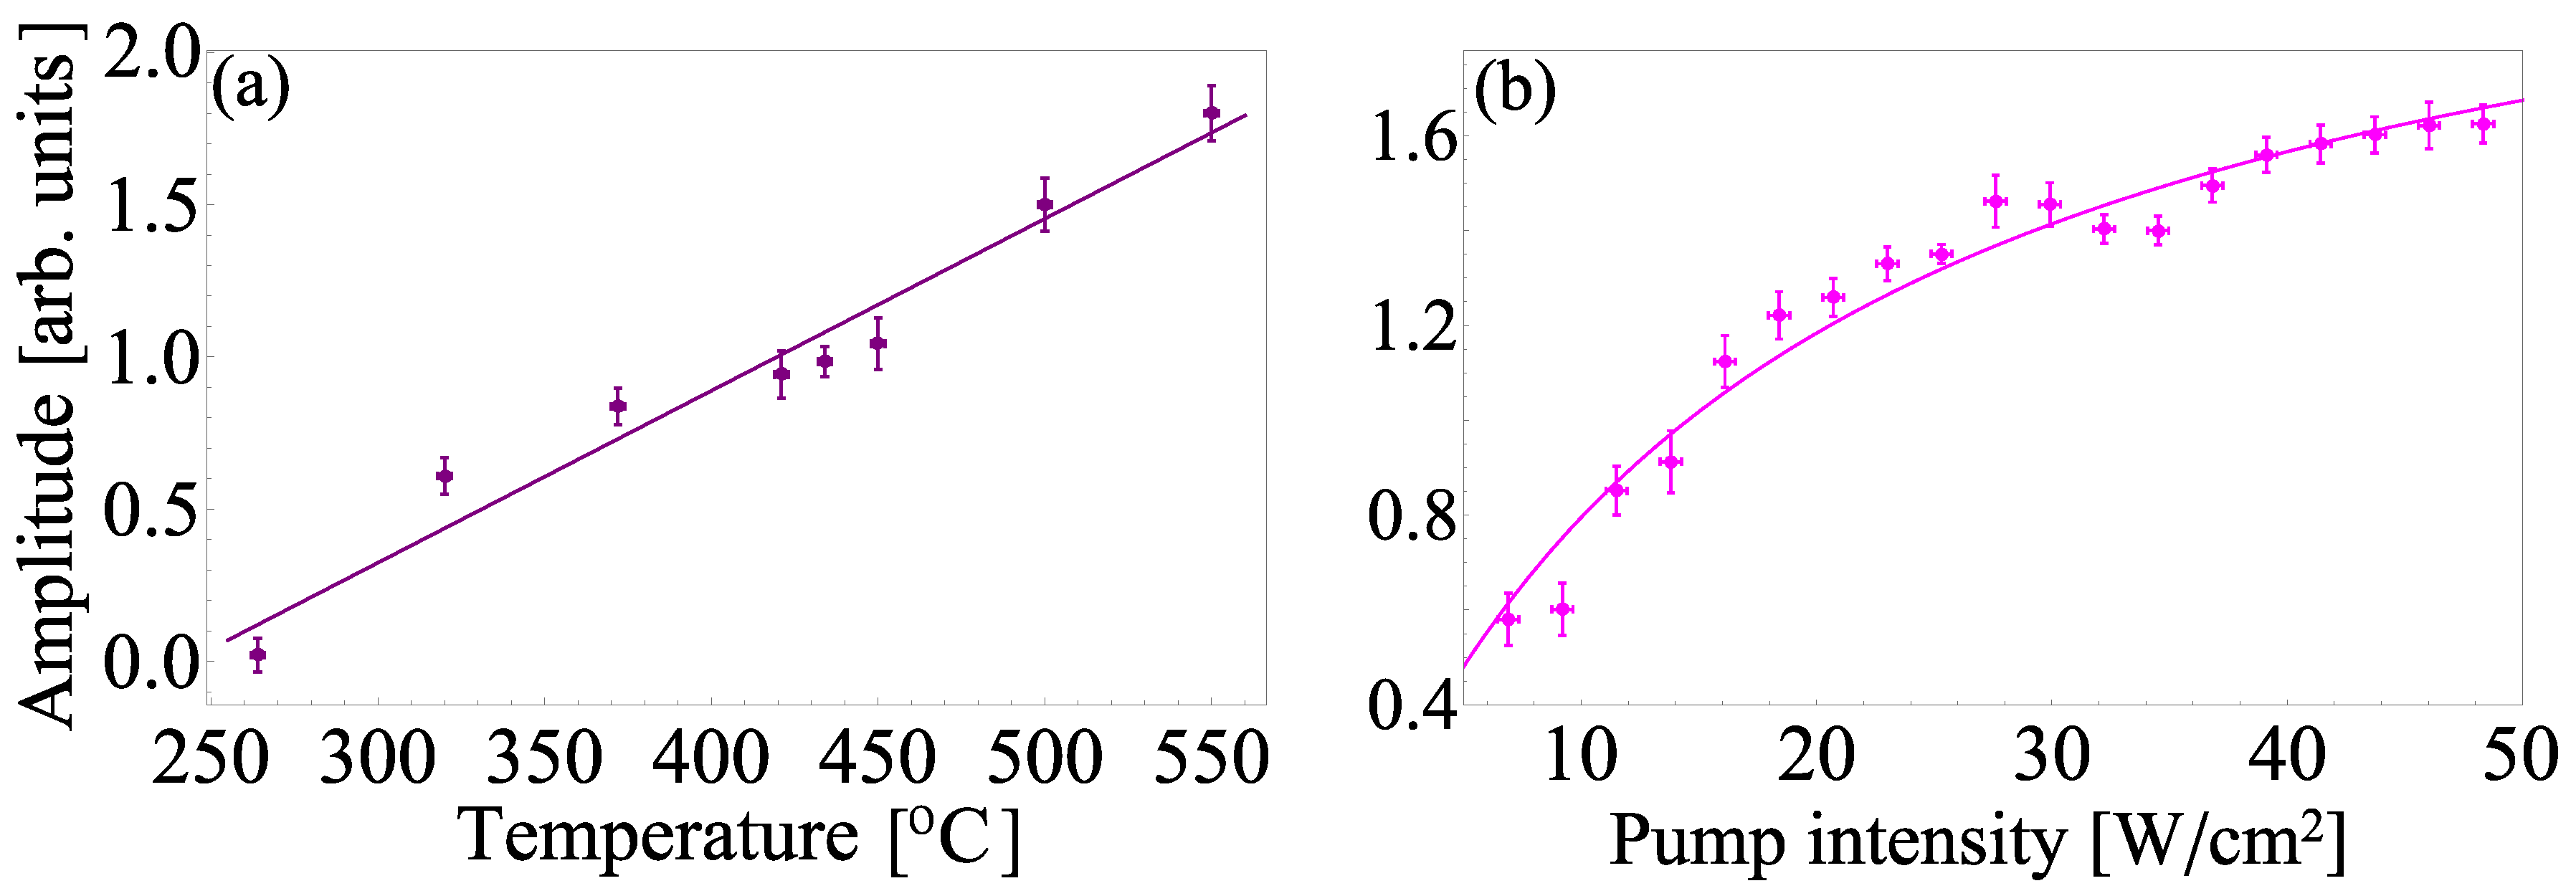
where A is a constant proportional to , which is the difference in population in the excited and ground states, I is the beam intensity, is the saturation intensity and is the resonant frequency [49]. At higher temperatures, more molecules are prepared in the excited state, meaning an increase in , and hence an increase in . A look at Equation (2) also implies that increased laser intensity will result in increased Doppler-free signal intensity. To analyze the same, we studied the effect of iodine cell temperature and pump beam intensity on the amplitude of the Doppler-free spectra and presented the variation in Figure 4. Keeping the pump and probe power fixed to 10 mW and 1 mW, respectively, the cell temperature was varied from 264 °C to 560 °C and the corresponding variation in amplitude of Doppler-free spectrum 4 was noted. On changing the cell temperature, measurements were recorded only after ensuring that thermal equilibrium has reached. The cell is not heated beyond 600 °C to avoid any damage. As is apparent from Figure 4a, the peak amplitude increases with the rise in temperature, which is obvious as increased temperature heavily populates the desired state with more iodine molecules. It is also quite clear from Figure 4a that at temperatures below 243 °C, the amplitude of the peaks is not high enough for them to be well resolved. Furthermore, keeping probe power fixed at 1 mW and cell temperature at 450 °C, the pump power is varied and the corresponding observation is shown in Figure 4b from which we infer that the peak amplitude of the Doppler-free feature increases with an increase in pump beam power. This occurs because increased pump power implies increased intensity within the Rayleigh range, and hence, better interaction with the iodine molecules within that spatial range. If and are the light scattered from the population in the excited state and saturation intensity of the corresponding signal, respectively, then we have,
where and I are natural linewidth of the transition and pump beam intensity, respectively [50]. The solid line in Figure 4b is the fitted plot obtained using Equation (3) which gives = 19(2) W/cm2.
4.2. Laser Stabilization
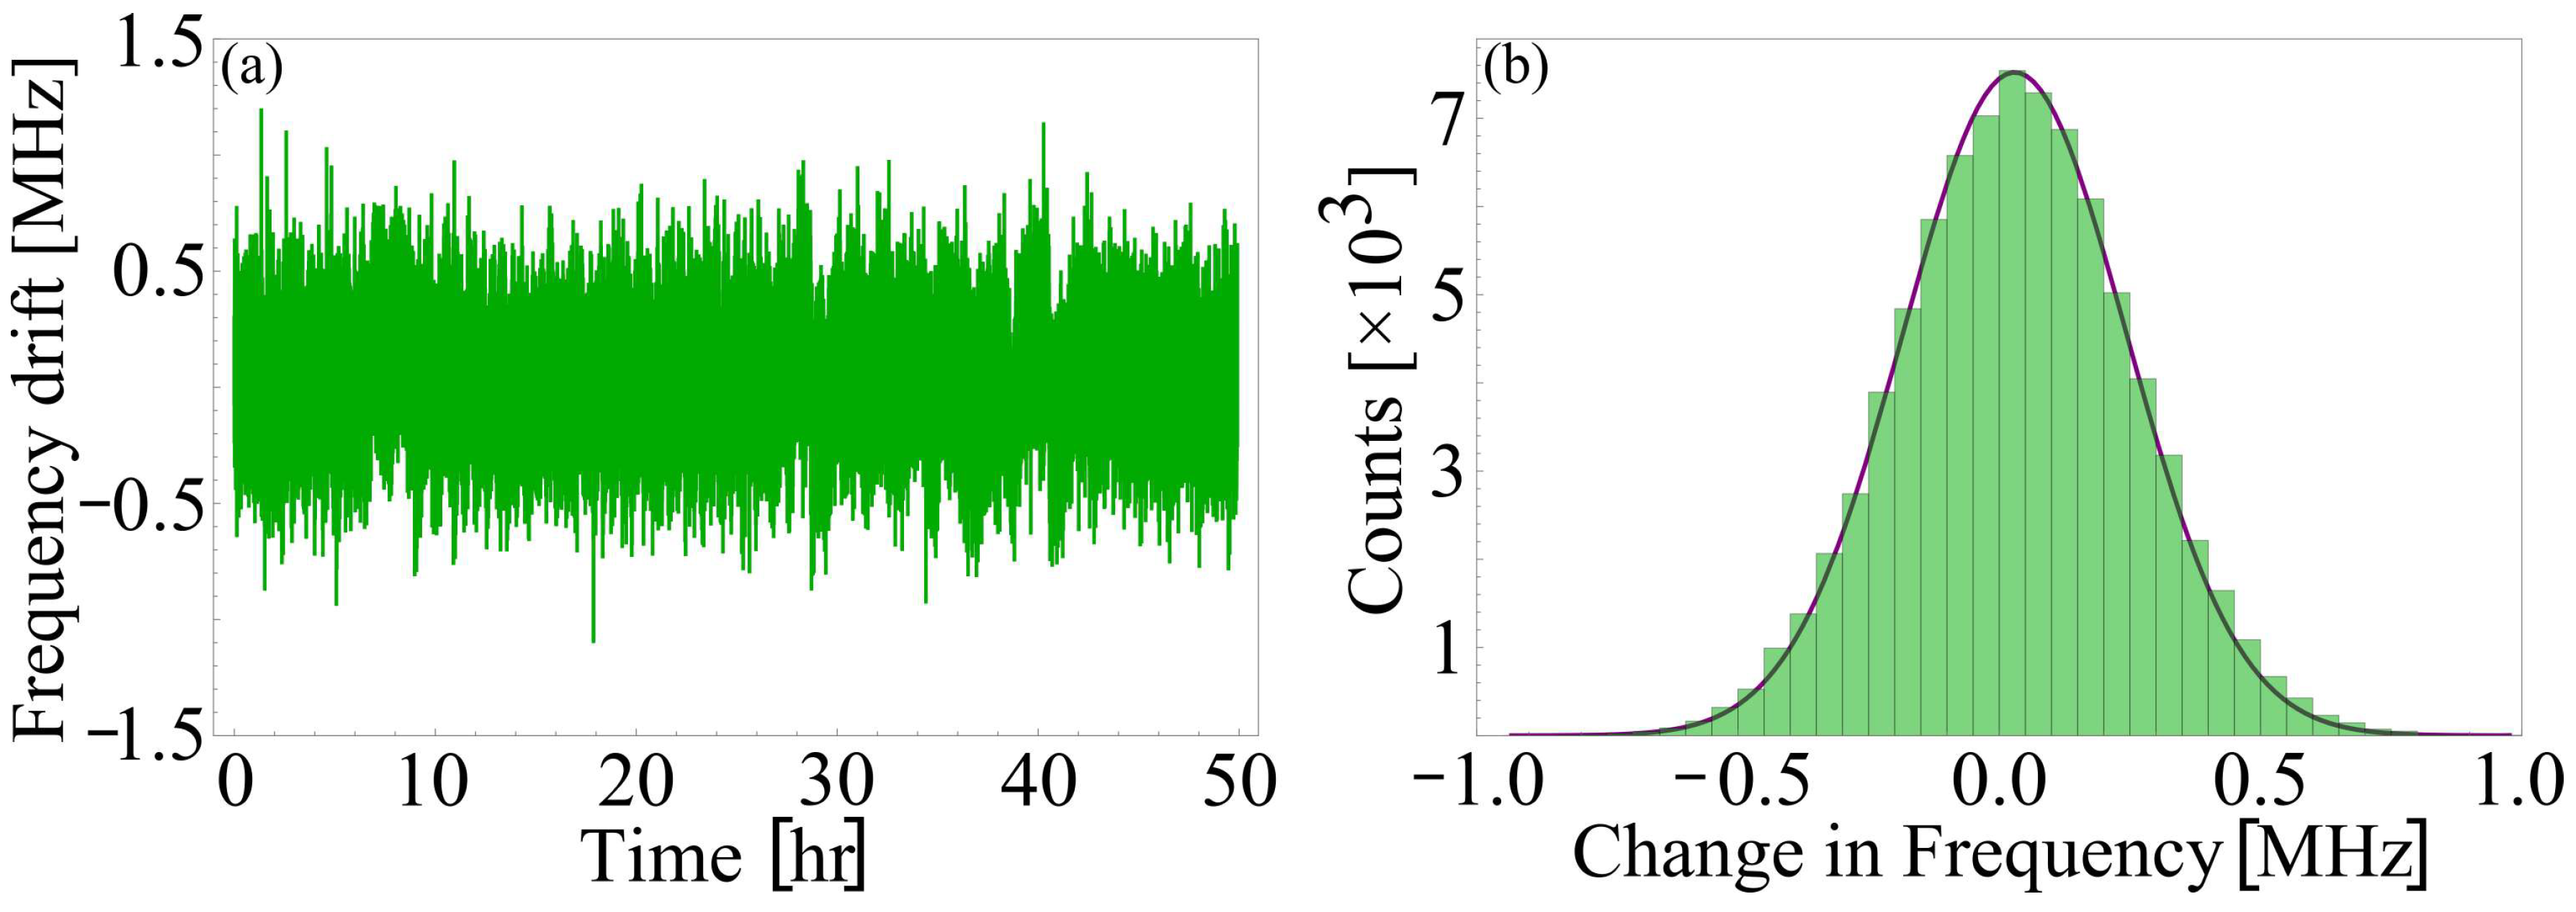
The main objective behind studying the I2 SAS was the frequency stabilization of a diode laser with respect to one of the Doppler-free spectra and we chose feature 4, as shown in Figure 3 or component a10 for this purpose. The frequency scan range was first reduced across a10. For locking the laser with respect to the peak of the spectra, an error signal was required. The pump signal was therefore modulated with a sine wave of frequency 60 kHz and amplitude 1.9 V. The probe beam interacted with the frequency-modulated pump and the resulting signal on the photodiode was fed to the lock-in-amplifier where a mixer multiplied the carrier signal with a reference signal of the same frequency. The resultant was the error signal, which was further passed through a low pass filter of cutoff at 60 kHz. The phase difference between the reference and modulated signal in the lock-in amplifier was optimized to achieve an optimum error signal for tight locking. A proportional-integral-derivative (PID) controller with an input of the error signal generates a feedback signal, which was fed to the piezo driver of the laser for its active stabilization. In order to study the long-term instabilities in the locked frequency, data corresponding to laser stabilized over 50 h was collected and its histogram was obtained as represented in Figure 5. From the histogram, we found that the long-term linewidth of the laser was 0.5(2) MHz with a drift of 0.028(7) kHz/h.
4.3. Noise Density Profile
To measure the short-term stability of the frequency-stabilized laser, we obtained the Fast Fourier Transform (FFT) signal of the locked error signal corresponding to the Doppler-free peak no. 4. The data was collected using a spectrum analyzer (Model No. FSV 40, Rohde & Schwarz, Munich, Germany) and the voltage spectral density of the noise was acquired as presented in Figure 6. An analysis of the noise spectrum using rectangular noise spectrum approximation [51] gives information on laser linewidth as well as its short-term stability. The area under the curve shown in Figure 6 was integrated to evaluate the Root Mean Square Voltage, Vrms for the shown locked error signal on eliminating Vrms of the noise floor of the spectrum analyzer. The integrated Vrms for the SAS-generated error signal was found to be 0.0125(4) V, implying a short-term linewidth of 0.75(3) MHz of the 739 nm laser. The noise density was measured to be 1.8 μV/ @ 4 kHz which is the sole contribution of frequency noise of the fundamental frequency of the laser diode.
5. Conclusions
We stabilized an ECDL laser at its fundamental wavelength, and hence, its frequency doubled output to the peak of a hyperfine transition of an iodine molecule. The hyperfine transitions of molecular iodine around 739 nm within a frequency span of 1 GHz were observed by performing Modulation Transfer Spectroscopy. A total of six Doppler-free features were found to be centered at 739.03321 nm, 739.03352 nm, 739.03382 nm, 739.03416 nm, 739.03448 nm and 739.03454 nm. The intensities of the peaks were found to increase with increasing pump beam power as well as with cell temperature. Using the SAS-generated error signal from the lock-in amplifier as the feedback signal to the laser’s piezo controller, the laser was locked on the a10 component of R(78) (1–11) transition corresponding to 739.03382 nm. Its short-term and long-term linewidths were measured to be 0.75(3) MHz and 0.5(2) MHz, respectively. The locked laser was checked for a period of over 50 h and was found to be stable even under external perturbations. Its noise density was measured to be 1.8 μV/ @ 4 kHz. The obtained results show that the MTS-based locking on the molecular transition of iodine is an excellent technique to achieve very good long and short-term stability of the laser frequency, thus making it suitable for precision and quantum measurements.
Author Contributions
Conceptualization, S.D. and S.P.; methodology, L.S. and A.R.; software, L.S.; formal analysis, L.S. and A.R.; resources—fabrication of iodine oven, S.D.; writing—original draft preparation, L.S. and A.R.; writing—review and editing, S.D., S.P., A.R. and L.S.; visualization—designing optical setup, S.D., L.S. and A.R.; supervision, S.D. and S.P. All authors have read and agreed to the published version of the manuscript.
Funding
L. Sharma thanks DST for the INSPIRE fellowship, and A. Roy thanks CSIR for the SRF Fellowship.
Data Availability Statement
The data presented in this study are available on request from the corresponding author.
Acknowledgments
We acknowledge CSIR-NPL for supporting this work. We thank Horst Knckel and Eberhard Tiemann, Institut fr Quantenoptik, Universitt, Hannover, Germany for providing the Iodine Spec5 software at free of cost.
Conflicts of Interest
The authors declare no conflict of interest.
References
- Huntemann, N.; Sanner, C.; Lipphardt, B.; Tamm, C.; Peik, E. Single ion atomic clock with 3 × 10⁻¹⁸ systematic uncertainty. Phys. Rev. Lett. 2016, 116, 063001. [Google Scholar] [CrossRef] [PubMed]
- Ludlow, A.D.; Boyd, M.M.; Ye, J.; Peik, E.; Schmidt, P.O. Optical atomic clocks. Rev. Mod. Phys. 2015, 87, 637–701. [Google Scholar] [CrossRef]
- Häffner, H.; Roos, C.F.; Blatt, R. Quantum computing with trapped ions. Phys. Rep. 2008, 469, 155–203. [Google Scholar] [CrossRef]
- Hosaka, K.; Webster, S.A.; Blythe, P.J.; Stannard, A.; Beaton, D.; Margolis, H.S.; Lea, S.N.; Gill, P. Optical Frequency Standards and Clocks Based on Single Trapped Ions. IEEE Trans. Instrum. Meas. 2005, 54, 759. [Google Scholar] [CrossRef]
- Maleki, L.; Prestage, J. Applications of clocks and frequency standards: From the routine to tests of fundamental models. Metrologia 2005, 42, S145–S153. [Google Scholar] [CrossRef]
- Wineland, D.J.; Leibfried, D. Quantum information processing and metrology with trapped ions. Laser Phys. Lett. 2011, 8, 175–188. [Google Scholar] [CrossRef]
- Preston, D.W. Doppler-free saturated absorption: Laser Spectroscopy. Am. J. Phys. 1996, 64, 1432. [Google Scholar] [CrossRef]
- Debs, J.E.; Robins, N.P.; Lance, A.; Kruger, M.B.; Close, J.D. Piezo-locking a diode laser with saturated absorption spectroscopy. Appl. Opt. 2008, 47, 5163. [Google Scholar] [CrossRef]
- Hall, J.L.; Bordé, C.J.; Uehara, K. Direct optical resolution of recoil effect using saturated absorption spectroscopy. Phys. Rev. Lett. 1976, 37, 1339–1342. [Google Scholar] [CrossRef]
- Roy, A.; De, S.; Arora, B.; Sahoo, B.K. Accurate determination of black-body radiation shift, magic and tune-out wavelengths for the 6S1/2→5D3/2 clock transition in Yb+. J. Appl. Phys. B 2017, 50, 205201. [Google Scholar]
- Yang, P.; Feng, S. Fabry–Perot cavity locking with phase-locked frequency-synthesized light. J. Opt. Soc. Am. B 2017, 34, 533–537. [Google Scholar] [CrossRef]
- Alnis, J.; Matveev, A.; Kolachevsky, N.; Udem, T.; Hänsch, T.W. Subhertz linewidth diode lasers by stabilization to vibrationally and thermally compensated ultralow-expansion glass Fabry–Perot cavities. Phys. Rev. A 2008, 77, 053809. [Google Scholar] [CrossRef]
- Drever, R.W.P.; Hall, J.L.; Kowalski, F.V.; Hough, J.; Ford, G.M.; Munley, A.J.; Ward, H. Laser phase and frequency stabilization using an optical resonator. Appl. Phys. B 1983, 31, 97–105. [Google Scholar] [CrossRef]
- Black, E.D. An introduction to Pound–Drever–Hall laser frequency stabilization. Am. J. Phys. 2001, 69, 79–87. [Google Scholar] [CrossRef]
- Roy, A. Developing Experimental Setup for Trapped Ion Based Optical Atomic Clock. Ph.D. Thesis, Academy of Scientific and Innovative Research, New Delhi, India, 2019. [Google Scholar]
- Roy, A.; Sharma, L.; Panja, S.; De, S. “Loop Stabilized” Improved Transfer Cavity-Based Laser Frequency Stabilization. IEEE J. Quantum Electron. 2022, 58, 1–6. [Google Scholar] [CrossRef]
- Riedle, E.; Ashworth, S.H.; Farrell, J., Jr.; Nesbittc, D.J. Stabilization and precise calibration of a continuous-wave difference frequency spectrometer by use of a simple transfer cavity. Rev. Sci. Instrum. 1994, 65, 42. [Google Scholar] [CrossRef]
- Subhankara, S.; Restelli, A.; Wang, Y.; Rolston, S.L.; Porto, J.V. Microcontroller based scanning transfer cavity lock for long-term laser frequency stabilization. Rev. Sci. Instrum. 2019, 90, 043115. [Google Scholar] [CrossRef]
- Couturier, L.; Nosske, I.; Hu, F.; Tan, C.; Qiao, C.; Jiang, Y.H.; Chen, P.; Weidemüller, M. Laser frequency stabilization using a commercial wavelength meter. Rev. Sci. Instrum. 2018, 89, 043103. [Google Scholar] [CrossRef]
- Saleh, K.; Millo, J.; Didier, A.; Kersale, Y.; Lacroute, C. Frequency stability of a wavelength meter and applications to laser frequency stabilization. Appl. Opt. 2015, 32, 9446–9449. [Google Scholar] [CrossRef]
- Kobtsev, S.; Kandrushin, S.; Potekhin, A. Long-term frequency stabilization of a continuous-wave tunable laser with the help of a precision wavelengthmeter. Appl. Opt. 2007, 46, 5840–5843. [Google Scholar] [CrossRef]
- De, S.; Sharma, A. Indigenisation of the Quantum Clock: An Indispensable Tool for Modern Technologies. Atoms 2023, 11, 71. [Google Scholar] [CrossRef]
- Nop, G.N.; Poudyal, D.; Smith, J.D.H. Ytterbium ion trap quantum computing: The current state-of-the-art. AVS Quantum Sci. 2021, 3, 044101. [Google Scholar] [CrossRef]
- Levenson, M.D.; Schawlow, A.L. Hyperfine Interactions in Molecular Iodine. Phy. Rev. A 1972, 6, 10. [Google Scholar] [CrossRef]
- Cariou, J.; Luc, P. Atlas du Spectre d’Absorption de la Molecule d’Iode 21,100 cm−1–23,800 cm−1; CNRS: Orsay, France, 1980. [Google Scholar]
- Gerstenkorn, S.; Luc, P. Atlas du Spectre d’Absorption de la Molecule d’Iode 15,600 cm−1–17,600 cm−1; Laboratoire Aimé Cotton, CNRS II: Orsay, France, 1977. [Google Scholar]
- Gerstenkorn, S.; Luc, P. Atlas du Spectre d’Absorption de la Molecule d’Iode 17,500 cm−1–20,000 cm−1; Laboratoire Aimé Cotton, CNRS II: Orsay, France, 1977. [Google Scholar]
- Gerstenkorn, S.; Luc, P. Atlas du Spectre d’Absorption de la Molecule d’Iode 14,000 cm−1–15,600 cm−1; Laboratoire Aimé Cotton, CNRS II: Orsay, France, 1978. [Google Scholar]
- Gerstenkorn, S.; Luc, P. Atlas du Spectre d’Absorption de la Molecule d’Iode 19,700 cm−1–20,035 cm−1; CNRS: Orsay, France, 1983. [Google Scholar]
- Gerstenkorn, S.; Verges, J. Atlas du Spectre d’Absorption de la Molecule d’Iode 7220 cm−1–11,200 cm−1; Laboratoire Aimé Cotton, CNRS II: Orsay, France, 1982. [Google Scholar]
- Herzberg, G. Molecular Spectra and Molecular Structure I. Spectra of Diatomic Molecules, 2nd ed.; D. Van Nostrand Company, Inc.: Princeton, NY, USA, 1950. [Google Scholar]
- Olmschenk, S.; Younge, K.; Moehring, D.; Matsukevich, D.; Maunz, P.; Monroe, C. Manipulation and detection of a trapped Yb+ hyperfine qubit. Phys. Rev. A 2007, 76, 052314. [Google Scholar] [CrossRef]
- Knöckel, H.; Bodermann, B.; Tiemann, E. High precision description of the rovibronic structure of the I2 B - X spectrum. Eur. Phys. J. D 2004, 28, 199. [Google Scholar]
- Shirley, J.H. Modulation transfer processes in optical heterodyne saturation spectroscopy. Opt. Lett. 1982, 11, 537. [Google Scholar] [CrossRef] [PubMed]
- Jaatinen, E.; Brown, N. Sequential frequency locking of three He-Ne lasers with ine external iodine stabilizer. Metrologia 1997, 34, 309. [Google Scholar] [CrossRef]
- Jaatinen, E.; Chartier, J.M. Possible influence of residual amplitude modulation when using modulation transfer with iodine transitions at 543 nm. Metrologia 1998, 35, 75. [Google Scholar] [CrossRef]
- McCarron, D.; King, S.; Cornish, S. Modulation transfer spectroscopy in atomic rubidium. Meas. Sci. Technol. 2008, 19, 105601. [Google Scholar] [CrossRef]
- Snyder, J.J.; Raj, R.K.; Bloch, D.; Ducloy, M. High-sensitivity nonlinear spectroscopy using a frequency-offset pump. Opt. Lett. 1980, 5, 163–165. [Google Scholar] [CrossRef]
- Hall, J.L.; Holberg, L.; Baer, T.; Robinson, H.G. Optical heterodyne saturation spectroscopy. App. Phys. Lett. 1981, 39, 680. [Google Scholar] [CrossRef]
- Bjorklund, G.C.; Levenson, M.D. Sub-Doppler frequency-modulation spectroscopy of I2. Phys. Rev. A 1981, 24, 166. [Google Scholar] [CrossRef]
- Donley, E.A.; Heavner, T.P.; Levi, F.; Tataw, M.O.; Jefferts, S.R. Double-pass acousto-optic modulator system. Rev. Sci. Instrum. 2005, 76, 063112. [Google Scholar] [CrossRef]
- Knöckel, H.; Tiemann, E. Basics and Usage of the Program IodineSpec5; Institut für Quantenoptik, Universität Hannover: Hanover, Germany, 2013. [Google Scholar]
- Martin, F.; Bacis, R.; Churassy, S.; Vergés, J. Laser-induced-fluorescence Fourier transform spectrometry of the X0g+ state of I2: Extensive analysis of the B0u+→ X0g+ fluorescence spectrum of 127I2. J. Mol. Spectr. 1986, 116, 71. [Google Scholar] [CrossRef]
- Cerny, D.; Bacis, R.; Vergés, J. Laser-induced-fluorescence Fourier transform spectrometry of the X0g+ state of I2: Extensive analysis of the B0u+→ X0g+ florescence spectrum of 127I, 129I and 129I2. J. Mol. Spectr. 1986, 116, 458. [Google Scholar] [CrossRef]
- Bodermann, H.; Knöckel, E.; Tiemann, E. Widely usable interpolation formulae for hyperfine splittings in the 127I2 spectrum. Eur. Phys. J. D 2002, 19, 31. [Google Scholar] [CrossRef]
- Bodermann, B. Untersuchung zur Realisierung eines Durchstimmbaren, Hochpräzisen Frequenzstandards im NIR und zur Erweiterung des Spektralbereiches mit Hilfe des 127I2-Moleküls. Ph.D. Thesis, Universität Hannover, Hanover, Germany, 1998. [Google Scholar]
- Salumbides, E.J.; Eikema, K.S.E.; Ubachs, W.; Hollenstein, U.; Knöckel, H.; Tiemann, E. The hyperfine structure of 129I2 and 127I 129I in the B3 - X1∑+g band system. Mol. Phys. 2006, 104, 2641. [Google Scholar] [CrossRef]
- Salumbides, E.J.; Eikema, K.S.E.; Hollenstein, W.U.; Knöckel, H.; Tiemann, E. Improved potentials and Born-Oppenheimer corrections by new measurements of transitions of 129I2 and 127I 129I in the B3 - X1∑+g band system. Eur. Phys. J. D 2008, 47, 171. [Google Scholar] [CrossRef]
- Demtröder, W. Laser Spectroscopy: Basic Concepts and Instrumentation, 3rd ed.; Springer: Heidelberg, Germany, 2002. [Google Scholar]
- Metcalf, H.J.; Van der Straten, P. Laser Cooling and Trapping, 1st ed.; Springer: New York, NY, USA, 1999. [Google Scholar]
- Windowing Signals. Available online: https://www.physik.uzh.ch/local/teaching/SPI301/LV-2015-Help/lvanlsconcepts.chm/Windowing{_}Signals.html (accessed on 24 November 2022).
Figure 1.
Absorption spectra of transitions of molecular iodine from 739.06 nm (405,640 GHz) to 739.03 nm (405,655 GHz) at 450 °C.
Figure 1.
Absorption spectra of transitions of molecular iodine from 739.06 nm (405,640 GHz) to 739.03 nm (405,655 GHz) at 450 °C.

Figure 2.
Representation of the experimental set-up along with the relevant optics and electronics for carrying SAS of iodine molecules and using its absorption line as a reference frequency to lock 739 nm laser. Here, M: mirror, D: D-Mirror L: convex lens, L′: concave lens, f: focal length of the lens in mm, PBS: polarizing beam splitter, /2: half waveplate, /4: quarter waveplate, VCO:Voltage controlled oscillator, LPF: Low pass filter, BB: Beam blocker and AOM: acousto-optic modulator.

Figure 3.
(a) Experimentally obtained Doppler-broadened absorption spectrum (red) and Doppler-free absorption peaks (magenta) of molecular iodine; (b) positions of transitions obtained from IodineSpec5 (blue) and from SAS experiment (magenta) and their corresponding error signals (green) for a wavelength scan from 739.0332 nm to 739.0349 nm with vapor cell heated to 450 °C. A total of six Doppler-free peaks are observed, which are labeled as 1–6; almost all of them are resolved. The abscissa of the graph depicts laser frequency relative to the transition frequency of a10 (405,654,584 MHz), i.e., 739.03382 nm.

Figure 4.
Variation of amplitude of Doppler-free peak labeled 4 with increasing (a) cell temperature and (b) pump beam intensity, along with the fits.
Figure 4.
Variation of amplitude of Doppler-free peak labeled 4 with increasing (a) cell temperature and (b) pump beam intensity, along with the fits.

Figure 5.
(a) Frequency drift of the fundamental frequency of the ECDL when locked to SAS peak no. 4 over 50 h and (b) the corresponding histogram with the Gaussian fit for linewidth determination.
Figure 5.
(a) Frequency drift of the fundamental frequency of the ECDL when locked to SAS peak no. 4 over 50 h and (b) the corresponding histogram with the Gaussian fit for linewidth determination.

Figure 6.
Voltage spectral density of noise floor of the spectrum analyzer (green), error signal when locked to the maximum of SAS peak of molecular iodine (blue).
Figure 6.
Voltage spectral density of noise floor of the spectrum analyzer (green), error signal when locked to the maximum of SAS peak of molecular iodine (blue).


Table 1.
Details of the transitions observed in R(78) (1–11) line of molecular iodine.
| Peak | Component of R(78) (1–11) | Frequency (MHz) (from IodineSpec5) (Offset = +405,654,000 MHz) | Frequency (MHz) (from Experiment) (Offset = +405,654,000 MHz) | FWHM (MHz) (from IodineSpec5) | FWHM (MHz) (from Experiment) |
|---|---|---|---|---|---|
| 1 | a1 | 74 | 189(60) | 15(2) | 23(3) |
| 2 | a2–a5 | 368 | 218(60) | 25(4) | 35(4) |
| 3 | a6–a9 | 516 | 396(60) | 31(5) | 40(6) |
| 4 | a10 | 662 | 584(60) | 15(2) | 21(2) |
| 5 | a11–a14 | 811 | 749(60) | 26(4) | 39(5) |
| 6 | a15 | 957 | 923(60) | 15(3) | 23(4) |
Disclaimer/Publisher’s Note: The statements, opinions and data contained in all publications are solely those of the individual author(s) and contributor(s) and not of MDPI and/or the editor(s). MDPI and/or the editor(s) disclaim responsibility for any injury to people or property resulting from any ideas, methods, instructions or products referred to in the content. |
© 2023 by the authors. Licensee MDPI, Basel, Switzerland. This article is an open access article distributed under the terms and conditions of the Creative Commons Attribution (CC BY) license (https://creativecommons.org/licenses/by/4.0/).
Share and Cite
MDPI and ACS Style
Sharma, L.; Roy, A.; Panja, S.; De, S. Stabilizing Frequency of a Diode Laser to a Reference Transition of Molecular Iodine through Modulation Transfer Spectroscopy. Atoms 2023, 11, 83. https://doi.org/10.3390/atoms11050083
AMA Style
Sharma L, Roy A, Panja S, De S. Stabilizing Frequency of a Diode Laser to a Reference Transition of Molecular Iodine through Modulation Transfer Spectroscopy. Atoms. 2023; 11(5):83. https://doi.org/10.3390/atoms11050083
Chicago/Turabian StyleSharma, Lakhi, Atish Roy, Subhasis Panja, and Subhadeep De. 2023. "Stabilizing Frequency of a Diode Laser to a Reference Transition of Molecular Iodine through Modulation Transfer Spectroscopy" Atoms 11, no. 5: 83. https://doi.org/10.3390/atoms11050083
Note that from the first issue of 2016, this journal uses article numbers instead of page numbers. See further details here.