
Fragmentation Dynamics of

Department of Physics, Indian Institute of Technology Kanpur, Kanpur 208016, India
*
Author to whom correspondence should be addressed.
Atoms 2023, 11(5), 75; https://doi.org/10.3390/atoms11050075
Submission received: 9 March 2023
/
Revised: 16 April 2023
/
Accepted: 19 April 2023
/
Published: 23 April 2023
(This article belongs to the Special Issue Photon and Particle Impact Spectroscopy and Dynamics of Atoms, Molecules, and Clusters)
Abstract
:The fragmentation dynamics of the CO (q = 2, 3) molecular ions formed under the impact of 1 MeV protons is studied using a recoil ion momentum spectrometer equipped with a multi-hit time- and position-sensitive detector. Both two-body and three-body fragmentation channels arising from the doubly and triply ionized molecular ions of CO are identified and analyzed. Kinetic energy release (KER) distributions have been obtained for various channels. With the help of Dalitz plots and Newton diagrams concerted and sequential processes have been assigned to observed fragmentation channels. In addition, angular correlations are used to determine the molecular geometry of the precursor molecular ion. It is found that the symmetric breakup into C + O + O involves asymmetric stretching of the molecular bonds in CO prior to dissociation via concerted decay implying the fact that collisions with 1 MeV proton induces an asynchronous decay in CO.
1. Introduction
Over the past few decades, the fragmentation dynamics of multiply charged molecular ions have been studied extensively. These studies are of fundamental interest as they help identify and understand the electronic states of molecular ions. Knowledge of these electronic states works as a verification tool for state-of-the-art theoretical models. These studies are also crucial in plasma and fusion research [1], atmospheric and space physics [2], and radiation therapy [3,4]. When one or more electrons are stripped off from a diatomic or polyatomic molecule, a molecular ion is produced, which might be in a metastable or unstable state depending upon the excitation energy available to the system. A multiply charged (charge state more than 2) molecular ion usually goes to an unstable state and eventually fragments into atomic ions and neutrals due to the Coulomb repulsion between the ionic cores. Investigating the fragmentation dynamics of these molecular ions are important to identify the various electronic states that these molecular ions access after ionization/excitation or both. The fragmentation dynamics of these molecular ions can be studied by detecting the fragments in coincidence and measuring their momenta and KER distributions. The KER distributions of the individual fragments and their angular correlations are crucial to determine the geometry of the molecular ions as well as to detect nuclear motions prior to fragmentation. The dissociation dynamics of a multiply charged polyatomic molecular ion is much more complicated compared to diatomic ions due to the presence of multiple bonds. The carbon dioxide molecule is a prototype system for understanding few-body dissociation dynamics under the impact of particles or photons owing to simple linear geometry of the molecule. Fragmentation dynamics of CO has been studied experimentally using highly charged ions at slow [5], intermediate [6], and swift velocity [7,8,9,10], synchrotron radiation [11,12], femtosecond laser pulse [13,14,15], as well as slow protons [16] and low energy electrons [17,18,19]. In addition, extensive theoretical studies [17,20,21,22] complement the experimental results. The CO and CO molecular ions are isoelectronic to the isomeric pair NCN and CNN radicals, which also have a linear geometry in the ground state. In photofragmentation studies, it has been shown that N production from both CNN and NCN radicals is a dominant photodissociation channel [23,24,25]. This channel is attributed to the bent intermediate states of the free radicals. The NCN and CNN radicals are important in combustion chemistry [24]. Recently, a similar fragmentation channel for CO molecular ions producing O ionic fragments has also been observed in laser-induced ionization and subsequent dissociation study [26]. The C radical is also part of the same isoelectronic family. It is relevant for plasma physics and hydrocarbon chemistry and is even found in the interstellar space [27,28]. Thus, the study of dissociation dynamics of CO (q = 2, 3) molecular ions can provide important information about different electronic states of these radicals.
The simplest fragmentation mechanism for a triatomic molecule is the one where the two molecular bonds break in a single step and the charged fragments move away due to mutual Coulomb repulsion. This type of fragmentation is termed as concerted fragmentation [5]. Additionally, the two bonds can break one after another. This decay is termed as sequential fragmentation. In the first step, the parent molecular ion undergoes a two-body breakup. Subsequently, the daughter molecular ions further decay into ionic or neutral fragments. During the dissociation, the unstable molecular ion can also rotate as well as vibrate about its equilibrium geometry. The typical time period for the rotational and vibrational motion of molecular ions is ≈ s and s, respectively. The fragmentation can happen within or beyond these typical time scales. Hence, we can distinguish between the two extremes of a three body fragmentation, namely concerted and sequential decay, by comparing the two time scales. One is the time difference between the cleavage of the two molecular bonds and the other is the mean rotational period of the primary daughter molecular ion [29]. If then the three body decay is called sequential. On the other hand, for a concerted decay, we have . As approaches zero we reach the asymptotic limit of a concerted decay and with a three body decay is called a synchronous concerted decay. A situation may also arise where . This is termed as asynchronous concerted decay. The two concerted decay mechanisms can be illustrated using the symmetric and antisymmetric stretching modes of a linear triatomic molecule [30]. The symmetric stretching causes both the bonds to elongate in phase and eventually break exactly at the same time. This results in being zero, which is the characteristic of a synchronous concerted decay. In the antisymmetric stretching mode, the elongation of one bond happens together with the contraction of the other. If is the characteristic vibrational period of the parent molecular ion, then during a complete fragmentation process, the second bond will break half a vibrational period later than the first one. As a result would be , characteristic of an asynchronous decay. Hence, in this type of decay, the bonds break in a time span such that the molecular vibration precedes the fragmentation process.
Sequential decay can be further classified into two processes. (a) Initial charge separation s(i), where an atomic ion and a diatomic cation are released in the first step by the break-up of one of the bonds and (b) deferred charge separation s(d), where a neutral atom is released in the first step. The complete kinematics of a concerted decay can only be inferred when all three fragment ions are detected in coincidence. However, if there is a neutral fragment, such as in s(d) process, the 3d momenta of this neutral can only be deduced indirectly provided the other two ions are detected in coincidence and their momenta are known completely.
In their pioneering study, Neumann et al. [5] have shown that the amount of energy deposited into a system is the key parameter to determine which pathway will dominate during a molecular fragmentation. In the present experiment, we have used 1 MeV protons (v 6 a.u.). This projectile charge and energy combination translates into a perturbation strength k () of ≈0.16 a.u., which falls in the weak perturbative regime. The projectile velocity corresponds to an interaction time (t) of 37 as which is much shorter than the typical time scale of molecular fragmentation (10 fs) as well as rotational ( s) and vibrational ( s) time scales. Previous experiments with highly charged ions fall under different values of k as well as t. For instance, the works by Adoui et al. (8 MeV u Ni) [7], Siegmann et al. (5.9 MeV u Xe and Xe) [8], Neumann et al. (3.2 keV u Ar) [5], Jana et al. (5 MeV u Si) [9], and Khan et al. (1 MeV Ar) [6] correspond to values of 1.34 (13 as), 1.17 (15 as), 2.80 (15 as), 22.3 (657 as), 0.85 (17 as), and 7.94 (233 as), respectively, of k (t). Recently, Srivastav and Bapat [16] studied the fragmentation of CO into C + O + O under the impact of protons having velocities of 0.5 a.u. (k = 2.04, t = 480 as) and 0.83 a.u. (k = 1.21, t = 285 as).
In the present work, we have studied the fragmentation dynamics of CO (q = 2, 3) molecular ions produced under the impact of 1 MeV protons using the multiple-hit coincidence imaging technique. The slopes and shapes of the different islands observed in the ion–ion correlation diagram were used to identify different fragmentation channels. The time-of-flight and position information were used to reconstruct the momenta of each detected fragment ion. The reconstructed momenta were further used to calculate the KER for each fragmentation channel. The momentum distributions, angular correlations and the KER distributions were utilized to identify different fragmentation processes.
2. Experimental Setup
The present experiment has been carried out at the 1.7 MV Tandetron Accelerator Facility at the Indian Institute of Technology Kanpur, India. A newly built recoil ion momentum spectrometer (RIMS) [31,32] equipped with a time and position-sensitive multihit detector was used to obtain the three dimensional momenta of ionic fragments. The details of the experimental setup have been described in detail earlier [33]. Briefly, a beam of 1 MeV proton obtained from the 358 Duoplasmatron source is made to collide with an effusive jet of neutral CO gas in a crossed beam geometry. The RIMS is mounted orthogonal to the ion beam and gas jet direction. Acceleration field of 145 V cm is used to extract the electrons and recoil ions produced in the interaction zone. The electrons produced in this collision are detected by a channel electron multiplier (CEM). The ions are extracted using an extraction field of 145 V cm followed by an accelerating field of 260 V cm towards a microchannel plate of 40 mm diameter equipped with a delay line anode. The present spectrometer conditions result in a KER resolution of eV for three-body fragmentation and a collection efficiency of particles having energy eV/q. The output from the CEM works as the start for the data acquisition system. The background vacuum was better than mBar and the working pressure was kept below mBar. The beam current used in our present experiment was ≈ 200 pA. The time and position data was recorded on an event-by-event basis using a time-to-digital converter. The time-of-flight and the position information of each ion are stored in a list mode file using the CoboldPC software (CoboldPC 2011 R5-2-x64 version 10.1.1412.2, Roentdek Handels GmbH, Frankfurt, Germany) The initial momentum vectors of the fragment ions were reconstructed from the timing and position information.
3. Results and Discussions
In collisions with 1 MeV protons, the CO molecule can be ionized to several degrees producing a multiply charged molecular ion, which further dissociates into charged fragments. The correlation diagram or the coincidence plot between the time-of-flights of fragment ions helps to identify different fragmentation channels. Unlike diatomic molecules, the coincidence plot is more complex for triatomic molecules.
3.1. Two-Body Break-Up
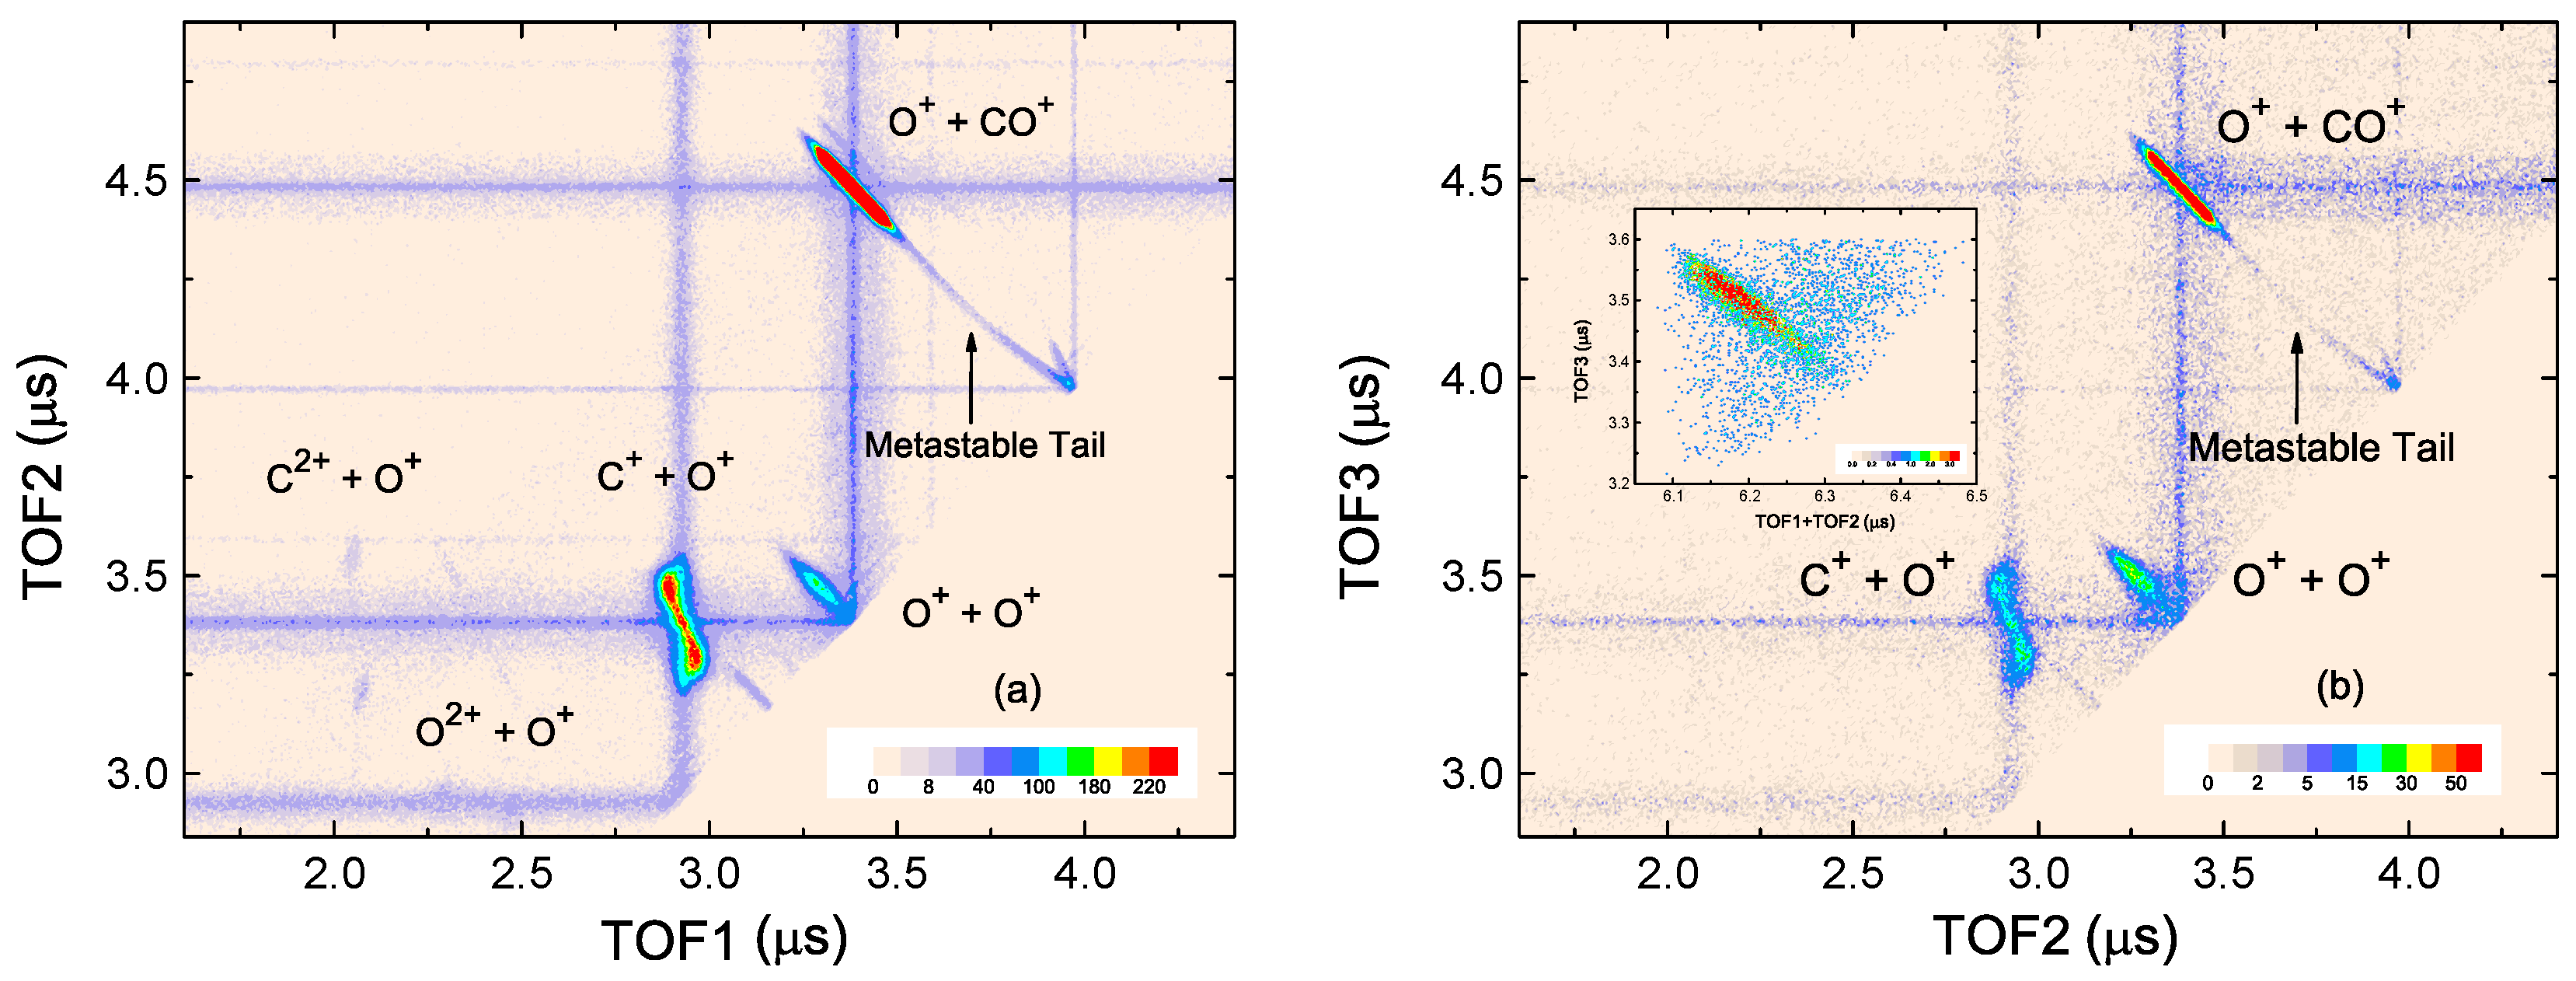
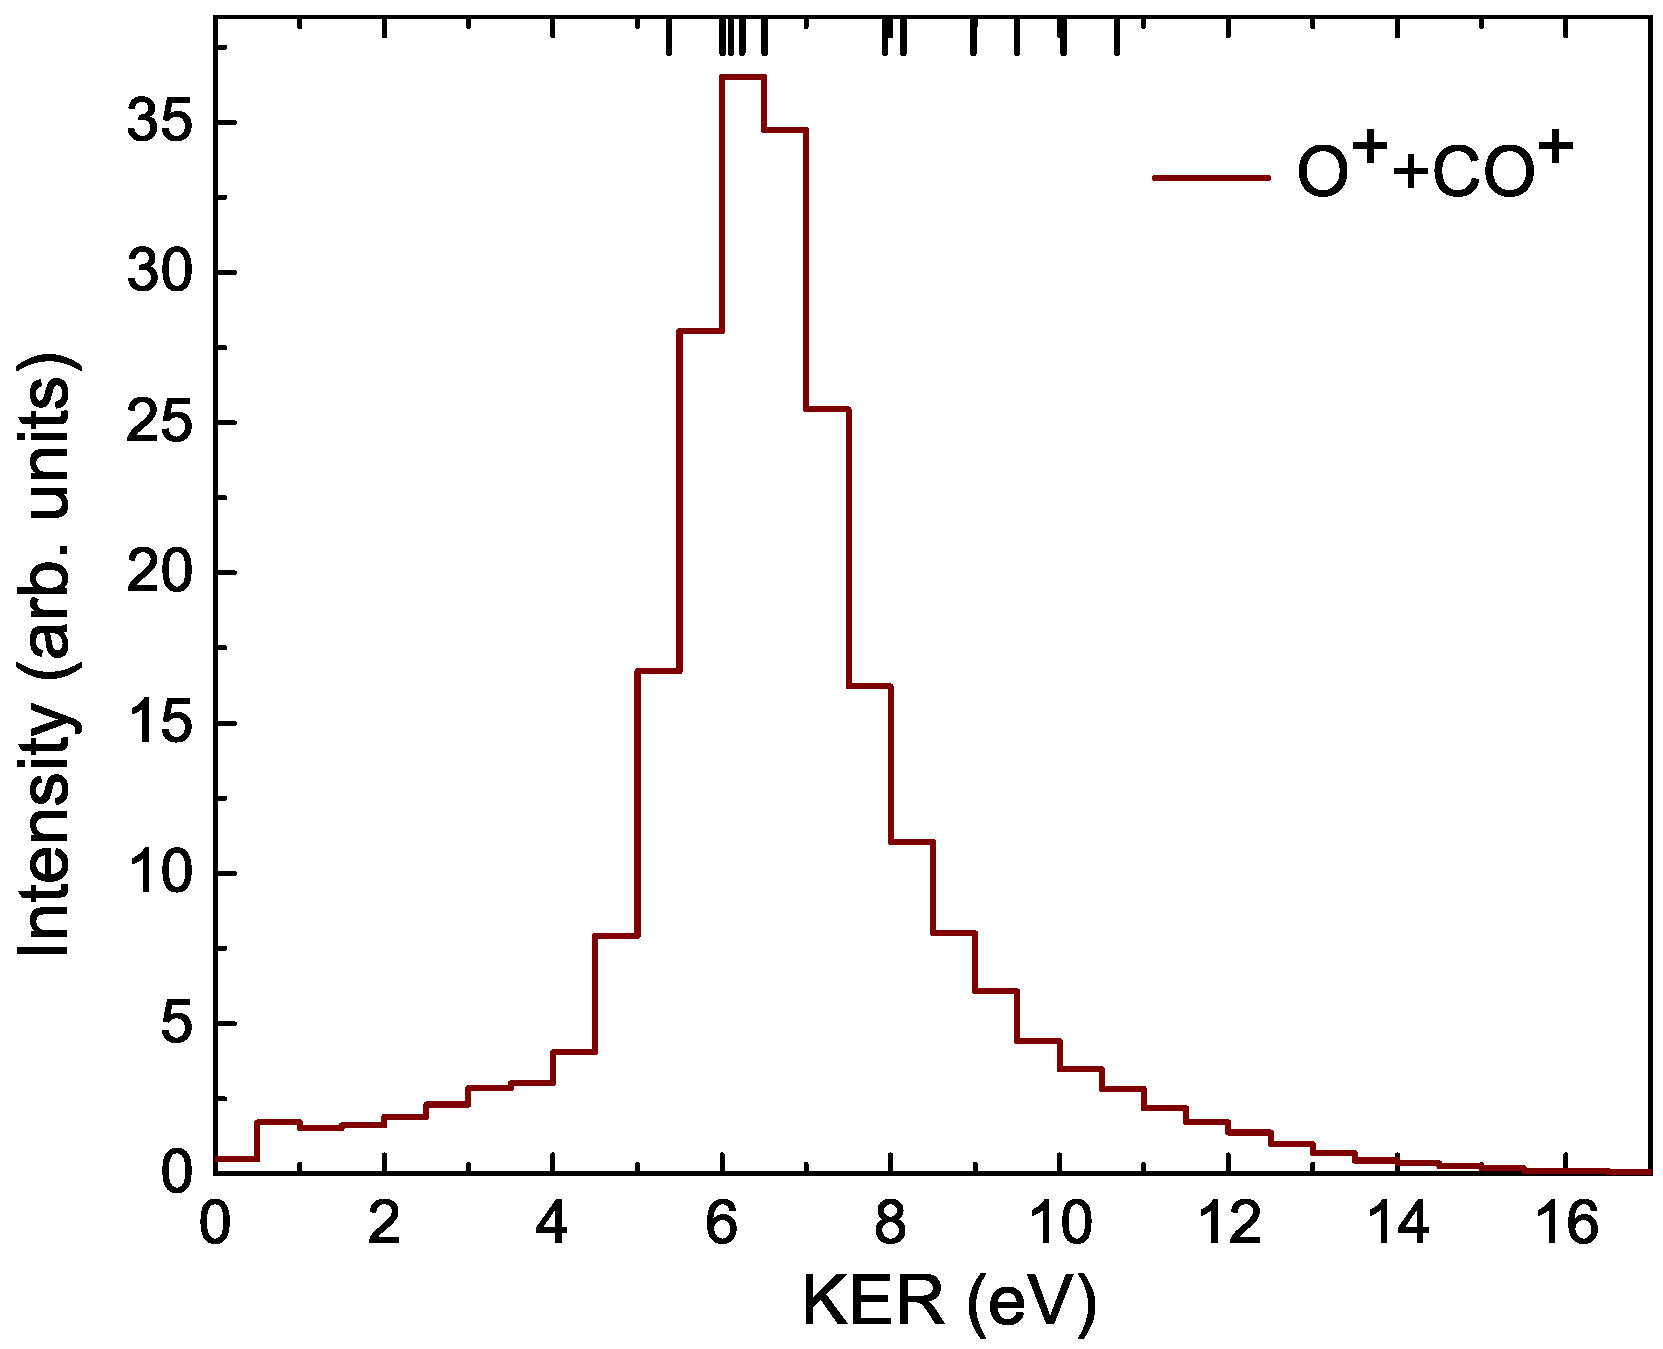
In Figure 1, we have shown the coincidence time-of-flight plots between first ion (fragment ion with smallest time-of-flight) vs. second ion (Figure 1a) and second ion vs. third ion (Figure 1b). From the coincidence spectra, one can identify a sharp trace of O + CO channel arising due to the two body fragmentation of CO. This is the only complete two body break-up channel observed in our present experiment. The slope of the trace is −1.0 ± 0.03, as expected from the momentum conservation for a two-body Coulomb fragmentation. The KER distribution for this channel is shown in Figure 2. This spectrum shows a narrow structure around a peak value of 6 ± 0.3 eV and extends only up to 16 eV. This signifies that this channel arises from a prompt dissociation of the precursor CO molecular ion and that it only evolves through a few number of PECs. Zhang et al. [22] have obtained the PECs of the 14 low-lying states of CO using multistate multiconfiguration second-order perturbation theory (MS-CASPT2) and complete active space self-consistent field (CASSCF) methods. A few of the theoretical KER values for the O + CO channel are shown as vertical lines on the top axis of the KER spectrum. The most probable KER can be accounted for by considering the decay of CO from four electronic states: , , , and as shown in Table 1. The decay from can contribute to the KER spectra in the region below the most probable value. Whereas, the range beyond the most probable value can be explained based on the dissociation from the following six electronic states: , , , , , and .
The KER spectrum can also be compared with previous studies. In their photoion–photoion coincidence (PIPICO) experiment, Dujardin and Winkoun [34] measured three distinct KER values around 4.5 eV, 6.5 eV, and 9.4 eV for this channel. Whereas, under the impact of 5 keV electron, Wang et al. [35] obtained a KER around 6.8 eV. In their experiment with 1.3 keV electron, Sharma et al. [17] obtained a KER around 5.9 eV and from their ab initio calculations assigned this peak to the state of the CO molecular ion dissociating into O () + CO (X)channel. Another measurement with 12 keV electron by Bhatt et al. [18] showed a KER value around 4.7 eV. The Coulomb explosion model predicts two possible values (6.2 eV and 12.4 eV) (at an equilibrium distance of 1.16 Å [36] between C and O atoms) as the point charge on the CO molecular ion can be assumed to be either near the C atom or the O atom [18].
In the ion–ion coincidence plot (Figure 1) we observe a ‘tail’ followed by a ‘V’ shape structure which starts at the end of the sharp trace of O + CO channel and extends up to the forward diagonal (the TOF1 = TOF2 line). This particular structure is characteristic of a metastable molecular ion [37]. The time-of-flights of these metastable molecular ions would lie between that of a stable CO and the fragment ions (CO and O). As we go closer to the O + CO coincidence along the tail, the time period between the formation and dissociation of the precursor molecular ion gets shorter. In contrast, coincidences closer to the ‘V’ region signify a longer time period prior to dissociation [38]. Thus, the ‘tail’ part arises due to the fragmentation of (CO)* in the extraction region. Whereas, the ‘V’ arises when it fragments in the drift tube. This ‘V’ has two arms, extending from the point on the forward diagonal corresponding to the time-of-flight (≈3972 ns) of a stable CO molecular ion. The origin of these arms can be explained on the basis of the momentum gained by the O and CO fragment ions. Therefore, in the upper arm the CO was detected first due to its momentum gained towards the detector. On the other hand, in the lower arm, the O gained momentum toward the detector. Lifetime measurements for the metastable (CO)* molecular ion have been carried out extensively by various groups [17,37,39,40,41] and values in the range of 0.9–21 μs have been reported. Field and Eland [37] obtained a lifetime of 0.9 ± 0.2 μs using a set of equations utilizing the charge separation mass spectrometry technique. These set of equations can be modified [6] for our double field system and the intensity in the ‘V’ and ‘tail’ region can be used to estimate the lifetime of the (CO)* molecular ion. We obtained a metastable lifetime of 1.6 ± 0.2 μs in our experiment.
3.2. Three-Body Break-Up
3.2.1. Fragmentationof CO
In the last section, we discussed the two-body prompt dissociation of the CO molecular ion. Here, we will describe its three-body fragmentation. As prescribed by Eland [42], the shape and slope of the coincidence traces can be used to determine the fragmentation dynamics. Thus, for a two-body Coulomb fragmentation, the slope of the island in the coincidence map is −q/q due to the conservation of momentum. Here, q and q are the charges of the first and the second ion, respectively. Three-body dissociation is much more complex. As already discussed, the dissociation of CO can happen via either concerted or sequential fragmentation.
- 1.
- In the concerted decay, the two C=O bonds break simultaneously:
As already discussed, the concerted decay can be classified into a synchronous and an asynchronous way depending upon the time period of fragmentation compared to that of molecular vibrational and rotational motion. However, since the CO molecule has a linear geometry, it is expected, in the first case (Equation (1a)), that a C ion would carry much less momentum compared to the O atom and O ion. This implies that the coincidence trace would be predominantly vertical. In the second case (Equation (1b)), the presence of a neutral C atom implies that the two O ions are anticorrelated. Hence, the slope of the coincidence island would be −1.
- 2.
- For a sequential or two-step decay, there can be two different situations:
- (a)
- In the initial charge separation (s(i)) process a charged fragment is released due to the break-up of the C=O bonds. Depending on which ion ( or ) is released first, s(i) is further categorized [19] as follows:
- (I)
- If the lighter ion is released in the first step:In this case, the slope of the coincidence trace should be:where m, m, and m are the masses of the lighter ion, the heavier ion, and the neutral atom, respectively.
- (II)
- Whereas, in the following casethe ion is released in the second step and the heavier ion is released in the first step, hence the slope of this coincidence trace should be:
- (b)
- For a deferred charge separation (s(d)) process, a neutral fragment is released due to the break-up of the C=O bonds.
In both of these cases, the motion of the two fragment ions produced in the second step, are governed by the mutual Coulomb repulsion and are not affected by the neutral fragment. Thus, similar to a two-body Coulomb fragmentation, the slope of the coincidence trace for a deferred charge separation would be simply −(q/q). However, the second case (Equation (6)) is special because it demands the isomerization of CO molecular ion to form an O intermediate and ejection of a neutral C atom and to the best of our knowledge, this particular channel has never been observed experimentally.
The slopes of the different fragmentation channels from CO were extracted from the correlation diagram and fitted with the method of least squares. Table 2 shows the comparison between the theoretical predictions and experimental observations.
C + O + O Channel
For the C + O + O channel, we have obtained a slope of −2.21 ± 0.01. This matches well with the theoretical predictions and earlier measurements. Bhatt et al. [18], in their experiment with 12 keV electron impact, obtained a slope of −2.75 ± 0.04 for the same channel. They attributed the slight departure of the experimental slope from the theoretical value, to the contribution from the concerted decay (Equation (1a)). Wang et al. [19] measured a slope of −1.75 ± 0.04 in their experiment with 200 eV electron. They explained this fragmentation channel to have contribution from both s(i) and deferred charge separation.
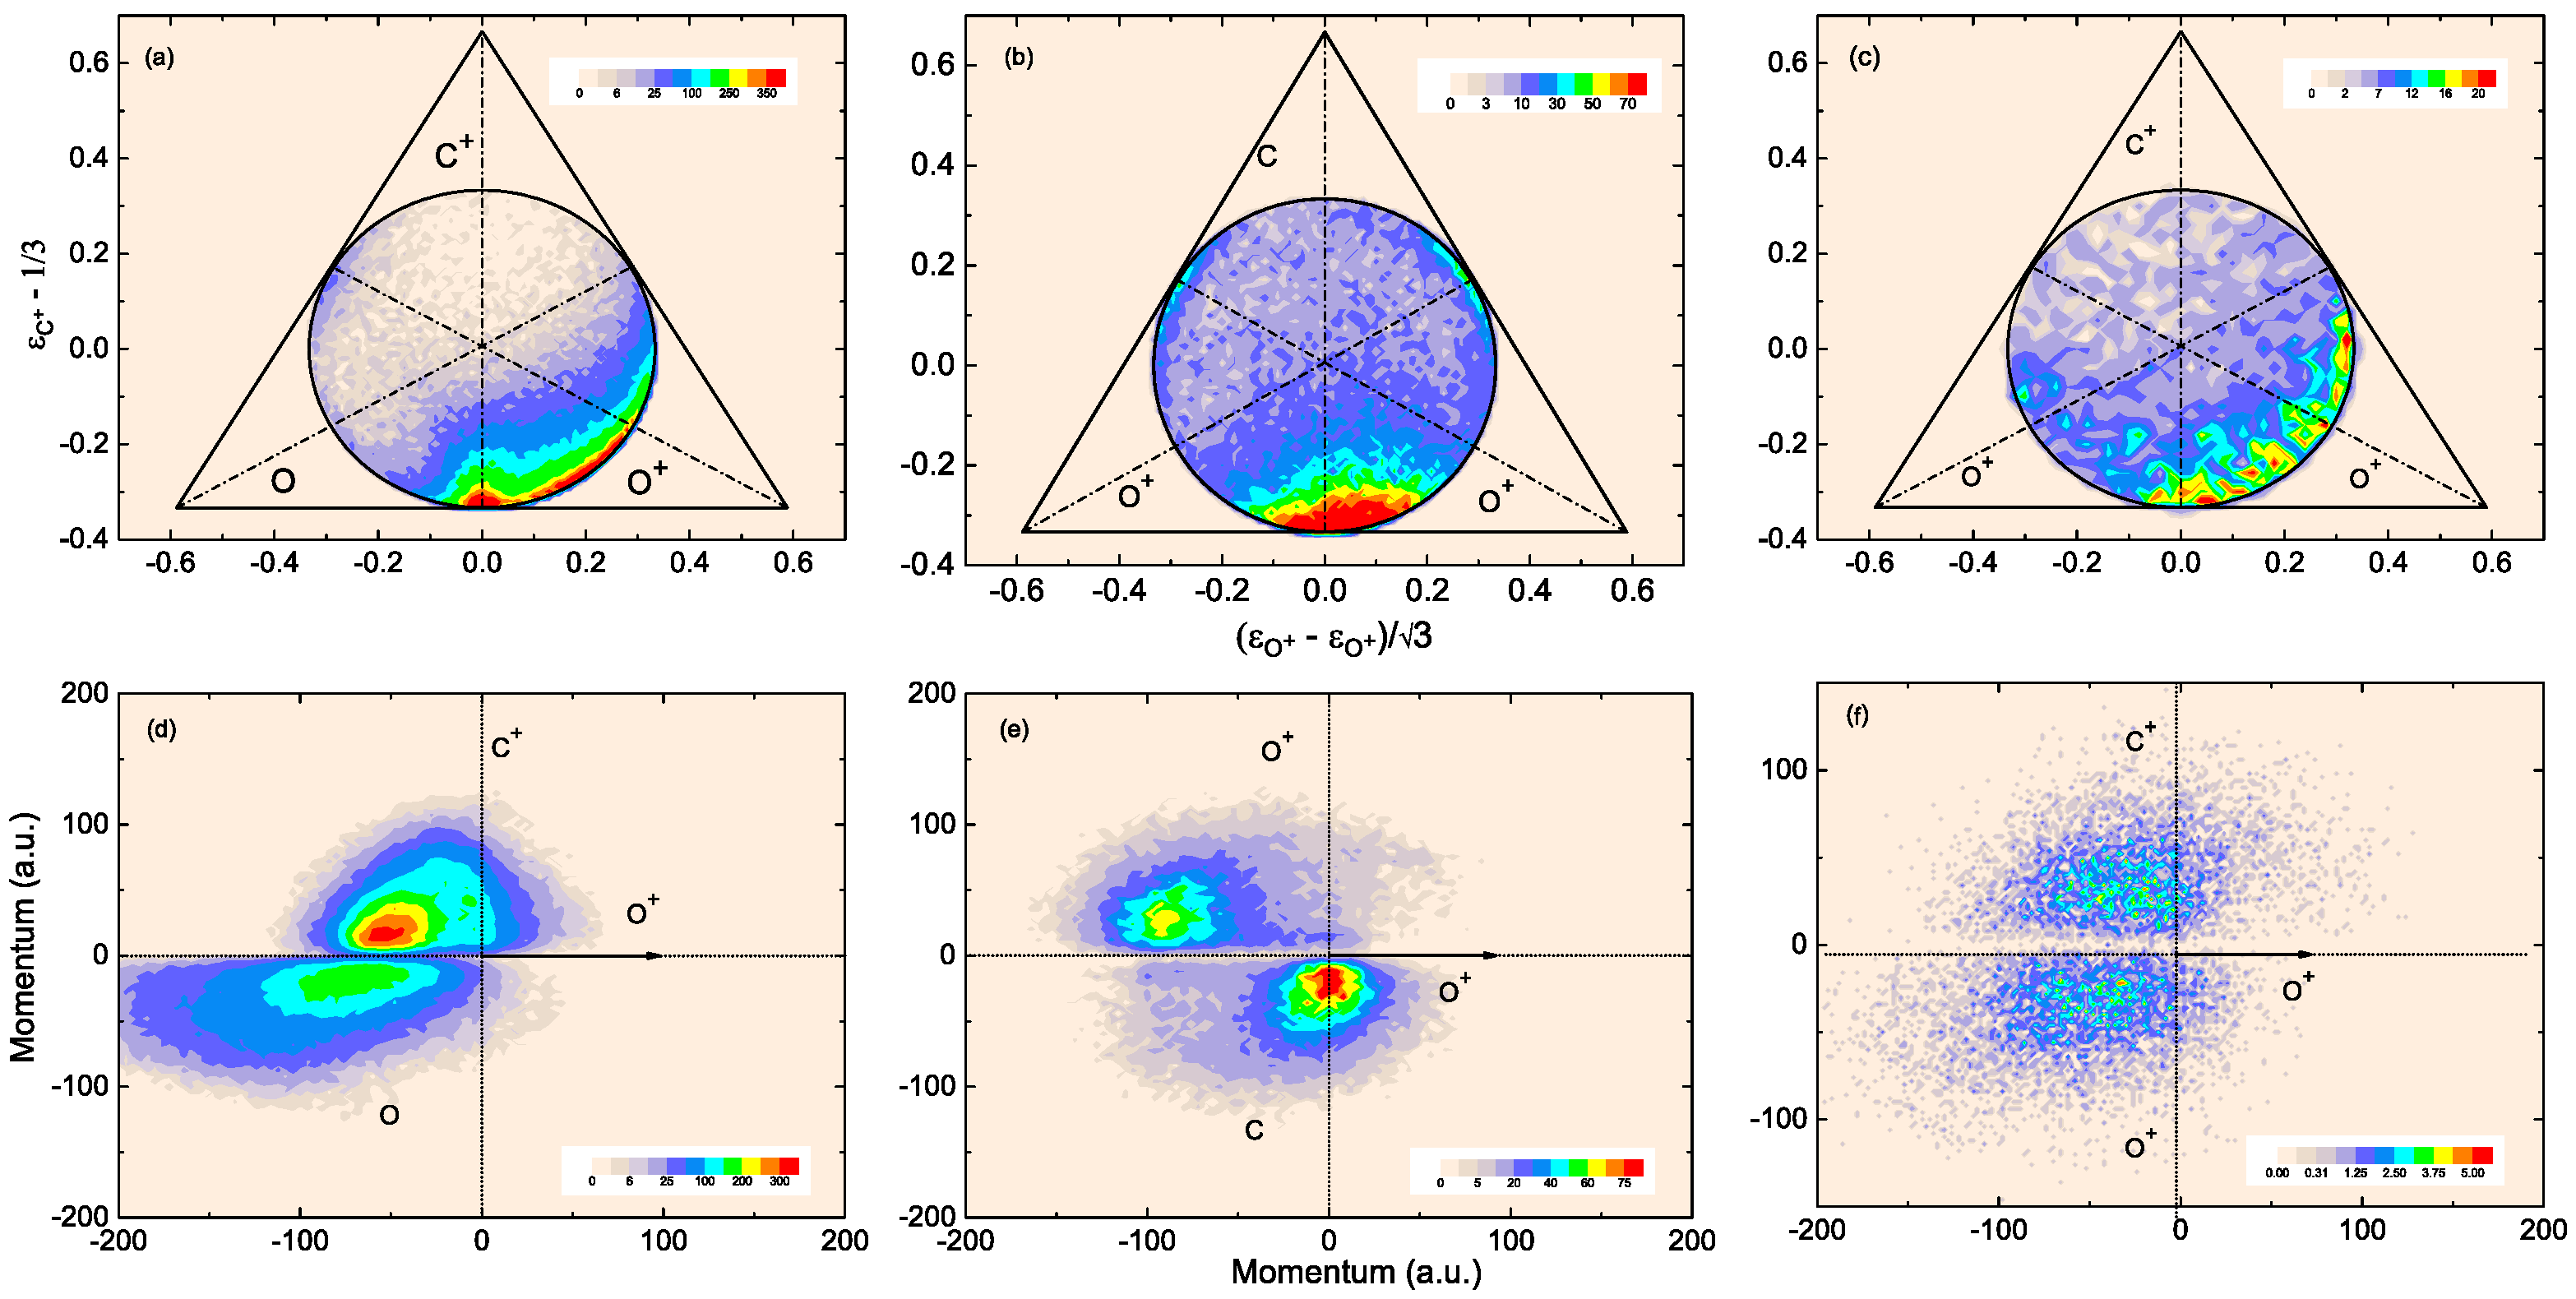
To better understand the fragmentation process, we take help of the Dalitz plot [45]. The coordinates in a Dalitz plot are defined as X = ()/ and X = (), with . Here, is the momentum of the ith fragment in the center-of-mass frame. However, to obtain these two diagrams, we need all three momenta. Hence, first ultilizing the coincidence technique the momenta of the fragment ions in all three dimensions are obtained. Furthermore, momentum conservation is imposed to deduce the neutral atom momentum. Figure 3a shows the Dalitz plot for the C + O + O channel. It is similar to the result obtained by Laksman et al. [46] with 270 eV photon. We can observe two distinct structures in this diagram.
(i) An intense symmetric structure around the C axis. This symmetry is because of the equal momentum sharing between the O ion and the neutral O atom. The distribution around the minimum C momentum is a clear signature of the linear structure of the CO molecule. The C ion is released with a smaller momentum, while the other two fragments (O and O) are emitted back to back. Thus, this structure corresponds to the concerted process, where the two C=O bonds break simultaneously. (ii) A second structure can also be distinguished in this diagram, distributed in the perpendicular direction to the O axis. This indicates a weak correlation between the O ion and all other fragments [46]. This is a typical signature of a two step s(i) process, where the O ion is released in the first step. The CO cation further fragments into C and O after the primary fragments (O and CO) have left the Coulomb field region. As a result, the C and O are anticorrelated.
The same data is displayed in a Newton diagram in Figure 3d. The most probable momentum of the O ion is shown by an arrow along the x-coordinate. The relative momentum of the C and O are mapped in the upper and lower half of the diagram, respectively. Although, we could not distinguish between the concerted and the sequential s(i) process in this diagram, the anticorrelation between C and O is clearly visible.
To further understand the dynamics we take help of the distributions of the momentum correlation angles (MCAs) , , and . These angles are shown schematically in Figure 4a and can be obtained from the momentum vectors of the associated ith and jth fragment ions as: MCA = cos Figure 4d–f show these angular distributions for the C + O + O channel. Both the O ion and O atom show a double peak structure in the angular distribution with respect to the C ion. The O (neutral O) ion has two peaks around () and (). These values are in good agreement with measurements reported earlier [18]. The double structure obtained in our present experiment is explained by considering both sequential and concerted decays. In the sequential process, the O atom is released toward C at , whereas the O ion at to balance the C + O center of mass momentum. On the other hand, in the concerted process, both the O and O fragments are released at and with respect to the C ion. The angle was found to be around .
In contrast to the above discussion, the presence of the first structure together with the second one in the Dalitz plot has been attributed to missed three-ion coincidences by Laksman et al. [46]. One factor contributing to this case is the finite dead time (∼35 ns [33]) of the spectrometer, which causes the third one to be missed if the TOFs of the second and the third ion are the same. As a result, a triple coincidence is recorded as a double coincidence. The other contributing factor is the finite detection efficiency of the detector, due to which there is a probability that the third ion could be missed even if the TOFs are very different for all the ions. The contribution from these missed triple coincidences could also be the reason for the deviation of the slopes in the 2D coincidence plots from those reported in the earlier studies.
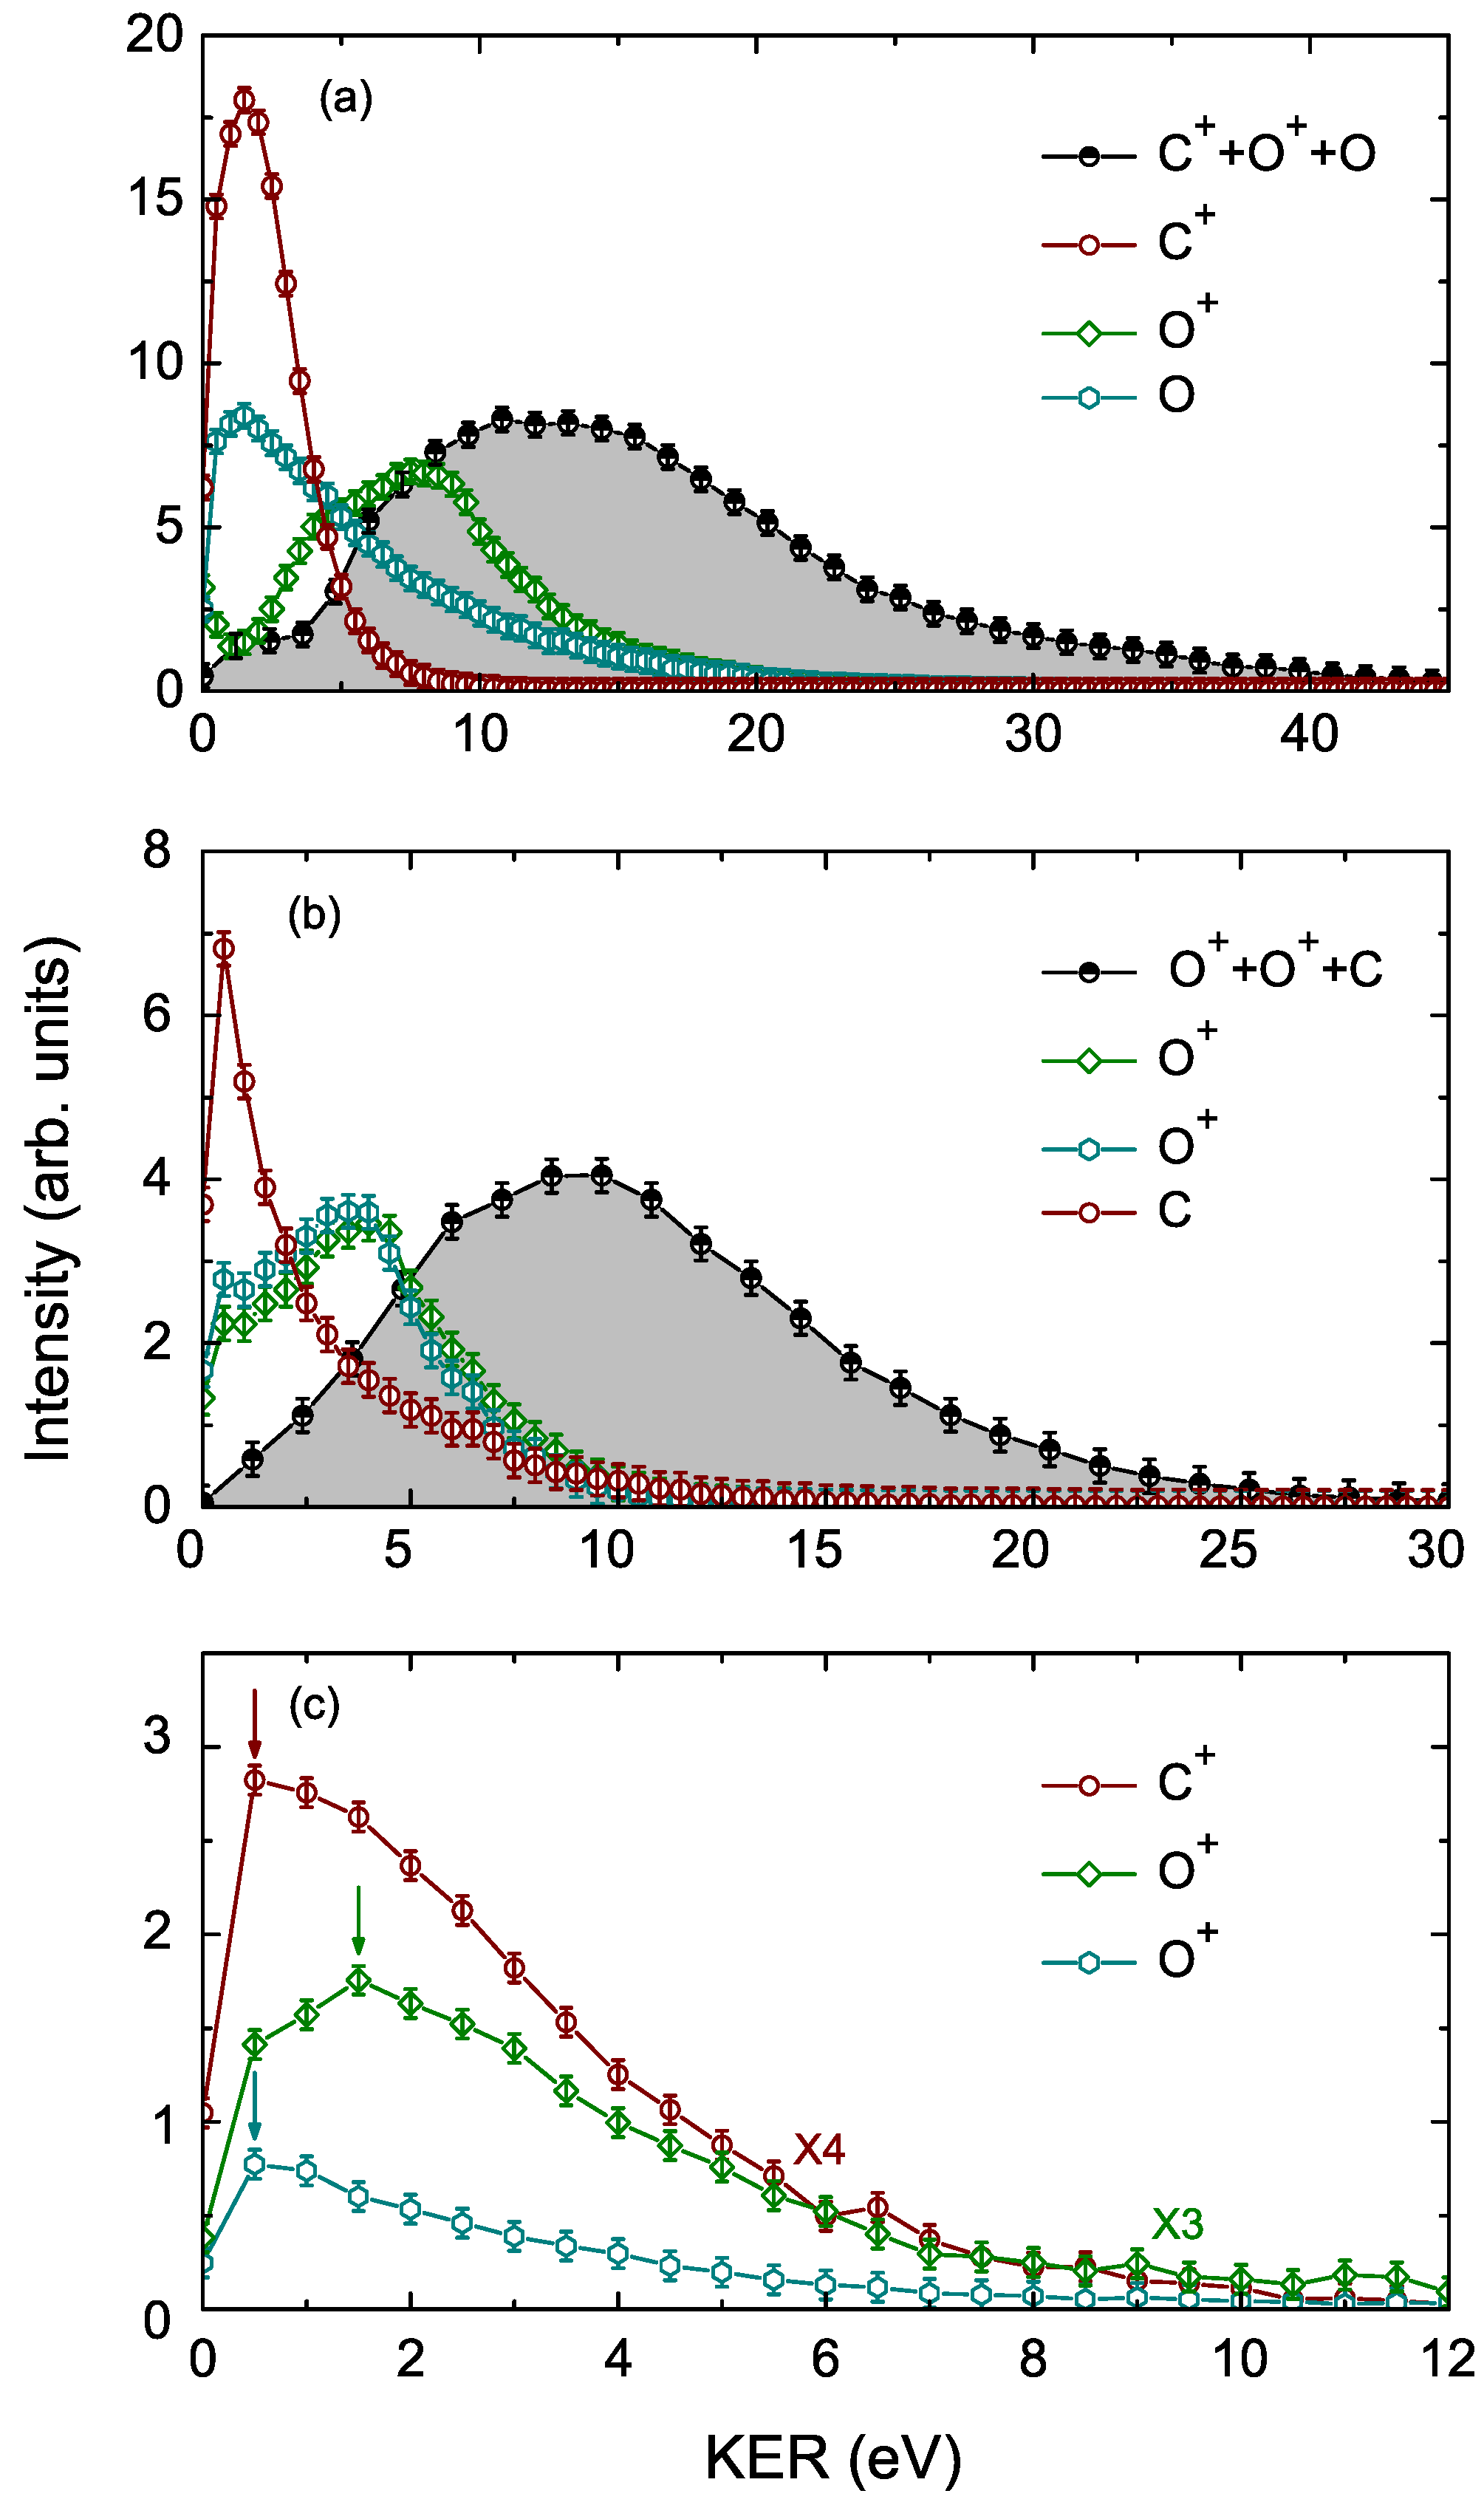
The KER distribution for the fragmentation of CO into C + O + O is shown in Figure 5a. The kinetic energies (KEs) of the individual fragments are also shown in the same plot. The KER spectra has a broad distribution around the most probable value eV, with a small structure around eV, and it extends form 0 eV to around 50 eV. The most probable value of KE are eV, eV, and eV for C, O, and O, respectively. Additionally, the KE of O ion shows an additional contribution at zero.
O + O + C Channel
For the O + O + C channel, we have obtained a slope of −1.16 ± 0.02. This is in good agreement with the theoretical prediction of −1.0 for a concerted as well as s(d) process. However, as discussed above, the deferred charge separation for this channel demands isomerization of the CO molecule to form an O cation. In our experiments with 1 MeV proton we have not seen any trace of O in the TOF spectrum. Therefore, a concerted process (Equation (1b)) seems to be predominantly contributing to this channel [18,19].
Figure 3b shows the Dalitz plot for the O + O + C channel. We can observe two distinct structures in this diagram. (a) An almost symmetric intense structure around the C axis. The distribution close to the minimum C momentum is again a clear signature of the linear structure of the CO molecule. The C ion is released with a smaller momentum, while most of the momentum is shared between the other two fragments (O and O). Hence, this structure corresponds to the concerted process, where the two C=O bonds break simultaneously. This structure is almost identical to that obtained by Wang et el. [19] with 200 eV electron. (b) Two separate structures can also be observed at the two opposite O edges, which are symmetric around each O axis. These correspond to events where one of the O has low momentum, while the C and the other O ion are released one after the other. This momentum sharing is a clear signature of a two step s(i) process, where the O ion is released in the first step. While the CO cation further fragments into O and C after the primary fragments (O and CO) have left the Coulomb region. As a result, the O and C are anticorrelated.
Figure 3b shows the Newton diagram for this channel where the most probable momentum of the first O ion is plotted along the x-axis. Although, we could not distinguish between the concerted and the sequential s(i) process in this diagram, but the anticorrelation between O and C is clearly visible. The low momentum of the C atom can also be seen.
The angular distributions of , , and for the O + O + C channel is shown in Figure 4d–f. The two O ions show peak structure around () and (), with a small contribution around in the distribution of the angle , whereas the angle has a broad distribution around .
The KER distribution for the O + O + C channel is shown in Figure 5b along with the kinetic energies (KEs) of the individual fragments. The KER spectra has a broad distribution around the most probable value of eV. And, it extends form 0 eV to around 30 eV. The most probable values of KE are eV, eV, and eV for O, O, and C, respectively. The KE of the O ions show an additional contribution at eV. The most probable value of KER of the O + O + C channel is smaller than that of C + O + O channel. This difference can be explained by the CE model by noting that due to the linear configuration of the CO molecule the distance between the two oxygen atom (2.32 Å) is larger that that between the carbon and oxygen atoms (1.16 Å).
3.2.2. Fragmentationof CO
Similar to CO, we can also observe several sequential and concerted fragmentation channels for the decay of CO as follows:
- (I.)
- Concerted fragmentation
- (II.)
- Two-step s(i)
- (III.)
- Two-step s(i)
- (IV.)
- Two-step s(d)
Among the above fragmentation channels, we could only observe three in Figure 1: (a) , (b) , and (c) . Among these, only the first channel has significant statistics.
C + O + O Channel
Figure 3c shows the Dalitz plot for the C + O + O channel. The dominant structure is the almost symmetric distribution around the right edge of the circle where the O ion has maximum momentum. As discussed above, it is a signature of two-step s(i) process, where an O is released in the first step leaving a metastable CO, which decays in the second step producing O and C ions. In addition, there are traces of counts on the left side of the C axis. A sequential process in a three-body break up can be easily identified in a Newton diagram. During the first step, the intermediate CO ion acquires some angular momentum. If the lifetime of this CO ion is of the order of it’s half-rotational time period, then it can rotate while dissociating in the next step [5,15], which shows up as semi-circular structures in the Newton diagram [5,47]. Figure 3f shows the Newton diagram for this channel where the most probable momentum of the first O ion is plotted along the x-axis. It shows two lobes on the upper and the lower half of the diagram, the C ion and the second O (y < 0 plane) are anti-correlated, and there is no prominent semicircular structure. This hints towards the fact that either the lifetime of the CO ion is less than the half-rotational time period or the vibrational motion precedes the fragmentation process (the asynchronous concerted decay).
To further shed light upon the underlying process, we discuss the MCA distributions. The distributions of , , and for the C + O + O channel is shown in Figure 4d–f. The two O ions show peak structure around () and (). While has a small contribution around . The results from Jana et al. using 5 MeV u Si shows that the angle between the momentum vectors of the two O ions () is about . By comparing with earlier reported studies, they concluded the C + O + O fragmentation to be a concerted decay from linear as well as bent structures of CO. In our data the angle is around , which is less compared to the other two fragmentation channels. Therefore, our present data also indicates contribution from bent states. The presence of several bent geometries of CO molecular ion are also confirmed from the distribution of the momentum-space molecular bond angle as shown in Figure 4b, which has a broad distribution around . Similar results have been also reported by other groups [7,8,18].
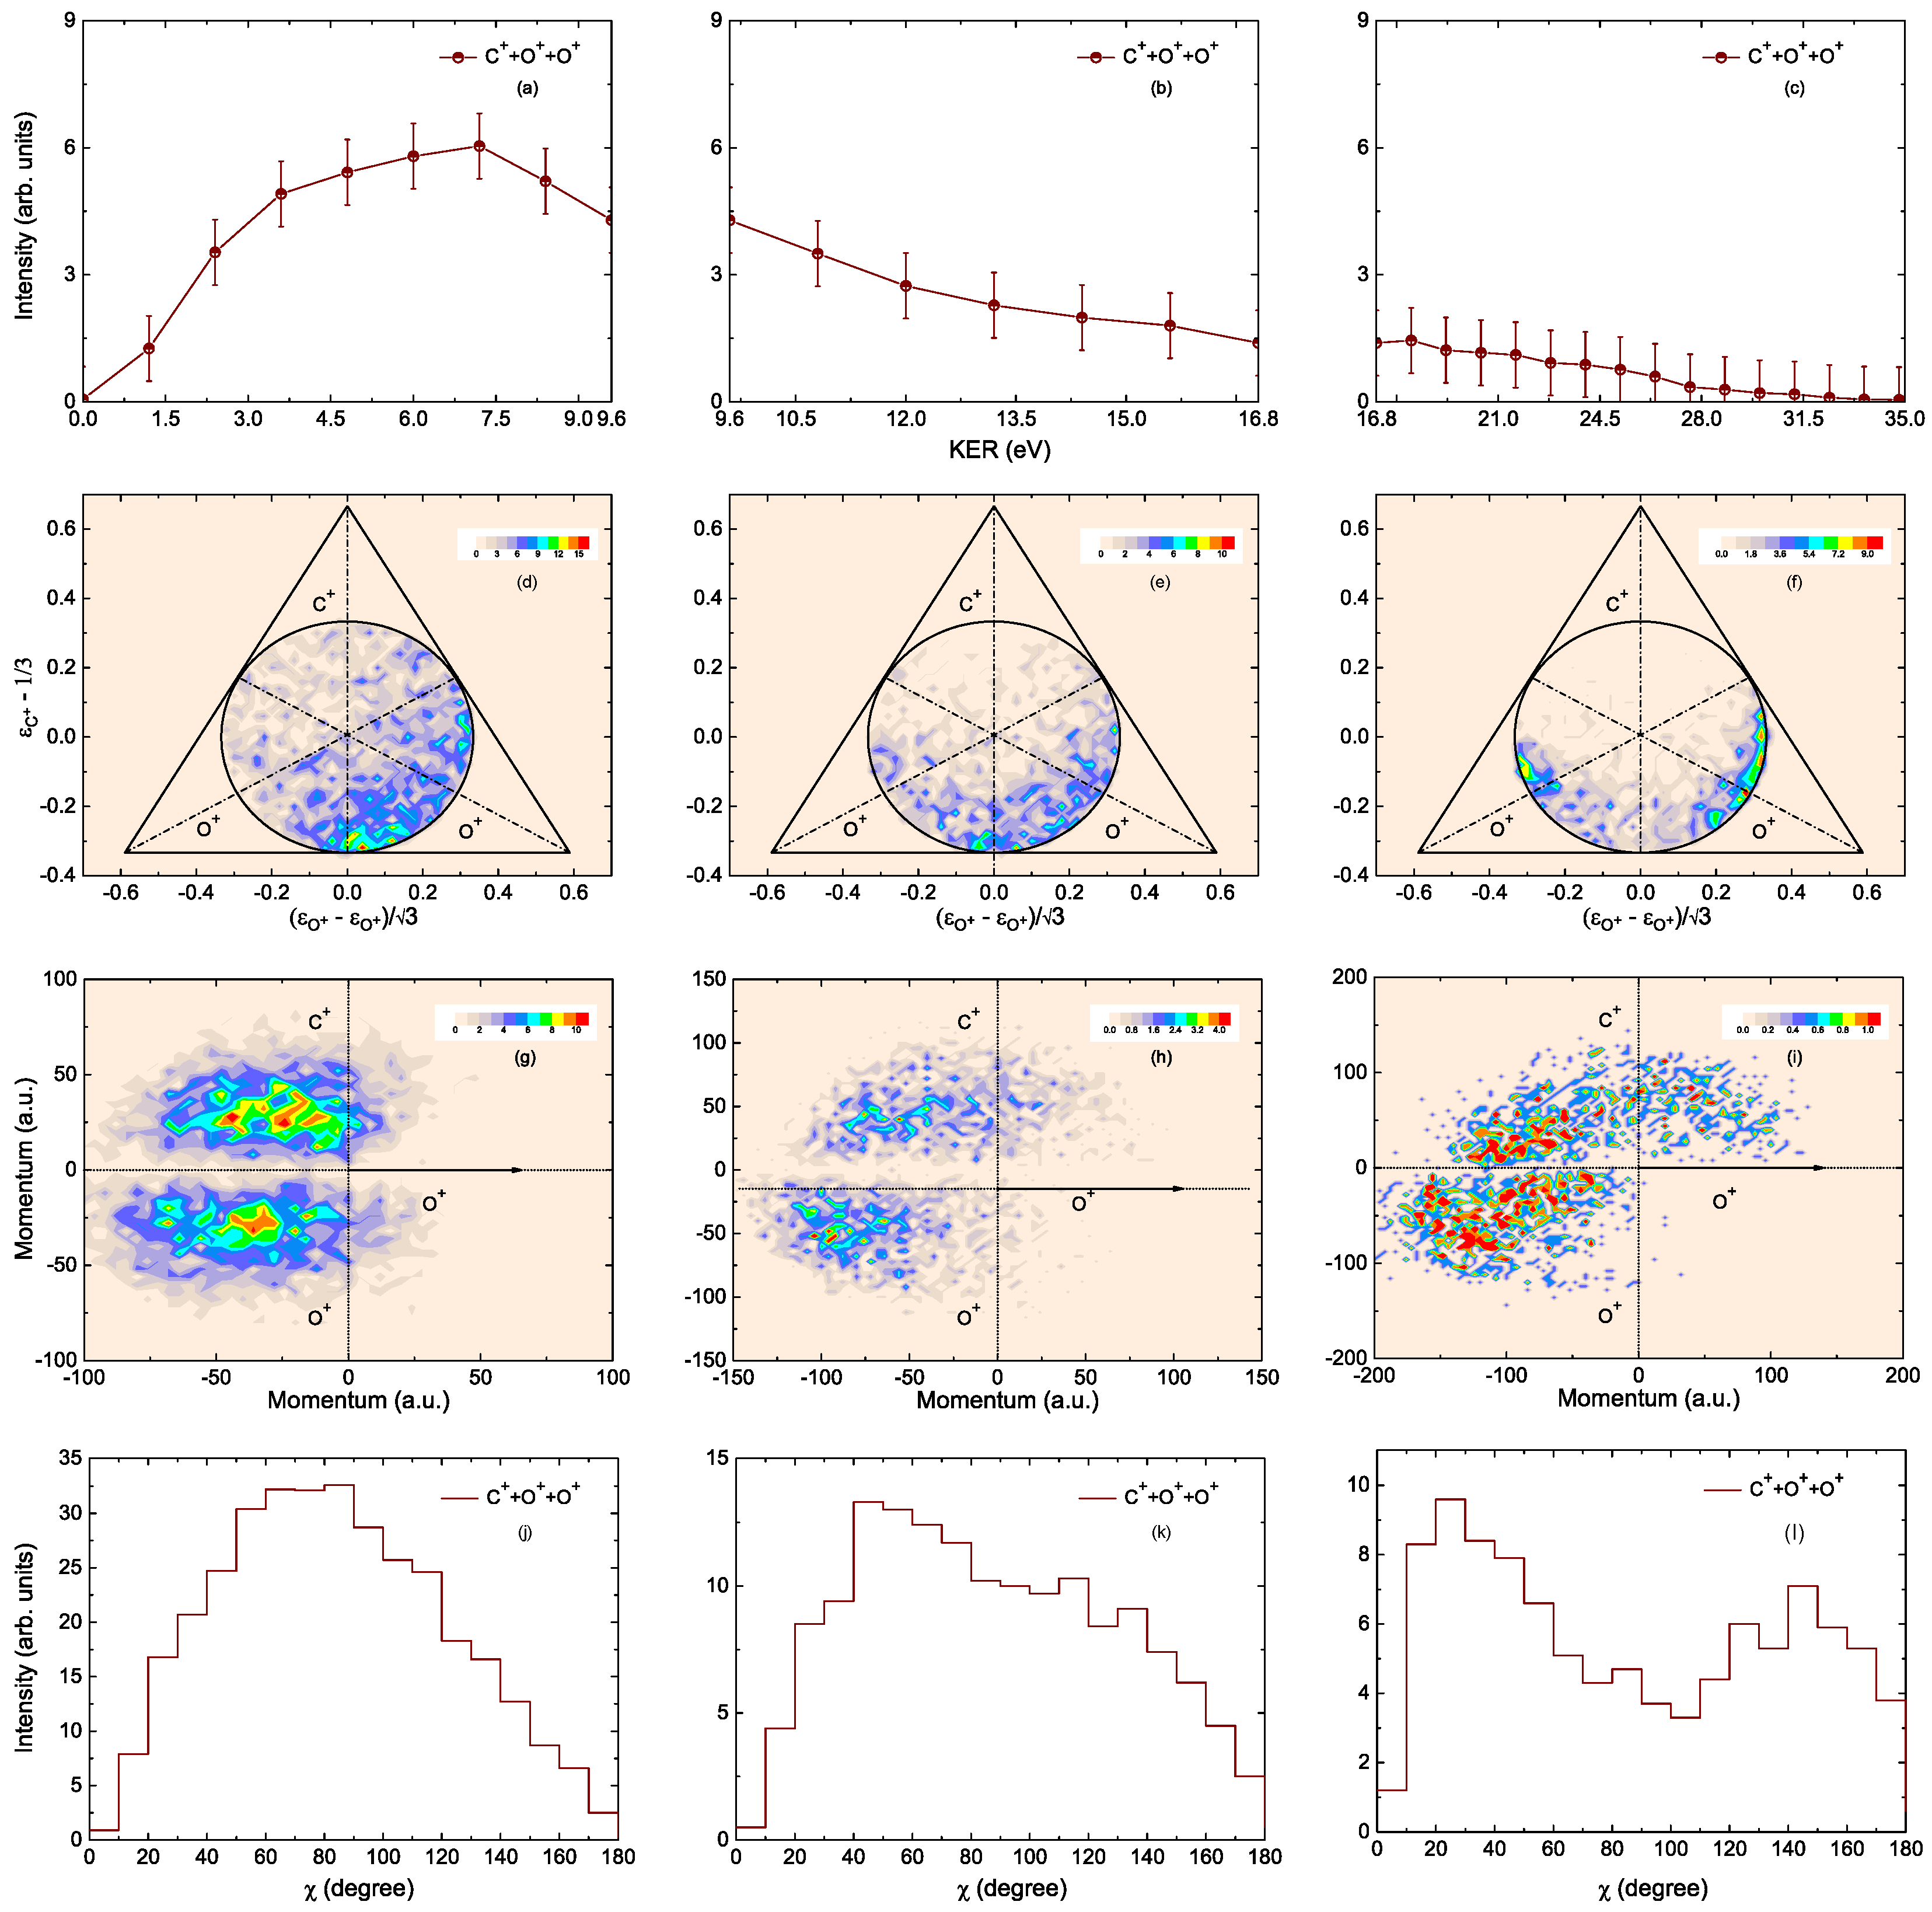
In an extreme example of concerted (synchronous) breakup, the molecule dissociates via symmetric stretching around the central C atom. Thus, the C ion would obtain zero momentum and the two O ions are ejected simultaneously with same energy. If the central C ion is released with a finite energy, then the break must have happened from a bent geometry of the precursor molecular ion, whereas in a concerted process, if there is any deviation from the equal sharing of energy between the two terminal ions, then it would correspond to an antisymmetric stretching of the molecule [30]. The kinetic energies (KEs) of the individual fragments for the C + O + O channel is shown in Figure 5c. In Figure 6a–c, we have plotted the complete KER distribution for the above channel in three regions: (a) 0–9.6 eV, (b) 9.6–16.8 eV, and (c) 16.8–35.0 eV. The KER spectrum has a most probable value of eV (Figure 6a) with a broad structure around 20 eV (Figure 6c). It extends from 0 eV to about 35 eV. The most probable values of KE (the position of which are depicted as arrows in Figure 5c) are eV, 0.1eV, and eV for C, O, and O, respectively. The most probable value of KER for this charge symmetric channel is smaller than that of the asymmetric channels. The non-zero kinetic energy of the C ion implies that bent geometries are contributing to the fragmentation. In addition, the unequal energy of the two O ions signifies that vibrational motions precede the fragmentation process, and hence it is an asynchronous concerted decay. To confirm this vibrational stretching we take help of the distribution of the angle (Figure 4a). A uniform distribution in represents a stepwise sequential process [30], whereas a sharp distribution indicates the involvement of a concerted process. Figure 4c shows the distribution of for the C + O + O fragmentation channel showing a broad structure around , which could imply the presence of bending as well as stretching modes during the fragmentation of CO. These three regions are also shown in the KER spectrum of Figure 5c shaded in yellow, orange, and blue. The corresponding Dalitz plots, Newton diagrams, and the distribution of the angle are also shown in Figure 6. For KER range of 0–9.6 eV, most of the counts in the Dalitz plot (Figure 6a) are situated near the bottom of the triangle and right of the C axis indicating the presence of asynchronous decay [48]. As the KER range increases the counts get dispersed away from the central region towards the left and right. In the KER range between 16.8 eV and 35 eV, there are almost no counts around the C axis, while dominant structures are around the two O axes. The unequal energy sharing due to stretching of one of the C=O bonds can easily be identified in both the Dalitz plot and the Newton diagram (Figure 6f). The stretching of the bond is also reflected in the distribution of the angle (Figure 6f–h). With increase in the available energy, as the stretching becomes more dominant, an asymmetry takes over the initial isotropic distribution.
4. Conclusions
We have studied the dissociation dynamics of a simple, linear triatomic molecule CO under the impact of 1 MeV protons. We have measured the two- and three-body dissociation of doubly and triply charged molecular ions of CO. For the O+CO fragmentation channel from the CO molecular ion, we see a prompt dissociation resulting in narrow KER distribution. This KER distribution can be well explained based on the different electronic states reported by earlier theoretical and experimental studies. The CO molecular ion also shows a metastable character in the ion–ion correlation diagram as a tail and ’V’ structure. Using the intensity of these structures, we have estimated the life time of the metastable (CO)* molecular ions. We have also discussed the three-body dissociation of CO, which produces two ions and a neutral. All three-body dissociation are discussed using Dalitz plots, Newton Diagrams, and angular distributions. For both the and channels, we have observed contribution from both concerted decay. In addition, for the channel, we see signature of an s(i) process, whereas in the channel contains signature of an s(i) process. The contributions from all these processes are also be verified from the angular distributions. We have further discussed the charge symmetric fragmentation of CO molecular ions producing . The angular distributions for this channel hint toward the fact that the three-body fragmentation is happening from bent molecular geometries of the precursor molecular ions. The Dalitz plots and Newton diagrams further suggest that molecular bond stretching precedes the fragmentation process in this charge symmetric dissociation. The linear triatomic CO molecule has three vibrational modes, namely symmetric stretching, asymmetric stretching, and bending vibration. The typical time scales of these three stretching modes are 25 fs, 14 fs, and 50 fs [49], respectively, which are much larger than the interaction time (t) of 37 as for the present collision system consisting of 1 MeV protons and CO molecules. The population of these different vibrational modes depends on the available energy of the molecular system. The KER distribution works as a tool to investigate different energy regimes in the fragmentation process. In the lowest KER range, we have observed that the fragmentation is happening due to concerted decay from a linear geometry of the precursor molecular ion (synchronous decay). With the increase in KER values, we observe more contributions from the bending and asymmetric stretching (asynchronous decay) modes.
Author Contributions
Conceptualization, A.D. and A.H.K.; data acquisition, A.D. and A.H.K.; analysis, A.D. and A.H.K.; interpretation, A.D. and A.H.K.; writing—original draft preparation, A.D.; writing—review and editing, A.D. and A.H.K. All authors have read and agreed to the published version of the manuscript.
Funding
This research was funded by Science and Research Engineering Board (SERB), Govt. of India via grant number ECR/2017/002055.
Data Availability Statement
The data presented in this study are available on request from the corresponding author.
Acknowledgments
The authors acknowledge the help from Rohit Tyagi, Sandeep Bari, and Sahan Sykam in accelerator operation during the experiments.
Conflicts of Interest
The authors declare no conflict of interest.
References
- Janev, R.K. Atomic and Molecular Processes in Fusion Edge Plasmas; Springer: Berlin/Heidelberg, Germany, 2013; Available online: https://link.springer.com/book/10.1007/978-1-4757-9319-2 (accessed on 9 April 2023).
- Tielens, A.G.G.M. The molecular universe. Rev. Mod. Phys. 2013, 85, 1021. [Google Scholar] [CrossRef]
- De Vries, J.; Hoekstra, R.; Morgenstern, R.; Schlathölter, T. Charge driven fragmentation of nucleobases. Phys. Rev. Lett. 2003, 91, 053401. [Google Scholar] [CrossRef]
- López-Tarifa, P.; du Penhoat, M.-A.H.; Vuilleumier, R.; Gaigeot, M.-P.; Tavernelli, I.; Le Padellec, A.; Champeaux, J.-P.; Alcamí, M.; Moretto-Capelle, P.; Martín, F.; et al. Charge driven fragmentation of nucleobases. Phys. Rev. Lett. 2011, 107, 023202. [Google Scholar] [CrossRef]
- Neumann, N.; Hant, D.; Schmidt, L.P.H.; Titze, J.; Jahnke, T.; Czasch, A.; Schöffler, M.S.; Kreidi, K.; Jagutzki, O.; Schmidt-Böcking, H.; et al. Fragmentation Dynamics of CO23+ Investigated by Multiple Electron Capture in Collisions with Slow Highly Charged Ions. Phys. Rev. Lett. 2010, 104, 103201. [Google Scholar] [CrossRef] [PubMed]
- Khan, A.; Tribedi, L.C.; Misra, D. Observation of a sequential process in charge-asymmetric dissociation of CO2q+(q=4,5) upon the impact of highly charged ions. Phys. Rev. A 2015, 92, 030701. [Google Scholar] [CrossRef]
- Adoui, L.; Tarisien, M.; Rangama, J.; Sobocinsky, P.; Cassimi, A.; Chesnel, J.Y.; Frémont, F.; Gervais, B.; Dubois, A.; Krishnamurthy, M.; et al. HCI-induced molecule fragmentation: Non-coulombic explosion and three-body effects. Phys. Scr. 2001, 2001, 89. [Google Scholar] [CrossRef]
- Siegmann, B.; Werner, U.; Lutz, H.O.; Mann, R. Complete Coulomb fragmentation of CO2 in collisions with 5.9 MeV u−1Xe18+ and Xe43+. J. Phys. B 2002, 35, 3755. [Google Scholar] [CrossRef]
- Jana, M.R.; Ghosh, P.N.; Bapat, B.; Kushawaha, R.K.; Saha, K.; Prajapati, I.A.; Safvan, C.P. Ion-induced triple fragmentation of CO23+ into C++O++O+. Phys. Rev. A 2011, 84, 062715. [Google Scholar] [CrossRef]
- Yan, S.; Zhu, X.L.; Zhang, P.; Ma, X.; Feng, W.T.; Gao, Y.; Xu, S.; Zhao, Q.S.; Zhang, S.F.; Guo, D.L.; et al. Observation of two sequential pathways of (CO2)3+ dissociation by heavy-ion impact. Phys. Rev. A 2016, 94, 032708. [Google Scholar] [CrossRef]
- Singh, R.K.; Lodha, G.S.; Sharma, V.; Prajapati, I.A.; Subramanian, K.P.; Bapat, B. Triply charged carbon dioxide molecular ion: Formation and fragmentation. Phys. Rev. A 2006, 74, 022708. [Google Scholar] [CrossRef]
- Kushawaha, R.K.; Kumar, S.S.; Prajapati, I.A.; Subramanian, K.P.; Bapat, B. Polarization dependence in non-resonant photo-triple-ionization of CO2. J. Phys. B 2009, 42, 105201. [Google Scholar] [CrossRef]
- Bryan, W.A.; Sanderson, J.H.; El-Zein, A.; Newell, W.R.; Taday, P.F.; Langley, A.J. Laser-induced Coulomb explosion, geometry modification and reorientation of carbon dioxide. J. Phys. B 2000, 33, 745. [Google Scholar] [CrossRef]
- Brichta, J.P.; Walker, S.J.; Helsten, R.; Sanderson, J.H. Ultrafast imaging of multielectronic dissociative ionization of CO2 in an intense laser field. J. Phys. B 2006, 40, 117. [Google Scholar] [CrossRef]
- Wu, C.; Wu, C.; Song, D.; Su, H.; Yang, Y.; Wu, Z.; Liu, X.; Liu, H.; Li, M.; Deng, Y.; et al. Nonsequential and sequential fragmentation of CO23+ in intense laser fields. Phys. Rev. Lett. 2013, 110, 103601. [Google Scholar] [CrossRef] [PubMed]
- Srivastav, S.; Bapat, B. Electron-impact-like feature in triple fragmentation of CO23+ under slow proton impact. Phys. Rev. A 2022, 105, 012801. [Google Scholar] [CrossRef]
- Sharma, V.; Bapat, B.; Mondal, J.; Hochlaf, M.; Giri, K.; Sathyamurthy, N. Dissociative double ionization of CO2: Dynamics, energy levels, and lifetime. J. Phys. Chem. A 2007, 111, 10205–10211. [Google Scholar] [CrossRef]
- Bhatt, P.; Singh, R.; Yadav, N.; Shanker, R. Formation, structure, and dissociation dynamics of CO2q+ (q≤3) ions due to impact of 12-keV electrons. Phys. Rev. A 2012, 85, 042707. [Google Scholar] [CrossRef]
- Wang, X.; Zhang, Y.; Lu, D.; Lu, G.C.; Wei, B.; Zhang, B.H.; Tang, Y.J.; Hutton, R.; Zou, Y. Fragmentation of CO22+ in collisions with low-energy electrons. Phys. Rev. A 2014, 61, 062705. [Google Scholar] [CrossRef]
- Hogreve, H. Stability properties of CO22+. J. Phys. B 1995, 28, L263. [Google Scholar] [CrossRef]
- Hochlaf, M.; Bennett, F.R.; Chambaud, G.; Rosmus, P. Theoretical study of the electronic states of CO2++. J. Phys. B 1998, 31, 2163–2175. [Google Scholar] [CrossRef]
- Zhang, D.; Chen, B.Z.; Huang, M.B.; Meng, Q.; Tian, Z. Photodissociation mechanisms of the CO22+ dication studied using multi-state multiconfiguration second-order perturbation theory. J. Chem. Phys. 2013, 139, 174305. [Google Scholar] [CrossRef]
- Bise, R.T.; Choi, H.; Neumark, D.M. Photodissociation dynamics of the singlet and triplet states of the NCN radical. J. Chem. Phys. 1999, 111, 4923–4932. [Google Scholar] [CrossRef]
- Bise, R.T.; Hoops, A.A.; Choi, H.; Neumark, D.M. Photodissociation dynamics of the CNN free radical. J. Chem. Phys. 2000, 113, 4179–4189. [Google Scholar] [CrossRef]
- Bise, R.T.; Hoops, A.A.; Choi, H.; Neumark, D.M. Photoisomerization and Photodissociation Dynamics of the NCN, CNN, and HNCN Free Radicals. ACS Symp. Ser. 2001, 770, 296–311. [Google Scholar]
- Larimian, S.; Erattupuzha, S.; Mai, S.; Marquetand, P.; González, L.; Baltuška, A.; Kitzler, M.; Xie, X. Molecular oxygen observed by direct photoproduction from carbon dioxide. Phys. Rev. A 2017, 95, 011404. [Google Scholar] [CrossRef]
- Weltner, W., Jr.; Van Zee, R.J. Carbon molecules, ions, and clusters. Chem. Rev. 1989, 89, 1713–1747. [Google Scholar] [CrossRef]
- Van Orden, A.; Saykally, R.J.H. Small Carbon Clusters: Spectroscopy, Structure, and Energetics. Phys. Rep. 1998, 98, 2313–2358. [Google Scholar] [CrossRef] [PubMed]
- Maul, C.; Gericke, K.H. Photo induced three body decay. Int. Rev. Phys. Chem. 1997, 16, 1–79. [Google Scholar] [CrossRef]
- Strauss, C.E.M.; Houston, P.L. Correlations without coincidence measurements: Deciding between stepwise and concerted dissociation mechanisms for ABC → A + B + C. J. Phys. Chem. 1990, 94, 8751–8762. [Google Scholar] [CrossRef]
- Döner, R.; Mergel, V.; Jagutzki, O.; Spielberger, L.; Ullrich, J.; Moshammer, R.; Schmidt-Böcking, H. Cold Target Recoil Ion Momentum Spectroscopy: A ‘Momentum Microscope’ to View Atomic Collision Dynamic. Phys. Rep. 2000, 330, 95–192. [Google Scholar] [CrossRef]
- Ullrich, J.; Moshammer, R.; Dorn, A.; Dörner, R.; Schmidt, L.P.H.; Schmidt-Böcking, H. Recoil-ion and electron momentum spectroscopy: Reaction-microscopes. Rep. Prog. Phys. 2003, 66, 1463–1545. [Google Scholar] [CrossRef]
- Duley, A.; Tyagi, R.; Bari, S.B.; Kelkar, A.H. Design and characterization of a recoil ion momentum spectrometer for investigating molecular fragmentation dynamics upon MeV energy ion impact ionization. Rev. Sci. Instrum. 2022, 93, 113308. [Google Scholar] [CrossRef]
- Dujardin, G.; Winkoun, D. State to state study of the dissociation of doubly charged carbon dioxide cations. J. Chem. Phys. 1985, 83, 6222–6228. [Google Scholar] [CrossRef]
- Wang, E.; Shan, X.; Shi, Y.; Tang, Y.; Chen, X. Momentum imaging spectrometer for molecular fragmentation dynamics induced by pulsed electron beam. Rev. Sci. Instrum. 2013, 84, 123110. [Google Scholar] [CrossRef] [PubMed]
- Itikawa, Y. Cross Sections for Electron Collisions with Carbon Dioxide. J. Phys. Chem. Ref. Data 2002, 31, 749–767. [Google Scholar] [CrossRef]
- Field, T.A.; Eland, J.H.D. Lifetimes of metastable molecular doubly charged ions. Chem. Phys. Lett. 1993, 211, 436–442. [Google Scholar] [CrossRef]
- Slattery, A.E.; Field, T.A.; Ahmad, M.; Hall, R.I.; Lambourne, J.; Penent, F.; Lablanquie, P.; Eland, J.H.D. Spectroscopy and metastability of CO22+ molecular ions. J. Chem. Phys. 2005, 122, 084317. [Google Scholar] [CrossRef]
- Newton, A.S.; Sciamanna, A.F. Metastable Dissociation of the Doubly Charged Carbon Monoxide Ion. J. Chem. Phys. 1970, 53, 132–136. [Google Scholar] [CrossRef]
- Tsai, B.P.; Eland, J.H.D. Mass spectra and doubly charged ions in photoionization at 30.4 nm and 58.4 nm. Int. J. Mass Spectrom. Ion Phys. 1980, 36, 143–165. [Google Scholar] [CrossRef]
- Alagia, M.; Candori, P.; Falcinelli, S.; Lavollée, M.; Pirani, F.; Richter, R.; Stranges, S.; Vecchiocattivi, F. Double Photoionization of CO2 Molecules in the 34–50 eV Energy Range. J. Phys. Chem. A 2009, 113, 14755–14759. [Google Scholar] [CrossRef]
- Eland, J.H.D. Dynamics of fragmentation reactions from peak shapes in multiparticle coincidence experiments. Laser Chem. 1991, 11, 259–263. [Google Scholar] [CrossRef]
- Eland, J.H.D. The dynamics of three-body dissociations of dications studied by the triple coincidence technique PEPIPICO. Mol. Phys. 1987, 61, 725–745. [Google Scholar] [CrossRef]
- Tian, C.; Vidal, C.R. Single to quadruple ionization of CO2 due to electron impact. Phys. Rev. A 1998, 58, 3783. [Google Scholar] [CrossRef]
- Dalitz, R.H. On the analysis of -meson data and the nature of the -meson. Philos. Mag. J. Sci. 1953, 44, 1068–1080. [Google Scholar] [CrossRef]
- Laksman, J.; Månsson, E.P.; Grunewald, C.; Sankari, A.; Gisselbrecht, M.; Céolin, D.; Sorensen, S.L. Fragmentation of CO22+ in collisions with low-energy electrons. Phys. Rev. A 2012, 136, 104303. [Google Scholar]
- Guillemin, R.; Decleva, P.; Stener, M.; Bomme, C.; Marin, T.; Journel, L.; Marchenko, T.; Kushawaha, R.K.; Jänkälä, K.; Trcera, N.; et al. Selecting core-hole localization or delocalization in CS2 by photofragmentation dynamics. Nat. Comm. 2015, 6, 1–6. [Google Scholar] [CrossRef] [PubMed]
- Wang, E.; Shan, X.; Shen, Z.; Gong, M.; Tang, Y.; Pan, Y.; Lau, K.C.; Chen, X. Pathways for nonsequential and sequential fragmentation of CO23+ investigated by electron collision. Phys. Rev. A 2015, 91, 052711. [Google Scholar] [CrossRef]
- Herzberg, G. Molecular Spectra and Molecular Structure II. Infrared and Raman Spectra of polyatomic molecules. Van Nostrand 1945, 200, 300–400. [Google Scholar]
Figure 1.
Ion-ion coincidence spectra for the fragmentation of CO under the impact of 1 MeV proton for (a) the TOF of the second ion versus the TOF of the first ion and (b) the TOF of the third ion versus the TOF of the second ion. The plot for the TOF of third ion versus the sum TOF of the first and the second ion is also shown in the inset.

Figure 2.
KER distribution for the fragmentation of CO into O + CO. The vertical lines on the top axis are the calculated KER values as reported in ref [22].
Figure 2.
KER distribution for the fragmentation of CO into O + CO. The vertical lines on the top axis are the calculated KER values as reported in ref [22].

Figure 3.
Experimentally observed Dalitz plots of the three-body fragmentation of CO, (a) for CO→ C + O + O, (b) CO→ C + O + O, and of CO, (c) for CO→ C + O + O. The corresponding Newton Diagrams are shown in (d–f), respectively.
Figure 3.
Experimentally observed Dalitz plots of the three-body fragmentation of CO, (a) for CO→ C + O + O, (b) CO→ C + O + O, and of CO, (c) for CO→ C + O + O. The corresponding Newton Diagrams are shown in (d–f), respectively.

Figure 4.
(a) Schematic diagram of a CO (q = 2, 3) molecular ion fragmenting into C + O + O along with definitions of different angles (, , , , and ) in the momentum space (discussed in the text). (b) The distribution of the momentum space molecular bond angle and (c) the angle for the C + O + O channel. The distribution of (d) , (e) , and (f) for all the three-body breakup channels ((1,1,0), (0,1,1), and (1,1,1)). The scaling is performed for visual clarity.

Figure 5.
The KER distributions for the three-body fragmentation of CO (q = 2, 3) into (a) (1,1,0) and (b) (0,1,1) channels along with the kinetic energies (KEs) of the individual fragments. (c) KEs of individual fragments in the (1,1,1) channel. The arrows show the position of the most probable KE of each fragments. The scaling is performed for visual clarity.

Figure 6.
(a–c) The KER distributions, (d–f) Dalitz plots, (g–i) Newton diagrams, and (j–l) the distributions of the angle for the three-body fragmentation of CO into (1,1,1) channel. The KER ranges of the three columns are; Left column: 0–9.6 eV, Middle column: 9.6–16.8 eV, Right column: 16.8–35 eV.


Table 1.
The possible molecular states of CO dissociating into O + CO along with the theoretically calculated values of KER by Zhang et al. [22] using multistate multiconfiguration second-order perturbation theory (MS-CASPT2) and complete active space self-consistent field (CASSCF) methods.
Table 1.
The possible molecular states of CO dissociating into O + CO along with the theoretically calculated values of KER by Zhang et al. [22] using multistate multiconfiguration second-order perturbation theory (MS-CASPT2) and complete active space self-consistent field (CASSCF) methods.
| Molecular | Dissociation | KER |
|---|---|---|
| States | Limit | (eV) [22] |
| 6.01 | ||
| 6.11 | ||
| 6.24 | ||
| 6.51 | ||
| 5.37 | ||
| 7.93 | ||
| 8.15 | ||
| 8.98 | ||
| 9.50 | ||
| 10.05 | ||
| 10.68 |
Table 2.
Comparison of the slopes of the best-fit line to the various islands in ion pair coincidence map obtained from CO in collision with 1 MeV proton with theoretical predictions [42,43] and previous experimental results [18,19,44]. Here, s(i) (s(i)) represents the C ion released in the first (second) step of the initial charge separation process, whereas s(d) represents the deferred charge separation process. R is the regression coefficient of the best-fit line.
| Fragmentation Channel | Experimental Results | ||||||||
|---|---|---|---|---|---|---|---|---|---|
| Theoretical Predictions [42,43] | Present Experiment | Electron Impact | |||||||
| s(i) | s(i) | s(d) | Concerted | Slope (Fitted) | R | 0.2 keV [19] | 0.6 keV [44] | 12 keV [18] | |
| O + CO | - | - | - | −1 | −1.09 ± 0.03 | 0.99 | −1.01 ± 0.01 | −1.00 ± 0.02 | −1.00 ± 0.02 |
| C + O + O | −0.5 | −2.33 | −1.0 | ∞ | −2.21 ± 0.01 | 0.99 | −1.75 ± 0.04 | −2.75 ± 0.04 | −2.75 ± 0.04 |
| O + O + C | −0.57 | - | −1.0 | −1 | −1.16 ± 0.02 | 0.97 | −1.03 ± 0.03 | −1.00 ± 0.02 | −1.00 ± 0.02 |
Disclaimer/Publisher’s Note: The statements, opinions and data contained in all publications are solely those of the individual author(s) and contributor(s) and not of MDPI and/or the editor(s). MDPI and/or the editor(s) disclaim responsibility for any injury to people or property resulting from any ideas, methods, instructions or products referred to in the content. |
© 2023 by the authors. Licensee MDPI, Basel, Switzerland. This article is an open access article distributed under the terms and conditions of the Creative Commons Attribution (CC BY) license (https://creativecommons.org/licenses/by/4.0/).
Share and Cite
MDPI and ACS Style
Duley, A.; Kelkar, A.H.
Fragmentation Dynamics of
AMA Style
Duley A, Kelkar AH.
Fragmentation Dynamics of
Duley, Avijit, and Aditya. H. Kelkar.
2023. "Fragmentation Dynamics of
Note that from the first issue of 2016, this journal uses article numbers instead of page numbers. See further details here.