
Resonance States of Negative Hydrogen-like Ions in Quantum Plasmas


1
College of Physical Science and Technology, Heilongjiang University, Harbin 150080, China
2
School of Physics, Harbin Institute of Technology, Harbin 150001, China
*
Author to whom correspondence should be addressed.
Atoms 2023, 11(4), 69; https://doi.org/10.3390/atoms11040069
Submission received: 4 March 2023
/
Revised: 2 April 2023
/
Accepted: 4 April 2023
/
Published: 7 April 2023
(This article belongs to the Section Atomic, Molecular and Nuclear Spectroscopy and Collisions)
Abstract
:We studied the 1Se and 1,3Po resonance states of negative hydrogen-like ions immersed in quantum plasmas. The exponential cosine screened Coulomb potential was considered to model the quantum plasma environment. The correlated exponential wave functions in which the exponents were generated by a pseudo-random technique were applied to represent the correlation effects between the charged particles. The stabilization method was used to calculate the resonance parameters (position and width). The resonance parameters (position and width) for , , , 1, , and ∞ embedded in quantum plasmas are reported for various screening parameters. The 1Se resonance parameters for , , 1, , ions and 1,3 Po states for , , , 1, , and ∞ of the proposed systems are reported for the first time in the literature.
1. Introduction
The study of the resonance states of two-electron negative ions is of great theoretical and experimental importance because negative ions are very sensitive to electron–electron correlations. The theoretical and experimental studies of 1Se and 1,3Po resonance states in two-electron anions involve mainly the two simplest examples, namely, the negative hydrogen ions (∞) and the positronium negative ion (). The is a simple three-lepton system, predicted theoretically by Wheeler [1] and observed ( is formed by a 420 eV positron beam striking a thin film of carbon in a vacuum [2,3]) in the laboratory by Mills [2,3]. After the first prediction of this ion, several studies have been reported on this simplest three-body system. In addition to extensive theoretical studies of the resonance states [4,5,6,7,8,9,10,11,12,13,14,15,16,17,18], physicists have also made experimental observations [19,20,21,22,23] about resonance. New developments in the field of effective emission experiments on alkali metal coated-surfaces were recently highlighted in a review article by Nagashima [20,22,24] and Mills [21]. Notably, the first and only experiment on a shape resonance state was reported by Michishio et al. [23].
It is well known that hydrogen negative ions (∞) are the main source of continuous opacity in the solar photosphere. Over the last few decades, many researchers have made considerable efforts to investigate theoretically the resonance state of ∞ using different sophisticated methods or techniques [25,26,27,28,29,30,31,32,33,34,35,36]. From the experimental side, Hamm and colleagues [37,38,39,40] reported the observation of ∞ resonance states, and recent experimental progress has been summarized in a review [41].
Negative ions having two electrons, in particular, , , , 1, as well as ∞, have a very simple bound-state spectrum, which contains only one bound state (ground state) with a single 1S state with total angular momentum L = 0. The stability of has been known for a long time since its discovery by Kuang [42]. Subsequently, the bound state nature of this elusive negative ion was reported by Frolov et al. [43,44,45,46]. The resonance states of two-electron negative ions have been theoretically investigated so far based on the complex coordinate rotation method [18,35,36], the variational method [25,33], the stabilization method [17], the close coupling method [13,14,29,31], the adiabatic molecular approximation [6,10], the R-matrix [27], etc. In addition to the theoretical and experimental progress made for the unscreened case, resonance states of two-electron systems have also been studied theoretically in a screening environment [47,48,49,50,51,52,53,54,55,56].
In addition, P. K. Shukla et al. [57] found that the exponential cosine screened Coulomb potential (ECSCP) can better model the effective electron-ion potential in a dense quantum plasma, expressed in terms of the screening parameter as:
where the screening parameter is related to the frequency of the plasma and satisfies the relation: . The screening parameters determine the screening effect, and as the screening parameters increase, the screening also increases. ECSCP plays a fundamental role in the study of atomic structures and collisions in quantum plasmas and has the advantage that it exhibits a stronger screening effect than the screening Coulomb potential due to the presence of an oscillatory part (the cosine term in the potential). It can become a pure Coulomb potential when the screening parameter becomes zero. Ghoshal et al. pioneered a theoretical study of the nature of the interaction of [58,59] and [60] with ECSCP and reported precise results for the S-wave resonance state of ∞ [61] in the ECSCP using the stabilization method. Kar and Ho [62] described the effects on various properties of within the ECSCP.
In the present work, we studied the 1Se and 1,3Po resonance states of negative hydrogen-like ions embedded in quantum plasma environments. The 1Se and 1,3Po resonance states are affected by the screening environment in which the Coulomb potential is replaced by an exponential cosine screened Coulomb potential. Using a correlated exponential wave function within the framework of the stabilization method, we determined the precise values of the resonance parameters (position and width) for the different screening parameters. In this paper, we report the resonance parameters of each ionic system lying below the N = 2 threshold of the respective subsystem. To our knowledge, such resonance states have not been reported previously for the exponential cosine screened Coulomb potential. The plan of this paper is as follows: Section 2 describes the basic computational aspects of the study; Section 3 presents the results and discussion in connection with our calculations; in Section 4, we present the conclusions of the study. Atomic units (a.u.) are used throughout the work.
2. Theory
The non-relativistic Hamiltonian describing a two-electron negative ion system in a screening environment is:
where 1, 2 and 3 represent the two electrons 1, 2 with the nucleus, respectively, and represents the relative distance between the two particles. The mass constants , , , and used in this paper were 206.7682826me, 1836.15267389me, 3670.48296785me, 5496.92153588me [63] and 273.132426me [64].
For the S and P states, we considered an exponential wave function of the following form to describe the system:
In the above equation, is the linear expansion coefficient; are the linear variational parameters; is a scaling constant; is the number of basis function terms, and the operator denotes the exchange of two particles marked 1 and 2, i.e.: . L = 0 for the S-state, L = 1 for the P-state. for the singlet state, for the triplet state. The nonlinear parameters in the wave function formulation were chosen from three positive intervals, i.e., [,], [,] and [], where , following a pseudorandom technique [65]
where the symbol denotes the fractional part of a real number; are scaling factors, = 0, = a, = b, = c, = 1, = 1 and . In the course of theoretical numerical calculations, good results can be obtained by the optimal choice of these parameters.
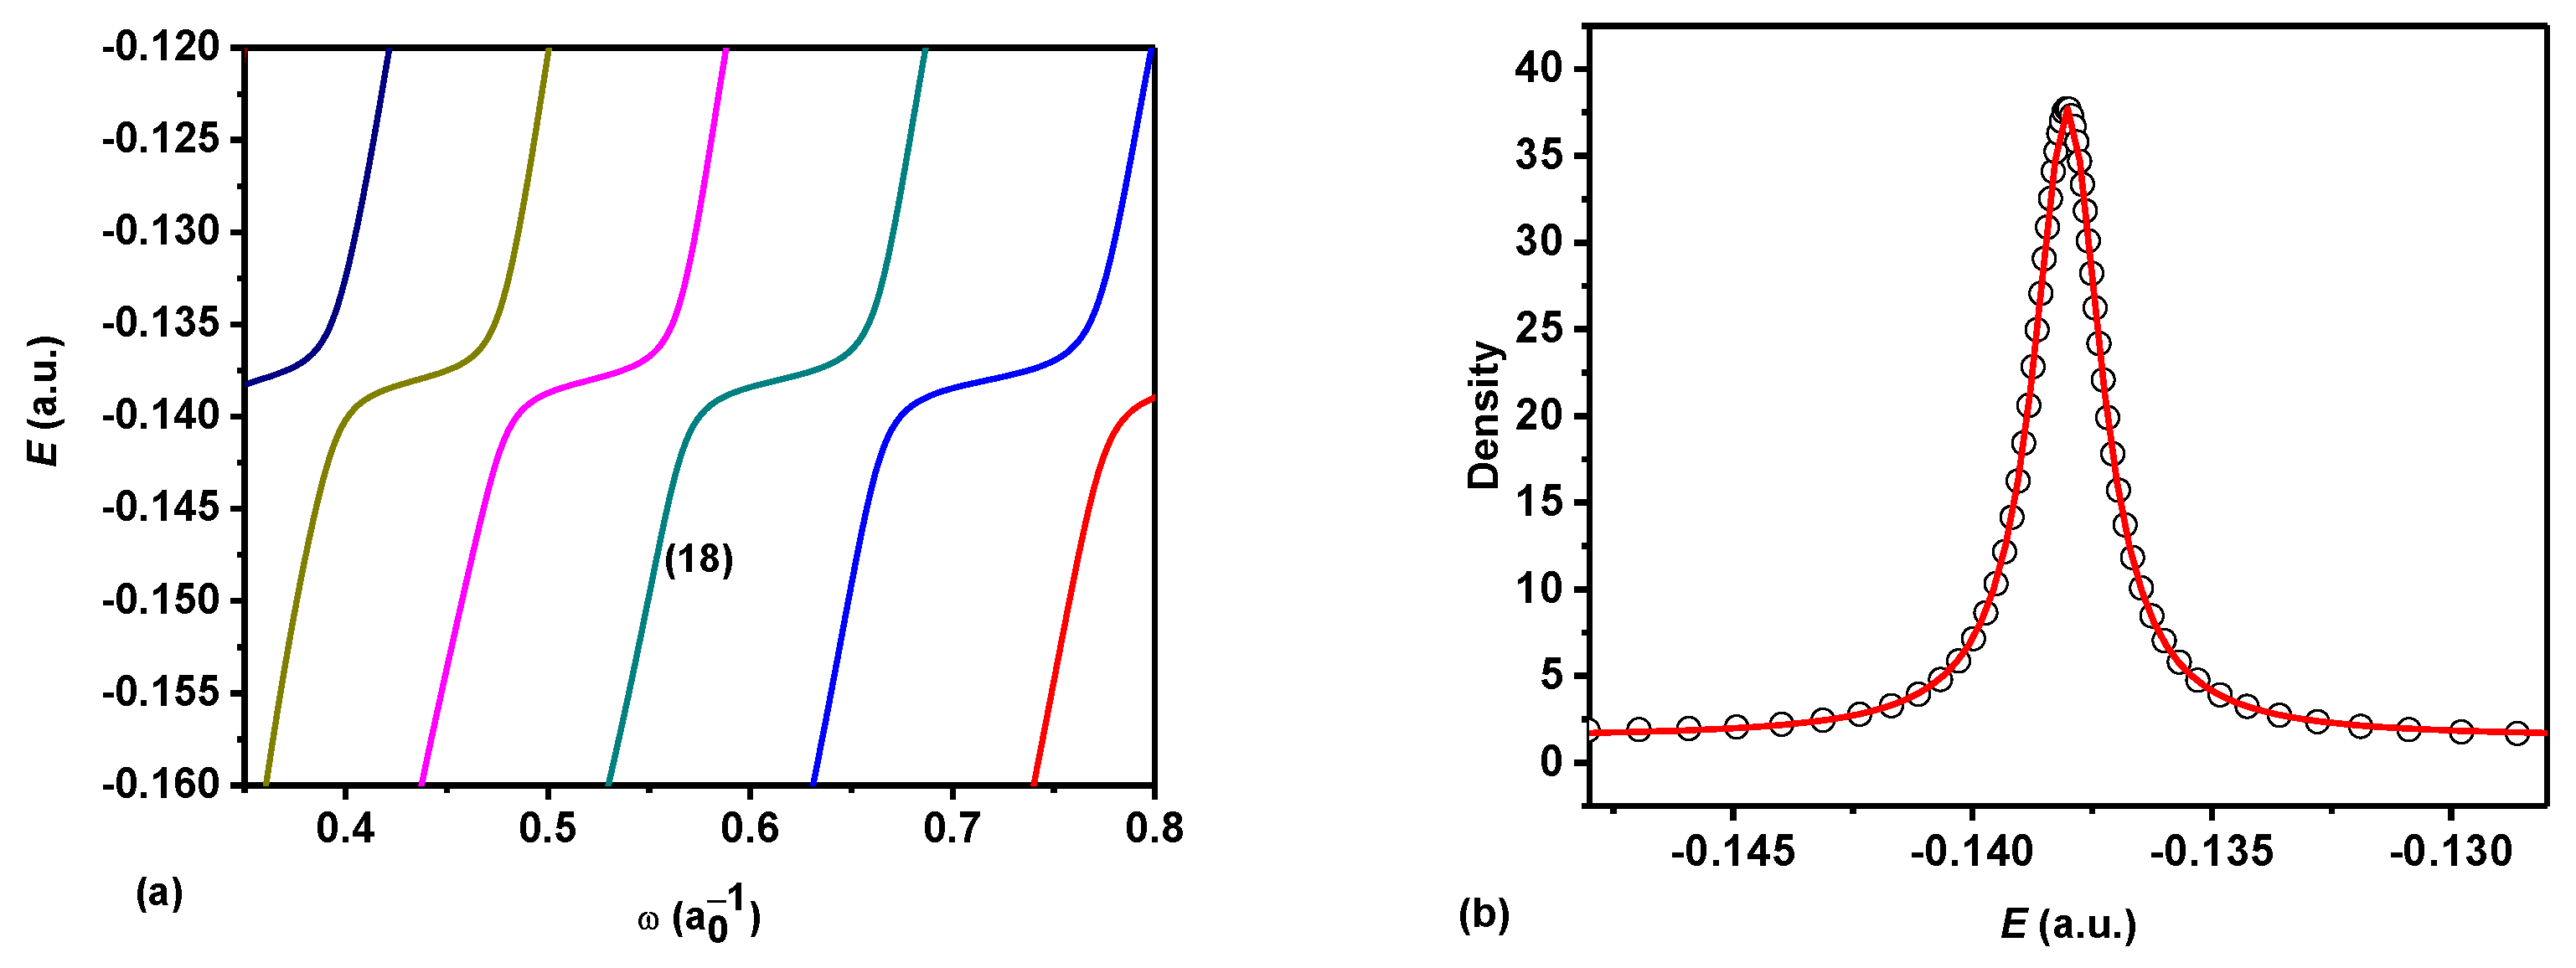
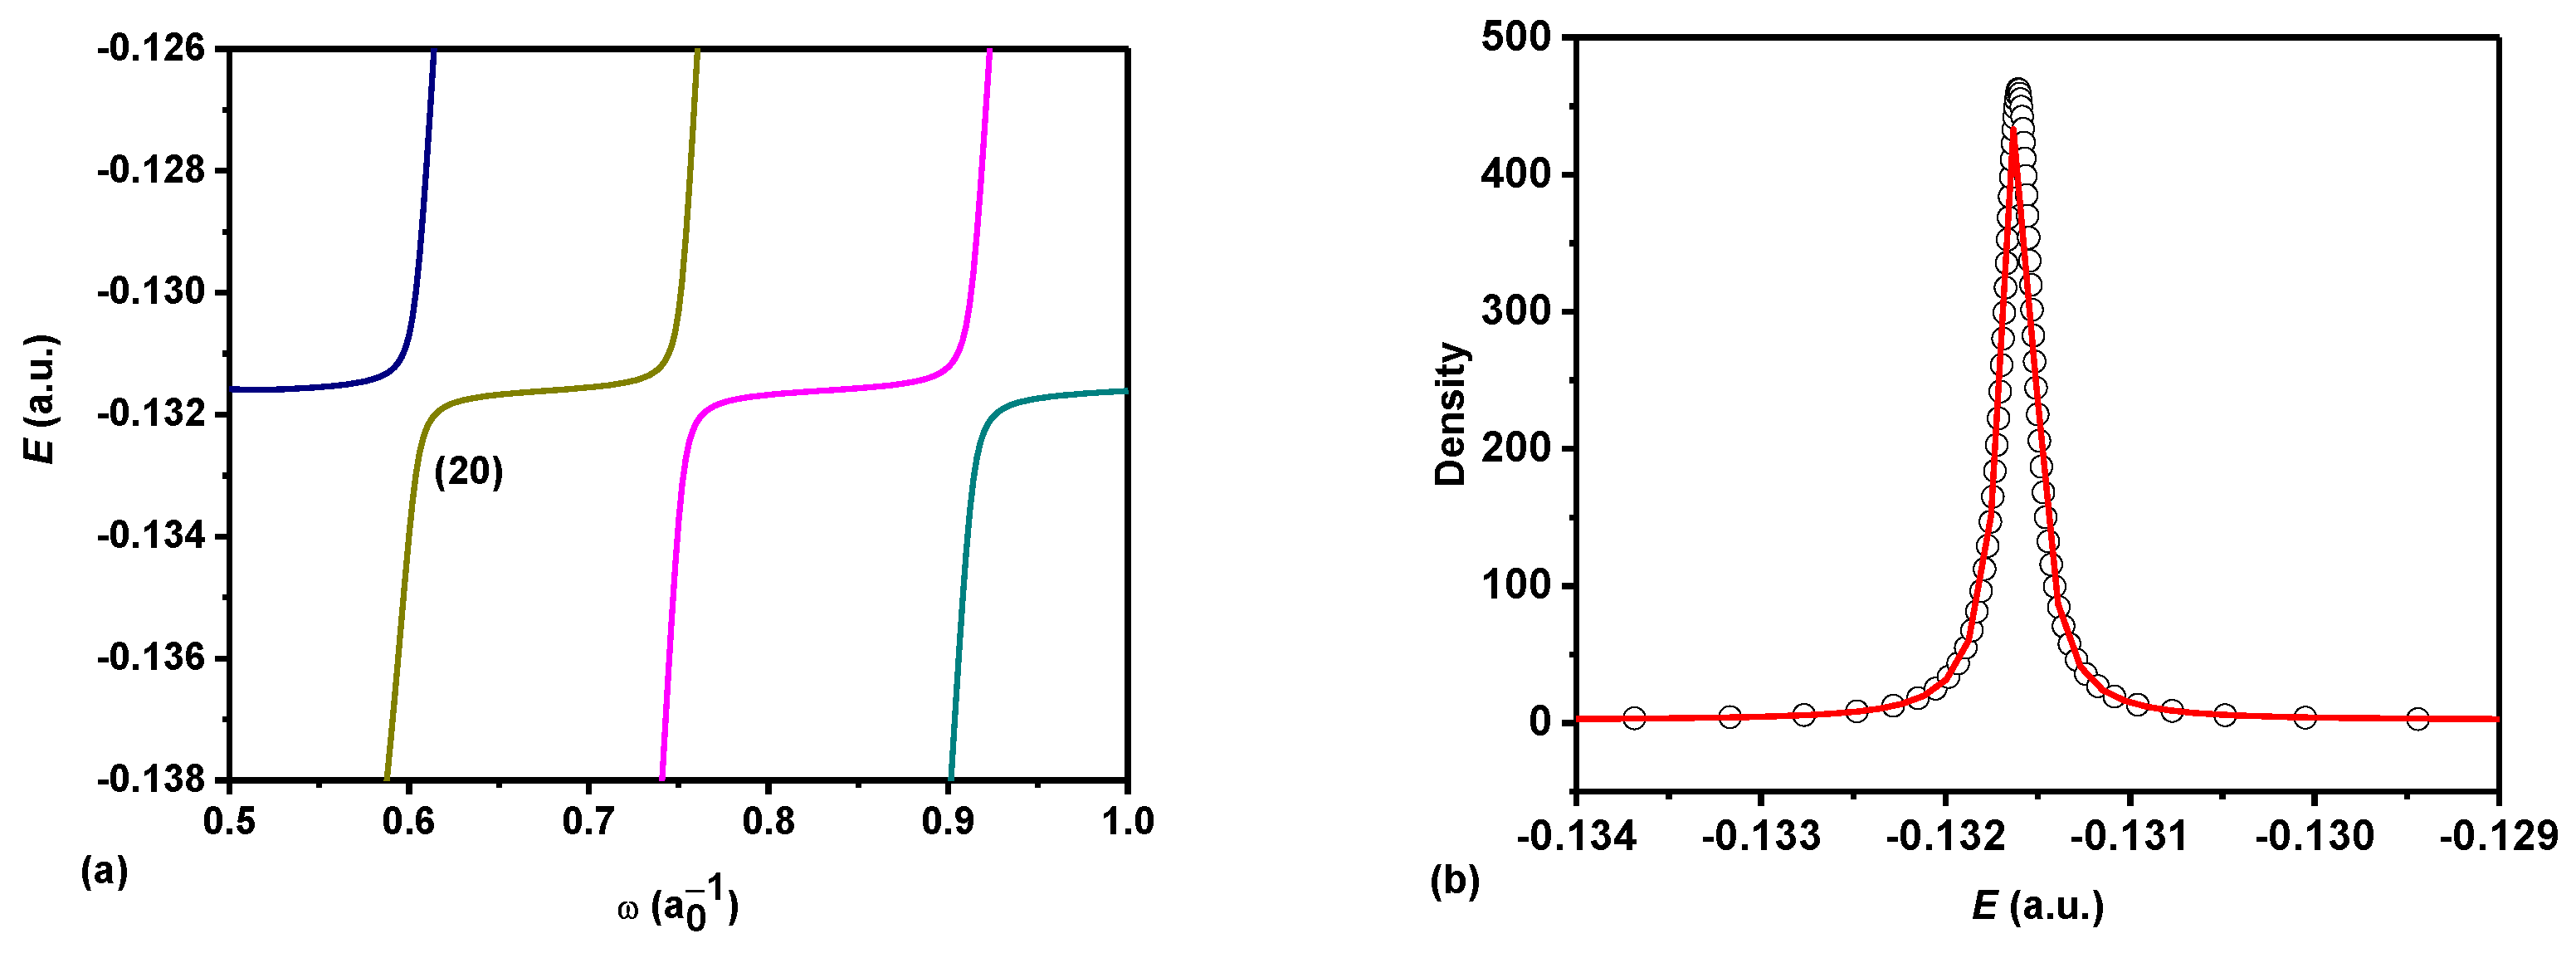
Regarding the calculation of the resonant states, we used the stabilization method proposed by Mandelshtam et al. [66] and later developed by Ho [67] for atomic resonance calculations, which is a powerful method for calculating atomic resonances. The advantage of this method is that it requires neither the use of a complex analytic extension nor the solution of the scattering function, and only the L2 function is needed to calculate resonance energy and width, which is a simple and efficient alternative in the field of atomic resonance calculations. In the first step to exploit the stabilization method, we diagonalized Hamiltonian using the wave function to calculate the corresponding energy level . We then plotted a steady-state diagram (see Figure 1a and Figure 2a) of as a function of . Smooth or slowly decreasing energy levels in the diagram indicate the location of the resonance at energy . In order to extract the specific resonance parameter (), the density of the resonance states for each single energy level in the stable plateau needs to be calculated by applying the following equation:
where index i denotes the ith value of , and the index n denotes the nth level of the resonance.
After calculating the resonance density of the states by the above equation, we fit it to the following Lorentzian form to obtain the resonant energy and the resonant width :
where is the baseline offset, A is the total area between the curve down to the baseline, represents the centre of the peak, and indicates the full width of the curve peak at half height. When fitting in Lorentzian form, the best fit (closest to 1.0), the ideal result for a particular resonance, can be determined by observing the minimum value of and the best value of , the square of the correlation coefficients (see Figure 1b and Figure 2b).
3. Results and Discussion
By taking advantage of the stabilization method, we calculated the resonance parameters (RPs) for the 1Se and 1,3Po states of negative hydrogen-like ions interacting with ECESCP. The resonance energies and widths for the systems , , , 1, , and ∞ are presented in Table 1, Table 2, Table 3, Table 4, Table 5 and Table 6 in terms of screening parameters. In Figure 1 and Figure 2, the stabilization diagram and the best fitting of the density of the resonance states for the systems and are displayed. We calculated the density of the resonant states for a single energy level in the range 0.3 to 1.0 of . Figure 1b and Figure 2b show, respectively, the best fit of the density of the resonant states corresponding to the 18th and 20th energy levels in the stabilization plateau in Figure 1a and Figure 2a. From the fittings, we obtained the resonance energy and resonance width in the 1Se state of under the screening parameter , and the resonance energy and resonance width in the 3Po(1) state of under the screening parameter . By changing the value of , the RPs for different effective parameters and different ionic systems were obtained.
Table 1 and Table 2 provide the RPs of seven ions from to in the lowest 1Se state for different screening parameters. The Se state RPs for and ∞ for different screening parameters were comparable with the previously published data by Ghoshal and Ho [59,61]. Table 3 and Table 4 display the resonance parameters of seven ions from to ∞ in the lowest 3Po state under different screening parameters. The lowest 1Po state RPs for the proposed systems are listed in Table 5 and Table 6. When the system was in an unscreened environment, i.e., , the interaction potential turned into a Coulomb potential. For and ∞, the results calculated by us were comparable to those in published reports; the comparisons are presented in Table 3 and Table 4. It is of special interest to mention here that the 1Se resonance parameters for the system ∞ were in good accord with reported results by Ho et al. [68].
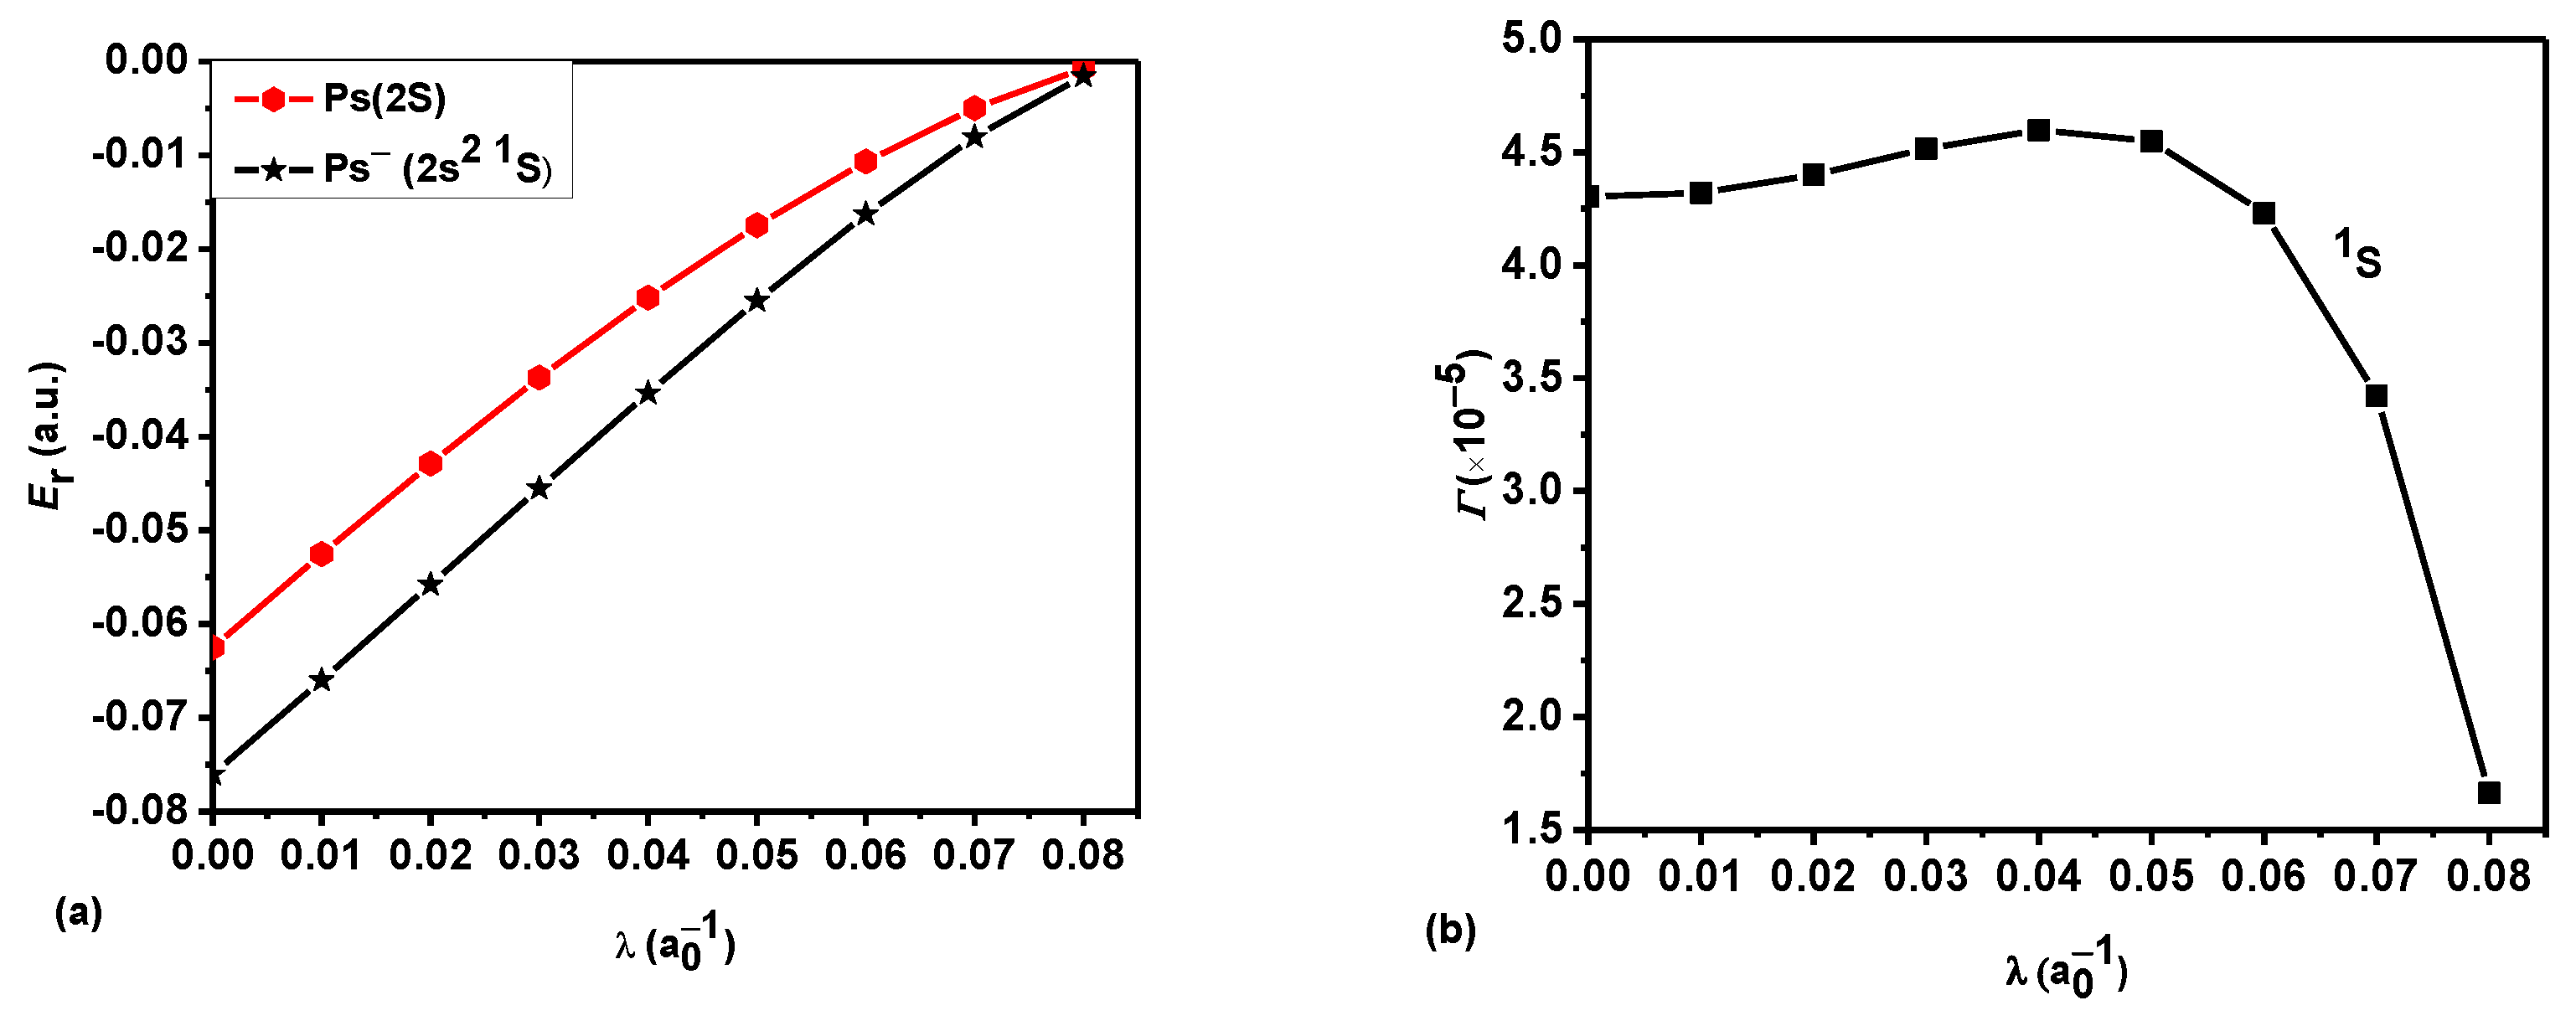
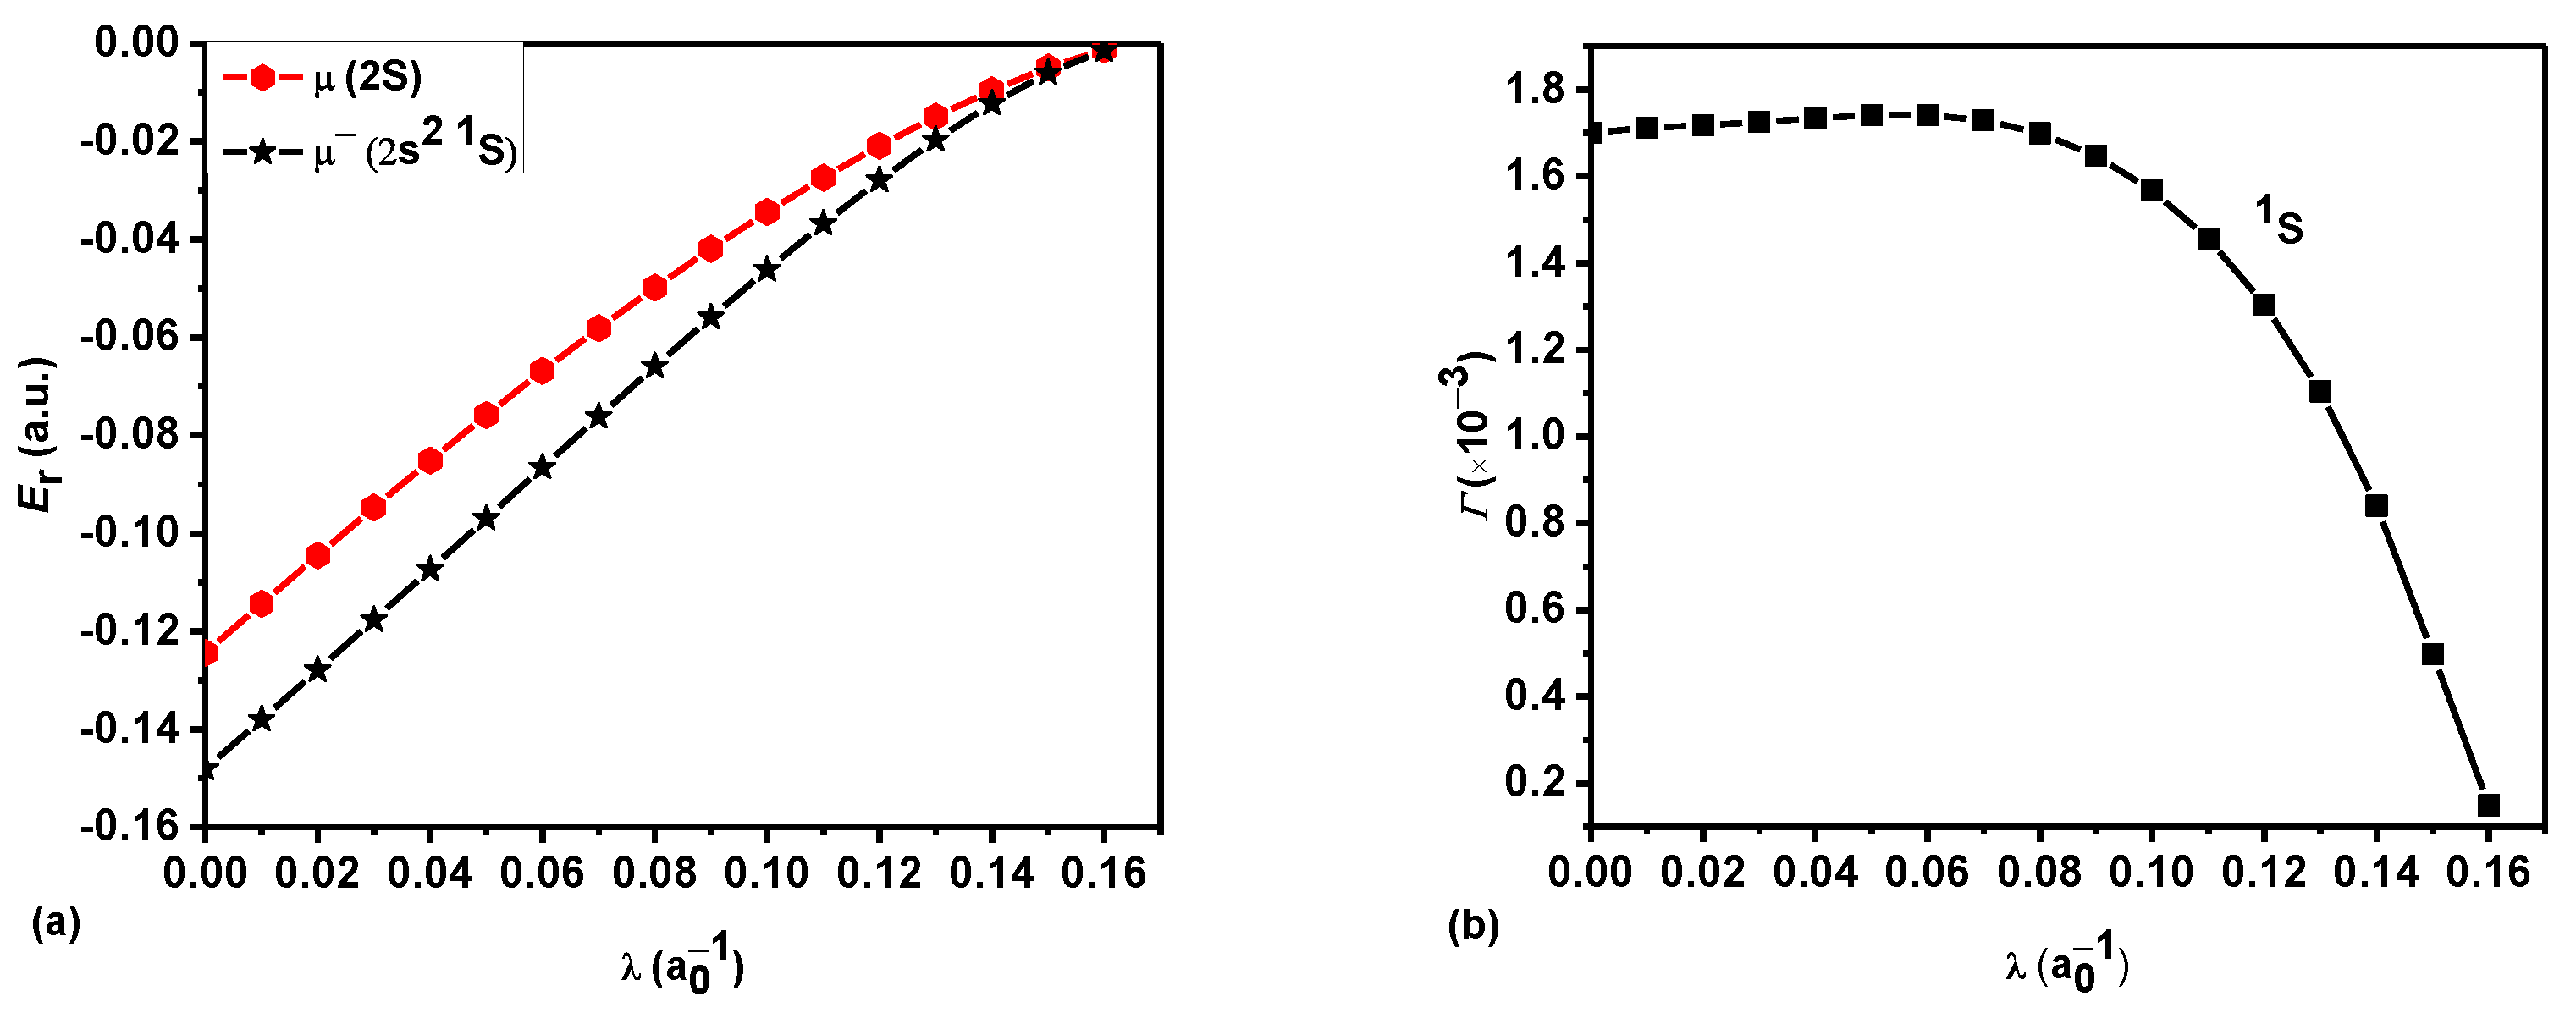
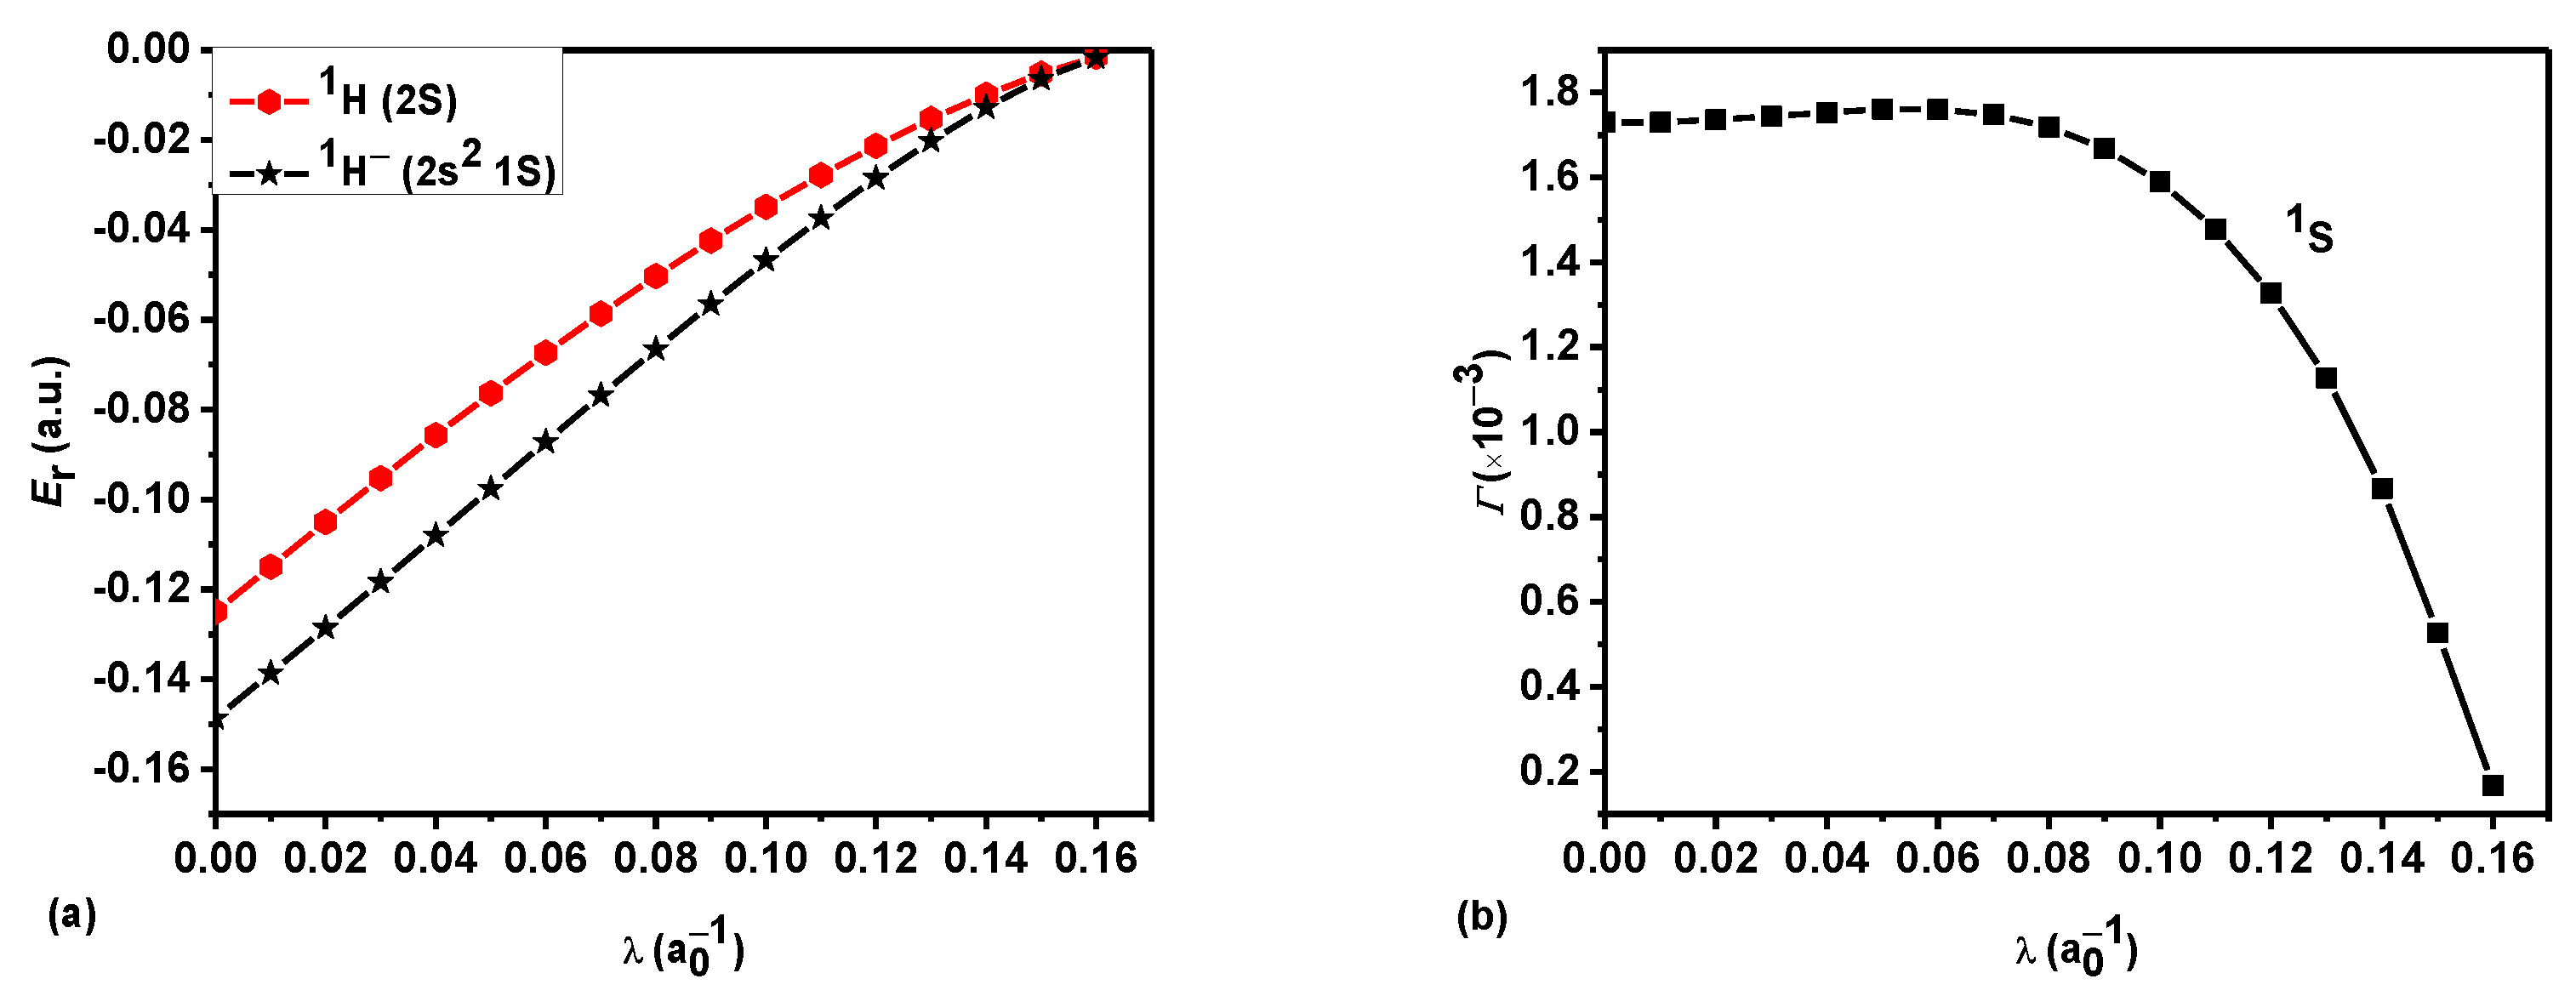
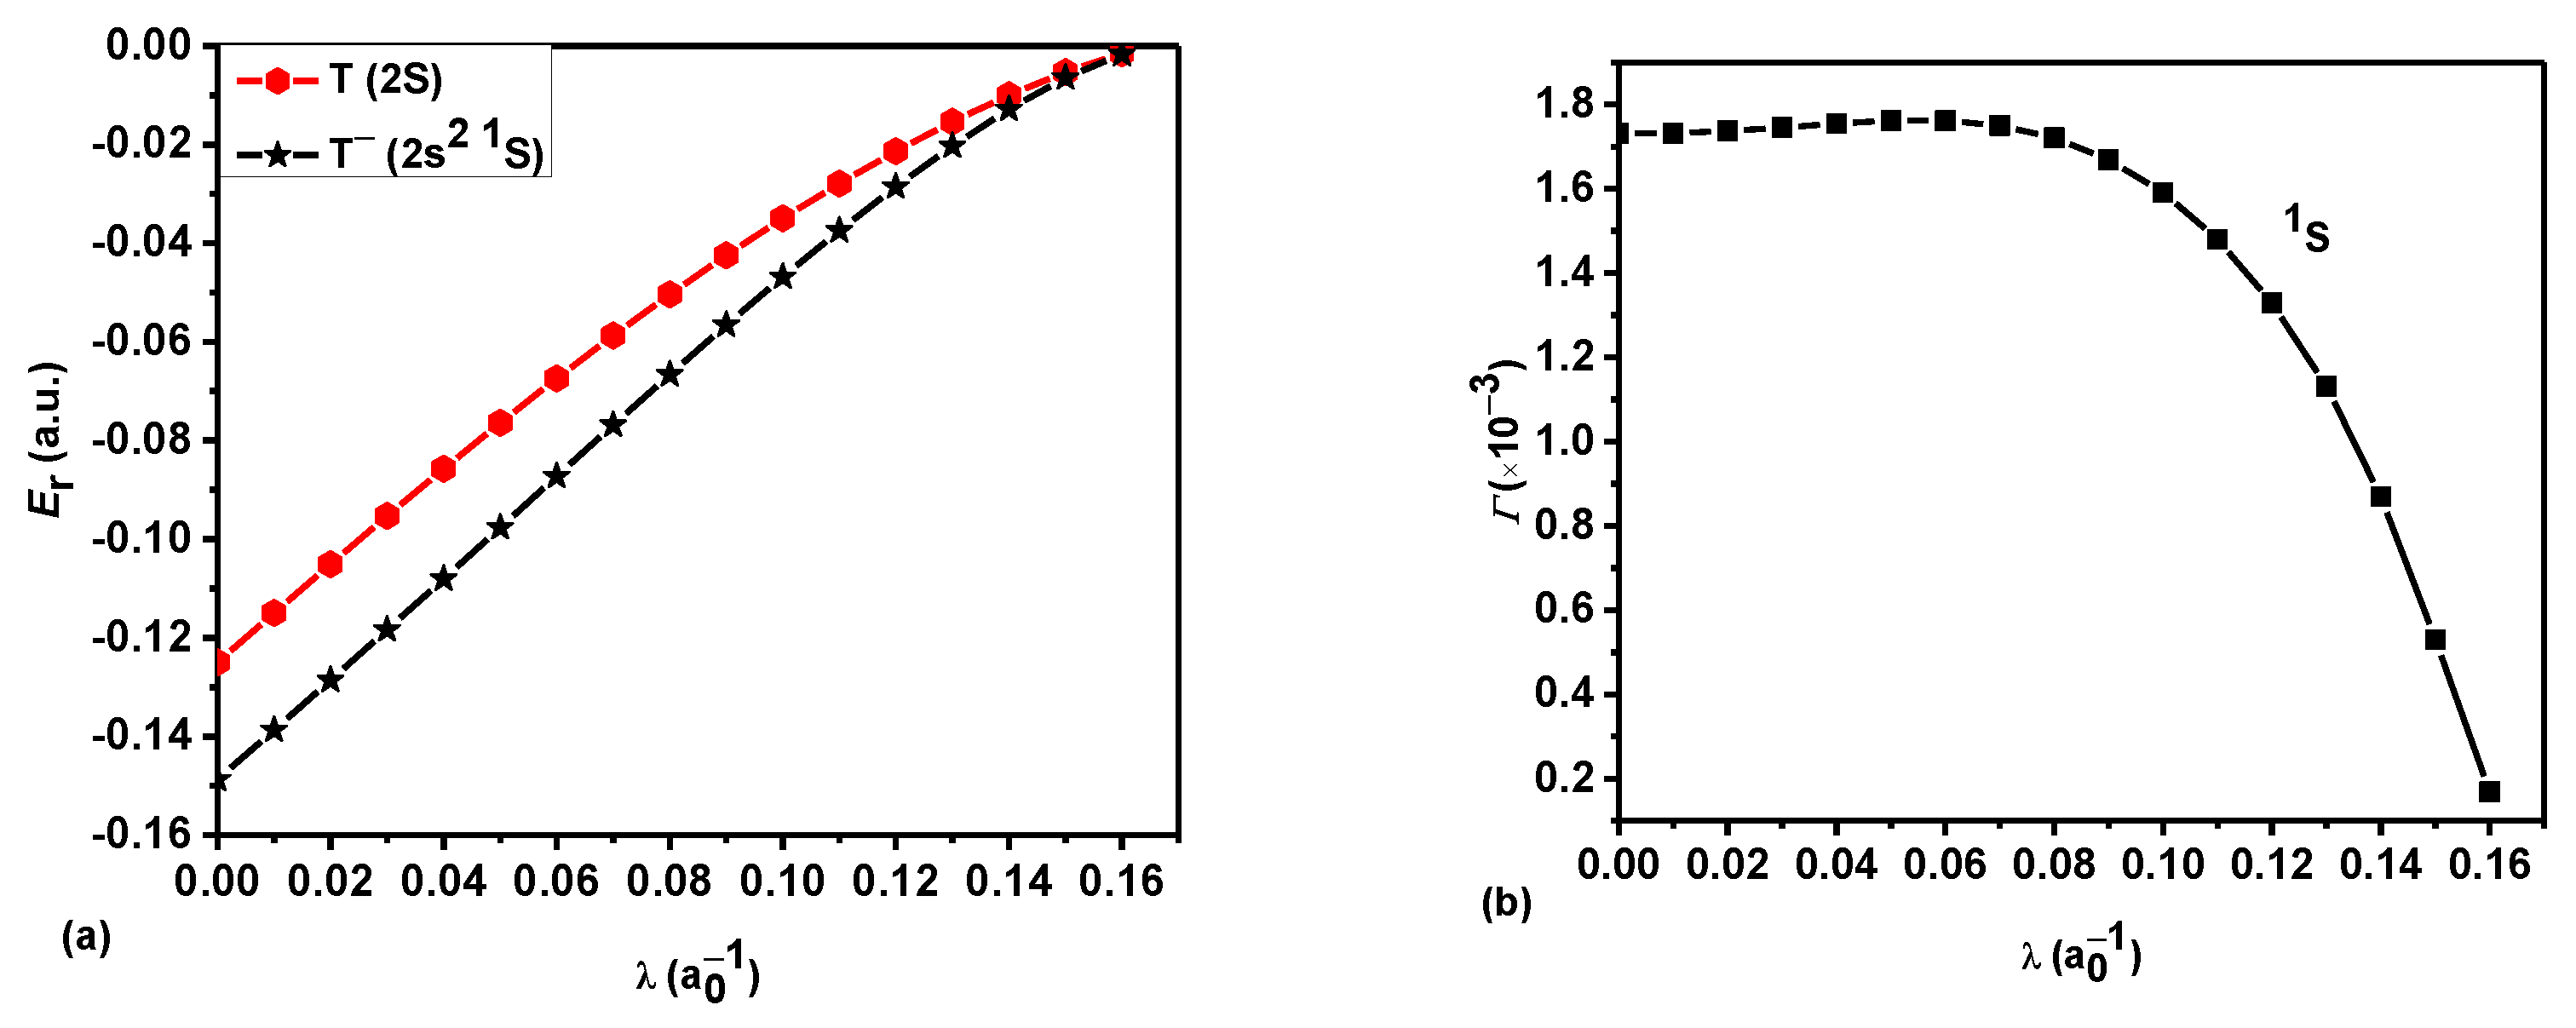
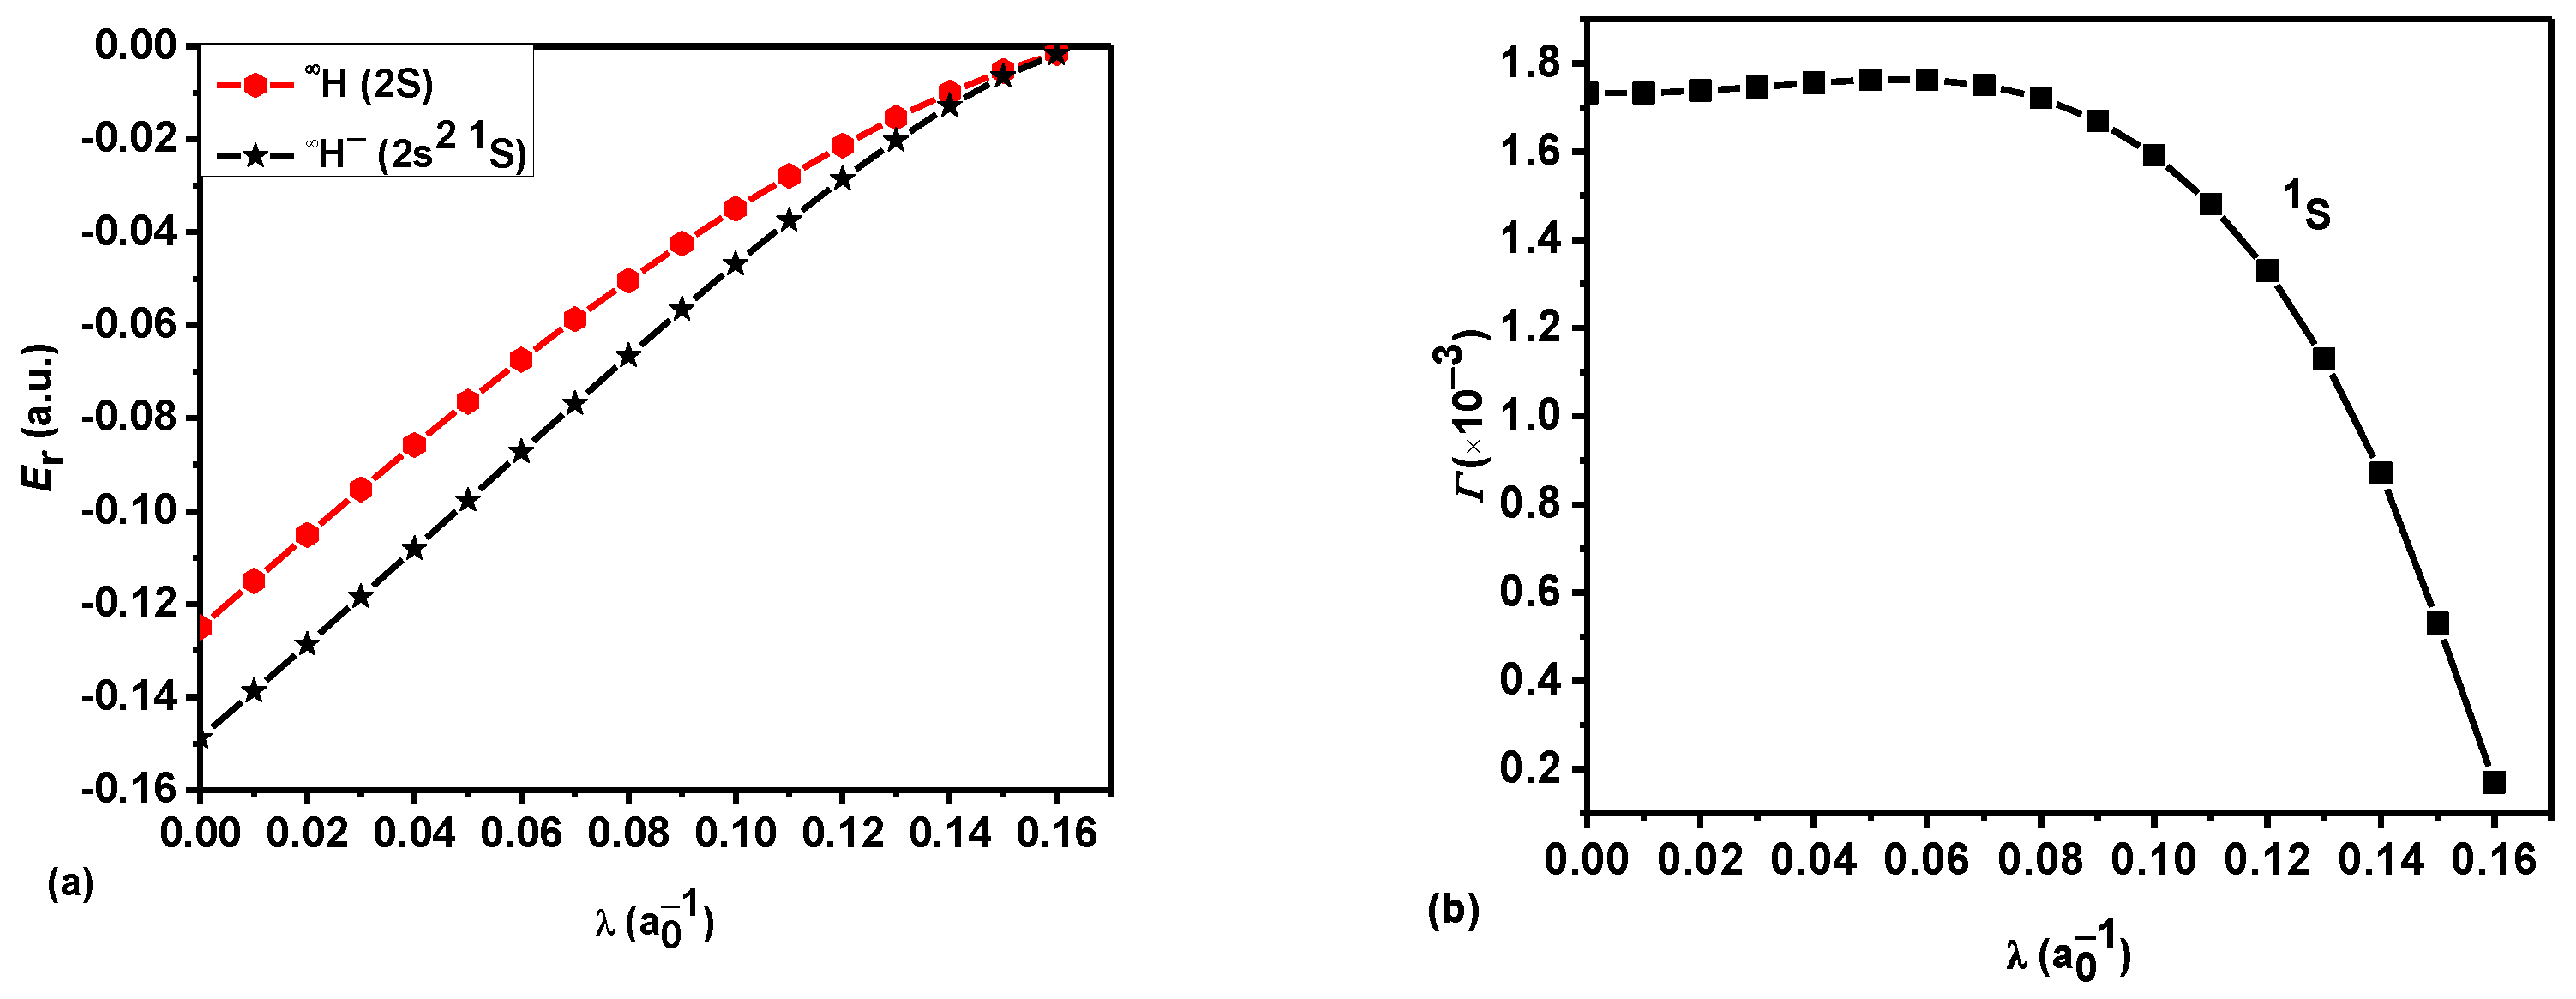
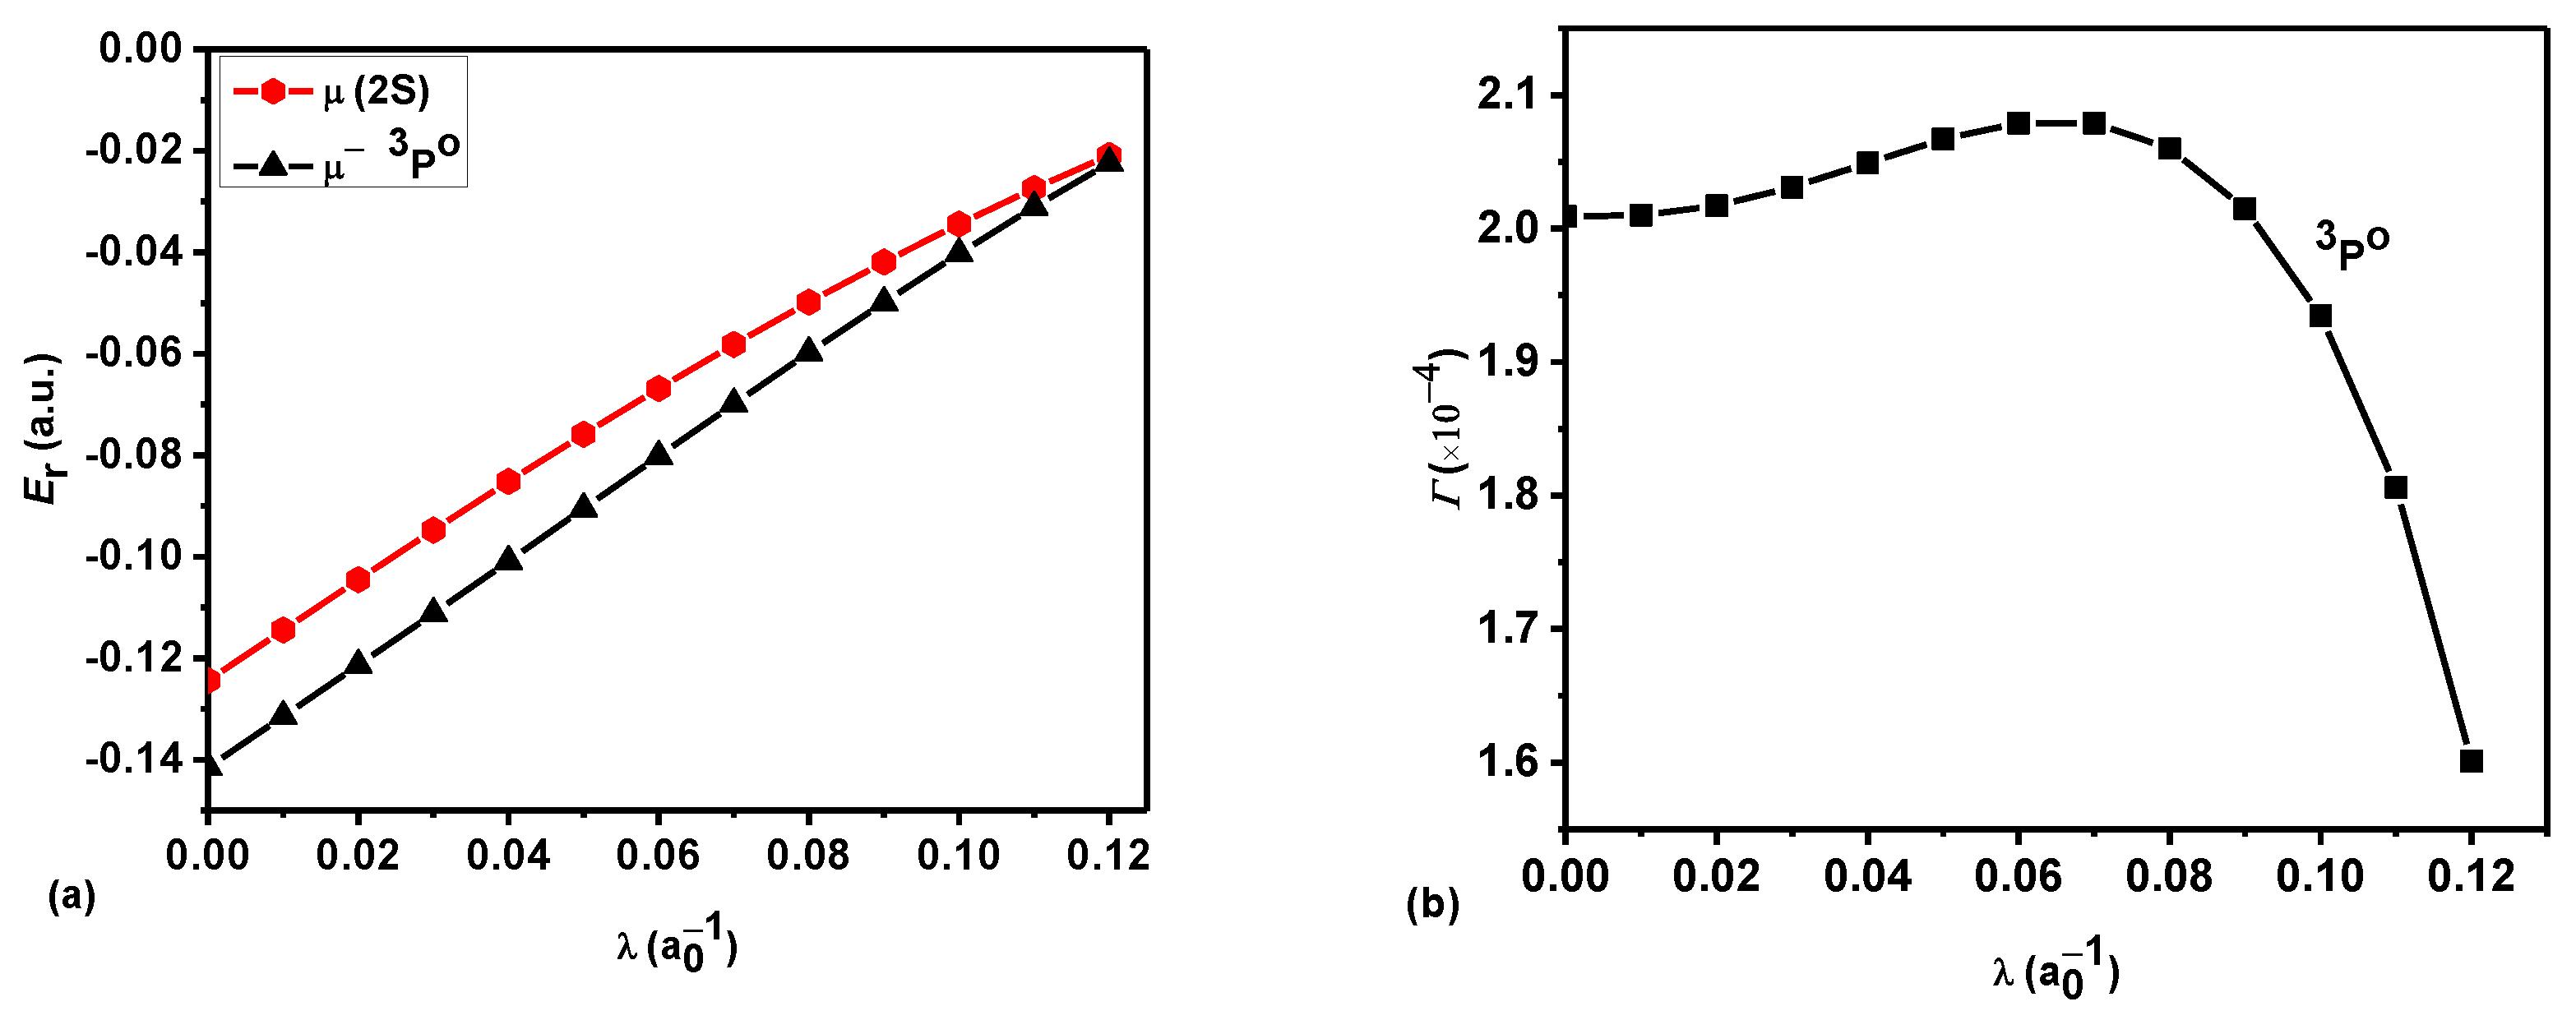
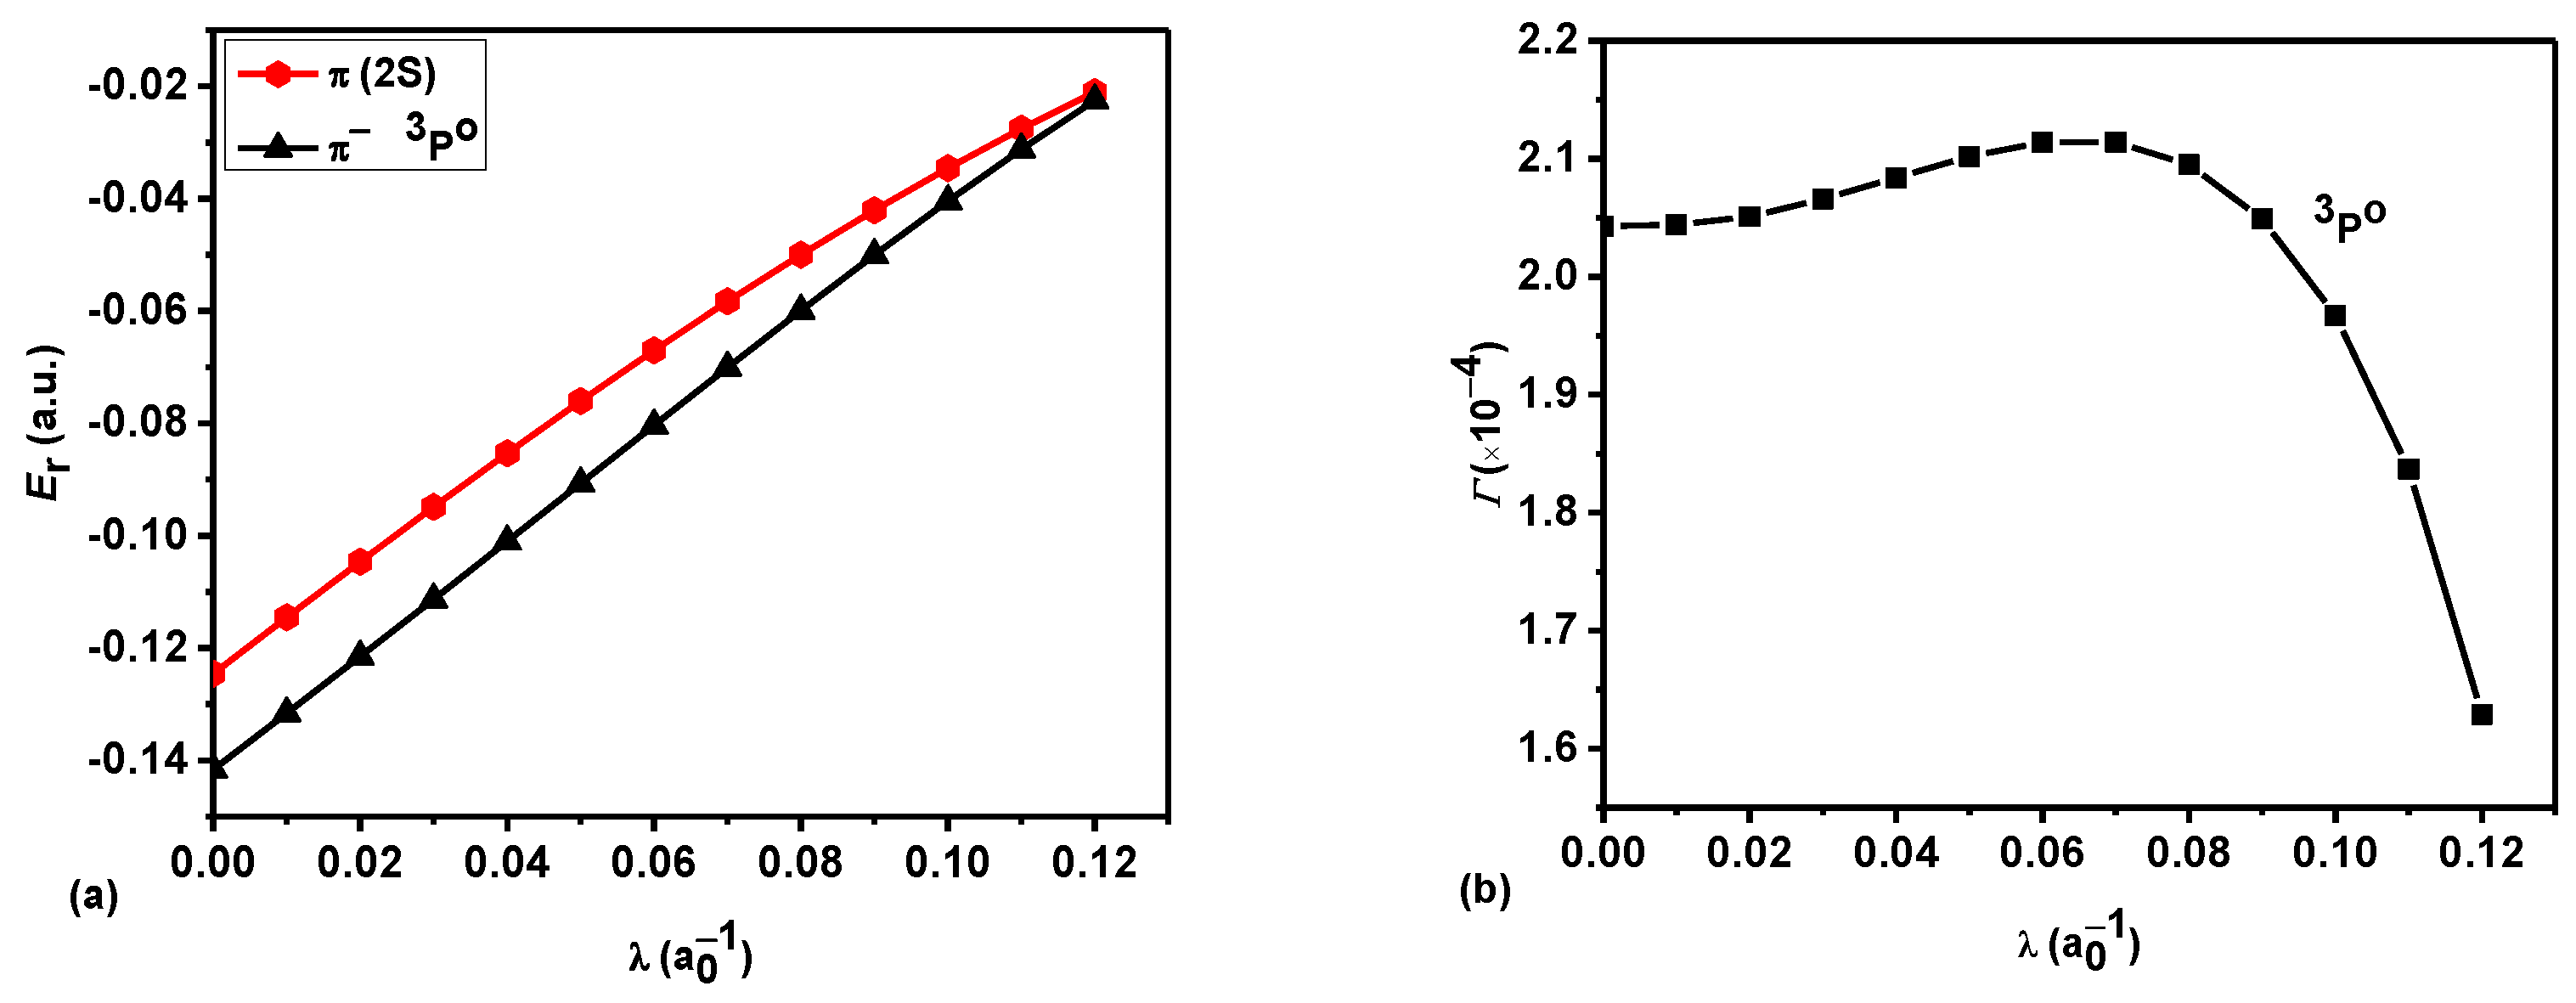
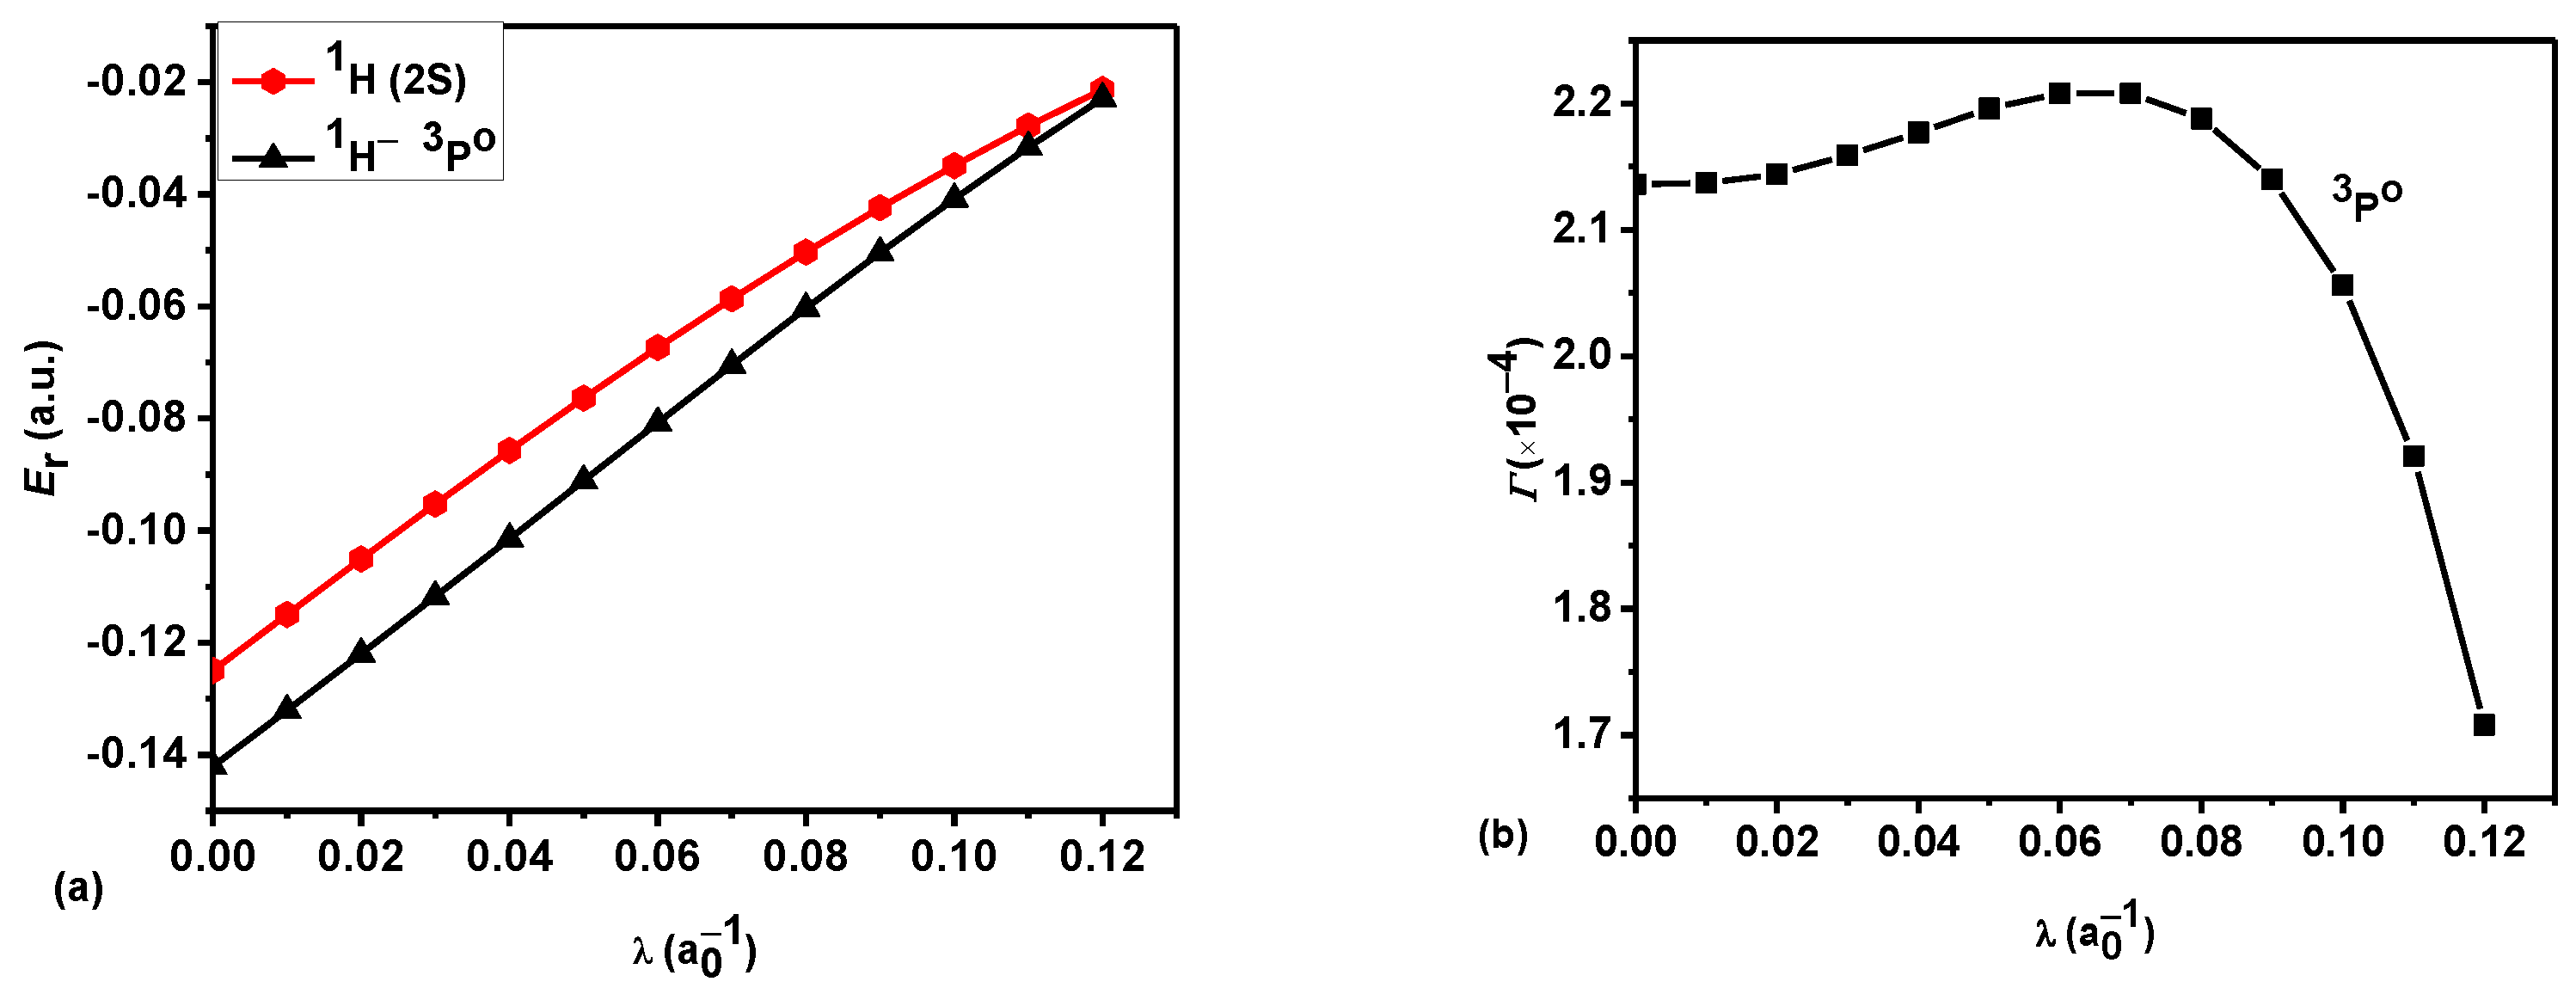
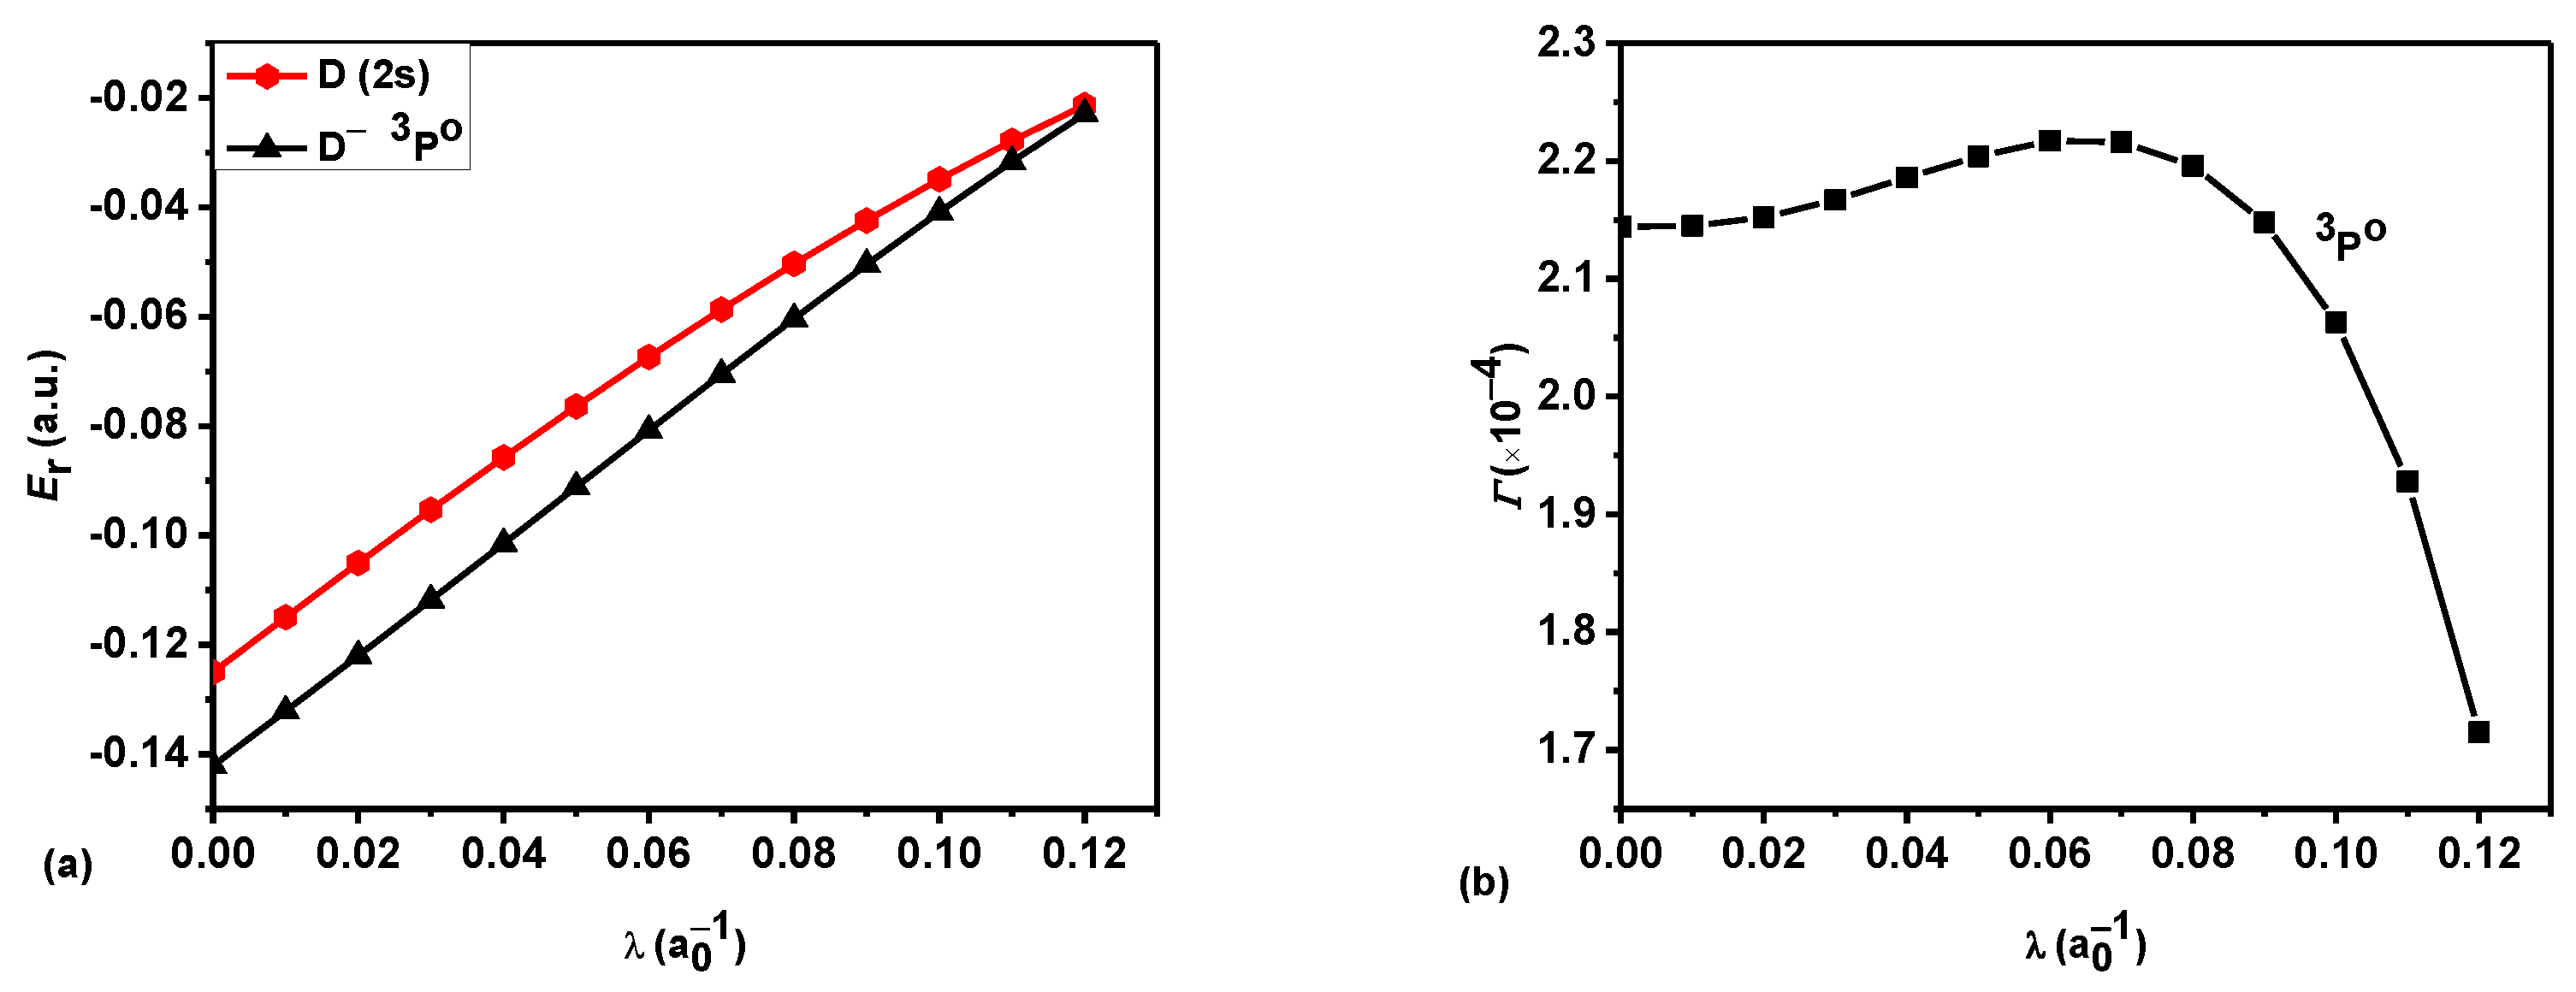
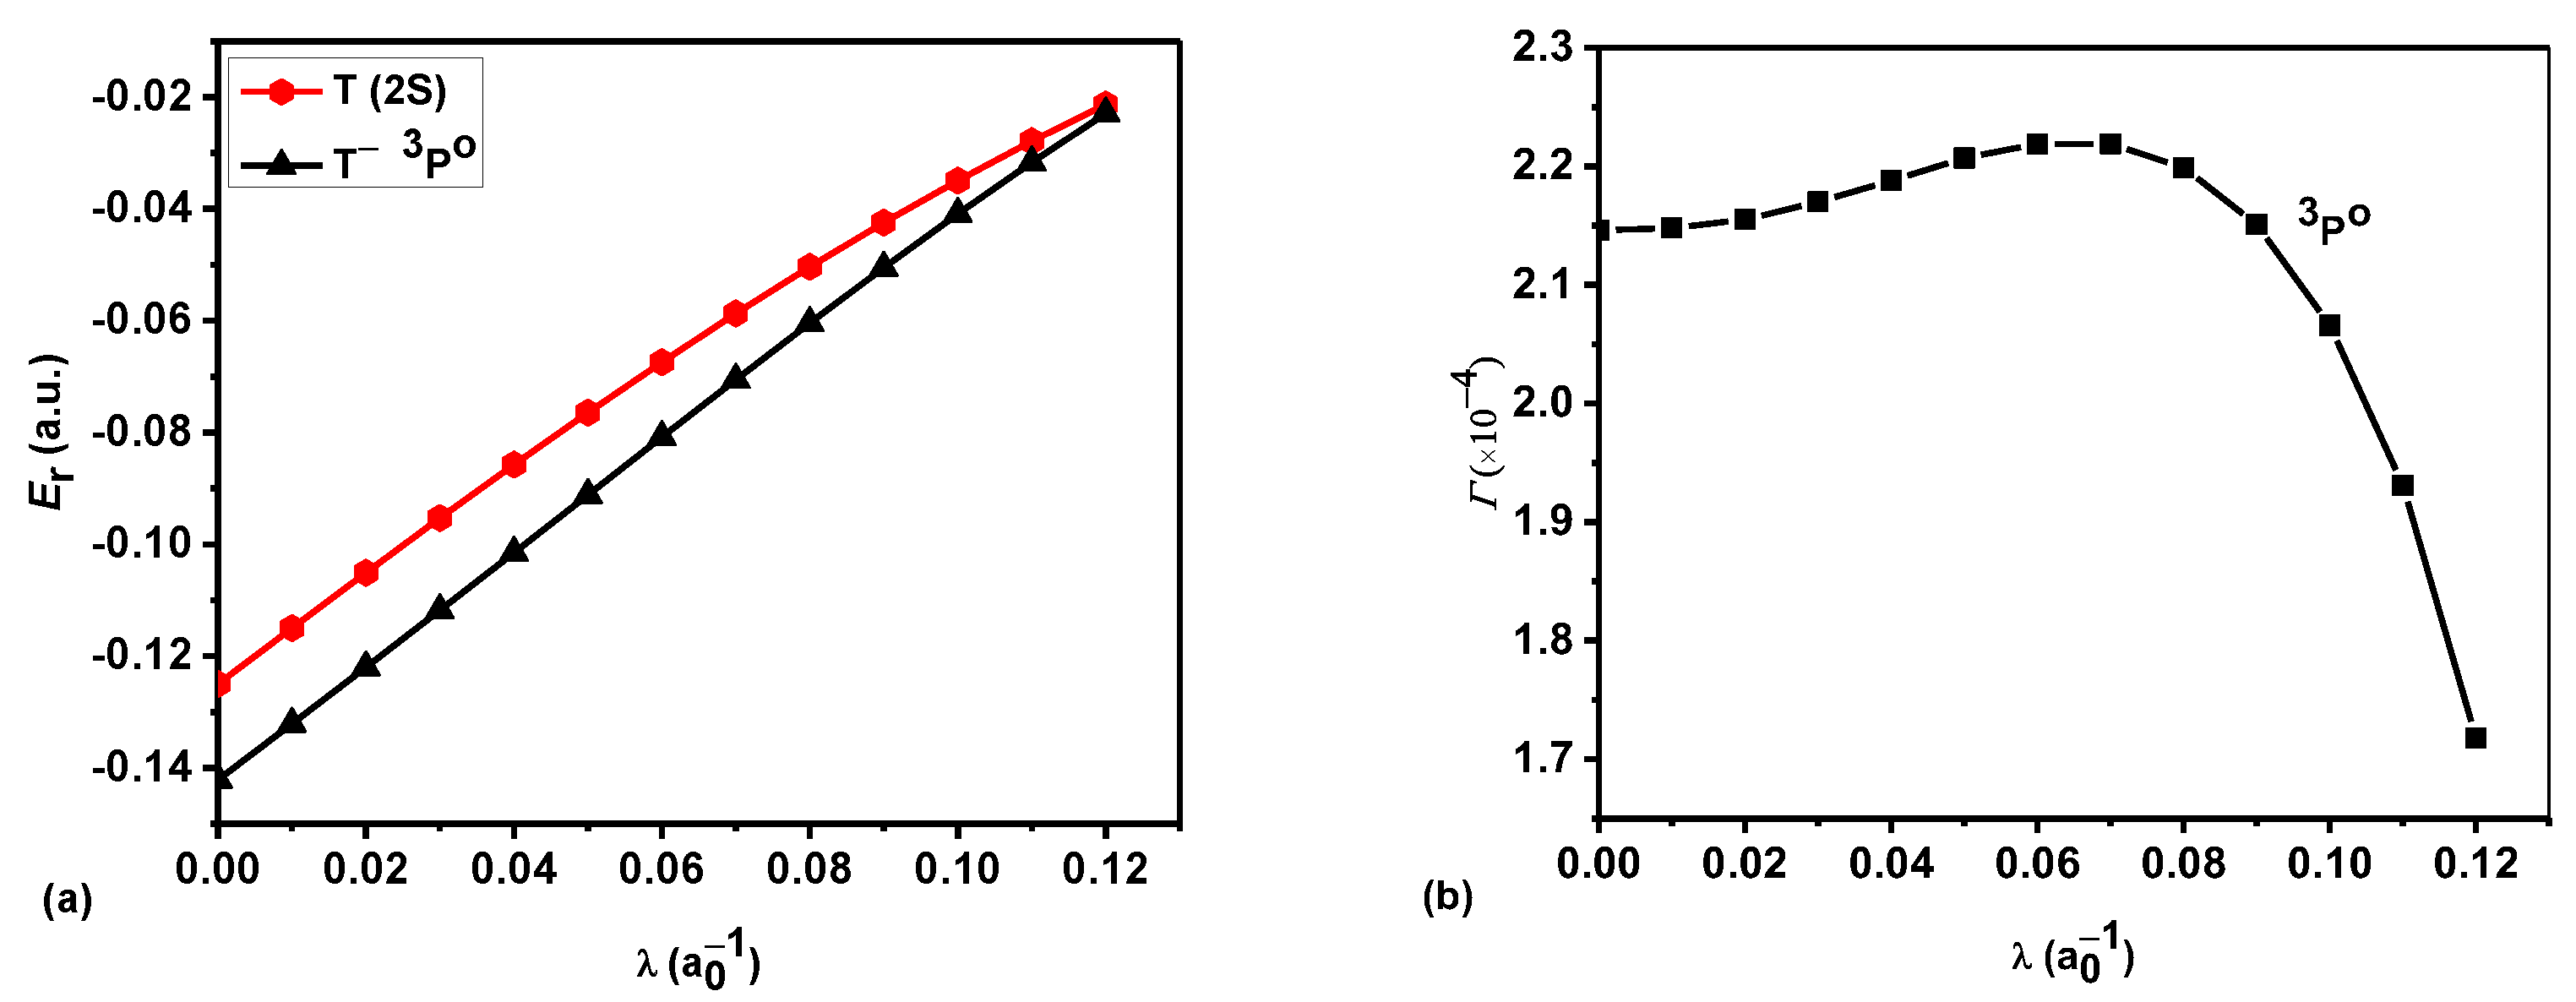
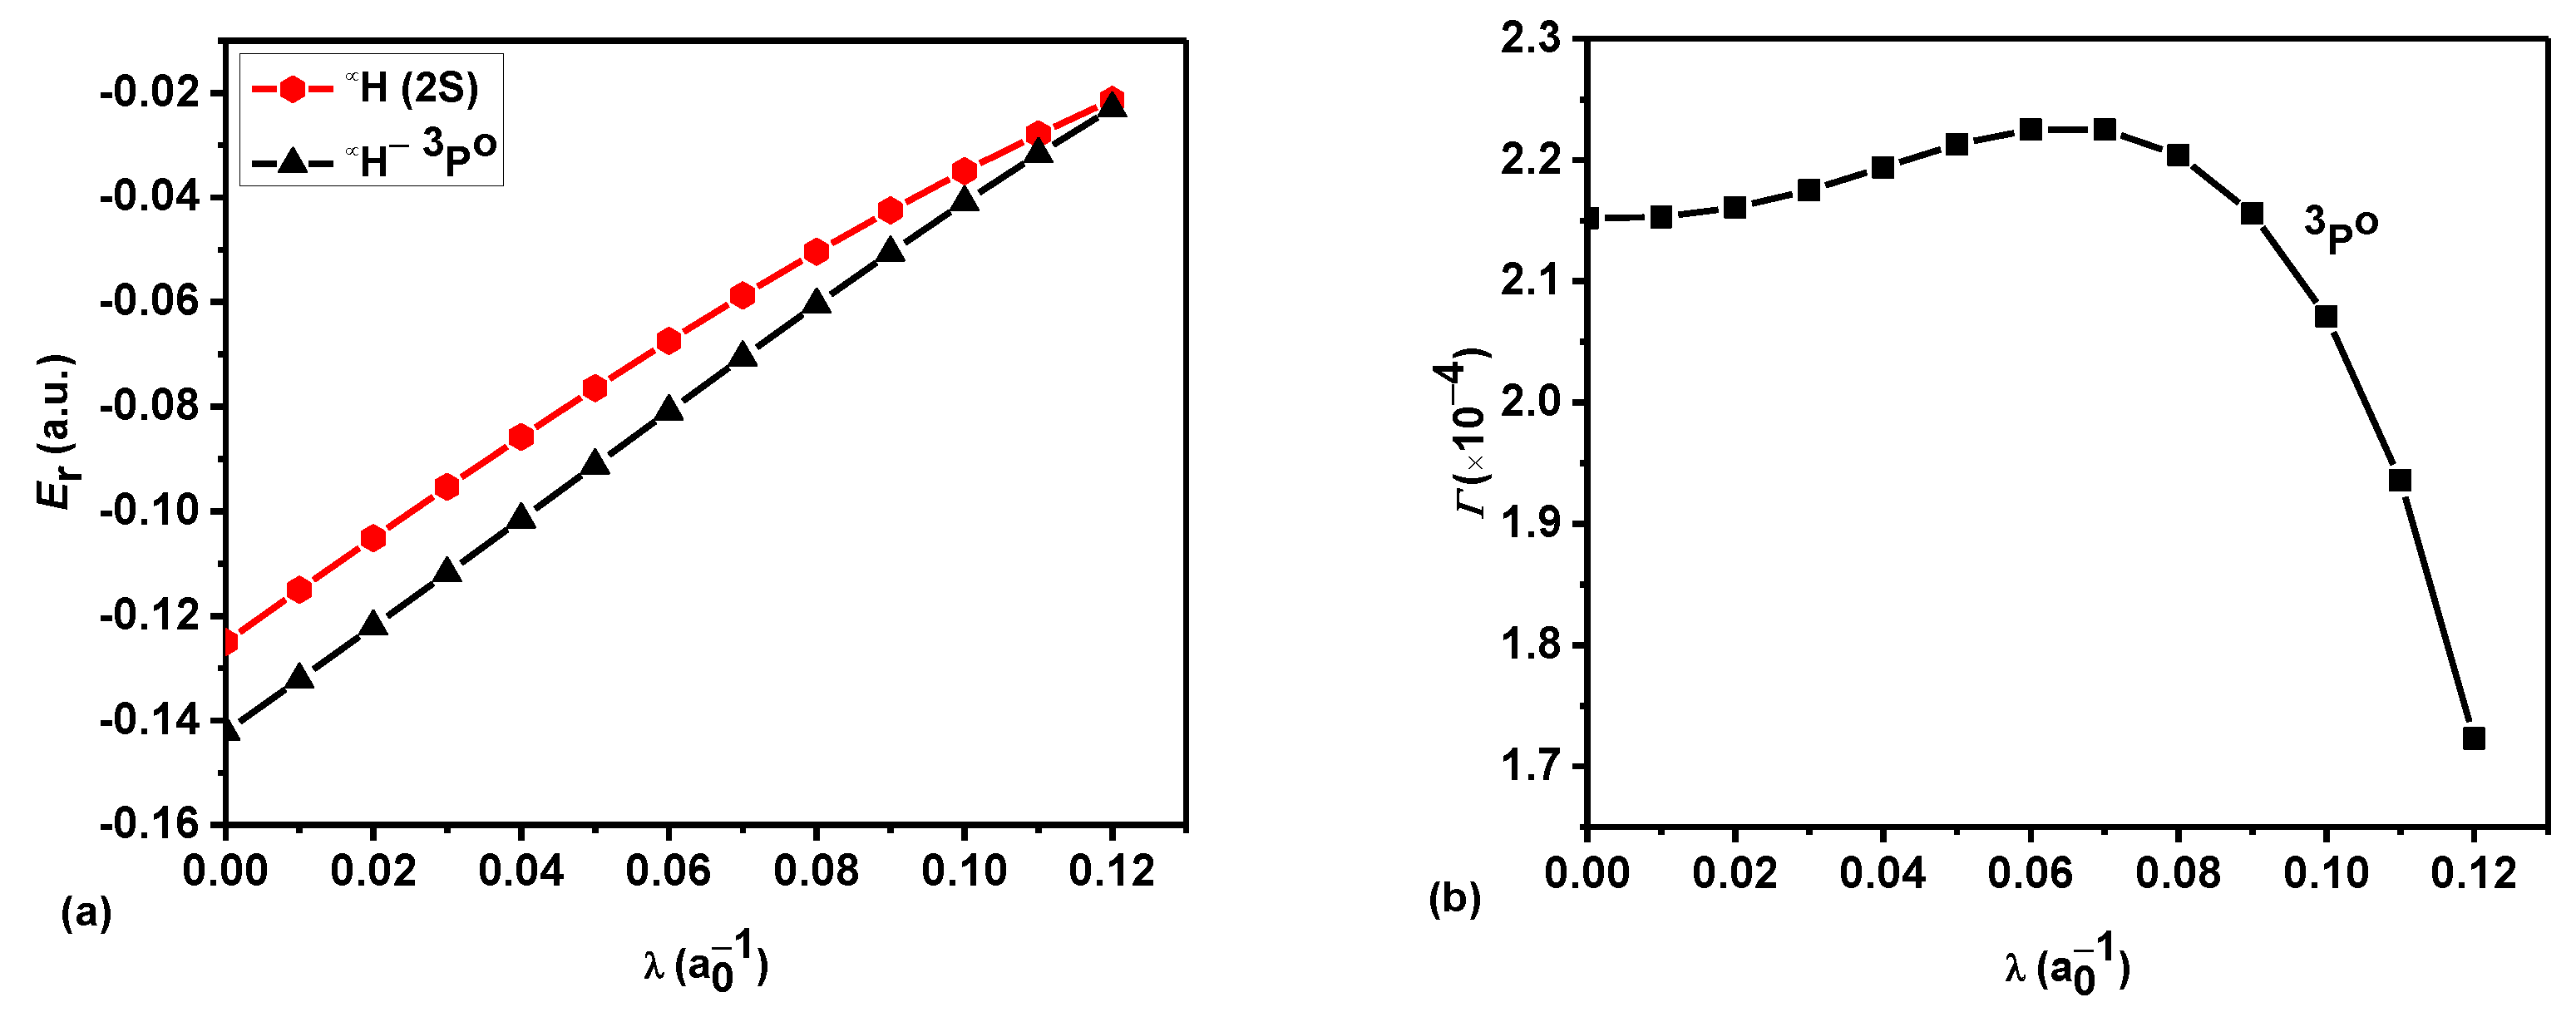
According to Table 1, Table 2, Table 3, Table 4, Table 5 and Table 6, the resonance energy and the resonance width of the 1Se and 1,3Po states of each ionic system and the threshold energy of respective subsystem changed with an increasing . It is important to note here that, because of the structure of the different systems, the positively charged particles of the systems had different masses. It can be clearly seen in Figure 3a, Figure 4a, Figure 5a, Figure 6a, Figure 7a, Figure 8a, Figure 9a, Figure 10a, Figure 11a, Figure 12a, Figure 13a, Figure 14a, Figure 15a and Figure 16a, that the resonance energy of the system tended to the threshold of the corresponding single-electron subsystem with the increase of the screening parameter . For the 1Se state, the systems approached the respective thresholds when the screening parameter was about 0.16, except for the system which approached the threshold energy at . The value of for which the resonance energy of a system approaches the threshold energy of the respective subsystem is referred as the critical value. For the 3Po state, the critical value of was about 0.07 for , and for the other systems, the critical value of was about 0.12. For the 1Po state, the critical value of was about 0.02 for , and for the other systems, the critical value of was about 0.03. As can be seen in Figure 3b, Figure 4b, Figure 5b, Figure 6b, Figure 7b, Figure 8b, Figure 9b, Figure 10b, Figure 11b, Figure 12b, Figure 13b, Figure 14b, Figure 15b and Figure 16b, for a weak screening effect, the resonance width slowly increased with the increase of the screening parameter , and then began to decease rapidly. The resonance energy of the 1Se and 1,3Po states of the two-electron negative ion system was calculated for N = 700 and N = 600, respectively.
In the Tables and Figures, we can observe that the lowest 1Se and 1,3Po resonance parameters (, ) from to ∞ interacting with ECSCP changed with nuclear masses and screening parameter . It can be seen in Table 1, Table 3 and Table 5 that the resonance energy gradually decreased with the increase of the system mass . For a particular ion, the resonance energy and the threshold energy also increased with the increase of the screening parameter. This is because the ionic system needed more energy to become free from plasma bonding with an increasing screening strength. In addition, the resonance width gradually increased with the increase of the nuclear mass, and all showed an overall trend for the resonance width, which first increased slowly with the increase of the shielding parameter and then began to rapidly decrease. The physical interpretation of the increasing and decreasing trends of the resonance widths for negative hydrogen-like ions has been well described in previous articles [48,51,52,58,61]. It is interesting to note the range of the screening parameter , which supports a resonance state for a particular ionic system embedded in quantum plasmas. For Ps−, the ranges of were 0 < ≤ 0.08, 0 < ≤ 0.07 and 0 < ≤ 0.02 for the lowest 1Se, 3Po and 1Po states, respectively. For all other ionic systems, the ranges of the screening parameter were 0 < ≤ 0.16, 0 < ≤ 0.12 and 0 < ≤ 0.03 for the lowest 1Se, 3Po and 1Po states, respectively.
Finally, we would like to mention the importance of our work in an astrophysical context. It is well documented in the literature that the opacity of the atmosphere of the Sun depends on several processes such as Thomson scattering, bound–bound transitions, and the photodetachment (bound–free) of hydrogen and positronium ions. For details on the bound-bound and bound-free transitions of ∞ and in the unscreened case, the interested readers are referred to the recent review article by Bhatia and Pesnell [69]. For the screened case, the photodetachment of ∞ and has also been reported in the literature [50,70,71]. In the present study, we present the effects of ECSCP on the resonance parameters for different resonance states of negative hydrogen-like ions. It is also important to point out here that the appropriateness of quantum screening potentials for negative hydrogen-like ions has been well discussed in previously published articles [50,51,52,53,54,55,56,57,58,59,60,61,62,63,70,71,72,73]. Our findings might be useful for further studies on this topic.
4. Conclusions
This paper focused on the resonance states of negative hydrogen-like ions embedded in a quantum plasma medium. The correlated exponential wave function was chosen to solve the Schrödinger equation within the framework of a variational method. We used an exponential cosine screened Coulomb potential to model the effects of the quantum plasma environment on the proposed systems. The 1Se and 3Po resonance parameters () below the N = 2 threshold for the seven ions , , , 1, , and ∞ for different screening parameters were accurately calculated by the stabilization method. We believe that the results obtained from the present theoretical investigation will provide valuable information for researchers in plasma physics, atomic–molecular physics, astrophysics and other related fields.
Author Contributions
S.Y., Z.J. and S.K. contributed equally to this work. All authors have read and agreed to the published version of the manuscript.
Funding
This research was funded by the Natural Science Foundation of Heilongjiang Province, grant number YQ2020A006.
Data Availability Statement
The data that supports the findings of this study are available within the article.
Conflicts of Interest
The authors declare no conflict of interest.
References
- Wheeler, J.A. Polyelectrons. Ann. N. Y. Acad. Sci. 1946, 48, 219–238. [Google Scholar] [CrossRef]
- Mills, A.P., Jr. Observation of the positronium negative ion. Phys. Rev. Lett. 1981, 46, 717–720. [Google Scholar] [CrossRef]
- Mills, A.P., Jr. Measurement of the decay rate of the positronium negative ion. Phys. Rev. Lett. 1983, 50, 671–674. [Google Scholar] [CrossRef]
- Ho, Y.K. Autoionization states of the positronium negative ion. Phys. Rev. A 1979, 19, 2347–2352. [Google Scholar] [CrossRef]
- Ho, Y.K. Doubly excited resonances of positronium negative ions. Phys. Lett. A 1984, 102, 348–350. [Google Scholar] [CrossRef]
- Botero, J. Adiabatic study of the positronium negative ion. Phys. Rev. A 1987, 35, 36–50. [Google Scholar] [CrossRef]
- Ward, S.J.; Humberston, J.W.; McDowell, M.R.C. Elastic scattering of electrons (or positrons) from positronium and the photodetachment of the positronium negative ion. J. Phys. B At. Mol. Phys. 1987, 20, 127–149. [Google Scholar] [CrossRef]
- Bhatia, A.K.; Ho, Y.K. Complex-coordinate calculation of 1,3P resonances in Ps using Hylleraas functions. Phys. Rev. A 1990, 42, 1119–1122. [Google Scholar] [CrossRef]
- Ho, Y.K.; Bhatia, A.K. 1,3Po resonance states in positronium ions. Phys. Rev. A 1991, 44, 2890–2894. [Google Scholar] [CrossRef]
- Rost, J.M.; Wintgen, D. Positronium negative ion: Molecule or Atom? Phys. Rev. Lett. 1992, 69, 2499–2502. [Google Scholar] [CrossRef]
- Ho, Y.K.; Bhatia, A.K. P-wave shape resonances in positronium ions. Phys. Rev. A 1993, 47, 1497–1499. [Google Scholar] [CrossRef]
- Ho, Y.K. Doubly excited states of positronium negative ions. Hyperfine Interact. 1994, 89, 401–406. [Google Scholar] [CrossRef]
- Igarashi, A.; Shimamura, I.; Toshima, N. Photodetachment cross sections of the positronium negative ion. New J. Phys. 2000, 2, 17. [Google Scholar] [CrossRef]
- Basu, A.; Ghosh, A.S. Feshbach resonances in electron-positronium continuum and the close-coupling model. Eur. Lett. 2002, 60, 46–52. [Google Scholar] [CrossRef]
- Li, T.; Shakeshaft, R. S-wave resonances of the negative positronium ion and stability of a system of two electrons and an arbitrary positive charge. Phys. Rev. A 2005, 71, 052505. [Google Scholar] [CrossRef]
- Basu, A.; Ghosh, A.S. Doubly excited resonant states of positronium negative ion. Phys. Rev. A 2006, 72, 062507. [Google Scholar] [CrossRef]
- Lin, C.H.; Ho, Y.K. Quantum Entanglement and Shannon Information Entropy for the doubly excited resonance state in positronium negative ion. Atoms 2015, 3, 422–432. [Google Scholar] [CrossRef] [Green Version]
- Kar, S.; Wanga, Y.; Ho, Y.K. Triplet P states in Ps− using correlated exponential wave functions. Chin. J. Phys. 2020, 68, 137–146. [Google Scholar] [CrossRef]
- Mills, A.P., Jr. Cross section for photoionization of the positronium negative ion at the lowest Feshbach resonance. Can. J. Phys. 2013, 91, 751–755. [Google Scholar] [CrossRef]
- Nagashima, Y. Experiments on positronium negative ions. Phys. Rep. 2014, 545, 95–123. [Google Scholar] [CrossRef]
- Mills, A.P., Jr. Possible experiments with high density positronium. AIP Conf. Proc. 2019, 2182, 030001. [Google Scholar]
- Orr, N.A.; Ploszajczak, M.; Marqués, F.M.; Carbonell, J. Recent Progress in Few-Body Physics: Proceedings of the 22nd International Conference on Few-Body Problems in Physics; Springer: Cham, Switzerland, 2020; Volume 238. [Google Scholar]
- Michishio, K.; Kanai, T.; Kuma, S.; Azuma, T.; Wada, K.; Mochizuki, I.; Hyodo, T.; Yagishita, A.; Nagashima1, Y. Observation of a shape resonance of the positronium negative ion. Nat. Commun. 2016, 7, 11060. [Google Scholar] [CrossRef] [PubMed] [Green Version]
- Nagashima, Y.; Sakai, T. First observation of positronium negative ions emitted from tungsten surfaces. New J. Phys. 2006, 8, 319. [Google Scholar] [CrossRef]
- Callaway, J. Energies and widths of the 1Po(1) and 1S(2) resonant states of H−. Phys. Lett. A 1978, 68, 315–316. [Google Scholar] [CrossRef]
- Wendoloski, J.J.; Reinhardt, W.P. Effects of an external electric field on 1Po resonances of H−. Phys. Rev. A 1978, 17, 195–200. [Google Scholar] [CrossRef]
- Pathakt, A.; Kingston, A.E.; Berrington, K.A. Resonances in H− associated with the n = 2, 3 and 4 hydrogenic thresholds. J. Phys. B At. Mol. Opt. Phys. 1988, 21, 2939–2951. [Google Scholar] [CrossRef]
- Ho, Y.K.; Bhatia, A.K. Doubly excited shape resonances in H−. Phys. Rev. A 1993, 48, 3720–3724. [Google Scholar] [CrossRef]
- Tang, J.Z.; Wakabayashi, Y.; Matsuzawa, M.; Watanabe, S.; Shimamura, I. Critical study of photodetachment of H− at energies up to the n = 4 threshold. Phys. Rev. A 1994, 49, 1021–1028. [Google Scholar] [CrossRef]
- Lindroth, E. Photodetachment of H− and Li−. Phys. Rev. A 1995, 52, 2737–2749. [Google Scholar] [CrossRef]
- Zhou, Y.; Lin, C.D. Comparative studies of excitations and resonances in H−, Ps−, and e+ + H systems. Phys. Rev. Lett. 1995, 75, 2296–2299. [Google Scholar] [CrossRef]
- Chen, M.K. Doubly excited resonant states in H− below the n = 2 hydrogen threshold. J. Phys. B At. Mol. Opt. Phys. 1997, 30, 1669–1676. [Google Scholar] [CrossRef]
- Gien, T.T. Feshbach resonances below the n = 2 H excitation threshold in electron–hydrogen scattering. J. Phys. B At. Mol. Opt. Phys. 1998, 31, L1001–L1008. [Google Scholar] [CrossRef]
- Kuan, W.H.; Jiang, T.F. Photodetachment of H−. Phys. Rev. A 1999, 60, 364–369. [Google Scholar] [CrossRef]
- Bürgersa, A.; Lindroth, E. Doubly excited states in the negative hydrogen ion. Eur. Phys. J. D 2000, 10, 327–340. [Google Scholar] [CrossRef]
- Jiao, L.G.; Ho, Y.K. Complete supermultiplet structures for the doubly excited intrashell resonances of H− associated with the H (N = 2, 3 and 4) thresholds. Phys. Rev. A 2014, 89, 052511. [Google Scholar] [CrossRef]
- Hamm, M.E.; Hamm, R.W.; Donahue, J.; Gram, P.A.M.; Pratt, J.C.; Yates, M.A.; Bolton, R.D.; Clark, D.A.; Bryant, H.C.; Frost, C.A.; et al. Observation of narrow resonances in the H photodetachment cross section near the n = 3 Threshold. Phys. Rev. Lett. 1979, 43, 1715–1718. [Google Scholar] [CrossRef]
- Halka, M.; Bryant, H.C.; Mackerrow, E.P.; Miller, W.; Mohagheghi, A.H.; Tang, C.Y.; Cohen, S.; Donahue, J.B.; Hsu, A.; Quick, C.R.; et al. Observation of the partial decay into H0 (n′ = 2) by excited H− near the n = 3 and 4 thresholds. Phys. Rev. A 1991, 44, 6127–6129. [Google Scholar] [CrossRef]
- Buckman, S.J.; Clark, C.W. Atomic negative-ion resonances. Rev. Mod. Phys. 1994, 66, 539. [Google Scholar] [CrossRef]
- Balling, P.; Andersen, H.H.; Brodie, C.A.; Pedersen, U.V.; Petrunin, V.V.; Raarup, M.K.; Steiner, P.; Andersen, T. High-resolution VUV spectroscopy of H− in the region near the H (n = 2) threshold. Phys. Rev. A 2000, 61, 022702. [Google Scholar] [CrossRef]
- Ross, T.; Baker, E.J.; Snow, T.P.; Destree, J.D.; Rachford, B.L.; Drosback, M.M.; Jensen, A.G. The search for H− in astrophysical environments. Astrophys. J. 2008, 684, 358–363. [Google Scholar] [CrossRef]
- Kuang, Y.; Arnold, K.-P.; Chmely, F.; Eckhause, M.; Hughes, V.W.; Kane, J.R.; Kettell, S.; Kim, D.-H.; Kumar, K.; Lu, D.C.; et al. First observation of the negative muonium ion produced by electron capture in a beam-foil experiment. Phys. Rev. A 1987, 35, 3172–3175. [Google Scholar] [CrossRef] [PubMed]
- Frolov, A.M. A discretisation of the Laplace transformation and an accurate method for the Coulomb three-body problem. Z. Phys. D At. Mol. Clust. 1986, 2, 61–65. [Google Scholar] [CrossRef]
- Petelenz, P.; Smith, V.H., Jr. Binding energies of the muonium and positronium negative ions. Phys. Rev. A 1987, 36, 5125–5126. [Google Scholar] [CrossRef] [PubMed]
- Bhatia, A.K.; Drachman, R.J. Three-body Coulomb bound states. Phys. Rev. A 1987, 35, 4051–4054. [Google Scholar] [CrossRef] [PubMed]
- Frolov, A.M. Bound-state properties of negatively charged hydrogenlike ions. Phys. Rev. A 1998, 58, 4479–4483. [Google Scholar] [CrossRef]
- Kar, S.; Ho, Y.K. Ground state and resonance state of Ps− in plasmas with various Debye lengths. Phys. Rev. A 2005, 71, 052503. [Google Scholar] [CrossRef]
- Kar, S.; Ho, Y.K. Doubly excited 1,3Po resonance states of Ps− in weakly coupled plasmas. Phys. Rev. A 2006, 73, 032502. [Google Scholar] [CrossRef]
- Basu, A.; Ghosh, A.S. Electron–positronium scattering in Debye plasma environment. Nucl. Instrum. Methods Phys. Res. B 2008, 266, 522–525. [Google Scholar] [CrossRef]
- Kar, S.; Ho, Y.K. Photodetachment of the positronium negative ion interacting with screened Coulomb (Yukawa) potentials. Few-Body Syst. 2008, 42, 73–81. [Google Scholar] [CrossRef]
- Ho, Y.K.; Kar, S. Complex-scaling calculations for doubly excited resonances in Ps− interacting with screened Coulomb (Yukawa) potentials. Few-Body Syst. 2012, 53, 437–443. [Google Scholar] [CrossRef]
- Ho, Y.K.; Kar, S. High-lying doubly excited resonances in Ps− interacting with screened Coulomb potentials. Chin. J. Phys. 2016, 54, 574–581. [Google Scholar] [CrossRef]
- Ho, Y.K. The combined screened Coulomb and varying charge effects on doubly excited resonance states in the positronium negative ion. JPS Conf. Proc. 2017, 18, 011027. [Google Scholar]
- Kar, S.; Ho, Y.K. Autoionizing 1Se resonance of H− in Debye plasma environments. Phys. Rev. E 2004, 70, 066411. [Google Scholar] [CrossRef] [PubMed]
- Kar, S.; Ho, Y.K. Electron affinity of the hydrogen atom and a resonance state of the hydrogen negative ion embedded in Debye plasmas. New J. Phys. 2005, 7, 141. [Google Scholar] [CrossRef] [Green Version]
- Kar, S.; Ho, Y.K. Doubly-excited 1,3Po states of H− interacting with screened Coulomb (Yukawa) potentials. Few-Body Syst. 2006, 40, 13–20. [Google Scholar] [CrossRef]
- Shukla, P.K.; Eliasson, B. Screening and wake potentials of a test charge in quantum plasmas. Phys. Lett. A 2008, 372, 2897–2899. [Google Scholar] [CrossRef]
- Ghoshal, A.; Ho, Y.K. Properties of the positronium negative ion interacting with exponential cosine-screened Coulomb potentials. Few-Body Syst. 2009, 46, 249–256. [Google Scholar] [CrossRef]
- Ghoshal, A.; Ho, Y.K. Autoionization states of the positronium negative ion in exponential cosine-screened Coulomb potentials. Eur. Phys. J. D 2010, 56, 151–156. [Google Scholar] [CrossRef]
- Ghoshal, A.; Ho, Y.K. Properties of hydrogen molecular ion with static screened Coulomb and exponential cosine screened Coulomb potentials. Int. J. Quantum Chem. 2011, 111, 4288–4295. [Google Scholar] [CrossRef]
- Ghoshal, A.; Ho, Y.K. Ground states and doubly excited resonance states of H− embedded in dense quantum plasmas. J. Phys. B At. Mol. Opt. Phys. 2009, 42, 175006. [Google Scholar] [CrossRef]
- Kar, S.; Ho, Y.K. Excitons and the positronium negative ion: Comparison of spectroscopic properties. In Excitons; Pyshkin, S.L., Ed.; Intech: London, UK, 2018; pp. 69–90. [Google Scholar]
- Mohr, P.J.; Newell, D.B.; Taylor, B.N. CODATA recommended values of the fundamental physical constants: 2014. J. Phys. Chem. Ref. Data 2016, 45, 043102. [Google Scholar] [CrossRef] [Green Version]
- Bhattacharyya, S.; Saha, J.K.; Mukherjee, P.K.; Mukherjee, T.K. Three-body negative ions under Coulomb interaction. Phys. Scr. 2012, 85, 065305. [Google Scholar] [CrossRef]
- Frolov, A.M. Multibox strategy for constructing highly accurate bound-state wave functions for three-body systems. Phys. Rev. E 2001, 64, 036704. [Google Scholar] [CrossRef]
- Mandelshtam, V.A.; Ravuri, T.R.; Taylor, H.S. Calculation of the density of resonance states using the stabilization method. Phys. Rev. Lett. 1993, 70, 1932–1935. [Google Scholar] [CrossRef]
- Kar, S.; Ho, Y.K. S-wave resonances in e+ − He scattering below the Ps (n = 2) excitation threshold. J. Phys. B At. Mol. Opt. Phys. 2004, 37, 3177–3186. [Google Scholar] [CrossRef]
- Ho, Y.K.; Bhatia, A.K.; Temkin, A. Precision calculation of the lowest 1S resonance in e-H scattering. Phys. Rev. A 1977, 15, 1423–1429. [Google Scholar] [CrossRef]
- Bhatia, A.K.; Pesnell, W.D. A note on the opacity of the Sun’s atmosphere. Atoms 2020, 8, 37. [Google Scholar] [CrossRef]
- Ghoshal, A.; Ho, Y.K. Photodetachment of H− in dense quantum plasmas. Phys. Rev. E 2010, 81, 016403. [Google Scholar] [CrossRef]
- Ghoshal, A.; Ho, Y.K. Photodetachment of the positronium negative ions with exponential cosine-screened Coulomb potentials. Few-Body Syst. 2010, 47, 185–192. [Google Scholar] [CrossRef]
- Jung, A.D. Resonant Compton scattering in nonthermal astrophysical plasmas. Astrophys. J. 2009, 695, 917–920. [Google Scholar] [CrossRef] [Green Version]
- Li, H.W.; Kar, S. Plasma screening effects on resonant Compton scattering of photons by excited hydrogenic ions in Lorentzian plasmas. Eur. Phys. J. D 2012, 66, 304. [Google Scholar] [CrossRef]
Figure 1.
(a) Stabilization diagram for the 1Se state of at (the number 18 in the diagram indicates the 18th energy level). (b) Calculated densities (circles) and Lorentzian fits (solid line and the best fit) for the 1Se state of at .
Figure 1.
(a) Stabilization diagram for the 1Se state of at (the number 18 in the diagram indicates the 18th energy level). (b) Calculated densities (circles) and Lorentzian fits (solid line and the best fit) for the 1Se state of at .

Figure 2.
(a) Stabilization diagram for the 3Po(1) state of for (the number 20 in the diagram indicates the 20th energy level). (b) Calculated densities (circles) and Lorentzian fits (solid line and the best fit) for the 3Po(1) state of for .
Figure 2.
(a) Stabilization diagram for the 3Po(1) state of for (the number 20 in the diagram indicates the 20th energy level). (b) Calculated densities (circles) and Lorentzian fits (solid line and the best fit) for the 3Po(1) state of for .

Figure 3.
(a) Plot of the lowest 1Se resonance energy of as a function of . (b) Plot of the resonance corresponding resonance width of as a function of .
Figure 3.
(a) Plot of the lowest 1Se resonance energy of as a function of . (b) Plot of the resonance corresponding resonance width of as a function of .

Figure 4.
(a) Plot of the lowest 1Se resonance energy of vs. the screening parameter . (b) Plot of the resonance width of vs. the screening parameter .
Figure 4.
(a) Plot of the lowest 1Se resonance energy of vs. the screening parameter . (b) Plot of the resonance width of vs. the screening parameter .

Figure 5.
(a) Plot of the lowest 1Se resonance energy of as a function of the screening parameter . (b) Plot of the corresponding resonance width of as a function of the screening parameter .
Figure 5.
(a) Plot of the lowest 1Se resonance energy of as a function of the screening parameter . (b) Plot of the corresponding resonance width of as a function of the screening parameter .

Figure 6.
(a) Plot of the lowest 1Se resonance energy of 1 as a function of the screening parameter . (b) Plot of the corresponding resonance width of 1 as a function of the screening parameter .
Figure 6.
(a) Plot of the lowest 1Se resonance energy of 1 as a function of the screening parameter . (b) Plot of the corresponding resonance width of 1 as a function of the screening parameter .

Figure 7.
(a) Lowest 1Se resonance energy of versus . (b) Corresponding resonance width of versus .

Figure 8.
(a) Lowest 1Se resonance energy of as a function of . (b) Resonance width of as a function of .
Figure 8.
(a) Lowest 1Se resonance energy of as a function of . (b) Resonance width of as a function of .

Figure 9.
(a) Plot of the lowest 1Se resonance energy of ∞ as a function of . (b) Plot of the corresponding resonance width of ∞ as a function of .
Figure 9.
(a) Plot of the lowest 1Se resonance energy of ∞ as a function of . (b) Plot of the corresponding resonance width of ∞ as a function of .

Figure 10.
(a) Plot of the lowest 3Po resonance energy of as a function of the screening parameter . (b) Plot of the resonance width of as a function of the screening parameter .
Figure 10.
(a) Plot of the lowest 3Po resonance energy of as a function of the screening parameter . (b) Plot of the resonance width of as a function of the screening parameter .

Figure 11.
(a) Plot of the lowest 3Po resonance energy of vs. the screening parameter . (b) Plot of the corresponding resonance width of vs. the screening parameter .
Figure 11.
(a) Plot of the lowest 3Po resonance energy of vs. the screening parameter . (b) Plot of the corresponding resonance width of vs. the screening parameter .

Figure 12.
(a) Plot of the lowest 3Po resonance energy of as a function of . (b) Plot of the corresponding resonance width of as a function of .
Figure 12.
(a) Plot of the lowest 3Po resonance energy of as a function of . (b) Plot of the corresponding resonance width of as a function of .

Figure 13.
(a) Plot of the lowest 3Po resonance energy of 1 versus the screening parameter . (b) Plot of the corresponding resonance width of 1 versus .
Figure 13.
(a) Plot of the lowest 3Po resonance energy of 1 versus the screening parameter . (b) Plot of the corresponding resonance width of 1 versus .

Figure 14.
(a) Plot of the lowest 3Po resonance energy of vs. the screening parameter . (b) Plot of the corresponding resonance width of vs. the screening parameter .
Figure 14.
(a) Plot of the lowest 3Po resonance energy of vs. the screening parameter . (b) Plot of the corresponding resonance width of vs. the screening parameter .

Figure 15.
(a) Plot of the lowest 3Po resonance energy of vs. . (b) Plot of the corresponding resonance width of vs. .
Figure 15.
(a) Plot of the lowest 3Po resonance energy of vs. . (b) Plot of the corresponding resonance width of vs. .

Figure 16.
(a) Plot of the lowest 3Po resonance energy of ∞ as a function of the screening parameter . (b) Plot of the corresponding resonance width of ∞ as a function of the screening parameter .
Figure 16.
(a) Plot of the lowest 3Po resonance energy of ∞ as a function of the screening parameter . (b) Plot of the corresponding resonance width of ∞ as a function of the screening parameter .


Table 1.
1Se resonance energies (a.u.) of two-electron negative ions for different values of the screening parameter .
Table 1.
1Se resonance energies (a.u.) of two-electron negative ions for different values of the screening parameter .
| 1 | ∞ | ||||||
|---|---|---|---|---|---|---|---|
| 0.00 | −0.0760300 −0.076030 a | −0.1480453 | −0.1482105 | −0.1486748 | −0.1487155 | −0.1487291 | −0.1487563 −0.14876 b |
| 0.01 | −0.0659912 −0.065992 a | −0.1380189 | −0.1381932 | −0.1386573 | −0.1386983 | −0.1387119 | −0.1387391 −0.13875 b |
| 0.02 | −0.0558114 −0.055812 a | −0.1279178 | −0.1280922 | −0.1285570 | −0.1285977 | −0.1286113 | −0.1286385 −0.12865 b |
| 0.03 | −0.0455464 | −0.1176989 | −0.1178735 | −0.1183388 | −0.1183796 | −0.1183932 | −0.1184205 |
| 0.04 | −0.0353743 | −0.1073700 | −0.1075448 | −0.1080105 | −0.1080513 | −0.1080649 | −0.1080922 |
| 0.05 | −0.0255309 −0.025531 a | −0.0969679 | −0.0971426 | −0.0976082 | −0.0976082 | −0.0976626 | −0.0976899 −0.09770 b |
| 0.06 | −0.0162967 | −0.0865485 | −0.0867227 | −0.0871872 | −0.0872279 | −0.0872414 | −0.0872686 |
| 0.07 | −0.0080506 | −0.0761792 | −0.0763524 | −0.0768141 | −0.0768545 | −0.0768680 | −0.0768951 |
| 0.08 | −0.0015421 | −0.0659352 | −0.0661066 | −0.0665635 | −0.0666035 | −0.0666168 | −0.0666436 |
| 0.09 | −0.0558972 | −0.0560658 | −0.0565152 | −0.0565546 | −0.0565677 | −0.0565941 | |
| 0.10 | −0.0461518 | −0.0463163 | −0.0467549 | −0.0467934 | −0.0468062 | −0.0468319 | |
| 0.11 | −0.0367941 | −0.0369530 | −0.0373767 | −0.0374139 | −0.0374263 | −0.0374512 | |
| 0.12 | −0.0279338 | −0.0280850 | −0.0284885 | −0.0285240 | −0.0285357 | −0.0285594 | |
| 0.13 | −0.0197075 | −0.0198483 | −0.0202241 | −0.0202571 | −0.0202681 | −0.0202902 | |
| 0.14 | −0.0123046 | −0.0124305 | −0.0127674 | −0.0127970 | −0.0128068 | −0.0128267 | |
| 0.15 | −0.0060262 | −0.0061298 | −0.0064081 | −0.0064327 | −0.0064408 | −0.0064573 | |
| 0.16 | −0.0013941 | −0.0014624 | −0.0016483 | −0.0016649 | −0.0016704 | −0.0016815 |
Table 2.
1Se resonance widths (a.u.) of negative hydrogen-like ions for different screening values of the parameter .
Table 2.
1Se resonance widths (a.u.) of negative hydrogen-like ions for different screening values of the parameter .
| 1 | ∞ | ||||||
|---|---|---|---|---|---|---|---|
| 0.01 | 4.303 4.30 a | 1.700 | 1.716 | 1.730 | 1.732 | 1.732 | 1.733 1.732 b |
| 0.01 | 4.321 4.32 a | 1.712 | 1.717 | 1.730 | 1.731 | 1.732 | 1.733 1.733 b |
| 0.02 | 4.400 4.41 a | 1.717 | 1.721 | 1.736 | 1.737 | 1.737 | 1.738 1.738 b |
| 0.03 | 4.516 | 1.725 | 1.730 | 1.744 | 1.745 | 1.745 | 1.746 |
| 0.04 | 4.599 | 1.734 | 1.740 | 1.753 | 1.755 | 1.755 | 1.756 |
| 0.05 | 4.549 4.54 a | 1.741 | 1.747 | 1.761 | 1.762 | 1.762 | 1.763 1.764 b |
| 0.06 | 4.231 | 1.741 | 1.746 | 1.760 | 1.762 | 1.762 | 1.763 |
| 0.07 | 3.422 | 1.729 | 1.734 | 1.748 | 1.750 | 1.750 | 1.751 |
| 0.08 | 1.662 | 1.699 | 1.704 | 1.719 | 1.720 | 1.721 | 1.722 |
| 0.09 | 1.647 | 1.653 | 1.668 | 1.669 | 1.669 | 1.700 | |
| 0.10 | 1.567 | 1.573 | 1.589 | 1.590 | 1.591 | 1.592 | |
| 0.11 | 1.456 | 1.462 | 1.478 | 1.479 | 1.480 | 1.481 | |
| 0.12 | 1.304 | 1.311 | 1.327 | 1.329 | 1.329 | 1.330 | |
| 0.13 | 1.104 | 1.111 | 1.128 | 1.130 | 1.131 | 1.130 | |
| 0.14 | 0.840 | 0.848 | 0.867 | 0.869 | 0.869 | 0.871 | |
| 0.15 | 0.498 | 0.506 | 0.527 | 0.529 | 0.530 | 0.531 | |
| 0.16 | 0.149 | 0.154 | 0.167 | 0.169 | 0.169 | 0.170 |
Table 3.
3Po resonance energies (a.u.) of negative hydrogen-like ions immersed in a quantum plasma environment for different values of the screening parameter .
Table 3.
3Po resonance energies (a.u.) of negative hydrogen-like ions immersed in a quantum plasma environment for different values of the screening parameter .
| 1 | ∞ | ||||||
|---|---|---|---|---|---|---|---|
| 0.00 | −0.0733263 −0.07332659 a | −0.1414591 | −0.1416224 | −0.1420576 | −0.1420958 | −0.1421084 | −0.1421340 −0.142133 b |
| 0.01 | −0.0632875 | −0.1314427 | −0.1316061 | −0.1320414 | −0.1320795 | −0.1320922 | −0.1321177 |
| 0.02 | −0.0531113 | −0.1213487 | −0.1215121 | −0.1219477 | −0.1219859 | −0.1219986 | −0.1220242 |
| 0.03 | −0.0428660 | −0.111149 | −0.1113123 | −0.1117484 | −0.1117866 | −0.1117993 | −0.1118249 |
| 0.04 | −0.0327415 | −0.1008551 | −0.1010189 | −0.1014555 | −0.1014937 | −0.1015064 | −0.1015320 |
| 0.05 | −0.0229806 | −0.0905085 | −0.0906723 | −0.0911086 | −0.0911469 | −0.0911596 | −0.0911852 |
| 0.06 | −0.0138667 | −0.0801663 | −0.0803296 | −0.0807647 | −0.0808028 | −0.0808155 | −0.0808410 |
| 0.07 | −0.0058038 | −0.0698958 | −0.0700580 | −0.0704903 | −0.0705282 | −0.0705408 | −0.0705662 |
| 0.08 | −0.0597701 | −0.0599304 | −0.0603578 | −0.0603953 | −0.0604078 | −0.0604329 | |
| 0.09 | −0.0498661 | −0.0500237 | −0.0504437 | −0.0504805 | −0.0504928 | −0.0505174 | |
| 0.10 | −0.0402659 | −0.0404195 | −0.0408288 | −0.0408647 | −0.0408767 | −0.0409007 | |
| 0.11 | −0.0310604 | −0.0312083 | −0.0316030 | −0.0316376 | −0.0316491 | −0.0316723 | |
| 0.12 | −0.0223635 | −0.0225036 | −0.0228775 | −0.0229103 | −0.0229212 | −0.0229432 |
Table 4.
3Po resonance widths (a.u.) of hydrogen-like ionic systems for different values of the screening parameter .
Table 4.
3Po resonance widths (a.u.) of hydrogen-like ionic systems for different values of the screening parameter .
| 1 | ∞ | ||||||
|---|---|---|---|---|---|---|---|
| 0.00 | 1.282 1.274 a | 2.009 | 2.043 | 2.136 | 2.144 | 2.146 | 2.152 2.14 b |
| 0.01 | 1.287 | 2.010 | 2.044 | 2.137 | 2.145 | 2.148 | 2.153 |
| 0.02 | 1.308 | 2.017 | 2.051 | 2.144 | 2.152 | 2.155 | 2.161 |
| 0.03 | 1.330 | 2.031 | 2.066 | 2.159 | 2.167 | 2.170 | 2.175 |
| 0.04 | 1.325 | 2.049 | 2.084 | 2.177 | 2.186 | 2.188 | 2.194 |
| 0.05 | 1.260 | 2.067 | 2.102 | 2.196 | 2.204 | 2.207 | 2.213 |
| 0.06 | 1.097 | 2.079 | 2.114 | 2.208 | 2.217 | 2.219 | 2.225 |
| 0.07 | 0.7683 | 2.079 | 2.114 | 2.208 | 2.216 | 2.219 | 2.225 |
| 0.08 | 2.060 | 2.095 | 2.188 | 2.196 | 2.199 | 2.204 | |
| 0.09 | 2.015 | 2.049 | 2.140 | 2.148 | 2.151 | 2.156 | |
| 0.10 | 1.935 | 1.967 | 2.056 | 2.063 | 2.066 | 2.071 | |
| 0.11 | 1.806 | 1.837 | 1.921 | 1.928 | 1.931 | 1.936 | |
| 0.12 | 1.601 | 1.629 | 1.708 | 1.715 | 1.718 | 1.723 |
Table 5.
1Po resonance energies (a.u.) of two-electron negative ions for different values of .
| 1 | ∞ | ||||||
|---|---|---|---|---|---|---|---|
| 0.00 | −0.06315584 | −0.1254399 | −0.1255875 | −0.1259808 | −0.1260153 | −0.1260268 | −0.1260498 |
| 0.01 | −0.05306434 | −0.1153986 | −0.1155463 | −0.1159398 | −0.1159743 | −0.1159858 | −0.1160089 |
| 0.02 | −0.04293079 | −0.1052296 | −0.1053774 | −0.1057712 | −0.1058057 | −0.1058172 | −0.1058402 |
| 0.03 | −0.09502556 | −0.09517295 | −0.09556560 | −0.09560001 | −0.09561146 | −0.09563447 |
Table 6.
1Po resonance widths (a.u.) of two-electron negative ions for different values of .
| 1 | ∞ | ||||||
|---|---|---|---|---|---|---|---|
| 0.00 | 0.9132 | 1.452 | 1.443 | 1.421 | 1.419 | 1.418 | 1.417 |
| 0.01 | 1.297 | 1.534 | 1.525 | 1.500 | 1.497 | 1.497 | 1.495 |
| 0.02 | 2.902 | 2.095 | 2.081 | 2.043 | 2.039 | 2.038 | 2.036 |
| 0.03 | 3.418 | 3.397 | 3.343 | 3.338 | 3.336 | 3.333 |
Disclaimer/Publisher’s Note: The statements, opinions and data contained in all publications are solely those of the individual author(s) and contributor(s) and not of MDPI and/or the editor(s). MDPI and/or the editor(s) disclaim responsibility for any injury to people or property resulting from any ideas, methods, instructions or products referred to in the content. |
© 2023 by the authors. Licensee MDPI, Basel, Switzerland. This article is an open access article distributed under the terms and conditions of the Creative Commons Attribution (CC BY) license (https://creativecommons.org/licenses/by/4.0/).
Share and Cite
MDPI and ACS Style
Yao, S.; Jiang, Z.; Kar, S. Resonance States of Negative Hydrogen-like Ions in Quantum Plasmas. Atoms 2023, 11, 69. https://doi.org/10.3390/atoms11040069
AMA Style
Yao S, Jiang Z, Kar S. Resonance States of Negative Hydrogen-like Ions in Quantum Plasmas. Atoms. 2023; 11(4):69. https://doi.org/10.3390/atoms11040069
Chicago/Turabian StyleYao, Suya, Zishi Jiang, and Sabyasachi Kar. 2023. "Resonance States of Negative Hydrogen-like Ions in Quantum Plasmas" Atoms 11, no. 4: 69. https://doi.org/10.3390/atoms11040069
Note that from the first issue of 2016, this journal uses article numbers instead of page numbers. See further details here.