
DE Models with Combined H0 · rd from BAO and CMB Dataset and Friends

Institute for Nuclear Research and Nuclear Energy, Bulgarian Academy of Sciences, 1784 Sofia, Bulgaria
Universe 2022, 8(12), 631; https://doi.org/10.3390/universe8120631
Submission received: 1 November 2022
/
Revised: 23 November 2022
/
Accepted: 24 November 2022
/
Published: 28 November 2022
(This article belongs to the Special Issue Modified Gravity Approaches to the Tensions of ΛCDM)
Abstract
:It has been theorized that dynamical dark energy (DDE) could be a possible solution to Hubble tension. To avoid degeneracy between Hubble parameter and sound horizon scale , in this article, we use their multiplication as one parameter , and we use it to infer cosmological parameters for 6 models—CDM and 5 DDE parametrizations—the Chevallier–Polarski–Linder (CPL), the Barboza–Alcaniz (BA), the low correlation (LC), the Jassal–Bagla–Padmanabhan (JBP) and the Feng–Shen–Li-Li models. We choose a dataset that treats this combination as one parameter, which includes the baryon acoustic oscillation (BAO) data and additional points from the cosmic microwave background (CMB) peaks (). To them, we add the marginalized Pantheon dataset and GRB dataset. We see that the tension is moved from and to and . There is only one model that satisfies the Planck 2018 constraints on both parameters, and this is LC with a huge error. The rest cannot fit into both constraints. CDM is preferred, with respect to the statistical measures.
1. Introduction
The quest for understanding cosmological tensions has driven research for years now. It seems that the tension between the direct measurements of the Hubble constant () from the late universe ([1,2,3,4,5]) and that from the early universe (i.e., from measuring the temperature and polarization anisotropies in the cosmic microwave background [6,7,8,9]) is only aggravated with the increase in the precision and knowledge of the systematics of the data and has reached 5 . This discrepancy has spurred many works, trying to resolve whether the dark energy is a constant energy density or with a dynamical behavior, and if so, of what origin, leading to many different theories and possible explanations [10,11,12,13,14,15,16,17,18,19,20,21].
There are many dark energy (DE) parametrizations [22,23,24,25] that can be used in the search for deviations from the cosmological constant, . Some of them fall in the group of early dark energy models [26,27,28,29,30], which modify physics of the early universe. Others modify the late-time universe physics, such as in the phantom dark energy [31,32] models, and emergent dark energy [33,34], add interaction in the DE sector, as in the interacting dark energy [35,36,37], or add exotic species or scalar fields [38,39,40,41,42]. For a review on the taxonomy of DE models, see Refs. [43,44,45]. Finally, there is the generalized emergent dark energy (GEDE) [45] found to be able to compete with CDM for some BAO datasets [46]. In this work, we take the so-called dynamical dark energy parametrizations, which allow for a non-constant DE contribution, regardless of the origin behind it. We take a number of models, namely the Chevallier–Polarski–Linder (CPL), the Barboza–Alcaniz (BA), the low correlation (LC), the Jassal–Bagla–Padmanabhan (JBP) and the Feng–Shen–Li–Li (FSLLI) model, and we use statistical measures to judge their performance in fitting the data.
An important part of the tensions debate revolves around the role of the sound horizon at drag epoch . At recombination, after the onset of CMB at , the baryons escape the drag of photons at the drag epoch, (Planck 2018 [7]). This sets the standard ruler for the baryon acoustic oscillations (BAO)—the distance () at which the baryon–photon plasma waves oscillating in the hot universe froze at . The sound horizon at drag epoch is given by
where is the speed of sound in the baryon–photon fluid with the baryon and the photon densities, respectively [47,48].
Many papers discuss the relation between the and the sound horizon scale for different models [49,50,51]. Any DE model claiming to resolve the tension should also be able to resolve the tension since they are strongly connected [51,52,53]. In other words, setting a prior on has a very strong effect on and vice versa. In this paper, to avoid this problem, we combine the and into one parameter. We choose measurements that combine the and from the BAO and the prior distance from the CMB peaks [54,55,56,57,58,59,60,61,62] and we use them to infer the cosmological parameters for CDM and 5 DDE models. To the BAO+CMB dataset, we add the gamma-ray bursts (GRB) dataset and the Pantheon dataset with similarly marginalized dependence on (and ). We do this to expand the redshift considered by the models. In a previous work [46], we used a similar approach in which we integrated in the of the model, while here, we use them as one single quantity without modifying the . In the marginalized version, we saw an interesting possibility for some DE model to fit the data better than CDM. We continue this investigation with new models and a new approach in this paper.
Historically, the approach of using the combination is not new. It has been used in [63] with BAO and SN data to find consistency with the Planck 2015 best-fit CDM cosmology; Ref. [64] used the BAO data to fit the growth measurement, again finding consistency with the Planck 2015; Ref. [65] used the Cepheids and the Tip of the Red Branch measurements to calibrate BAO and SN measurements and find significant tension in both and , despite testing the and DE models (, , pEDE). The implication is that modifications of the physics after recombination fail to solve both tensions. The overall conclusion is that the tension should not be considered separately from the measurement implied by it [66]. In the current work, we choose a different approach. We repeat the analysis on used in earlier works, but we also take the ratio as an independent parameter. This means that we do not use the known analytical formulas for them, but instead we use MCMC to infer them. This avoids using explicit prior knowledge on the baryon load of the universe. This way, we avoid both the degeneracy on from the BAO data, but also we do not use as a hidden prior the Planck measurements.
2. Theory
A Friedmann–Lemaître–Robertson–Walker metric with the scale parameter is considered, where z is the redshift. The evolution of the universe for it is governed by the Friedmann equation, which connects the equation of the state for the CDM background:
where in standard CDM, , with the expansion of the universe , where is the Hubble parameter at redshift z, and is the Hubble parameter today. , , and are the fractional densities of radiation, matter, dark energy and the spatial curvature at redshift . We take into account the radiation energy density as . The spatial curvature is expected to be zero for a flat universe, , and we set it to zero because we focus on DE models.
We will consider a number of different DE models, all of which will feature a dark energy component depending on z. This can be done with a generalization of the Chevallier–Polarski–Linder (CPL) parametrization [67,68,69]:
which allows for three possible models from which we will consider only the CPL:
and CDM is recovered for .
This model is good for describing the whole universe history because it does not diverge for . It gives
Next, we use the low correlation model (LC) [43,71] with
where and where is the redshift at which and are uncorrelated. The effective entry into the EOS is
where, here, are replaced with for consistency with the other models.
Finally, we will also test the Feng–Shen–Li–Li parametrization [44,73] which is divergence-free for the entire history of the universe. It has two cases:
with the final contribution to the EOS of each of them being, accordingly,
In this work, the plus case (i.e., ) is denoted as FSLLI, and the minus case (i.e., ) is denoted as FSLLII.
The distance priors provide effective information of the CMB power spectrum in two aspects: the acoustic scale characterizes the CMB temperature power spectrum in the transverse direction, leading to the variation of the peak spacing, and the “shift parameter” R influences the CMB temperature spectrum along the line-of-sight direction, affecting the heights of the peaks. The popular definitions of the distance priors are [74]
where is the redshift at the photon decoupling epoch with according to the Planck 2018 results [7]. is the co-moving sound horizon at . Ref. [57] derives the distance priors in several different models using Planck 2018 TT,TE,EE + lowE which is the latest CMB data from the final full-mission Planck measurement [7]. We use the correlation matrices given in Table 1 in [57] to obtain the covariance matrices for and R corresponding to each model.
The angular diameter distance, , needed for both the distance priors and the BAO points, is given by
where , x, for , , , respectively. We see that for the measured , one can isolate the variable . Below, we set , so this formula simplifies to
Finally, for the SN and GRB datasets, we define the distance modulus , which is related to the luminosity distance (), through
where is measured in units of Mpc, and is the absolute magnitude.
3. Methods
In this paper, we use three datasets, which we treat differently. For the BAO dataset, the definition of , which we minimize, is the standard one since we do not use the covariance matrix for it.
where is a vector of the observed points (i.e., the values of at each z in Table A1), is the theoretical prediction of the model calculated with Equation (16) and is the error of each measurement.
Additionally, we use the SN and the GRB datasets to further constrain the models. For them, we use the following marginalized over and formula, taken from [46] so that we avoid setting priors on and .
Following the approach used in ([75,76,77,78]), the integrated is
for
where is the observed luminosity, is its error, is the luminosity distance, , E is the unit matrix, and is the inverse covariance matrix of the dataset. For the GRB dataset, since there is no known covariance matrix for it. For the Pantheon dataset, the total covariance is defined as , where comes from the measurement and is provided separately [79]. Note, in the so-defined marginalized , the values of M and do not change the marginalized .
The final is
4. Datasets
The dataset we are using is a collection of points from different BAO observations [80,81,82,83,84,85,86,87,88,89,90,91,92], to which we add the CMB distant prior [57] and the data from the binned Pantheon dataset, which contain 1048 supernovae luminosity measurements in the redshift range [93] binned into 40 points. The GRB dataset [94] consists of 162 measurements in the range .
To estimate the possible correlations in the BAO dataset, we use the methodology in [95,96]. This method avoids the use of N-body mocks to find the covariance matrices due to systematic errors and replaces it with an evaluation of the effect of possible small correlation on the final result. We add to the covariance matrix for uncorrelated points symmetrically a number of randomly selected nondiagonal elements . Their magnitudes are set to , where are the published errors of the data points . We introduce positive correlations in up to 6 pairs of randomly selected data points (more than of the data). Figure A1 in Appendix A shows the corner plots with different randomized points for all the models we employ in this article. From the plots, one can see that the effect from adding the correlations is below on average. This indicates that we can consider the chosen set of BAO points for being effectively uncorrelated.
To run the inference, we use a Monte Carlo Markov Chain (MCMC) nested sampler to find the best fit. We use the open-source package [97] with the package [98] to present the results.
The prior is a uniform distribution for all the quantities: , , , , and . Since the distance prior is defined at the decoupling epoch () and the BAO—at drag epoch (), we parametrize the difference between and as , where the prior for the ratio is .
5. Results
Figure 1 (as well as the figures in the Appendix A) show the final values obtained by running MCMC on the selected priors, the numbers being in Table A3 in the Appendix A, where also the corner plots can be found. We see that the models differ seriously in their estimations for the physical quantities and , probably due to the very wide prior imposed on .
Since we avoid the degeneracy between and by considering the combined quantity this leads to an explicit correlation with for some models and rather strict bounds on the error. The values of closest to the ones published by Planck 2018 [7] are for the BA, JPB and FSLLI models for the BAO dataset and CDM1 and BA for the BAO+SN+GRB. The rest significantly overestimate . For the ratio Planck 2018 gives , the closest models are BA, JPB and FSLLI/FSLLII models for the BAO dataset and (flat) CDM, JPB and FSLLI/FSLLII for the BAO+SN+GRB. For , the Planck 2018 values is . Here, the models closest to this value are CDM, CPL and LC for the BAO dataset and CDM, CPL and LC for the BAO+SN+GRB.
The DE parameters seem to be constrained to different level for the different models. As a whole, the trend to better constrain than , which we observed in [46] (and the referenced inside other works), is confirmed in this case as well. Notable exceptions are the BA and LC models, where the error of is much smaller. For them, however, the other parameters seem to be outside of the expected boundaries. CDM performs as expected under both datasets.
To compare the different models, we use well-known statistical measures. The results can be seen in Table 1. In it, we publish four selection criteria: Akaike information criterion (AIC), Bayesian information criterion (BIC), deviance information criterion (DIC) and the Bayes factor (BF). Since for small datasets, both AIC and BIC are dominated by the number of parameters in the model (which are 3 for CDM, and 5 for the DE models), we emphasize here on the DIC and the BF which rely on the numerically evaluated likelihood and evidence, making them more unbiased. The DIC criterion, just like the AIC, selects the best model to be the one with the minimal value of the DIC measurement. The reference table we use for DIC is shows strong support for the model with lower DIC, shows substantial support for the model with lower DIC, and gives ambiguous support for the model with lower DIC. Here, we use the logarithmic scale for the BF, for which shows support for the base model (CDM), while for the other hypothesis. shows an inconclusive result.
From Table 1, we see that the AIC and BIC for all models show a preference for CDM. For the DIC criterion, we see a slight possibility for a preference for other models in the case of the CPL and BA models for both tested datasets. For the BF, we see that there is some possible preference for BA, JPN and FSLLI/FSLLII for the BAO+CMB case and for CPL and BA, JPN and FSLLI/FSLLII in the BAO+CMB+SN+GRB case. The results of the LC model show that it is underfitting the data (from the ∼2) and the statistics for it is not reliable. This demonstrates another benefit of performing the statistical analysis.
The preference for the BA and LC models which we observe was also observed in the results of [43], where the authors studied a dataset consisting of SN, cosmic chronometers and gravitational waves.
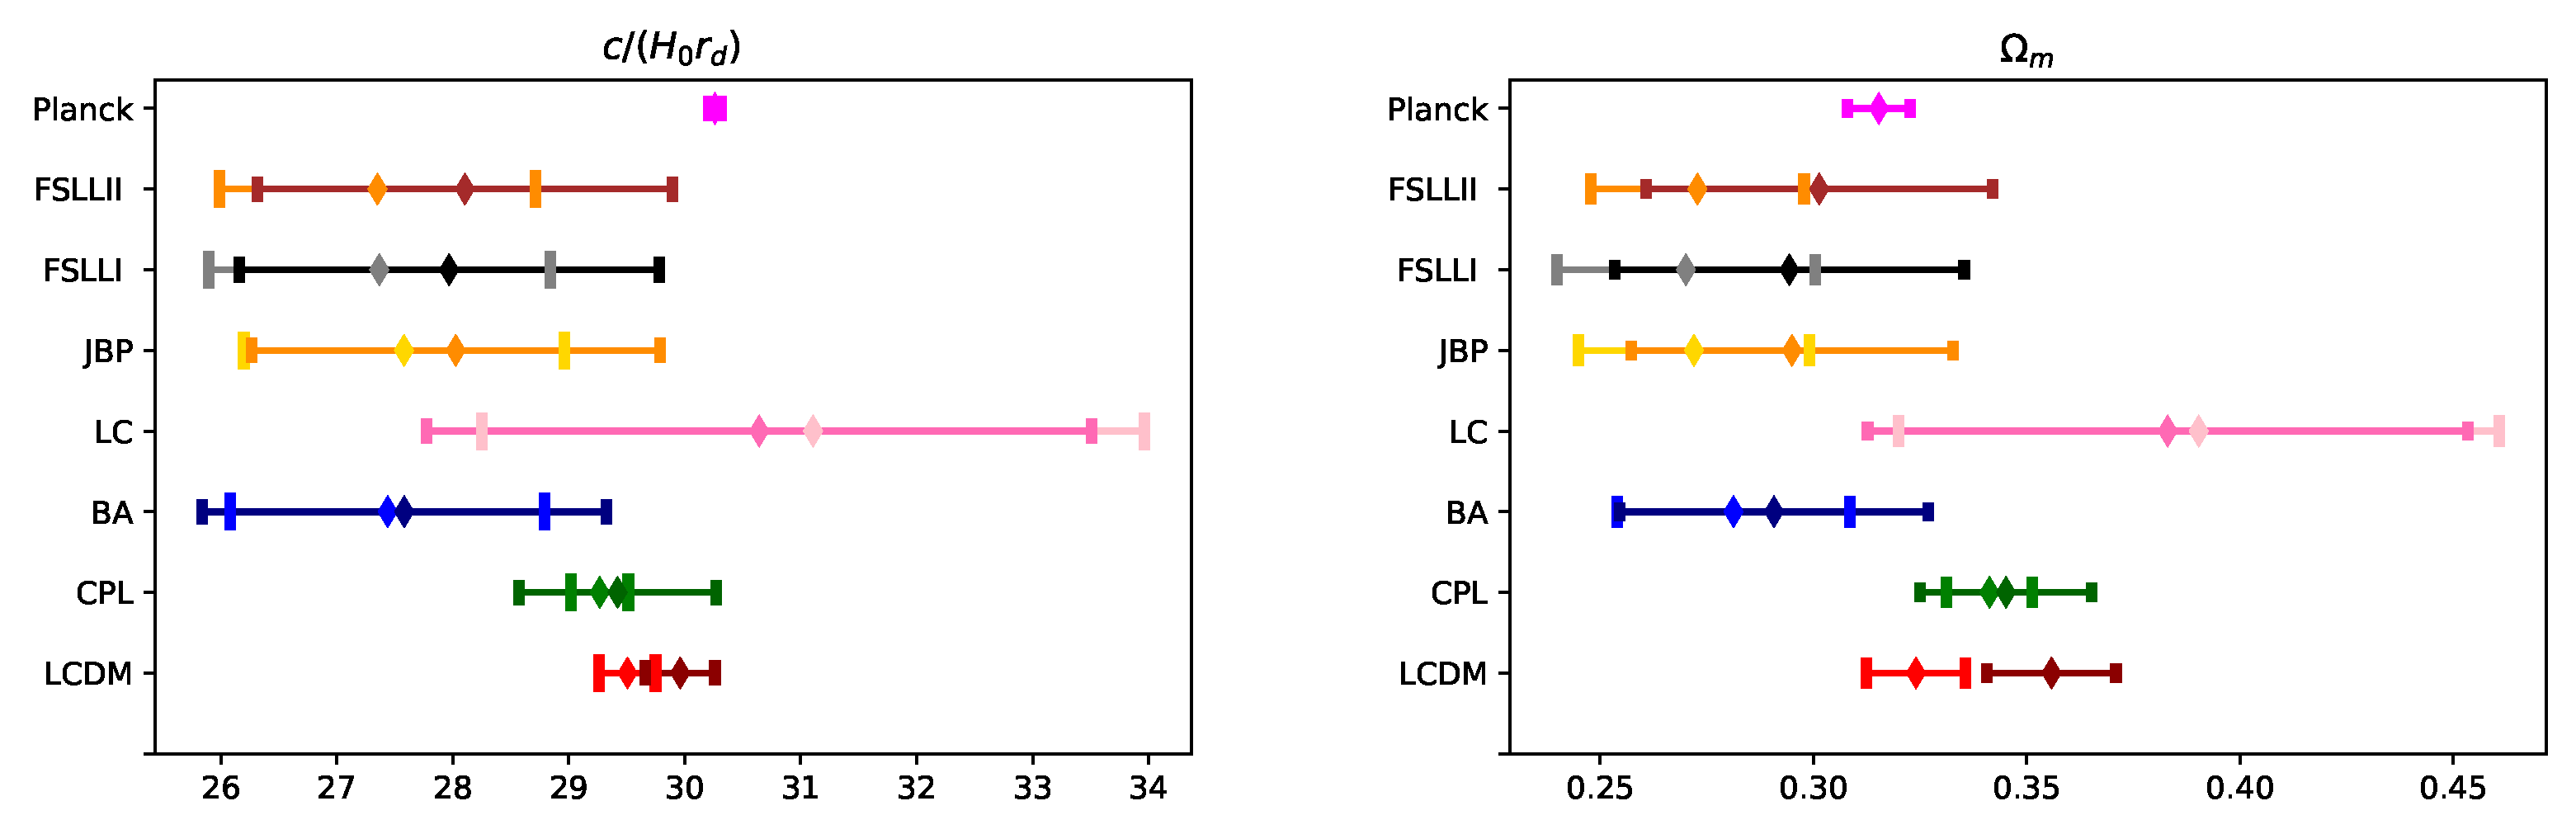
The BAO dataset we use combines the and the into one quantity. Therefore, we estimate the new variable ∼30. Figure 2 shows the values of the for different models vs. the result from Planck 2018: . For comparison, the most recent local measurement by SH0ES is , corresponding to [5]. We do not put it on the plot, because the used to obtain it is the indirect result from inference on the H0LiCOW+SN+BAO+SH0ES dataset [65]. It is, however, clearly very close to the Planck value, as expected.
On Figure 2, we superimpose the BAO+CMB-only result with the BAO+CMB+SN+GRB one. This figure enables us to visually track the tension between the Planck 2018 results and the datasets we use, which are mostly local universe ones (except for the 2 CMB points). We see that the tension is now between and . The models whose bounds cross with the Planck 2018 one for are CDM, CPL and LC for BAO+CMB and only LC for the BAO+CMB+SN+GRB dataset. For , the models that enter the interval are all but CDM and for the BAO+CMB dataset and CDM, BA, LC for the BAO+CMB+SN+GRB dataset. We see that the inclusion of the new datasets decreases the number of models satisfying the constraints. The only model that is not in tension is LC because of its huge error. Notably, in this approach, CDM, while satisfying the bounds for , does not satisfy them for .
From the plot, one can see that in general adding the new datasets decrease the errors, but they do not move the mean values in the same direction and the overall effect is not very big. This may be due to unknown errors in the SN+GRB dataset or to the fact that this dataset is not sensitive toward the combined variable since we have marginalized over so that we do not have to impose a prior on . Because of this, the only effect the SN+GRB dataset has on the combined variable is indirect, through and the other parameters. It could also point to some inconsistency in the relation such as the ones considered in [100,101,102,103,104,105] questioning the assumption that .
6. Discussion
This paper uses the combination to avoid the degeneracy between and which has plagued the use of BAO measurements and could be part of the resolution of cosmological tensions. The use of a combined parameter avoids imposing separate priors on and and thus it avoids additional assumptions on them. We use points from the late universe, the BAO dataset ()), few points from the early universe (the CMB distant priors, ()), to which we add SN data and GRB datasets, properly marginalized, to make a statistical comparison between different DE models.
The results show that the tension is now between the new parameter and —the only model that fits in the constraints set by Planck 2018 is LC, which comes with the biggest error. For the rest of the models, one of the two parameters do not fit the constraints, even if some of them somewhat reduce the tension. Statistically, there is a preference for the CDM model over the DE models in most cases. It is worth noting that there is strong evidence in support of CDM compared to all other models only when using AIC and BIC, while from DIC and BF, the support is not substantial, and it even slightly favors other models. This result raises the question of the use of different statistical measures when comparing DE models, and also it opens the possibility that a better DE model may eventually help in reducing both the tension and the tension.
Another interesting point is that for some models, the known impossibility to constrain is eliminated and has very tight bounds. These models, LC and BA and somewhat FSLLI, show interesting new possibilities for DE models. Furthermore, the choice of datasets and models make explicit the degeneracy between and , emphasizing the need to find a way to disentangle the three quantities— and —if we are to understand the cosmological tensions. The results show that adding the SN and GRB datasets decrease the errors on the constrained parameters, but they do not move them in the same direction for each model. We see that combining different datasets and different marginalization techniques, along with the use of statistical measures, is a promising tool to study new cosmological models.
Funding
Bulgarian National Science Fund research grants KP-06-N58/5/19 December 2021.
Data Availability Statement
All the data we used in this paper were taken from the corresponding citations and available to use.
Acknowledgments
D.S. thanks David Benisty for the useful comments and discussions. D.S. is thankful to Bulgarian National Science Fund for support via research grants KP-06-N58/5.
Conflicts of Interest
The authors declare no conflict of interest.
Appendix A. Some Extra Material

Table A1.
The uncorrelated dataset used in this paper. For each redshift, the table presents the parameter, the mean value, and the corresponding error bar. The reference and the collaboration are also reported.
Table A1.
The uncorrelated dataset used in this paper. For each redshift, the table presents the parameter, the mean value, and the corresponding error bar. The reference and the collaboration are also reported.
| z | Error | Year | Survey | Ref. | |
|---|---|---|---|---|---|
| 2021 | SDSS blue galaxies | [106] | |||
| 2016 | BOSS-DR12 RSD of LOWZ and CMASS | [88] | |||
| 2016 | SDSS-DR9+DR10+DR11+DR12 +covariance | [89] | |||
| 2019 | BOSS-DR12 power spectrum | [90] | |||
| 2012 | WiggleZ (galaxy clustering) | [80] | |||
| 2012 | SDSS-III DR8 (luminous galaxies) | [82] | |||
| 2012 | WiggleZ (galaxy clustering) | [80] | |||
| 2020 | DECals DR8 (LRG) | [83] | |||
| 2012 | Wiggle (galaxy clustering) | [80] | |||
| 2017 | DES Year1 (galaxy clustering) | [91] | |||
| 2020 | eBOSS DR16 ELG | [84] | |||
| 2020 | DECals DR8 (LRG) | [83] | |||
| 2019 | eBOSS DR14 quasar clustering | [85] | |||
| 2019 | eBOSS DR14 quasars clustering | [85] | |||
| 2019 | BOSS DR14 Lya and quasars | [87] | |||
| 2017 | SDSS-III/DR12 | [92] |
Table A2.
The 68 % C.L. limits for R, , in different cosmological models and their correlation matrix for from Planck 2018 TT,TE,EE + lowE; see the text for details.
Table A2.
The 68 % C.L. limits for R, , in different cosmological models and their correlation matrix for from Planck 2018 TT,TE,EE + lowE; see the text for details.
| CDM | Planck TT,TE,EE + lowE | R | |
|---|---|---|---|
| R | |||
| wCDM | Planck TT,TE,EE + lowE | R | |
| R | |||
| CDM | Planck TT,TE,EE + lowE | R | |
| R | |||
Table A3.
The posterior values for , , and for different parametrization of DE for the BAO+CMB dataset (top) and for the BAO+CMB+SN+GRB (bottom).
Table A3.
The posterior values for , , and for different parametrization of DE for the BAO+CMB dataset (top) and for the BAO+CMB+SN+GRB (bottom).
| BAO+CMB | |||||
|---|---|---|---|---|---|
| Model | w | ||||
| CDM | −1.000 | 0.000 | |||
| CPL | |||||
| BA | |||||
| LC | |||||
| JPB | |||||
| FSLLI | |||||
| FSLLII | |||||
| BAO+CMB+SN+GRB | |||||
| CDM | −1.000 | 0.000 | |||
| CPL | |||||
| BA | |||||
| LC | |||||
| JPB | |||||
| FSLLI | |||||
| FSLLII | |||||
Figure A1.
The covariance test plot for the considered models: (a) CDM, (b) , (c) , (d) , (e) model.
Figure A1.
The covariance test plot for the considered models: (a) CDM, (b) , (c) , (d) , (e) model.

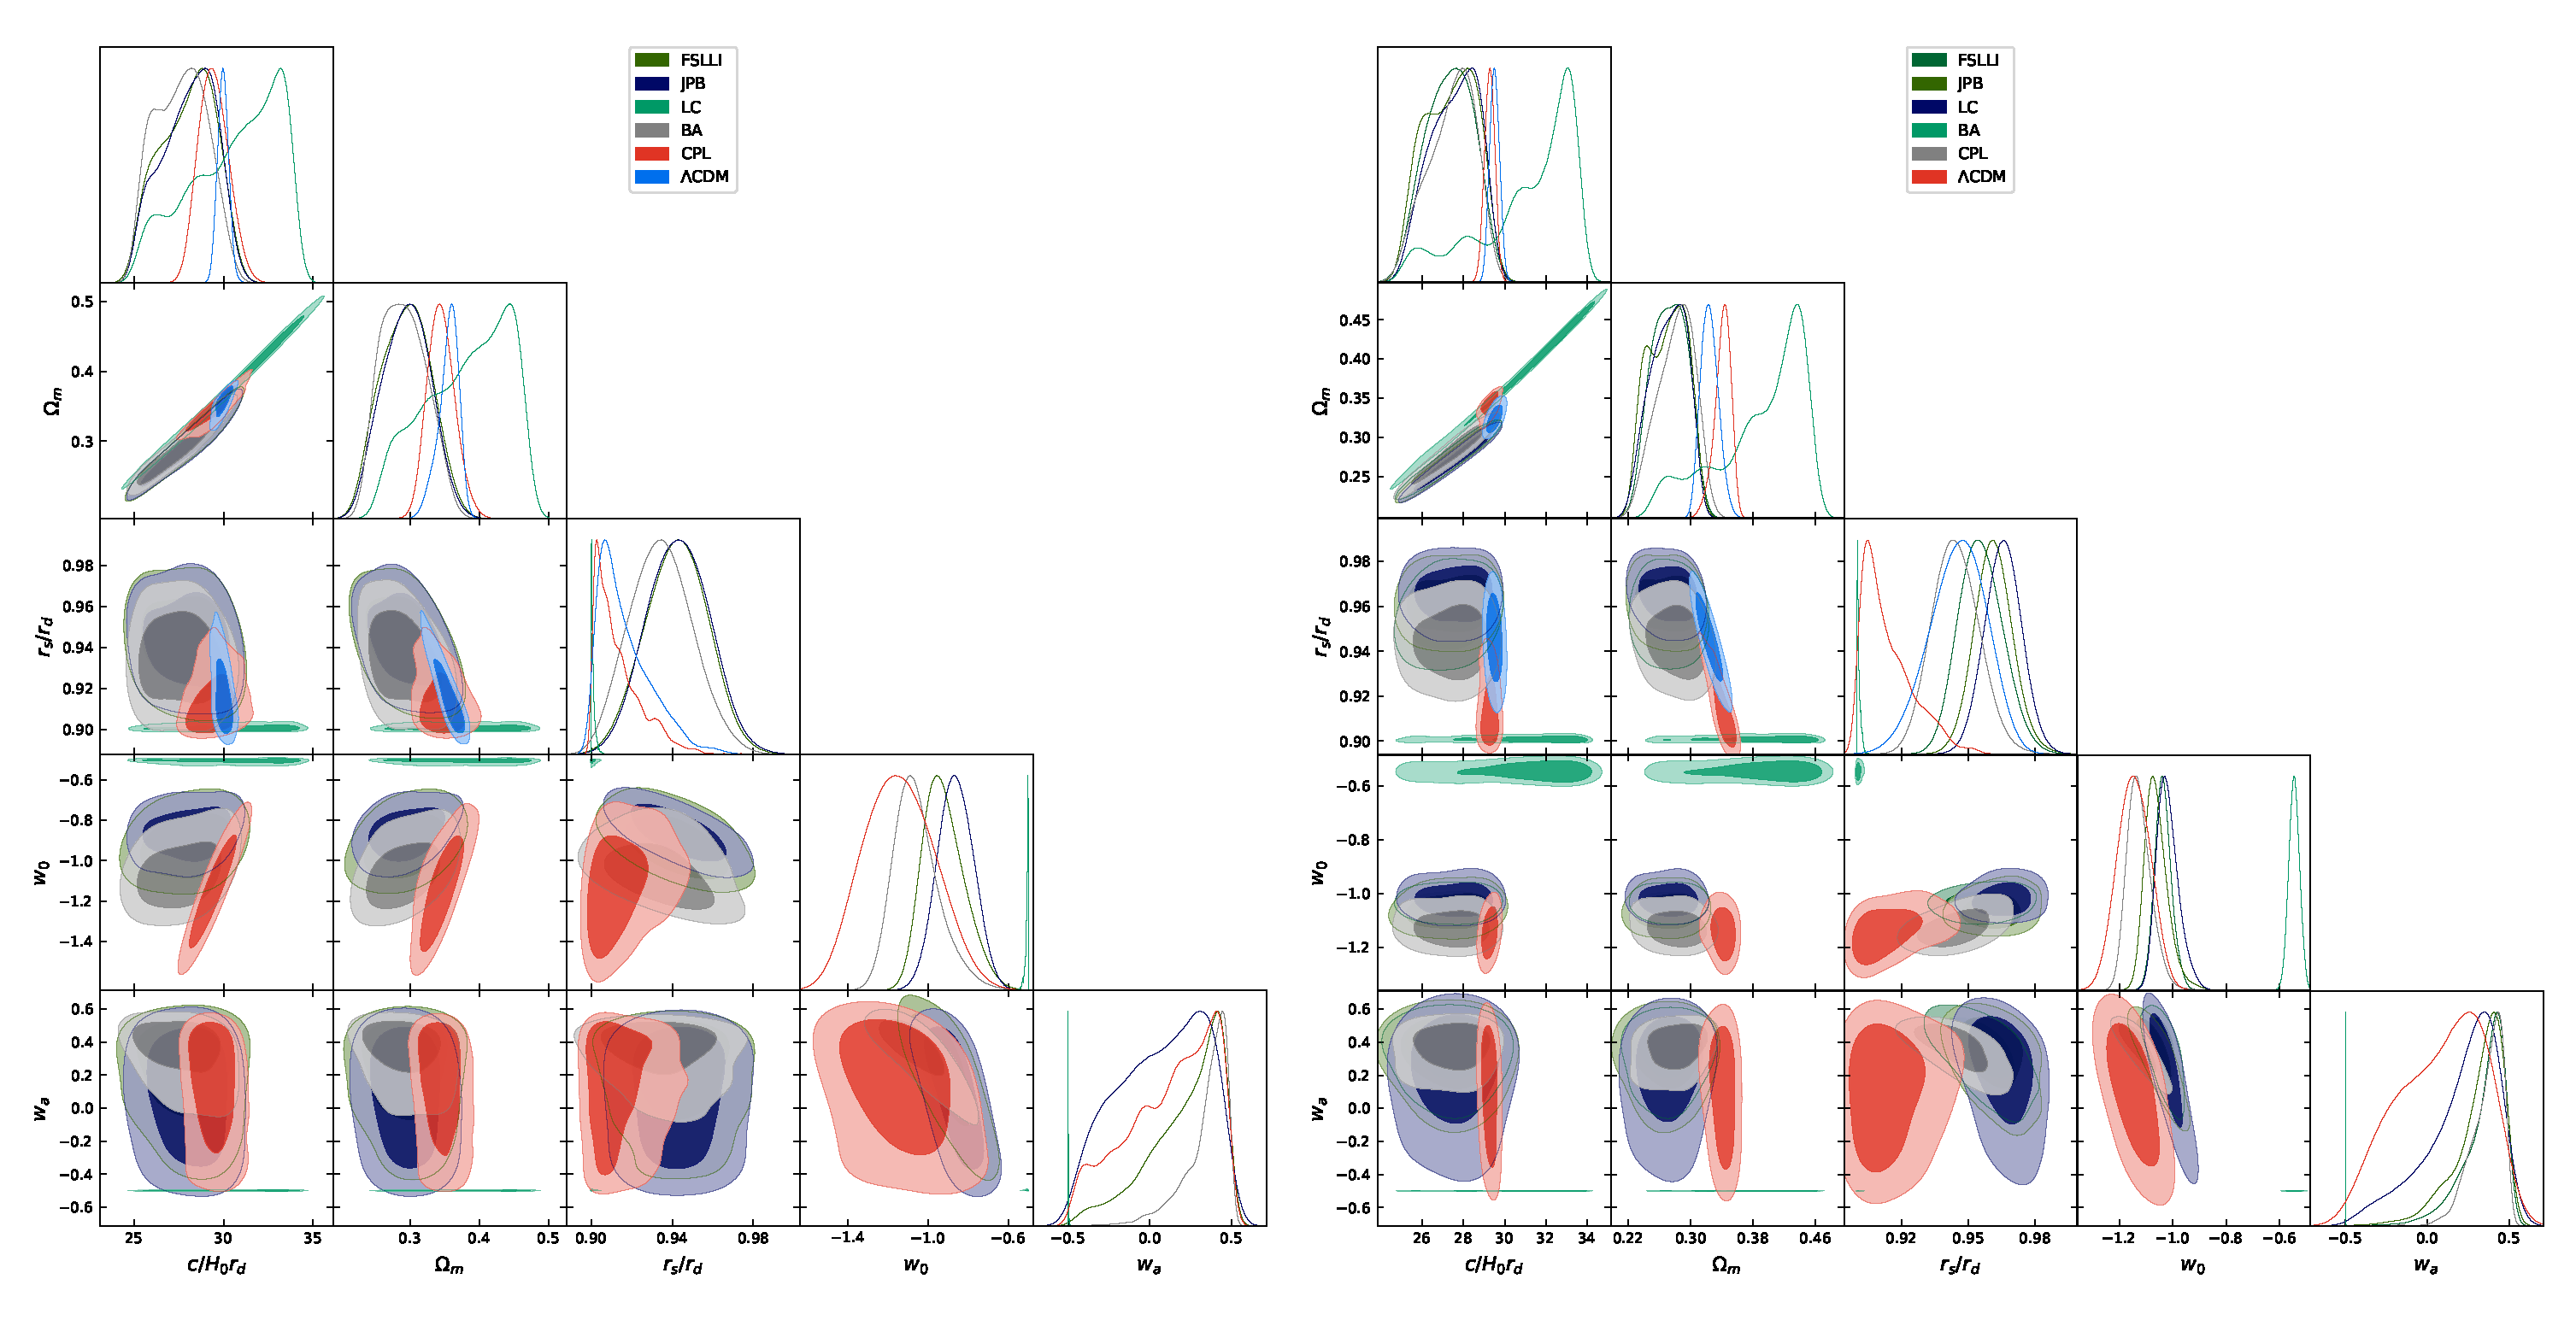
Figure A2.
The posterior distribution for , , and for different parametrization of DE for the BAO+CMB dataset to the left and for the BAO+CMB+SN+GRB to the right.
Figure A2.
The posterior distribution for , , and for different parametrization of DE for the BAO+CMB dataset to the left and for the BAO+CMB+SN+GRB to the right.

| 1 |
References
- Freedman, W.L.; Madore, B.F.; Gibson, B.K.; Ferrarese, L.; Kelson, D.D.; Sakai, S.; Mould, J.R.; Kennicutt, J.R.C.; Ford, H.C.; Graham, J.A.; et al. Final results from the Hubble Space Telescope key project to measure the Hubble constant. Astrophys. J. 2001, 553, 47–72. [Google Scholar] [CrossRef]
- Riess, A.G.; Filippenko, A.V.; Challis, P.; Clocchiatti, A.; Diercks, A.; Garnavich, P.M.; Gilliland, R.L.; Hogan, C.J.; Jha, S.; Kirshner, R.P.; et al. Observational evidence from supernovae for an accelerating universe and a cosmological constant. Astron. J. 1998, 116, 1009–1038. [Google Scholar] [CrossRef] [Green Version]
- Perlmutter, S.; Aldering, G.; Goldhaber, G.; Knop, R.A.; Nugent, P.; Castro, P.G.; Deustua, S.; Fabbro, S.; Goobar, A.; Groom, D.E.; et al. Measurements of Ω and Λ from 42 high redshift supernovae. Astrophys. J. 1999, 517, 565–586. [Google Scholar] [CrossRef]
- Riess, A.G.; Casertano, S.; Yuan, W.; Bowers, J.B.; Macri, L.; Zinn, J.C.; Scolnic, D. Cosmic Distances Calibrated to 1% Precision with Gaia EDR3 Parallaxes and Hubble Space Telescope Photometry of 75 Milky Way Cepheids Confirm Tension with ΛCDM. Astrophys. J. Lett. 2021, 908, L6. [Google Scholar] [CrossRef]
- Riess, A.G.; Breuval, L.; Yuan, W.; Casertano, S.; Macri, L.M.; Scolnic, D.; Cantat-Gaudin, T.; Anderson, R.I.; Reyes, M.C. Cluster Cepheids with High Precision Gaia Parallaxes, Low Zeropoint Uncertainties, and Hubble Space Telescope Photometry. arXiv 2022, arXiv:2208.01045. [Google Scholar]
- Troxel, M.A.; MacCrann, N.; Zuntz, J.; Eifler, T.F.; Krause, E.; Dodelson, S.; Gruen, D.; Blazek, J.; Friedrich, O.; Samuroff, S.; et al. Dark Energy Survey Year 1 results: Cosmological constraints from cosmic shear. Phys. Rev. D 2018, 98, 043528. [Google Scholar] [CrossRef] [Green Version]
- Aghanim, N.; Akrami, Y.; Ashdown, M.; Aumont, J.; Baccigalupi, C.; Ballardini, M.; Banday, A.J.; Barreiro, R.B.; Bartolo, N.; Basak, S.; et al. Planck 2018 results. VI. Cosmological parameters. Astron. Astrophys. 2020, 641, A6. [Google Scholar] [CrossRef] [Green Version]
- Ade, P.A.R.; Aghanim, N.; Arnaud, M.; Ashdown, M.; Aumont, J.; Baccigalupi, C.; Banday, A.J.; Barreiro, R.B.; Bartlett, J.G.; Bartolo, N.; et al. Planck 2015 results. XIII. Cosmological parameters. Astron. Astrophys. 2016, 594, A13. [Google Scholar] [CrossRef] [Green Version]
- Dainotti, M.G.; De Simone, B.; Schiavone, T.; Montani, G.; Rinaldi, E.; Lambiase, G. On the Hubble constant tension in the SNe Ia Pantheon sample. Astrophys. J. 2021, 912, 150. [Google Scholar] [CrossRef]
- Benisty, D.; Vasak, D.; Kirsch, J.; Struckmeier, J. Low-redshift constraints on covariant canonical Gauge theory of gravity. Eur. Phys. J. C 2021, 81, 125. [Google Scholar] [CrossRef]
- Capozziello, S.; De Laurentis, M. Extended Theories of Gravity. Phys. Rept. 2011, 509, 167–321. [Google Scholar] [CrossRef]
- Bull, P.; Akrami, Y.; Adamek, J.; Baker, T.; Bellini, E.; Jimenez, J.B.; Bentivegna, E.; Camera, S.; Clesse, S.; Davis, J.H.; et al. Beyond ΛCDM: Problems, solutions, and the road ahead. Phys. Dark Univ. 2016, 12, 56–99. [Google Scholar] [CrossRef] [Green Version]
- Di Valentino, E.; Mena, O.; Pan, S.; Visinelli, L.; Yang, W.; Melchiorri, A.; Mota, D.F.; Riess, A.G.; Silk, J. In the Realm of the Hubble tension—A Review of Solutions. arXiv 2021, arXiv:2103.01183. [Google Scholar]
- Yang, W.; Di Valentino, E.; Pan, S.; Wu, Y.; Lu, J. Dynamical dark energy after Planck CMB final release and H0 tension. Mon. Not. Roy. Astron. Soc. 2021, 501, 5845–5858. [Google Scholar] [CrossRef]
- Schöneberg, N.; Lesgourgues, J.; Hooper, D.C. The BAO+BBN take on the Hubble tension. JCAP 2019, 10, 029. [Google Scholar] [CrossRef] [Green Version]
- Di Valentino, E. Crack in the cosmological paradigm. Nat. Astron. 2017, 1, 569–570. [Google Scholar] [CrossRef] [Green Version]
- Di Valentino, E.; Anchordoqui, L.A.; Akarsu, O.; Ali-Haimoud, Y.; Amendola, L.; Arendse, N.; Asgari, M.; Ballardini, M.; Basilakos, S.; Battistelli, E.; et al. Cosmology Intertwined II: The Hubble Constant Tension. arXiv 2020, arXiv:2008.11284. [Google Scholar]
- Perivolaropoulos, L.; Skara, F. Challenges for ΛCDM: An update. arXiv 2021, arXiv:2105.05208. [Google Scholar]
- Lucca, M. Dark energy-dark matter interactions as a solution to the S8 tension. arXiv 2021, arXiv:2105.09249. [Google Scholar] [CrossRef]
- Colgáin, E.O.; Sheikh-Jabbari, M.M.; Solomon, R.; Bargiacchi, G.; Capozziello, S.; Dainotti, M.G.; Stojkovic, D. Revealing intrinsic flat ΛCDM biases with standardizable candles. Phys. Rev. D 2022, 106, L041301. [Google Scholar] [CrossRef]
- Colgáin, E.O.; Sheikh-Jabbari, M.M.; Solomon, R.; Dainotti, M.G.; Stojkovic, D. Putting Flat ΛCDM In The (Redshift) Bin. arXiv 2022, arXiv:2206.11447. [Google Scholar]
- Wang, Y.; Pogosian, L.; Zhao, G.B.; Zucca, A. Evolution of dark energy reconstructed from the latest observations. Astrophys. J. Lett. 2018, 869, L8. [Google Scholar] [CrossRef] [Green Version]
- Reyes, M.; Escamilla-Rivera, C. Improving data-driven model-independent reconstructions and new constraints in Horndeski cosmology. arXiv 2021, arXiv:2104.04484. [Google Scholar]
- Colgáin, E.Ó.; Sheikh-Jabbari, M.M.; Yin, L. Can dark energy be dynamical? arXiv 2021, arXiv:2104.01930. [Google Scholar] [CrossRef]
- Liu, W.; Anchordoqui, L.A.; Di Valentino, E.; Pan, S.; Wu, Y.; Yang, W. Constraints from High-Precision Measurements of the Cosmic Microwave Background: The Case of Disintegrating Dark Matter with Λ or Dynamical Dark Energy. arXiv 2021, arXiv:2108.04188. [Google Scholar] [CrossRef]
- Pettorino, V.; Amendola, L.; Wetterich, C. How early is early dark energy? Phys. Rev. D 2013, 87, 083009. [Google Scholar] [CrossRef]
- Poulin, V.; Smith, T.L.; Karwal, T.; Kamionkowski, M. Early Dark Energy Can Resolve The Hubble Tension. Phys. Rev. Lett. 2019, 122, 221301. [Google Scholar] [CrossRef] [PubMed] [Green Version]
- Lin, M.X.; Hu, W.; Raveri, M. Testing H0 in Acoustic Dark Energy with Planck and ACT Polarization. Phys. Rev. D 2020, 102, 123523. [Google Scholar] [CrossRef]
- Smith, T.L.; Lucca, M.; Poulin, V.; Abellan, G.F.; Balkenhol, L.; Benabed, K.; Galli, S.; Murgia, R. Hints of early dark energy in Planck, SPT, and ACT data: New physics or systematics? Phys. Rev. D 2022, 106, 043526. [Google Scholar] [CrossRef]
- Smith, T.L.; Poulin, V.; Bernal, J.L.; Boddy, K.K.; Kamionkowski, M.; Murgia, R. Early dark energy is not excluded by current large-scale structure data. Phys. Rev. D 2021, 103, 123542. [Google Scholar] [CrossRef]
- Di Valentino, E. A combined analysis of the H0 late time direct measurements and the impact on the Dark Energy sector. Mon. Not. Roy. Astron. Soc. 2021, 502, 2065–2073. [Google Scholar] [CrossRef]
- Haridasu, B.S.; Viel, M.; Vittorio, N. Sources of H0-tension in dark energy scenarios. Phys. Rev. D 2021, 103, 063539. [Google Scholar] [CrossRef]
- Li, X.; Shafieloo, A. A Simple Phenomenological Emergent Dark Energy Model can Resolve the Hubble Tension. Astrophys. J. Lett. 2019, 883, L3. [Google Scholar] [CrossRef] [Green Version]
- Yang, W.; Di Valentino, E.; Pan, S.; Mena, O. Emergent Dark Energy, neutrinos and cosmological tensions. Phys. Dark Univ. 2021, 31, 100762. [Google Scholar] [CrossRef]
- Kumar, S.; Nunes, R.C. Echo of interactions in the dark sector. Phys. Rev. D 2017, 96, 103511. [Google Scholar] [CrossRef] [Green Version]
- Di Valentino, E.; Melchiorri, A.; Mena, O.; Vagnozzi, S. Interacting dark energy in the early 2020s: A promising solution to the H0 and cosmic shear tensions. Phys. Dark Univ. 2020, 30, 100666. [Google Scholar] [CrossRef]
- Yang, W.; Mena, O.; Pan, S.; Di Valentino, E. Dark sectors with dynamical coupling. Phys. Rev. D 2019, 100, 083509. [Google Scholar] [CrossRef] [Green Version]
- Gogoi, A.; Sharma, R.K.; Chanda, P.; Das, S. Early Mass-varying Neutrino Dark Energy: Nugget Formation and Hubble Anomaly. Astrophys. J. 2021, 915, 132. [Google Scholar] [CrossRef]
- Sakstein, J.; Trodden, M. Early Dark Energy from Massive Neutrinos as a Natural Resolution of the Hubble Tension. Phys. Rev. Lett. 2020, 124, 161301. [Google Scholar] [CrossRef]
- Tian, S.X.; Zhu, Z.H. Early dark energy in k-essence. Phys. Rev. D 2021, 103, 043518. [Google Scholar] [CrossRef]
- Nojiri, S.; Odintsov, S.D.; Saez-Chillon Gomez, D.; Sharov, G.S. Modelling and testing the equation of state for (Early) dark energy. arXiv 2021, arXiv:2103.05304. [Google Scholar]
- Seto, O.; Toda, Y. Comparing early dark energy and extra radiation solutions to the Hubble tension with BBN. Phys. Rev. D 2021, 103, 123501. [Google Scholar] [CrossRef]
- Escamilla-Rivera, C.; Nájera, A. Dynamical dark energy models in the light of gravitational-wave transient catalogues. JCAP 2022, 03, 060. [Google Scholar] [CrossRef]
- Motta, V.; García-Aspeitia, M.A.; Hernández-Almada, A.; Magaña, J.; Verdugo, T. Taxonomy of Dark Energy Models. Universe 2021, 7, 163. [Google Scholar] [CrossRef]
- Yang, W.; Di Valentino, E.; Pan, S.; Shafieloo, A.; Li, X. Generalized emergent dark energy model and the Hubble constant tension. Phys. Rev. D 2021, 104, 063521. [Google Scholar] [CrossRef]
- Staicova, D.; Benisty, D. Constraining the dark energy models using Baryon Acoustic Oscillations: An approach independent of H0 · rd. arXiv 2021, arXiv:2107.14129. [Google Scholar]
- Aubourg, E.; Bailey, S.; Bautista, J.E.; Beutler, F.; Bhardwaj, V.; Bizyaev, D.; Blanton, M.; Blomqvist, M.; Bolton, A.S.; Bovy, J.; et al. Cosmological implications of baryon acoustic oscillation measurements. Phys. Rev. D 2015, 92, 123516. [Google Scholar] [CrossRef] [Green Version]
- Arendse, N.; Agnello, A.; Wojtak, R. Low-redshift measurement of the sound horizon through gravitational time-delays. Astron. Astrophys. 2019, 632, A91. [Google Scholar] [CrossRef]
- Aylor, K.; Joy, M.; Knox, L.; Millea, M.; Raghunathan, S.; Wu, W.L.K. Sounds Discordant: Classical Distance Ladder & ΛCDM-based Determinations of the Cosmological Sound Horizon. Astrophys. J. 2019, 874, 4. [Google Scholar] [CrossRef] [Green Version]
- Pogosian, L.; Zhao, G.B.; Jedamzik, K. Recombination-independent determination of the sound horizon and the Hubble constant from BAO. Astrophys. J. Lett. 2020, 904, L17. [Google Scholar] [CrossRef]
- Aizpuru, A.; Arjona, R.; Nesseris, S. Machine learning improved fits of the sound horizon at the baryon drag epoch. Phys. Rev. D 2021, 104, 043521. [Google Scholar] [CrossRef]
- Jedamzik, K.; Pogosian, L.; Zhao, G.B. Why reducing the cosmic sound horizon alone can not fully resolve the Hubble tension. Commun. Phys. 2021, 4, 123. [Google Scholar] [CrossRef]
- De la Macorra, A.; Almaraz, E.; Garrido, J. Towards a Solution to the H0 Tension: The Price to Pay. arXiv 2021, arXiv:2106.12116. [Google Scholar]
- Wang, Y.; Wang, S. Distance Priors from Planck and Dark Energy Constraints from Current Data. Phys. Rev. D 2013, 88, 043522, Erratum in Phys. Rev. D 2013, 88, 069903. [Google Scholar] [CrossRef] [Green Version]
- Mamon, A.A.; Bamba, K.; Das, S. Constraints on reconstructed dark energy model from SN Ia and BAO/CMB observations. Eur. Phys. J. C 2017, 77, 29. [Google Scholar] [CrossRef] [Green Version]
- Grandon, D.; Cardenas, V.H. Exploring evidence of interaction between dark energy and dark matter. arXiv 2018, arXiv:1804.03296. [Google Scholar] [CrossRef] [Green Version]
- Chen, L.; Huang, Q.G.; Wang, K. Distance Priors from Planck Final Release. JCAP 2019, 02, 028. [Google Scholar] [CrossRef] [Green Version]
- Da Silva, W.J.C.; Silva, R. Extended ΛCDM model and viscous dark energy: A Bayesian analysis. JCAP 2019, 05, 036. [Google Scholar] [CrossRef] [Green Version]
- Zhai, Z.; Wang, Y. Robust and model-independent cosmological constraints from distance measurements. JCAP 2019, 07, 005. [Google Scholar] [CrossRef]
- Di Valentino, E.; Melchiorri, A.; Silk, J. Investigating Cosmic Discordance. Astrophys. J. Lett. 2021, 908, L9. [Google Scholar] [CrossRef]
- Nilsson, N.A.; Park, M.I. Tests of standard cosmology in Hořava gravity, Bayesian evidence for a closed universe, and the Hubble tension. Eur. Phys. J. C 2022, 82, 873. [Google Scholar] [CrossRef]
- Yao, Y.H.; Meng, X.H. Can interacting dark energy with dynamical coupling resolve the Hubble tension. arXiv 2022, arXiv:2207.05955. [Google Scholar] [CrossRef]
- L’Huillier, B.; Shafieloo, A. Model-independent test of the FLRW metric, the flatness of the Universe, and non-local measurement of H0rd. JCAP 2017, 01, 015. [Google Scholar] [CrossRef] [Green Version]
- Shafieloo, A.; L’Huillier, B.; Starobinsky, A.A. Falsifying ΛCDM: Model-independent tests of the concordance model with eBOSS DR14Q and Pantheon. Phys. Rev. D 2018, 98, 083526. [Google Scholar] [CrossRef] [Green Version]
- Arendse, N.; Wojtak, R.; Agnello, A.; Chen, G.C.-F.; Fassnacht, C.D.; Sluse, D.; Hilbert, S.; Millon, M.; Bonvin, V.; Wong, K.C.; et al. Cosmic dissonance: Are new physics or systematics behind a short sound horizon? Astron. Astrophys. 2020, 639, A57. [Google Scholar] [CrossRef]
- Knox, L.; Millea, M. Hubble constant hunter’s guide. Phys. Rev. D 2020, 101, 043533. [Google Scholar] [CrossRef] [Green Version]
- Chevallier, M.; Polarski, D. Accelerating universes with scaling dark matter. Int. J. Mod. Phys. D 2001, 10, 213–224. [Google Scholar] [CrossRef] [Green Version]
- Linder, E.V.; Huterer, D. How many dark energy parameters? Phys. Rev. D 2005, 72, 043509. [Google Scholar] [CrossRef] [Green Version]
- Barger, V.; Guarnaccia, E.; Marfatia, D. Classification of dark energy models in the (w(0), w(a)) plane. Phys. Lett. B 2006, 635, 61–65. [Google Scholar] [CrossRef]
- Barboza, E.M., Jr.; Alcaniz, J.S. A parametric model for dark energy. Phys. Lett. B 2008, 666, 415–419. [Google Scholar] [CrossRef]
- Wang, Y. Figure of Merit for Dark Energy Constraints from Current Observational Data. Phys. Rev. D 2008, 77, 123525. [Google Scholar] [CrossRef] [Green Version]
- Jassal, H.K.; Bagla, J.S.; Padmanabhan, T. WMAP constraints on low redshift evolution of dark energy. Mon. Not. Roy. Astron. Soc. 2005, 356, L11–L16. [Google Scholar] [CrossRef]
- Feng, C.J.; Shen, X.Y.; Li, P.; Li, X.Z. A New Class of Parametrization for Dark Energy without Divergence. JCAP 2012, 09, 023. [Google Scholar] [CrossRef] [Green Version]
- Komatsu, E.; Dunkley, J.; Nolta, M.R.; Bennett, C.L.; Gold, B.; Hinshaw, G.; Jarosik, N.; Larson, D.; Limon, M.; Page, L.; et al. Five-Year Wilkinson Microwave Anisotropy Probe (WMAP) Observations: Cosmological Interpretation. Astrophys. J. Suppl. 2009, 180, 330–376. [Google Scholar] [CrossRef] [Green Version]
- Di Pietro, E.; Claeskens, J.F. Future supernovae data and quintessence models. Mon. Not. Roy. Astron. Soc. 2003, 341, 1299. [Google Scholar] [CrossRef]
- Nesseris, S.; Perivolaropoulos, L. A Comparison of cosmological models using recent supernova data. Phys. Rev. D 2004, 70, 043531. [Google Scholar] [CrossRef] [Green Version]
- Perivolaropoulos, L. Constraints on linear negative potentials in quintessence and phantom models from recent supernova data. Phys. Rev. D 2005, 71, 063503. [Google Scholar] [CrossRef] [Green Version]
- Lazkoz, R.; Nesseris, S.; Perivolaropoulos, L. Exploring Cosmological Expansion Parametrizations with the Gold SnIa Dataset. JCAP 2005, 11, 010. [Google Scholar] [CrossRef]
- Deng, H.K.; Wei, H. Null signal for the cosmic anisotropy in the Pantheon supernovae data. Eur. Phys. J. C 2018, 78, 755. [Google Scholar] [CrossRef]
- Blake, C.; Brough, S.; Colless, M.; Contreras, C.; Couch, W.; Croom, S.; Croton, D.; Davis, T.M.; Drinkwater, M.J.; Forster, K.; et al. The WiggleZ Dark Energy Survey: Joint measurements of the expansion and growth history at z < 1. Mon. Not. Roy. Astron. Soc. 2012, 425, 405–414. [Google Scholar] [CrossRef] [Green Version]
- Carvalho, G.C.; Bernui, A.; Benetti, M.; Carvalho, J.C.; Alcaniz, J.S. Baryon Acoustic Oscillations from the SDSS DR10 galaxies angular correlation function. Phys. Rev. D 2016, 93, 023530. [Google Scholar] [CrossRef] [Green Version]
- Seo, H.-J.; Ho, S.; White, M.; Cuesta, A.J.; Ross, A.; Saito, S.; Reid, B.; Padmanabhan, N.; Percival, W.J.; De Putter, R.; et al. Acoustic scale from the angular power spectra of SDSS-III DR8 photometric luminous galaxies. Astrophys. J. 2012, 761, 13. [Google Scholar] [CrossRef] [Green Version]
- Sridhar, S.; Song, Y.S.; Ross, A.J.; Zhou, R.; Newman, J.A.; Chuang, C.H.; Prada, F.; Blum, R.; Gaztañaga, E.; Landriau, M. Clustering of LRGs in the DECaLS DR8 Footprint: Distance Constraints from Baryon Acoustic Oscillations Using Photometric Redshifts. Astrophys. J. 2020, 904, 69. [Google Scholar] [CrossRef]
- Tamone, A.; Raichoor, A.; Zhao, C.; de Mattia, A.; Gorgoni, C.; Burtin, E.; Ruhlmann-Kleider, V.; Ross, A.J.; Alam, S.; Percival, W.J.; et al. The Completed SDSS-IV extended Baryon Oscillation Spectroscopic Survey: Growth rate of structure measurement from anisotropic clustering analysis in configuration space between redshift 0.6 and 1.1 for the Emission Line Galaxy sample. Mon. Not. Roy. Astron. Soc. 2020, 499, 5527–5546. [Google Scholar] [CrossRef]
- Zhu, F.; Padmanabhan, N.; Ross, A.J.; White, M.; Percival, W.J.; Ruggeri, R.; Zhao, G.; Wang, D.; Mueller, E.-M.; Burtin, E.; et al. The clustering of theSDSS-IV extended Baryon Oscillation Spectroscopic Survey DR14 quasar sample: Measuring the anisotropic baryon acoustic oscillations with redshift weights. Mon. Not. Roy. Astron. Soc. 2018, 480, 1096–1105. [Google Scholar] [CrossRef] [Green Version]
- Hou, J.; Sánchez, A.G.; Ross, A.J.; Smith, A.; Neveux, R.; Bautista, J.; Burtin, E.; Zhao, C.; Scoccimarro, R.; Dawson, K.S.; et al. The Completed SDSS-IV extended Baryon Oscillation Spectroscopic Survey: BAO and RSD measurements from anisotropic clustering analysis of the Quasar Sample in configuration space between redshift 0.8 and 2.2. Mon. Not. Roy. Astron. Soc. 2020, 500, 1201–1221. [Google Scholar] [CrossRef]
- Blomqvist, M.; Des Bourboux, H.D.M.; Busca, N.G.; de Sainte Agathe, V.; Rich, J.; Balland, C.; Bautista, J.E.; Dawson, K.; Font-Ribera, A.; Guy, J.; et al. Baryon acoustic oscillations from the cross-correlation of Lyα absorption and quasars in eBOSS DR14. Astron. Astrophys. 2019, 629, A86. [Google Scholar] [CrossRef] [Green Version]
- Chuang, C.H.; Pellejero-Ibanez, M.; Rodríguez-Torres, S.; Ross, A.J.; Zhao, G.; Wang, Y.; Cuesta, A.J.; Rubiño-Martin, J.A.; Prada, F.; Alam, S.; et al. The clustering of galaxies in the completed SDSS-III Baryon Oscillation Spectroscopic Survey: Single-probe measurements from DR12 galaxy clustering—Towards an accurate model. Mon. Not. Roy. Astron. Soc. 2017, 471, 2370–2390. [Google Scholar] [CrossRef]
- Alam, S.; Ata, M.; Bailey, S.; Beutler, F.; Bizyaev, D.; Blazek, J.A.; Bolton, A.S.; Brownstein, J.R.; Burden, A.; Chuang, C.-H.; et al. The clustering of galaxies in the completed SDSS-III Baryon Oscillation Spectroscopic Survey: Cosmological analysis of the DR12 galaxy sample. Mon. Not. Roy. Astron. Soc. 2017, 470, 2617–2652. [Google Scholar] [CrossRef]
- Beutler, F.; Seo, H.-J.; Ross, A.J.; McDonald, P.; Saito, S.; Bolton, A.S.; Brownstein, J.R.; Chuang, C.-H.; Cuesta, A.J.; Eisenstein, D.J.; et al. The clustering of galaxies in the completed SDSS-III Baryon Oscillation Spectroscopic Survey: Baryon acoustic oscillations in the Fourier space. Mon. Not. Roy. Astron. Soc. 2017, 464, 3409–3430. [Google Scholar] [CrossRef] [Green Version]
- Abbott, T.M.C.; Abdalla, F.B.; Alarcon, A.; Allam, S.; Andrade-Oliveira, F.; Annis, J.; Avila, S.; Banerji, M.; Banik, N.; Bechtol, K.; et al. Dark Energy Survey Year 1 Results: Measurement of the Baryon Acoustic Oscillation scale in the distribution of galaxies to redshift 1. Mon. Not. Roy. Astron. Soc. 2019, 483, 4866–4883. [Google Scholar] [CrossRef] [Green Version]
- Du Mas des Bourboux, H.; Le Goff, J.-M.; Blomqvist, M.; Busca, N.G.; Guy, J.; Rich, J.; Yèche, C.; Bautista, J.E.; Burtin, E.; Dawson, K.S.; et al. Baryon acoustic oscillations from the complete SDSS-III Lyα-quasar cross-correlation function at z = 2.4. Astron. Astrophys. 2017, 608, A130. [Google Scholar] [CrossRef] [Green Version]
- Scolnic, D.M.; Jones, D.O.; Rest, A.; Pan, Y.C.; Chornock, R.; Foley, R.J.; Huber, M.E.; Kessler, R.; Narayan, G.; Riess, A.G.; et al. The Complete Light-curve Sample of Spectroscopically Confirmed SNe Ia from Pan-STARRS1 and Cosmological Constraints from the Combined Pantheon Sample. Astrophys. J. 2018, 859, 101. [Google Scholar] [CrossRef]
- Demianski, M.; Piedipalumbo, E.; Sawant, D.; Amati, L. Cosmology with gamma-ray bursts: I. The Hubble diagram through the calibrated Ep,i–Eiso correlation. Astron. Astrophys. 2017, 598, A112. [Google Scholar] [CrossRef] [Green Version]
- Kazantzidis, L.; Perivolaropoulos, L. Evolution of the fσ8 tension with the Planck15/ΛCDM determination and implications for modified gravity theories. Phys. Rev. D 2018, 97, 103503. [Google Scholar] [CrossRef] [Green Version]
- Benisty, D.; Staicova, D. Testing late-time cosmic acceleration with uncorrelated baryon acoustic oscillation dataset. Astron. Astrophys. 2021, 647, A38. [Google Scholar] [CrossRef]
- Handley, W.J.; Hobson, M.P.; Lasenby, A.N. PolyChord: Nested sampling for cosmology. Mon. Not. Roy. Astron. Soc. 2015, 450, L61–L65. [Google Scholar] [CrossRef]
- Lewis, A. GetDist: A Python package for analysing Monte Carlo samples. arXiv 2019, arXiv:1910.13970. [Google Scholar]
- Yang, W.; Giarè, W.; Pan, S.; Di Valentino, E.; Melchiorri, A.; Silk, J. Revealing the effects of curvature on the cosmological models. arXiv 2022, arXiv:2210.09865. [Google Scholar]
- Benisty, D.; Mifsud, J.; Said, J.L.; Staicova, D. On the Robustness of the Constancy of the Supernova Absolute Magnitude: Non-parametric Reconstruction & Bayesian approaches. arXiv 2022, arXiv:2202.04677. [Google Scholar]
- Ferramacho, L.D.; Blanchard, A.; Zolnierowski, Y. Constraints on C.D.M. cosmology from galaxy power spectrum, CMB and SNIa evolution. Astron. Astrophys. 2009, 499, 21. [Google Scholar] [CrossRef] [Green Version]
- Linden, S.; Virey, J.M.; Tilquin, A. Cosmological Parameter Extraction and Biases from Type Ia Supernova Magnitude Evolution. Astron. Astrophys. 2009, 50, 1095–1105. [Google Scholar] [CrossRef]
- Tutusaus, I.; Lamine, B.; Dupays, A.; Blanchard, A. Is cosmic acceleration proven by local cosmological probes? Astron. Astrophys. 2017, 602, A73. [Google Scholar] [CrossRef] [Green Version]
- Di Valentino, E.; Gariazzo, S.; Mena, O.; Vagnozzi, S. Soundness of Dark Energy properties. JCAP 2020, 07, 045. [Google Scholar] [CrossRef]
- Perivolaropoulos, L.; Skara, F. A reanalysis of the latest SH0ES data for H0: Effects of new degrees of freedom on the Hubble tension. Universe 2022, 8, 502. [Google Scholar] [CrossRef]
- De Carvalho, E.; Bernui, A.; Avila, F.; Novaes, C.P.; Nogueira-Cavalcante, J.P. BAO angular scale at zeff = 0.11 with the SDSS blue galaxies. Astron. Astrophys. 2021, 649, A20. [Google Scholar] [CrossRef]
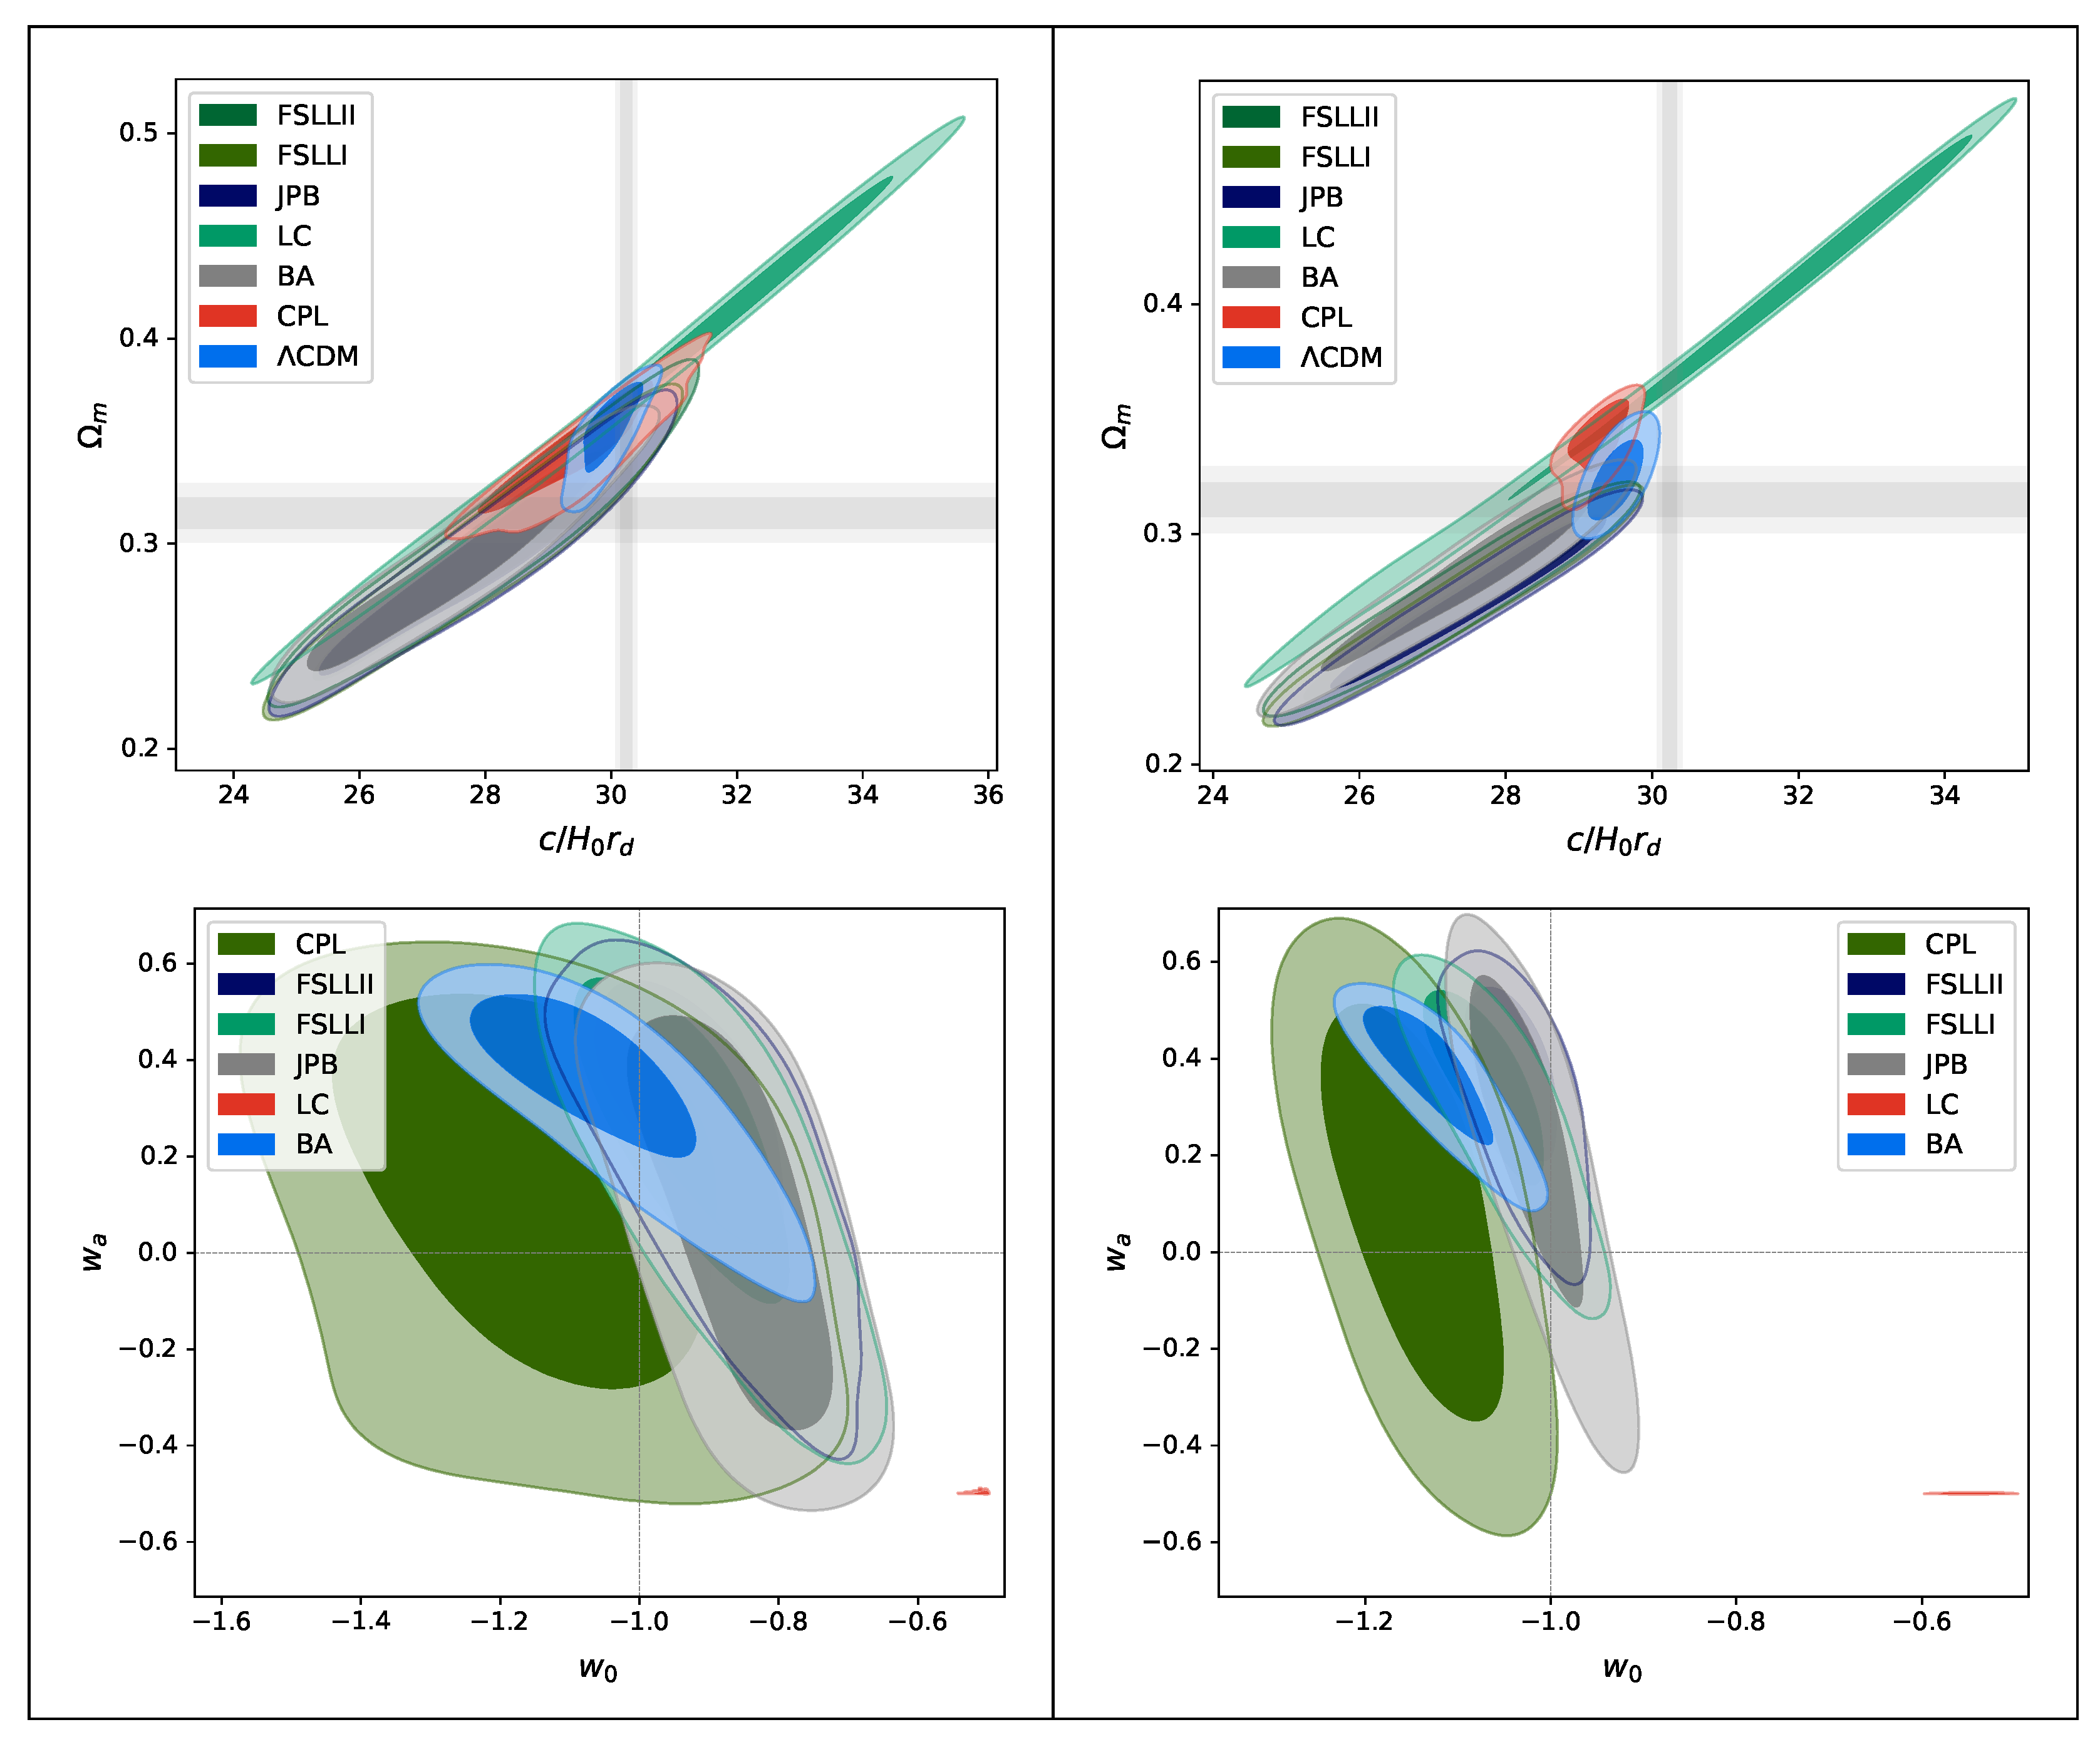
Figure 1.
The 2D contour plot for the different DE parametrizations for the BAO+CMB dataset to the left and for the BAO+CMB+SN+GRB to the right. The upper panel shows the results for vs. and the lower panel shows the results for w and . CDM corresponds to and . The grey lines show the and of and as measured by Planck 2018, while on the bottom plot the gray cross shows where we recover CDM.

Figure 2.
The final values of the from different DE models, compared to the values from Planck for the BAO+CMB+SN+GRB dataset. The smaller, darker, errorbox are for BAO+CMB, the lighter, bigger errorbox–for SN+GRB.
Figure 2.
The final values of the from different DE models, compared to the values from Planck for the BAO+CMB+SN+GRB dataset. The smaller, darker, errorbox are for BAO+CMB, the lighter, bigger errorbox–for SN+GRB.

Table 1.
Selection criteria of different models in a comparison to the CDM model for the BAO dataset and the BAO+SN+GRB dataset.
Table 1.
Selection criteria of different models in a comparison to the CDM model for the BAO dataset and the BAO+SN+GRB dataset.
| BAO+CMB | |||||||
|---|---|---|---|---|---|---|---|
| Model | AIC | AIC | BIC | DIC | DIC | ln(BF) | |
| CDM | 22.0 | 24.5 | 16.8 | ||||
| CPL | 25.7 | −3.7 | 29.9 | −5.4 | 16.5 | 0.3 | 0.6 |
| BA | 25.3 | −3.3 | 29.5 | −4.9 | 16.2 | 0.65 | −5.3 |
| LC | 56.0 | −33.9 | 60.2 | −35.6 | 51.1 | −34.3 | 38.5 |
| JPB | 27.8 | −5.8 | 31.9 | −7.4 | 18.6 | −1.8 | −3.5 |
| FSLLI | 27.1 | −5.1 | 31.3 | −6.9 | 17.9 | −1.1 | −3.8 |
| FSLLII | 26.6 | −4.6 | 30.8 | −6.3 | 17.4 | −0.65 | −4.0 |
| BAO+CMB+SN+GRB | |||||||
| CDM | 228.1 | 238.3 | 222.7 | ||||
| CPL | 229.2 | −1.1 | 246.1 | −7.8 | 219.9 | 2.8 | −1.2 |
| BA | 229.0 | −0.9 | 246.0 | −7.8 | 219.8 | 2.9 | −5.9 |
| LC | 436.8 | −208.7 | 453.7 | −215.5 | 427.6 | −204.9 | 208.9 |
| JPB | 232.2 | −4.1 | 249.2 | −10.9 | 222.9 | −0.2 | −4.0 |
| FSLLI | 231.1 | −2.9 | 248.0 | −9.7 | 221.9 | 0.9 | −3.7 |
| FSLLII | 230.5 | −2.4 | 247.4 | −9.2 | 221.3 | 1.5 | −4.8 |
Publisher’s Note: MDPI stays neutral with regard to jurisdictional claims in published maps and institutional affiliations. |
© 2022 by the author. Licensee MDPI, Basel, Switzerland. This article is an open access article distributed under the terms and conditions of the Creative Commons Attribution (CC BY) license (https://creativecommons.org/licenses/by/4.0/).
Share and Cite
MDPI and ACS Style
Staicova, D. DE Models with Combined H0 · rd from BAO and CMB Dataset and Friends. Universe 2022, 8, 631. https://doi.org/10.3390/universe8120631
AMA Style
Staicova D. DE Models with Combined H0 · rd from BAO and CMB Dataset and Friends. Universe. 2022; 8(12):631. https://doi.org/10.3390/universe8120631
Chicago/Turabian StyleStaicova, Denitsa. 2022. "DE Models with Combined H0 · rd from BAO and CMB Dataset and Friends" Universe 8, no. 12: 631. https://doi.org/10.3390/universe8120631
Note that from the first issue of 2016, this journal uses article numbers instead of page numbers. See further details here.