
Metabolically Active Zones Involving Fatty Acid Elongation Delineated by DESI-MSI Correlate with Pathological and Prognostic Features of Colorectal Cancer

 , , and
Abstract
:1. Introduction
2. Materials and Methods
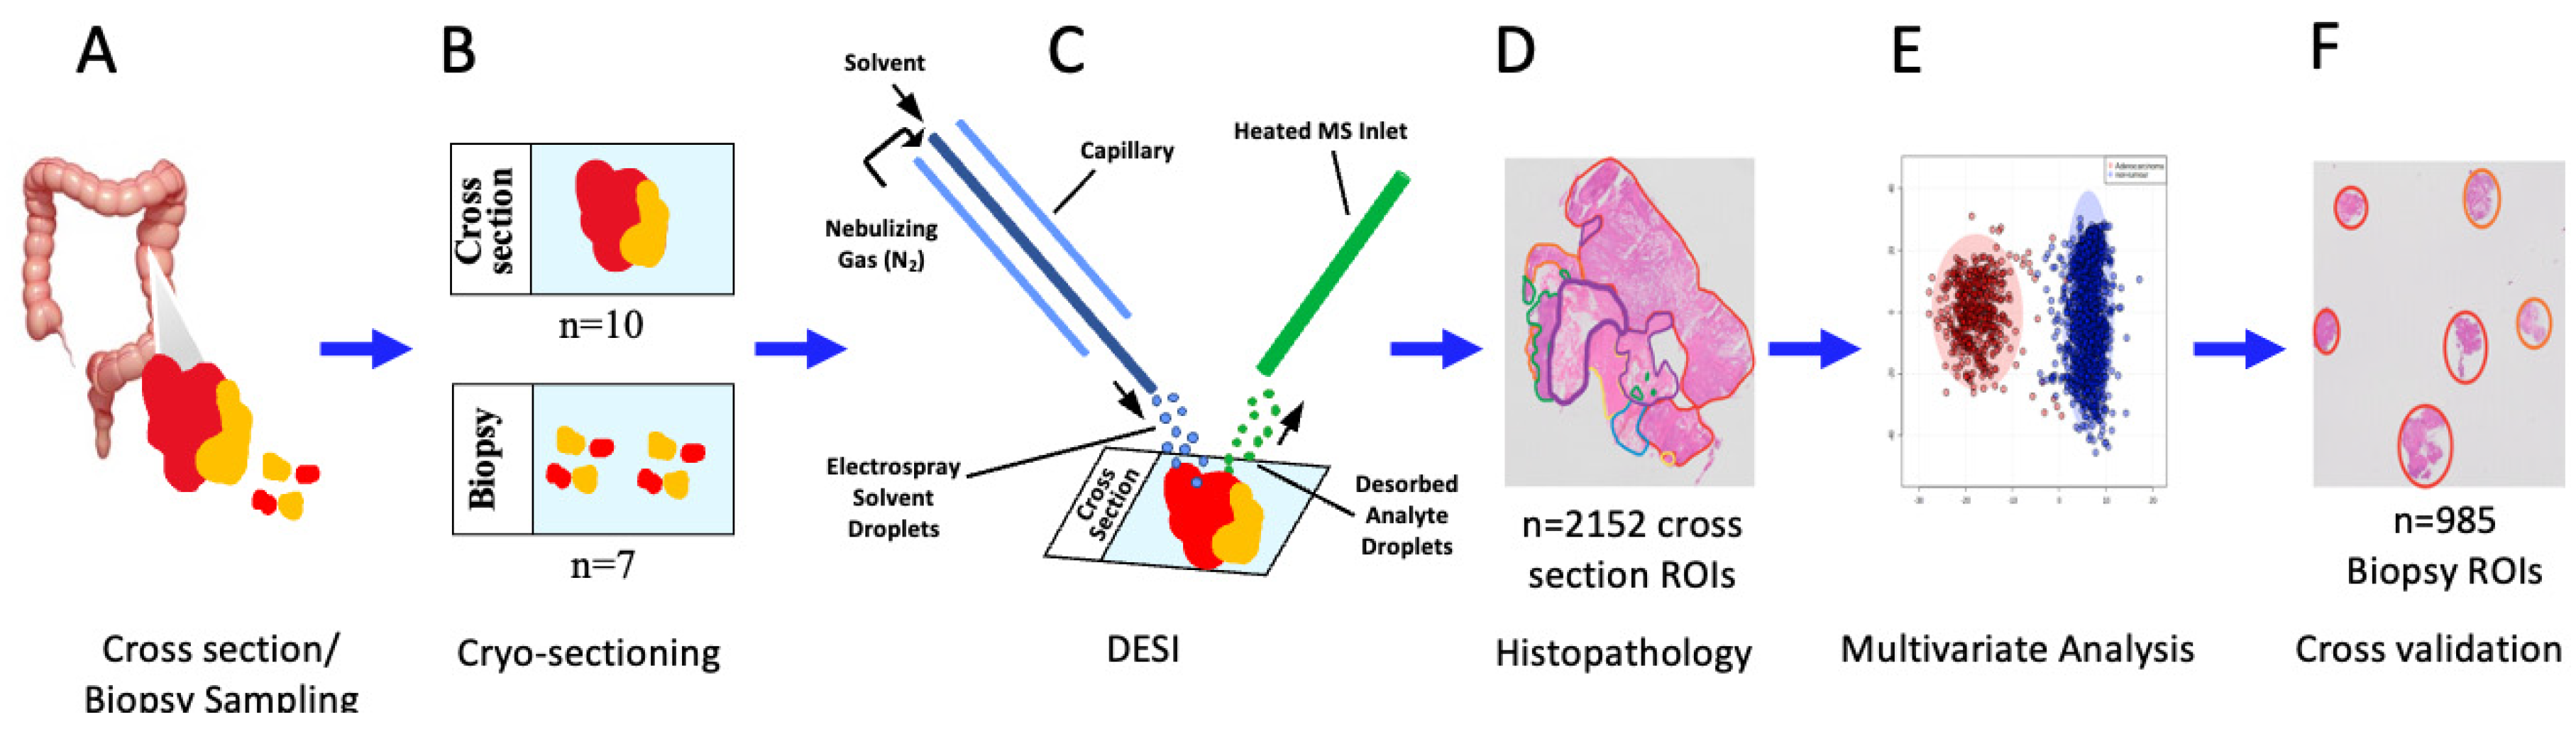
2.1. Clinical Samples
2.2. DESI Mass Spectrometry Imaging Analysis
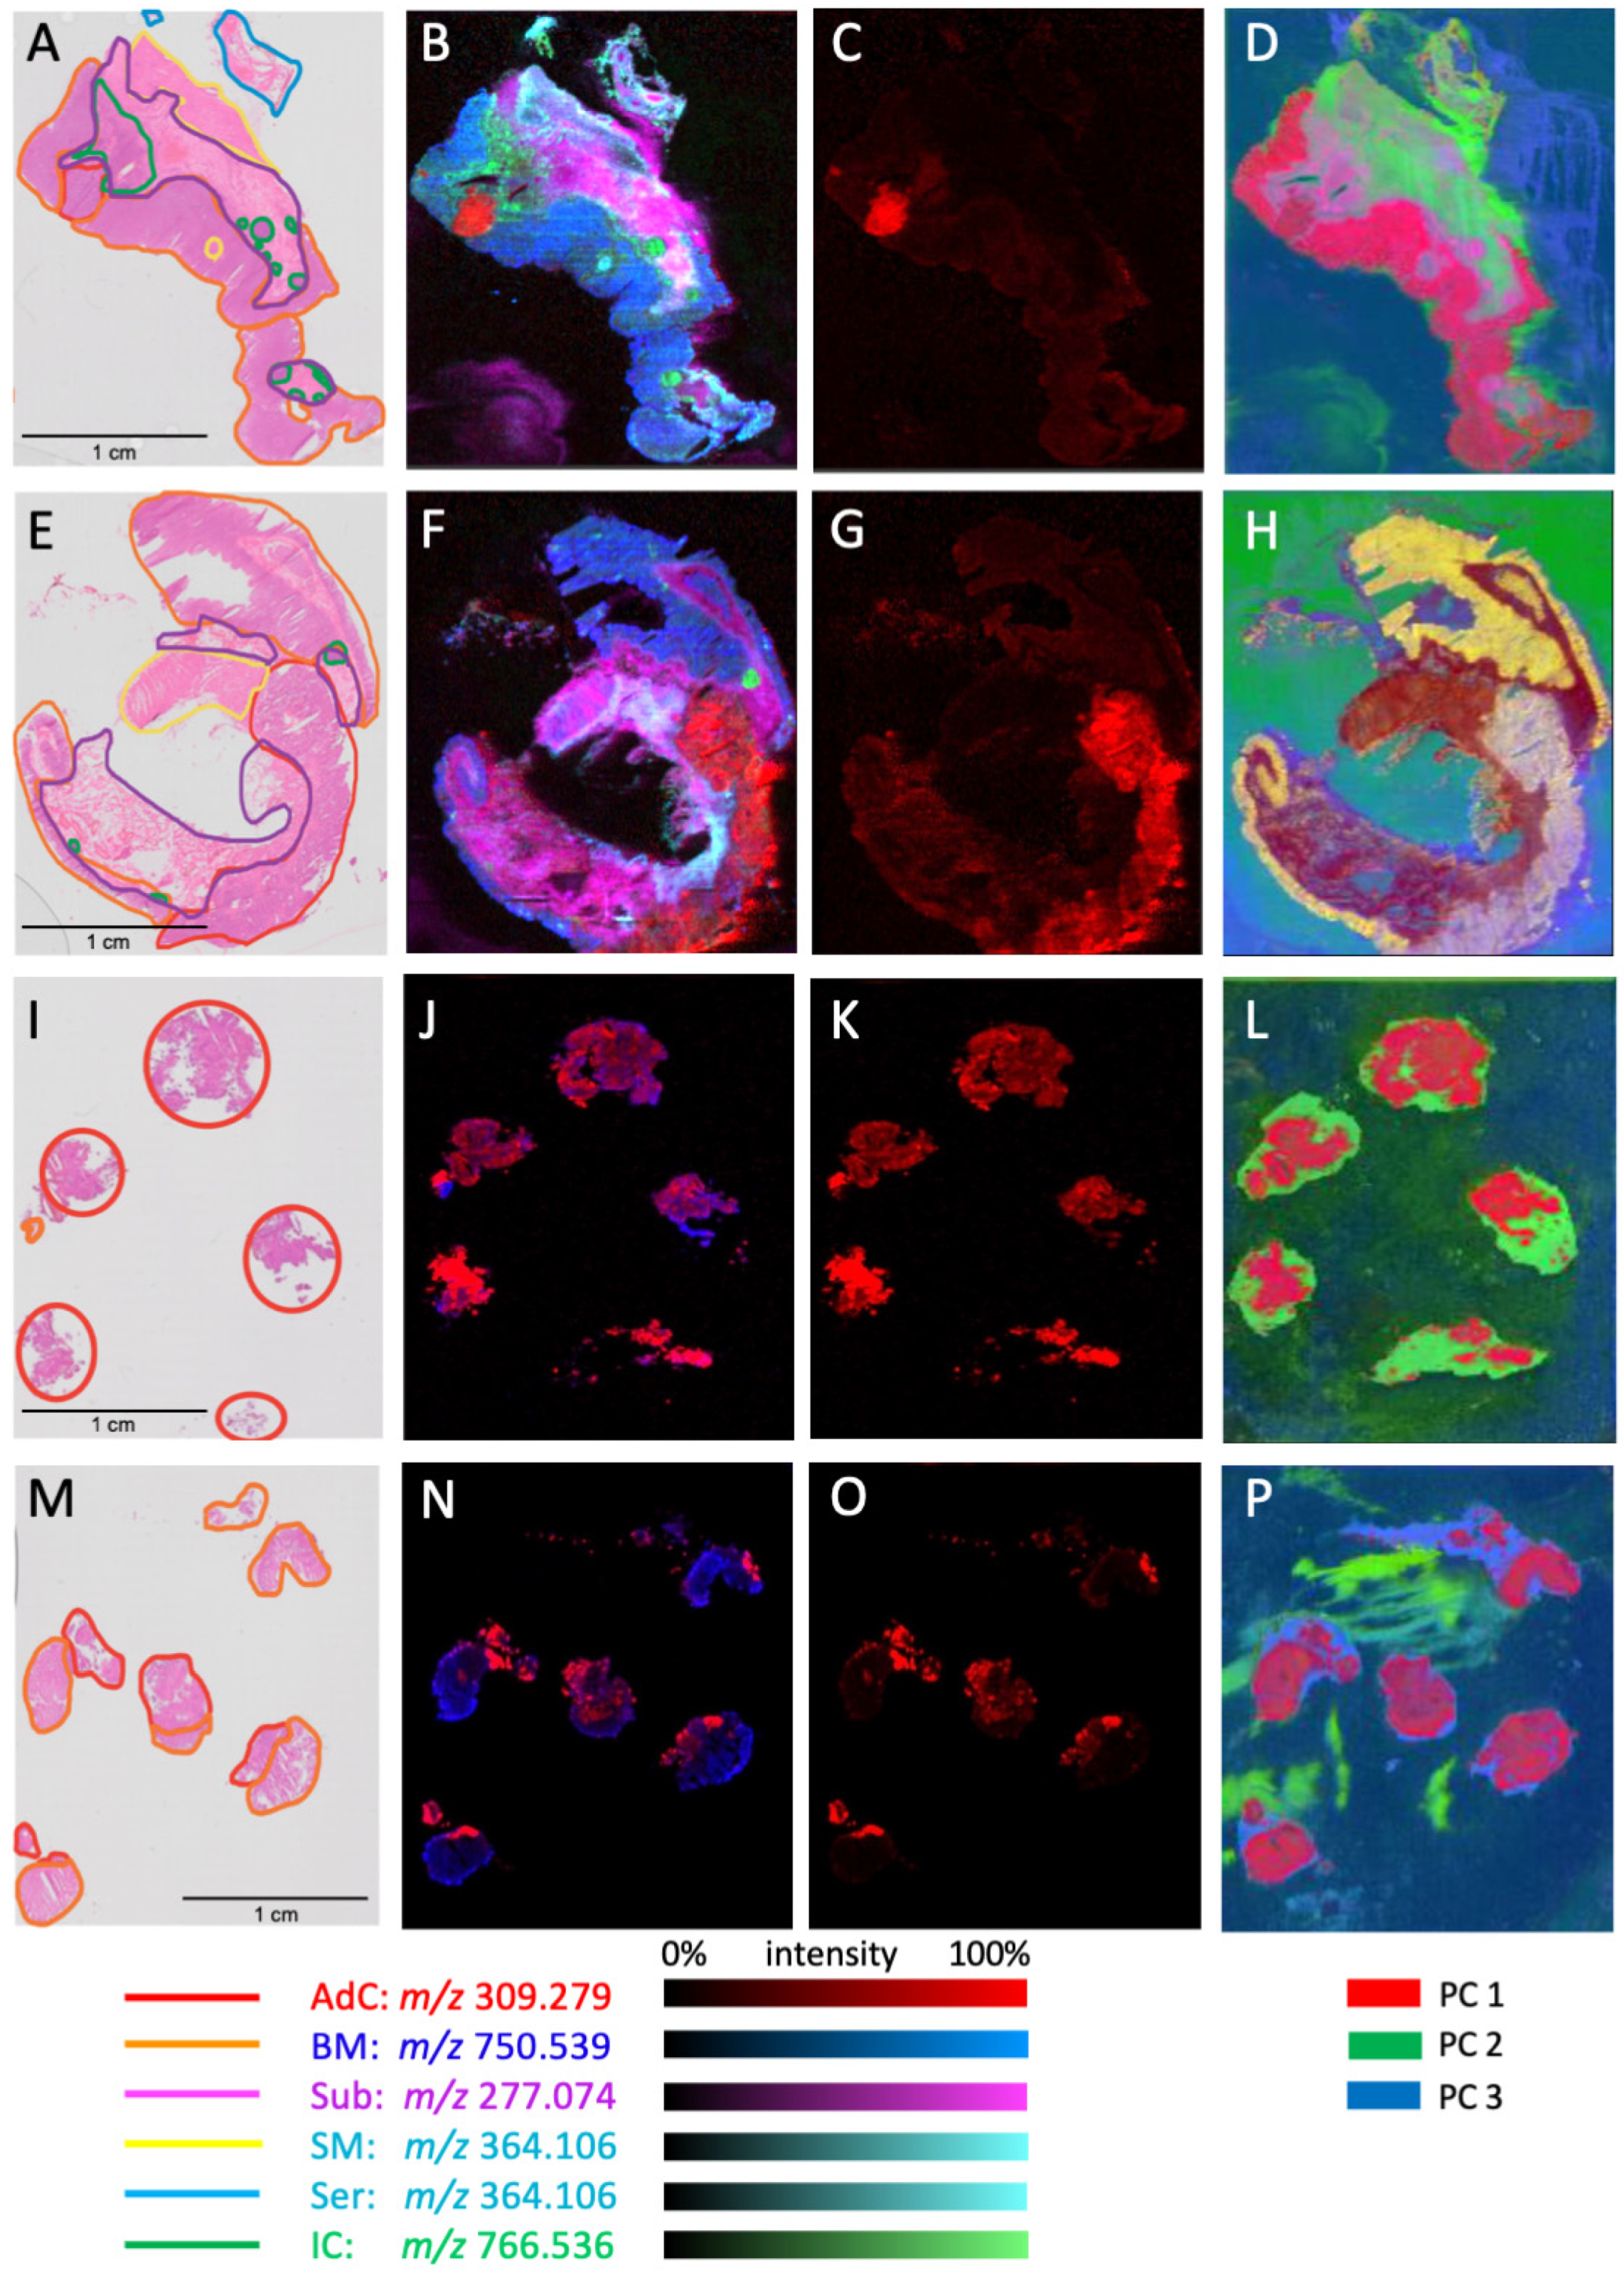
2.3. Pathology Analysis and Slide Annotation
2.4. Region of Interest Selection and Peak Alignment
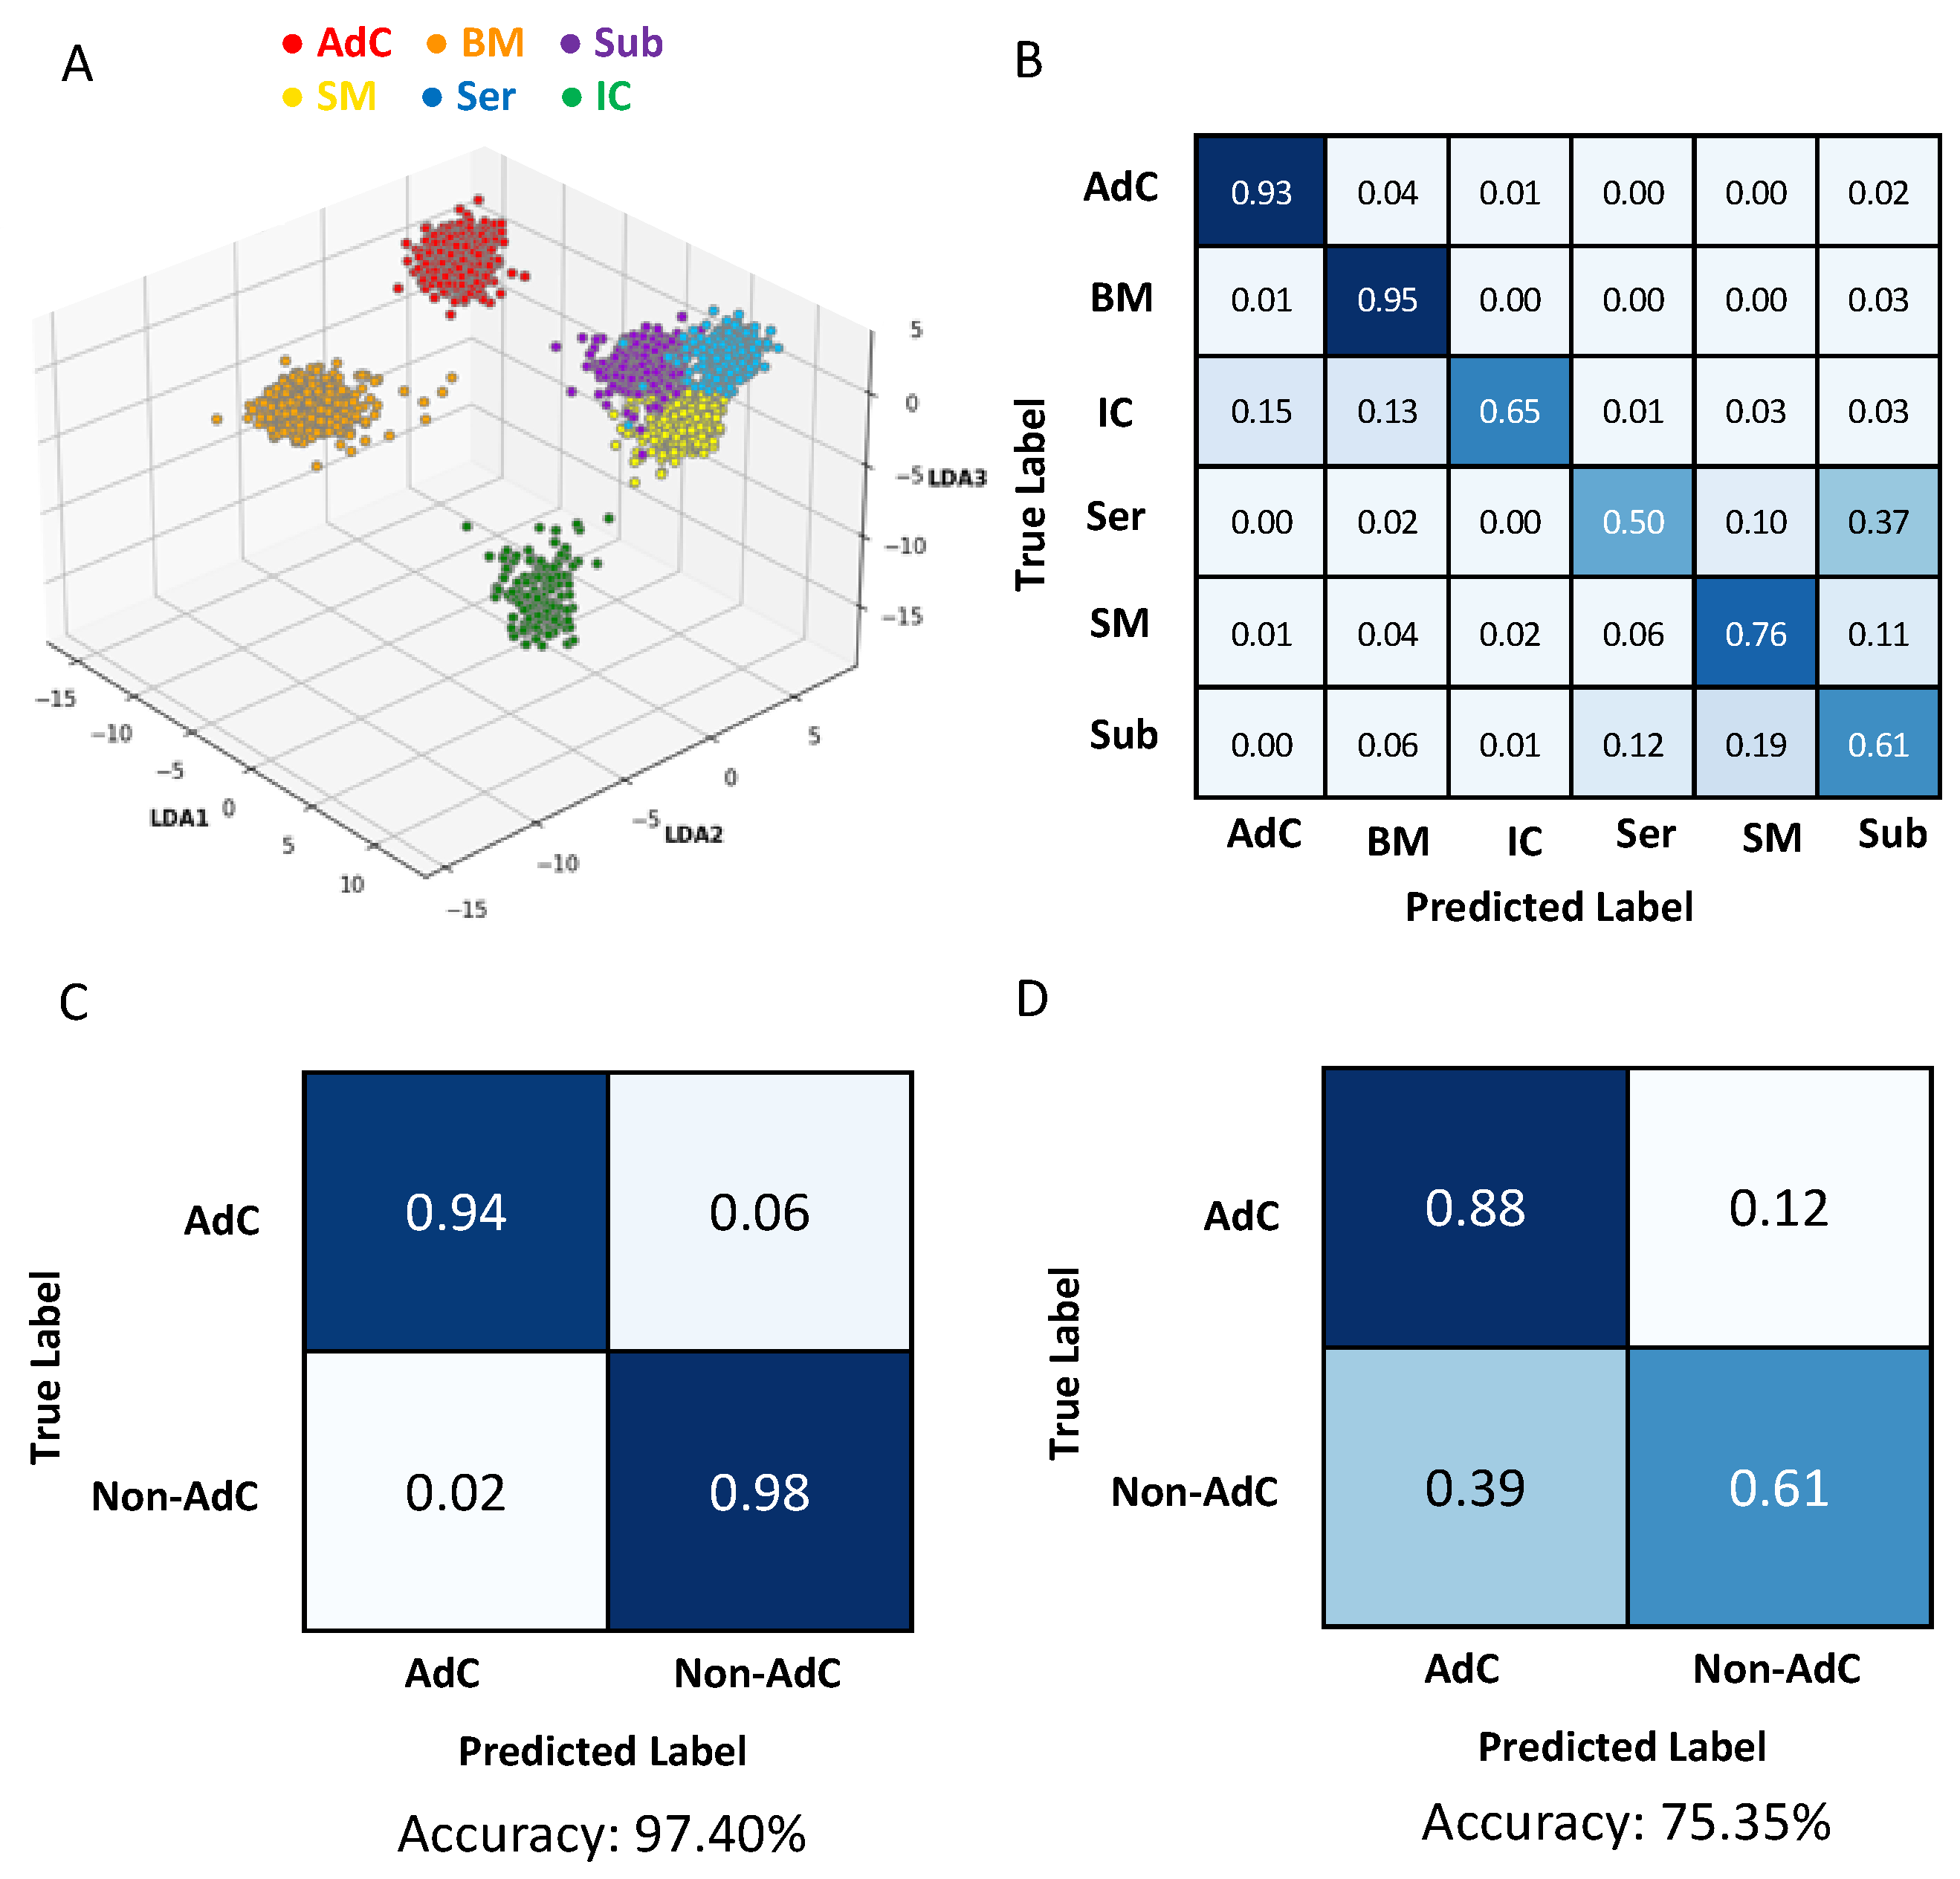
2.5. Multivariate Modeling
2.6. Univariate Modeling
2.7. Statistical Analysis
3. Results
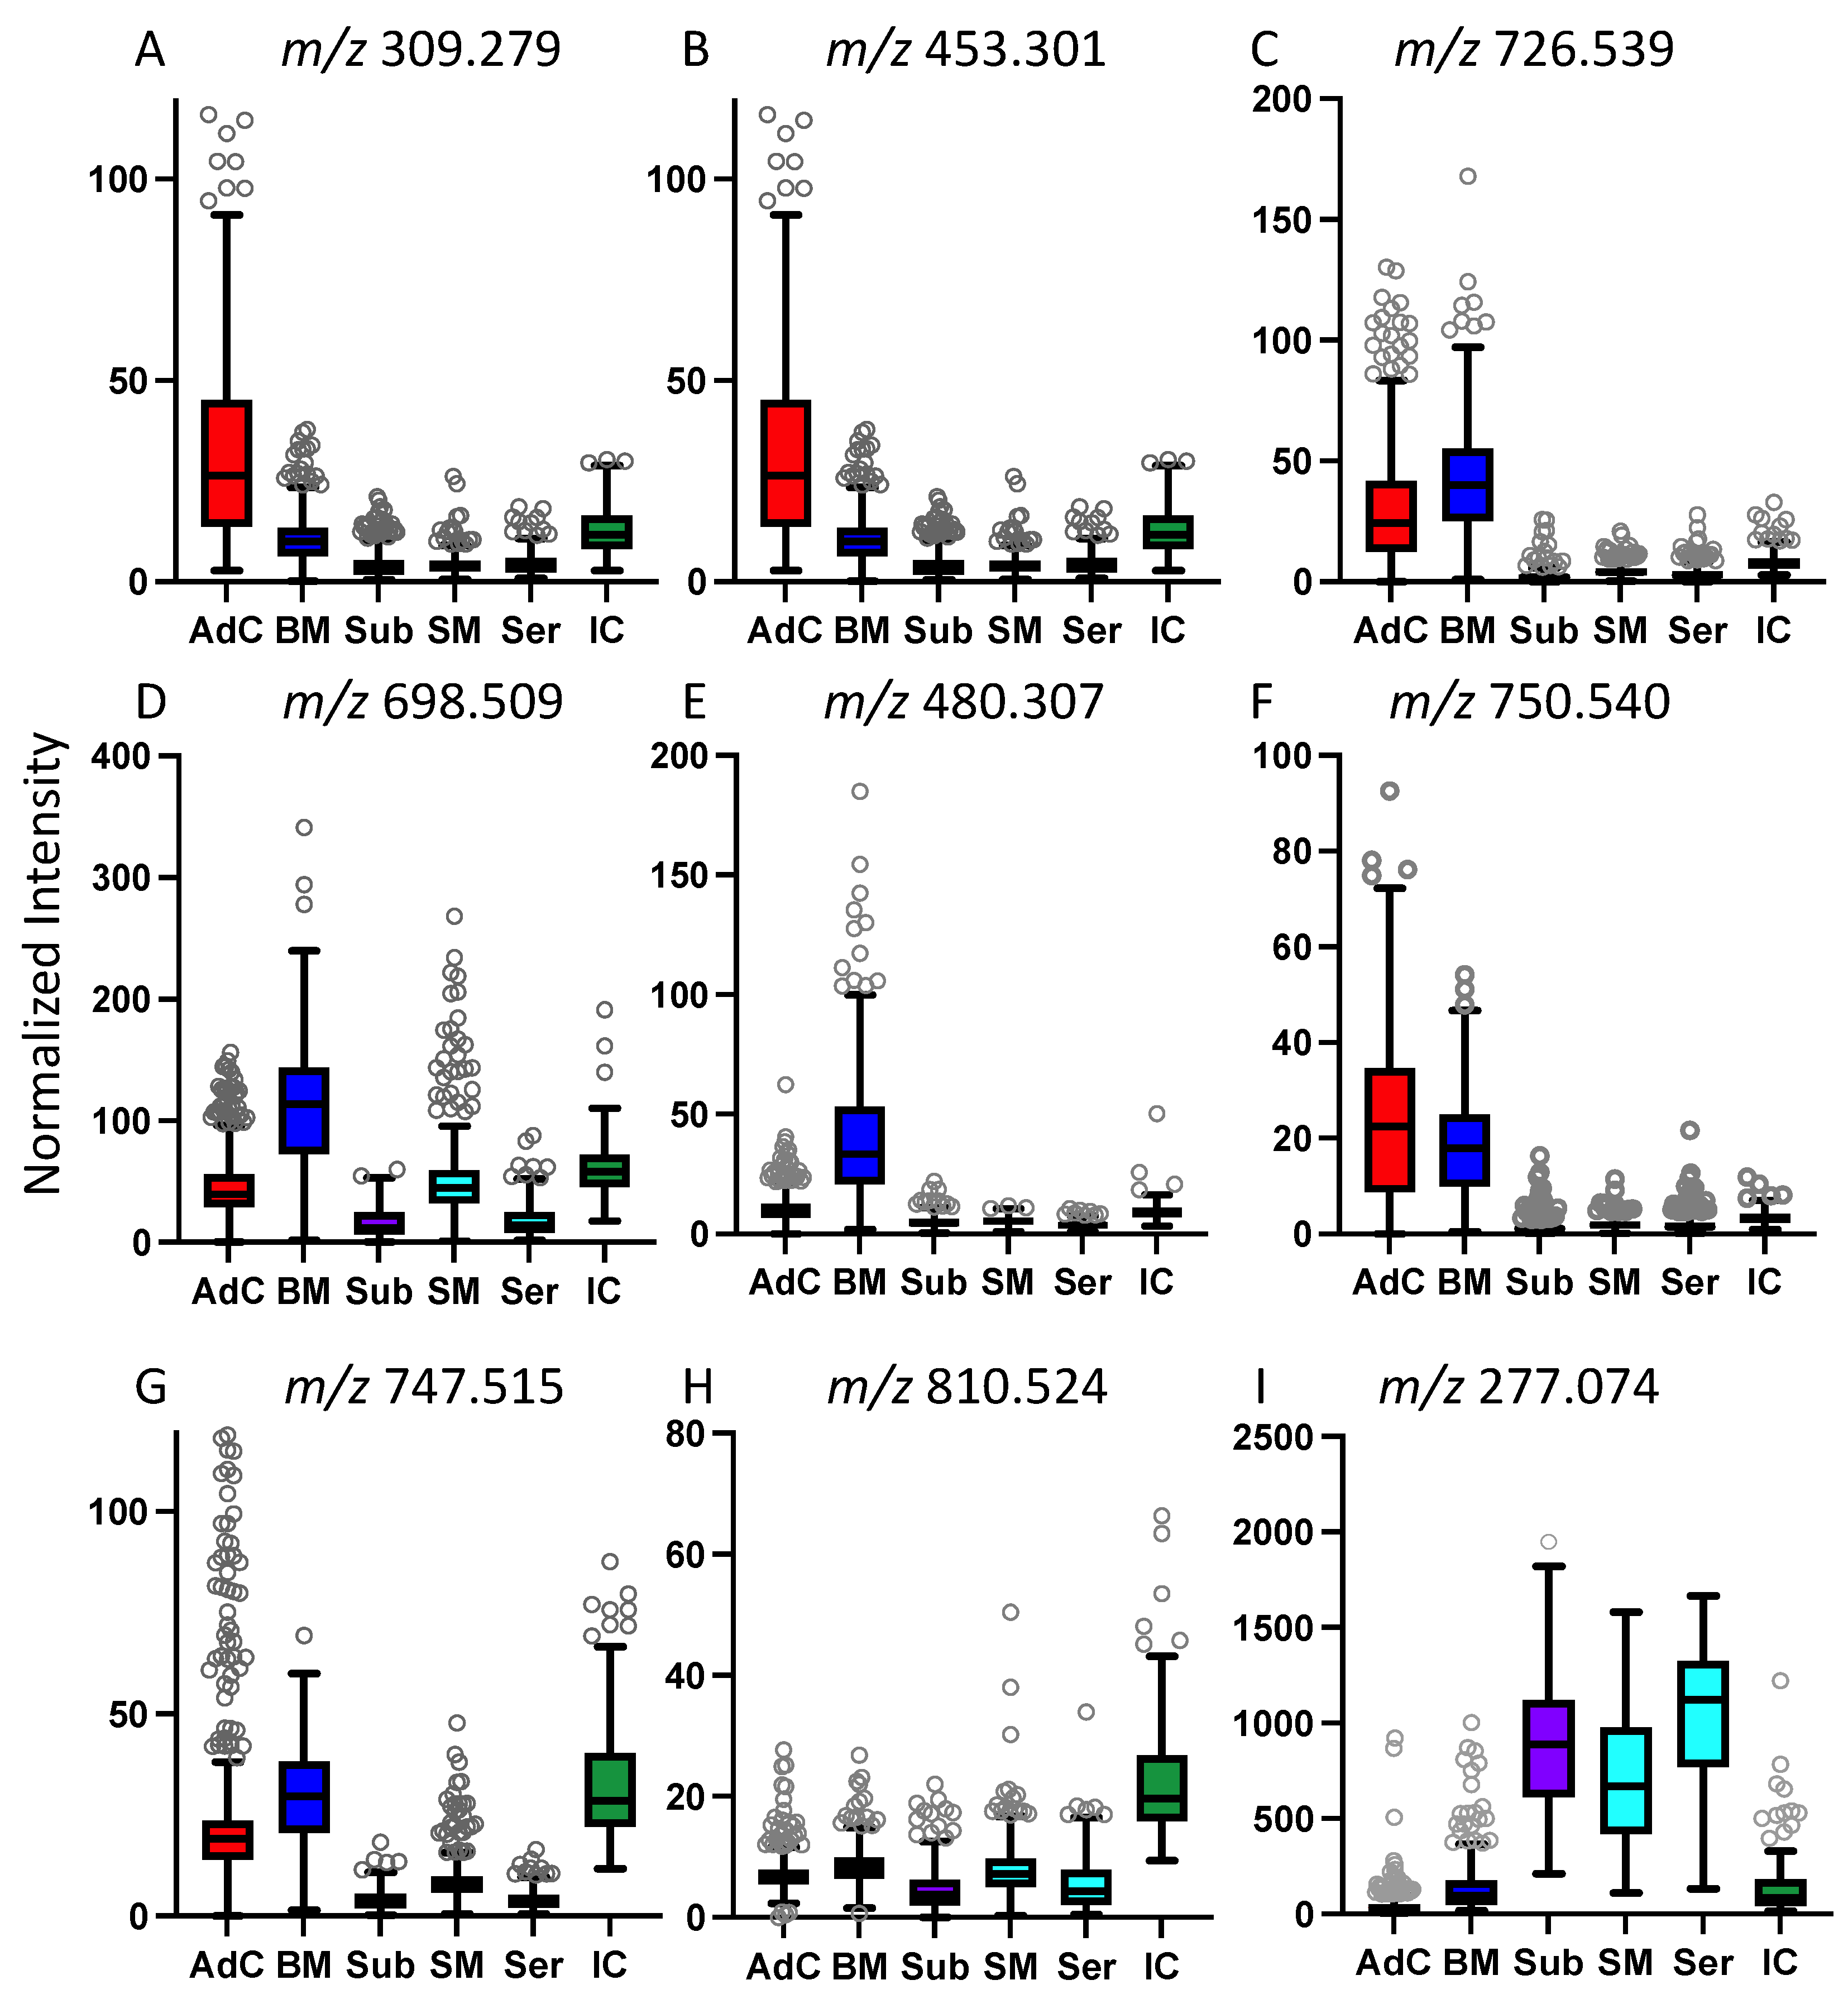
3.1. Characterization of Small Molecule Profiles across Colorectal Tissue Subregions
3.2. Patient-Based Stratification of Spectra from Regions of Colorectal Adenocarcinoma
4. Discussion
Supplementary Materials
Author Contributions
Funding
Institutional Review Board Statement
Informed Consent Statement
Data Availability Statement
Acknowledgments
Conflicts of Interest
References
- Brenner, D.R.; Poirier, A.; Woods, R.R.; Ellison, L.F.; Billette, J.-M.; Demers, A.A.; Zhang, S.X.; Yao, C.; Finley, C.; Fitzgerald, N.; et al. Projected estimates of cancer in Canada in 2022. Can. Med. Assoc. J. 2022, 194, E601–E607. [Google Scholar] [CrossRef] [PubMed]
- Sung, H.; Ferlay, J.; Siegel, R.L.; Laversanne, M.; Soerjomataram, I.; Jemal, A.; Bray, F. Global Cancer Statistics 2020: GLOBOCAN Estimates of Incidence and Mortality Worldwide for 36 Cancers in 185 Countries. CA Cancer J. Clin. 2021, 71, 209–249. [Google Scholar] [CrossRef] [PubMed]
- Yang, J.; Wei, H.; Zhou, Y.; Szeto, C.-H.; Li, C.; Lin, Y.; Coker, O.O.; Lau, H.C.H.; Chan, A.W.H.; Sung, J.J.Y.; et al. High-Fat Diet Promotes Colorectal Tumorigenesis Through Modulating Gut Microbiota and Metabolites. Gastroenterology 2022, 162, 135–149.e2. [Google Scholar] [CrossRef] [PubMed]
- Rawla, P.; Sunkara, T.; Barsouk, A. Epidemiology of colorectal cancer: Incidence, mortality, survival, and risk factors. Prz. Gastroenterol. 2019, 14, 89–103. [Google Scholar] [CrossRef]
- Siegel, R.L.; Miller, K.D.; Goding Sauer, A.; Fedewa, S.A.; Butterly, L.F.; Anderson, J.C.; Cercek, A.; Smith, R.A.; Jemal, A. Colorectal cancer statistics, 2020. CA Cancer J. Clin. 2020, 70, 145–164. [Google Scholar] [CrossRef] [Green Version]
- Fleming, M.; Ravula, S.; Tatishchev, S.F.; Wang, H.L. Colorectal carcinoma: Pathologic aspects. J. Gastrointest. Oncol. 2012, 3, 153–173. [Google Scholar] [CrossRef]
- Dayal, S.; Battersby, N.; Cecil, T. Evolution of Surgical Treatment for Rectal Cancer: A Review. J. Gastrointest. Surg. 2017, 21, 1166–1173. [Google Scholar] [CrossRef]
- Ali, F.; Keshinro, A.; Wesiser, M.R. Advances in the treatment of locally advanced rectal cancer. Ann. Gastroenterol. Surg. 2021, 5, 32–38. [Google Scholar] [CrossRef]
- Rospo, G.; Corti, G.; Crisafulli, G.; Novara, L.; Bardelli, A. Tracking colorectal cancer evolution in time and space. Ann. Oncol. 2017, 28, 1163–1165. [Google Scholar] [CrossRef]
- Guinney, J.; Dienstmann, R.; Wang, X.; De Reyniès, A.; Schlicker, A.; Soneson, C.; Marisa, L.; Roepman, P.; Nyamundanda, G.; Angelino, P.; et al. The consensus molecular subtypes of colorectal cancer. Nat. Med. 2015, 21, 1350–1356. [Google Scholar] [CrossRef]
- Hu, F.; Wang, J.; Zhang, M.; Wang, S.; Zhao, L.; Yang, H.; Wu, J.; Cui, B. Comprehensive Analysis of Subtype-Specific Molecular Characteristics of Colon Cancer: Specific Genes, Driver Genes, Signaling Pathways, and Immunotherapy Responses. Front. Cell Dev. Biol. 2021, 9, 758776. [Google Scholar] [CrossRef]
- Murphy, N.; Newton, C.C.; Song, M.; Papadimitriou, N.; Hoffmeister, M.; Phipps, A.I.; Harrison, T.A.; Newcomb, P.A.; Aglago, E.K.; Berndt, S.I.; et al. Body mass index and molecular subtypes of colorectal cancer. J. Natl. Cancer Inst. 2023, 115, 165–173. [Google Scholar] [CrossRef]
- Lipinski, K.A.; Barber, L.J.; Davies, M.N.; Ashenden, M.; Sottoriva, A.; Gerlinger, M. Cancer Evolution and the Limits of Predictability in Precision Cancer Medicine. Trends Cancer 2016, 2, 49–63. [Google Scholar] [CrossRef] [Green Version]
- Liu, T.; Peng, F.; Yu, J.; Tan, Z.; Rao, T.; Chen, Y.; Wang, Y.; Liu, Z.; Zhou, H.; Peng, J. LC-MS-based lipid profile in colorectal cancer patients: TAGs are the main disturbed lipid markers of colorectal cancer progression. Anal. Bioanal. Chem. 2019, 411, 5079–5088. [Google Scholar] [CrossRef]
- Shen, Y.; Sun, M.; Zhu, J.; Wei, M.; Li, H.; Zhao, P.; Wang, J.; Li, R.; Tian, L.; Tao, Y.; et al. Tissue metabolic profiling reveals major metabolic alteration in colorectal cancer. Mol. Omics 2021, 17, 464–471. [Google Scholar] [CrossRef]
- Chen, F.; Dai, X.; Zhou, C.-C.; Li, K.-X.; Zhang, Y.-J.; Lou, X.-Y.; Zhu, Y.-M.; Sun, Y.-L.; Peng, B.-X.; Cui, W. Integrated analysis of the faecal metagenome and serum metabolome reveals the role of gut microbiome-associated metabolites in the detection of colorectal cancer and adenoma. Gut 2021, 71, 1315–1325. [Google Scholar] [CrossRef]
- Soudah, T.; Zoabi, A.; Margulis, K. Desorption electrospray ionization mass spectrometry imaging in discovery and development of novel therapies. Mass Spectrom. Rev. 2023, 42, 751–778. [Google Scholar] [CrossRef]
- Takáts, Z.; Wiseman, J.M.; Cooks, R.G. Ambient mass spectrometry using desorption electrospray ionization (DESI): Instrumentation, mechanisms and applications in forensics, chemistry, and biology. J. Mass Spectrom. 2005, 40, 1261–1275. [Google Scholar] [CrossRef]
- Inglese, P.; Correia, G.; Pruski, P.; Glen, R.C.; Takats, Z. Colocalization Features for Classification of Tumors Using Desorption Electrospray Ionization Mass Spectrometry Imaging. Anal. Chem. 2019, 91, 6530–6540. [Google Scholar] [CrossRef] [Green Version]
- Sans, M.; Gharpure, K.; Tibshirani, R.; Zhang, J.; Liang, L.; Liu, J.; Young, J.H.; Dood, R.L.; Sood, A.K.; Eberlin, L.S. Metabolic Markers and Statistical Prediction of Serous Ovarian Cancer Aggressiveness by Ambient Ionization Mass Spectrometry Imaging. Cancer Res. 2017, 77, 2903–2913. [Google Scholar] [CrossRef] [Green Version]
- Mason, S.E.M.; Manoli, E.B.; Alexander, J.L.; Poynter, L.M.; Ford, L.; Paizs, P.B.; Adebesin, A.B.; McKenzie, J.S.; Rosini, F.; Goldin, R.; et al. Lipidomic Profiling of Colorectal Lesions for Real-Time Tissue Recognition and Risk-Stratification Using Rapid Evaporative Ionization Mass Spectrometry. Ann. Surg. 2023, 277, e569–e577. [Google Scholar] [CrossRef] [PubMed]
- Gerbig, S.; Golf, O.; Balog, J.; Denes, J.; Baranyai, Z.; Zarand, A.; Raso, E.; Timar, J.; Takats, Z. Analysis of colorectal adenocarcinoma tissue by desorption electrospray ionization mass spectrometric imaging. Anal. Bioanal. Chem. 2012, 403, 2315–2325. [Google Scholar] [CrossRef] [PubMed]
- Hofmanová, J.; Slavík, J.; Ciganek, M.; Ovesná, P.; Tylichová, Z.; Karasová, M.; Zapletal, O.; Straková, N.; Procházková, J.; Bouchal, J.; et al. Complex Alterations of Fatty Acid Metabolism and Phospholipidome Uncovered in Isolated Colon Cancer Epithelial Cells. Int. J. Mol. Sci. 2021, 22, 6650. [Google Scholar] [CrossRef] [PubMed]
- Mroz, A.; Doria, L.; Claude, E.; Takats, Z. Metabolic Phenotyping of Colorectal Tissue Samples by DESI-MSI for Clinical Research. Waters Corporation Application Note 2018. Patent No. 720005950. Available online: https://www.waters.com/nextgen/en/library/application-notes/2018/metabolic-phenotyping-of-colorectal-tissue-samples-by-desi-msi-for-clinical-research.html (accessed on 25 February 2023).
- Morse, N.; Jamaspishvili, T.; Simon, D.; Patel, P.G.; Ren, K.Y.M.; Wang, J.; Oleschuk, R.; Kaufmann, M.; Gooding, R.J.; Berman, D.M. Reliable identification of prostate cancer using mass spectrometry metabolomic imaging in needle core biopsies. Lab. Investig. 2019, 99, 1561–1571. [Google Scholar] [CrossRef]
- Kamphorst, J.J.; Cross, J.R.; Fan, J.; de Stanchina, E.; Mathew, R.; White, E.P.; Thompson, C.B.; Rabinowitz, J.D. Hypoxic and Ras-transformed cells support growth by scavenging unsaturated fatty acids from lysophospholipids. Proc. Natl. Acad. Sci. USA 2013, 110, 8882–8887. [Google Scholar] [CrossRef] [Green Version]
- Makide, K.; Kitamura, H.; Sato, Y.; Okutani, M.; Aoki, J. Emerging lysophospholipid mediators, lysophosphatidylserine, lysophosphatidylthreonine, lysophosphatidylethanolamine and lysophosphatidylglycerol. Prostaglandins Other Lipid Mediat. 2009, 89, 135–139. [Google Scholar] [CrossRef]
- Hoxha, M.; Zappacosta, B. A review on the role of fatty acids in colorectal cancer progression. Front. Pharmacol. 2022, 13, 1032806. [Google Scholar] [CrossRef]
- Koundouros, N.; Poulogiannis, G. Reprogramming of fatty acid metabolism in cancer. Br. J. Cancer 2020, 122, 4–22. [Google Scholar] [CrossRef] [Green Version]
- Kihara, A. Very long-chain fatty acids: Elongation, physiology and related disorders. J. Biochem. 2012, 152, 387–395. [Google Scholar] [CrossRef]
- Keshk, W.A.; Zineldeen, D.H.; Wasfy, R.E.; El-Khadrawy, O.H. Fatty acid synthase/oxidized low-density lipoprotein as metabolic oncogenes linking obesity to colon cancer via NF-kappa B in Egyptians. Med. Oncol. 2014, 31, 192. [Google Scholar] [CrossRef]
- Ogino, S.; Nosho, K.; Meyerhardt, J.A.; Kirkner, G.J.; Chan, A.T.; Kawasaki, T.; Giovannucci, E.L.; Loda, M.; Fuchs, C.S. Cohort study of fatty acid synthase expression and patient survival in colon cancer. J. Clin. Oncol. 2008, 26, 5713–5720. [Google Scholar] [CrossRef]
- Mika, A.; Kobiela, J.; Czumaj, A.; Chmielewski, M.; Stepnowski, P.; Sledzinski, T. Hyper-Elongation in Colorectal Cancer Tissue —Cerotic Acid is a Potential Novel Serum Metabolic Marker of Colorectal Malignancies. Cell. Physiol. Biochem. 2017, 41, 722–730. [Google Scholar] [CrossRef]
- Li, J.; Ding, S.-F.; Habib, N.A.; Fermor, B.F.; Wood, C.B.; Gilmour, R.S. Partial characterization of a cDNA for human stearoyl-CoA desaturase and changes in its mRNA expression in some normal and malignant tissues. Int. J. Cancer 1994, 57, 348–352. [Google Scholar] [CrossRef]
- Hanahan, D.; Weinberg, R.A. Hallmarks of cancer: The next generation. Cell 2011, 144, 646–674. [Google Scholar] [CrossRef] [Green Version]
- Dayde, D.; Tanaka, I.; Jain, R.; Tai, M.C.; Taguchi, A. Predictive and Prognostic Molecular Biomarkers for Response to Neoadjuvant Chemoradiation in Rectal Cancer. Int. J. Mol. Sci. 2017, 18, 573. [Google Scholar] [CrossRef]
- Huang, Y.; Lee, D.; Young, C. Predictors for complete pathological response for stage II and III rectal cancer following neoadjuvant therapy—A systematic review and meta-analysis. Am. J. Surg. 2020, 220, 300–308. [Google Scholar] [CrossRef]
- Cai, Y.; Rattray, N.J.W.; Zhang, Q.; Mironova, V.; Santos-Neto, A.; Hsu, K.-S.; Rattray, Z.; Cross, J.R.; Zhang, Y.; Paty, P.B.; et al. Sex Differences in Colon Cancer Metabolism Reveal A Novel Subphenotype. Sci. Rep. 2020, 10, 4905. [Google Scholar] [CrossRef] [Green Version]
- Hiraide, T.; Ikegami, K.; Sakaguchi, T.; Morita, Y.; Hayasaka, T.; Masaki, N.; Waki, M.; Sugiyama, E.; Shinriki, S.; Takeda, M.; et al. Accumulation of arachidonic acid-containing phosphatidylinositol at the outer edge of colorectal cancer. Sci. Rep. 2016, 6, 29935. [Google Scholar] [CrossRef] [Green Version]
- Alexander, J.; Gildea, L.; Balog, J.; Speller, A.; McKenzie, J.; Muirhead, L.; Scott, A.; Kontovounisios, C.; Rasheed, S.; Teare, J.; et al. A novel methodology for in vivo endoscopic phenotyping of colorectal cancer based on real-time analysis of the mucosal lipidome: A prospective observational study of the iKnife. Surg. Endosc. 2017, 31, 1361–1370. [Google Scholar] [CrossRef] [Green Version]
- King, M.E.; Zhang, J.; Lin, J.Q.; Garza, K.Y.; DeHoog, R.J.; Feider, C.L.; Bensussan, A.; Sans, M.; Krieger, A.; Badal, S.; et al. Rapid diagnosis and tumor margin assessment during pancreatic cancer surgery with the MasSpec Pen technology. Proc. Natl. Acad. Sci. USA 2021, 118, e2104411118. [Google Scholar] [CrossRef]


| Study ID | Sex | Age | Procedure | T. Site | T. Type | Grade | Size | pT 1 | pN 1 | pM 1 | LVI 2 | MMR 3 |
|---|---|---|---|---|---|---|---|---|---|---|---|---|
| 1 | F | 67 | Right hemicolectomy | Cecum | Mucinous | G2 | 4.9 | 3 | 1a | N | N | Intact |
| 2 | F | 73 | Subtotal colectomy | Ascending | AdC 4 | G2 (G3 20%) | 9 | 3 | 0 | N | N | Deficient |
| 3 | M | 72 | Rectosigmoid resection | Sigmoid | AdC | G2 | 6 | 3 | 0 | N | Y | Intact |
| 4 | F | 92 | Right hemicolectomy | Cecum | AdC | G2 | 7 | 3 | 0 | N | N | Intact |
| 5 | M | 61 | Right hemicolectomy | Hepatic flexure | AdC | G2 | 2.5 | 3 | 1a | N | Y | Intact |
| 6 | M | 86 | Right hemicolectomy | Ascending | Mucinous | G2 | 9 | 3 | 0 | N | N | Intact |
| 7 | F | 66 | Low anterior resection | Rectum | AdC | G2 | 3.2 | 3 | 1a | N | Y | Intact |
| 8 | M | 65 | Right hemicolectomy | ICV 5 | AdC | G2 | 7 | 3 | 0 | N | Y | Intact |
| 9 | F | 62 | Right hemicolectomy | Ascending | AdC | G2 | 4 | 4a | 2b | 1c | Y | Intact |
| 10 | M | 73 | Sigmoid resection | Sigmoid | AdC | G2 | 6 | 3 | 0 | N | Y | Intact |
| m/z Bin | Measured m/z | Theoretical m/z | Delta (ppm) | Putative ID 1 | Elevated in 2 | Fold Change 3 | Classification Rate (%) |
|---|---|---|---|---|---|---|---|
| 309.279 | 309.2794 | 309.2799 | 1.6 | FA(20:1) Gondoic | AdC | 4.5 | 86 4 |
| 337.331 | 337.3109 | 337.3112 | 0.9 | FA(22:1) Euraic | AdC | 5.4 | 86 4 |
| 365.342 | 365.3419 | 365.3425 | 1.6 | FA(24:1) Nervonic | AdC | 6.6 | <85 4 |
| 393.373 | 393.3729 | 393.3736 | 2.3 | FA(26:1) Ximenic | AdC | 17.5 | 85 4 |
| 311.295 | 311.2948 | 311.2956 | 2.6 | FA(20:0) Arachidic | AdC | 3.3 | 86 4 |
| 339.326 | 339.3260 | 339.3269 | 2.7 | FA(22:0) Behenic | AdC | 2.6 | <85 4 |
| 367.357 | 367.3574 | 367.3582 | 2.2 | FA(24:0) Lignoceric | AdC | 3.9 | 87 4 |
| 395.388 | 395.3884 | 395.3895 | 2.8 | FA(26:0) Cerotic | AdC | 4.3 | 88 4 |
| 453.301 | 453.3014 | n/a | n/a | Unknown | AdC | 5.4 | 87 4/53 5 |
| 726.539 | 726.5402 | 726.5443 | 5.6 | PE | AdC/BM | 3.2 | n/a |
| 698.509 | 698.5094 | 698.5130 | 5.6 | PEp | AdC/BM | 3.7 | n/a |
| 480.307 | 480.3067 | 480.3096 | 6.0 | Lyso PE | BM | 5.5 | n/a |
| 750.540 | 750.5395 | 750.5443 | 6.4 | PEp | BM | 2.9 | 48 5 |
| 752.548 | 752.5477 | 752.5600 | 16.3 | PEp | n/a | n/a | 52 5 |
| 810.524 | 810.5245 | 810.5291 | 5.7 | PS | IC | 3.2 | n/a |
| 774.537 | 774.5371 | 774.5443 | 9.6 | PEp | n/a | n/a | 52 5 |
| m/z Bin | Measured m/z | Theoretical m/z | Delta (ppm) | Putative ID 1 | Elevated in 2 | Fold Change 3 | Classification Rate (%) 4 |
|---|---|---|---|---|---|---|---|
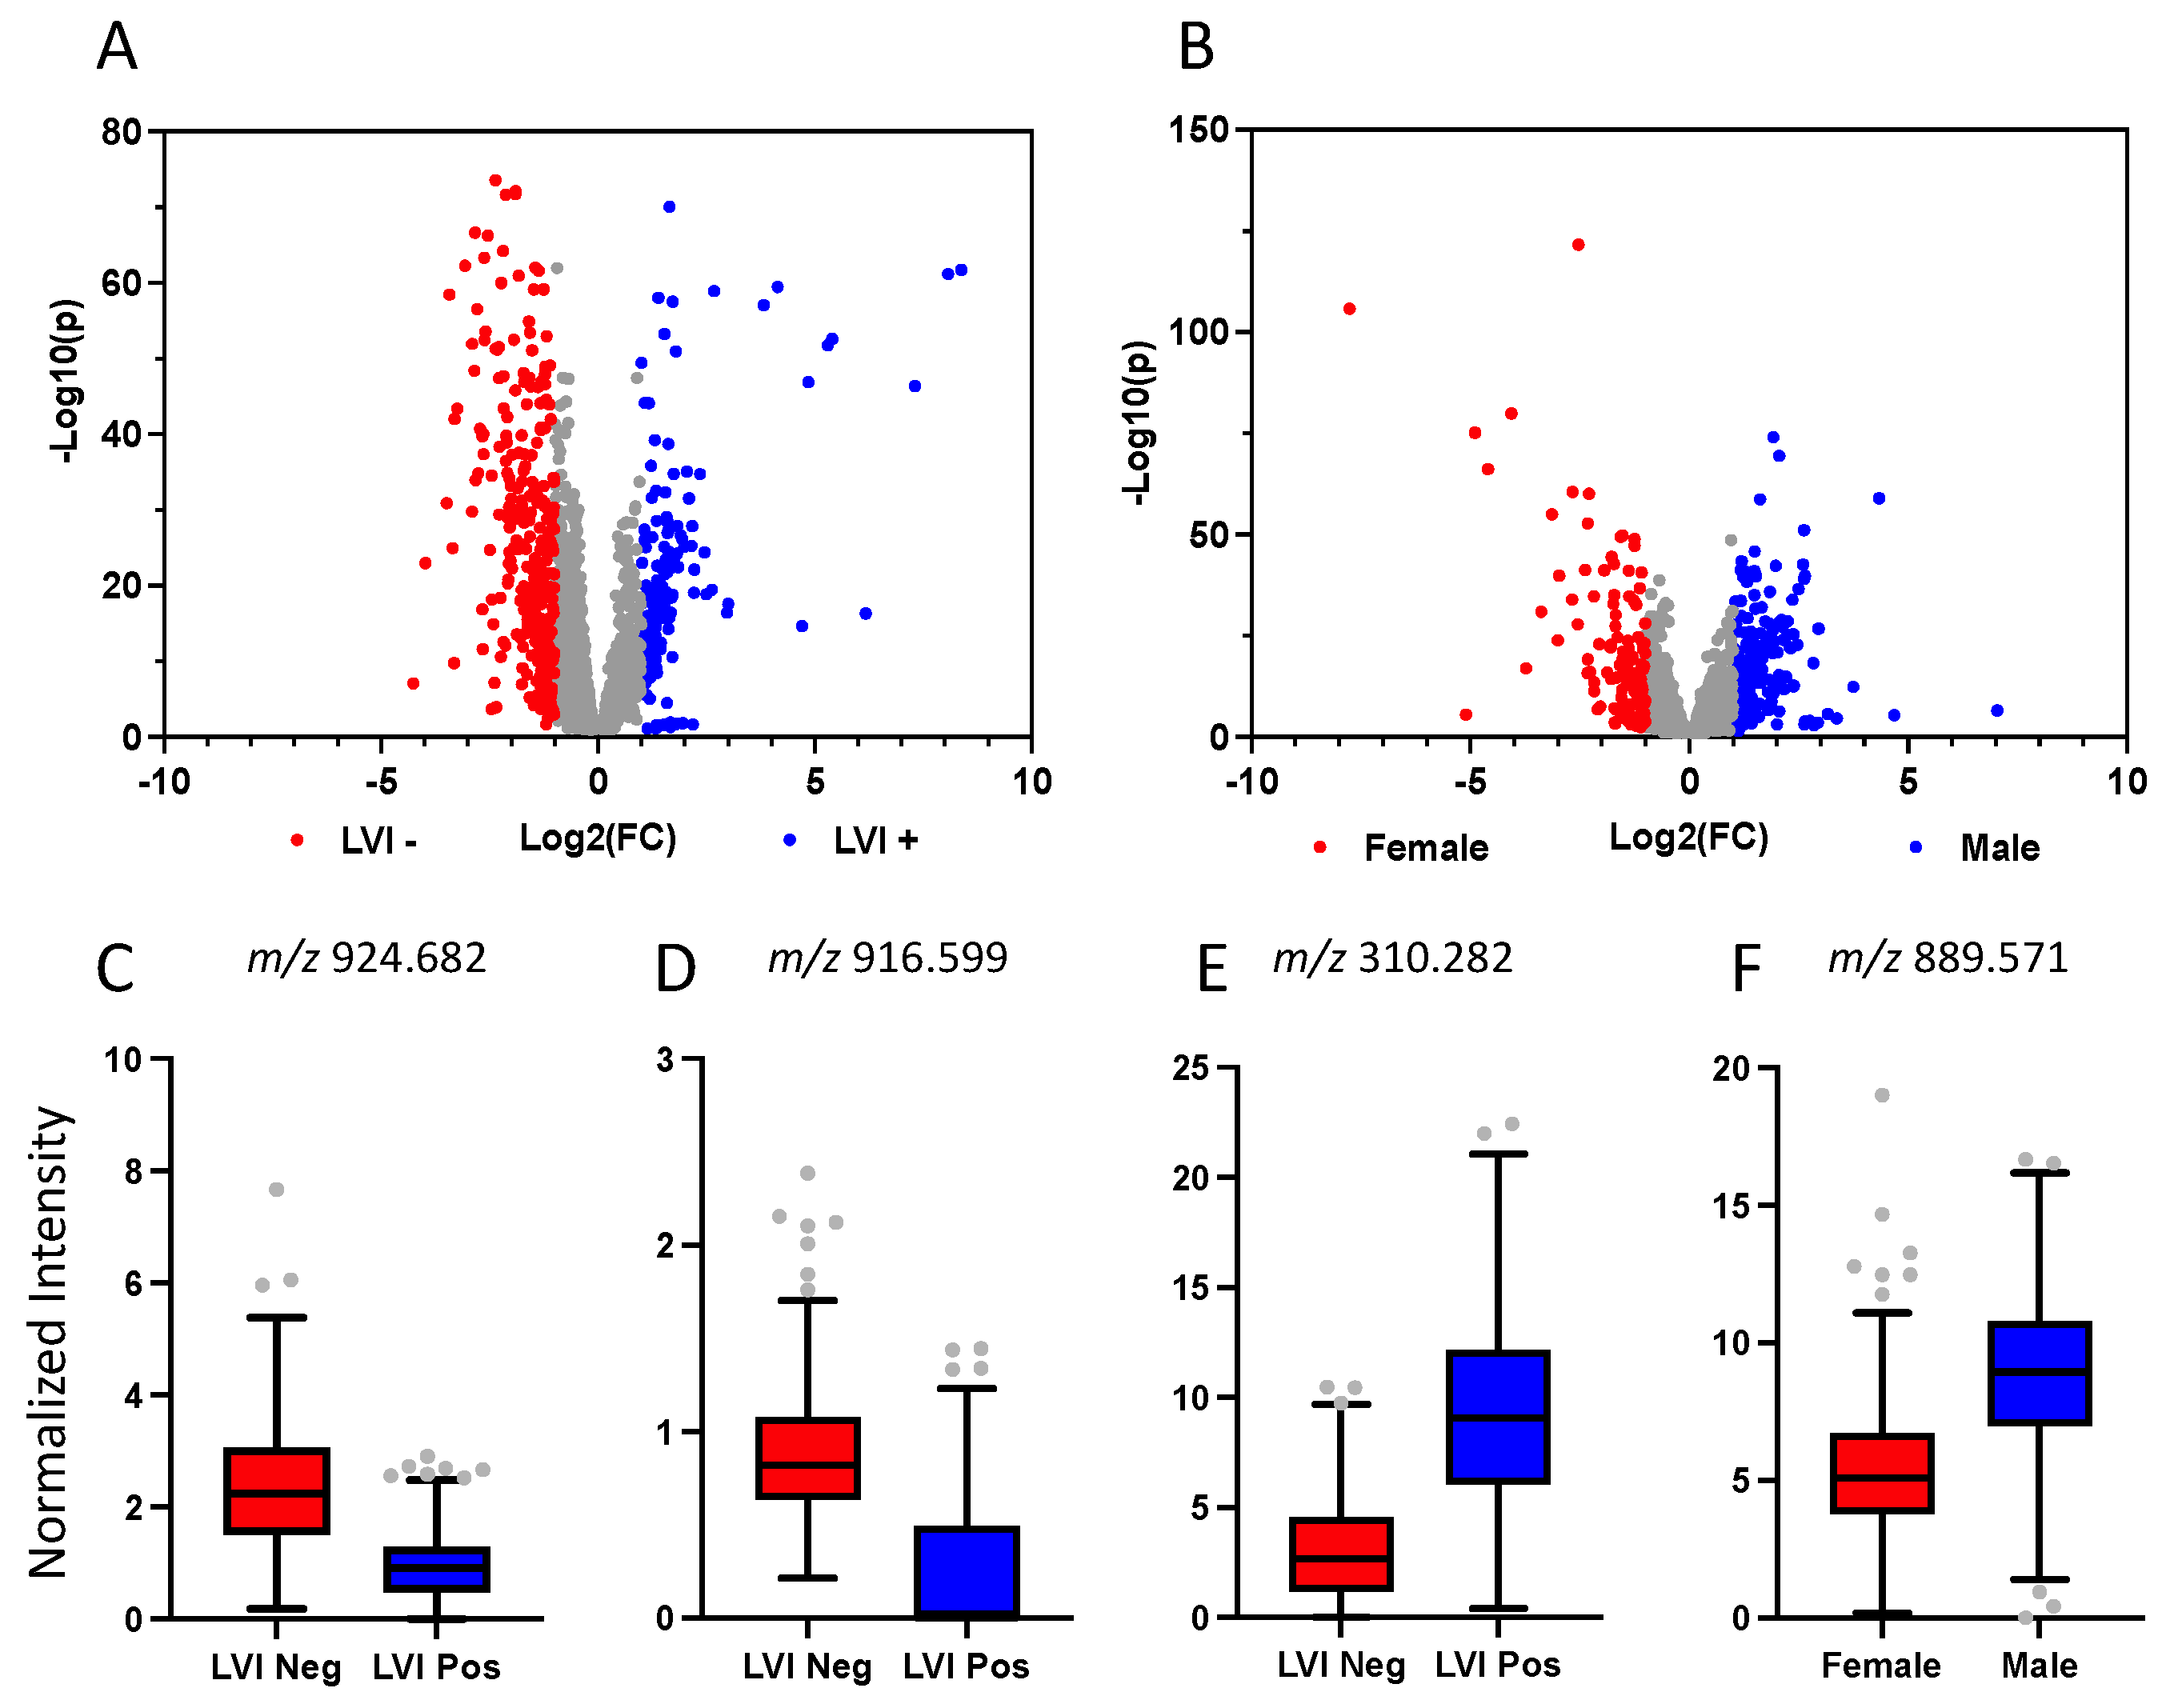
| 916.599 | 916.5958 | 916.5921 | 8 | Oxidized PS | LVI− | 3.7 | 74 |
| 310.282 | 310.2825 | 310.2752 | N/A | Gondoic acid 5 | LVI+ | 3.1 | 75 |
| 924.682 | 924.6822 | 924.6699 | 13 | Oxidized PC or PS | LVI− | 2.6 | 76 |
| 909.627 | 909.6301 | 909.6226 | 5 | Oxidized PG | LVI− | 8.4 | 78 |
| 866.652 | 866.6491 | 866.6411 | 13 | PE | LVI− | 4.4 | 81 |
| 281.248 | 281.2483 | 281.2481 | 2 | FA(18:1) oleic acid | LVI+ | 2 | 71 |
| 889.571 | 889.5688 | 889.5731 | 2 | PA | M | 1.6 | 71 |
| 799.658 | 799.6575 | 799.6588 | 1 | TG | F | 1.4 | n/a |
| 595.296 | 595.2935 | 595.2889 | 11 | LysoPI | M | 5.8 | 86 |
| 201.039 | 201.0392 | 201.0405 | 10 | Succinylacetoacetate or Ethyl aconitate | F | 4.6 | n/a |
| 426.364 | 426.3652 | 426.3589 | 13 | Stearoylcarnitine or L-carnitine | F | 4.9 | 66 |
Disclaimer/Publisher’s Note: The statements, opinions and data contained in all publications are solely those of the individual author(s) and contributor(s) and not of MDPI and/or the editor(s). MDPI and/or the editor(s) disclaim responsibility for any injury to people or property resulting from any ideas, methods, instructions or products referred to in the content. |
© 2023 by the authors. Licensee MDPI, Basel, Switzerland. This article is an open access article distributed under the terms and conditions of the Creative Commons Attribution (CC BY) license (https://creativecommons.org/licenses/by/4.0/).
Share and Cite
Kaufmann, M.; Iaboni, N.; Jamzad, A.; Hurlbut, D.; Ren, K.Y.M.; Rudan, J.F.; Mousavi, P.; Fichtinger, G.; Varma, S.; Caycedo-Marulanda, A.; et al. Metabolically Active Zones Involving Fatty Acid Elongation Delineated by DESI-MSI Correlate with Pathological and Prognostic Features of Colorectal Cancer. Metabolites 2023, 13, 508. https://doi.org/10.3390/metabo13040508
Kaufmann M, Iaboni N, Jamzad A, Hurlbut D, Ren KYM, Rudan JF, Mousavi P, Fichtinger G, Varma S, Caycedo-Marulanda A, et al. Metabolically Active Zones Involving Fatty Acid Elongation Delineated by DESI-MSI Correlate with Pathological and Prognostic Features of Colorectal Cancer. Metabolites. 2023; 13(4):508. https://doi.org/10.3390/metabo13040508
Chicago/Turabian StyleKaufmann, Martin, Natasha Iaboni, Amoon Jamzad, David Hurlbut, Kevin Yi Mi Ren, John F. Rudan, Parvin Mousavi, Gabor Fichtinger, Sonal Varma, Antonio Caycedo-Marulanda, and et al. 2023. "Metabolically Active Zones Involving Fatty Acid Elongation Delineated by DESI-MSI Correlate with Pathological and Prognostic Features of Colorectal Cancer" Metabolites 13, no. 4: 508. https://doi.org/10.3390/metabo13040508