
Application of HR-NMR for the Metabolic Kinetic Assessment of Red Mullet (Mullus barbatus) and Bogue (Boops boops) Samples during Different Temperature Storage


Abstract
:1. Introduction
2. Experimental Design
2.1. Samples Preparation and Storage Conditions
2.2. Sample Preparation for 1H-NMR Analysis
2.3. 1H-NMR Measurements
2.4. Data Processing and Principal Component Analysis (PCA)
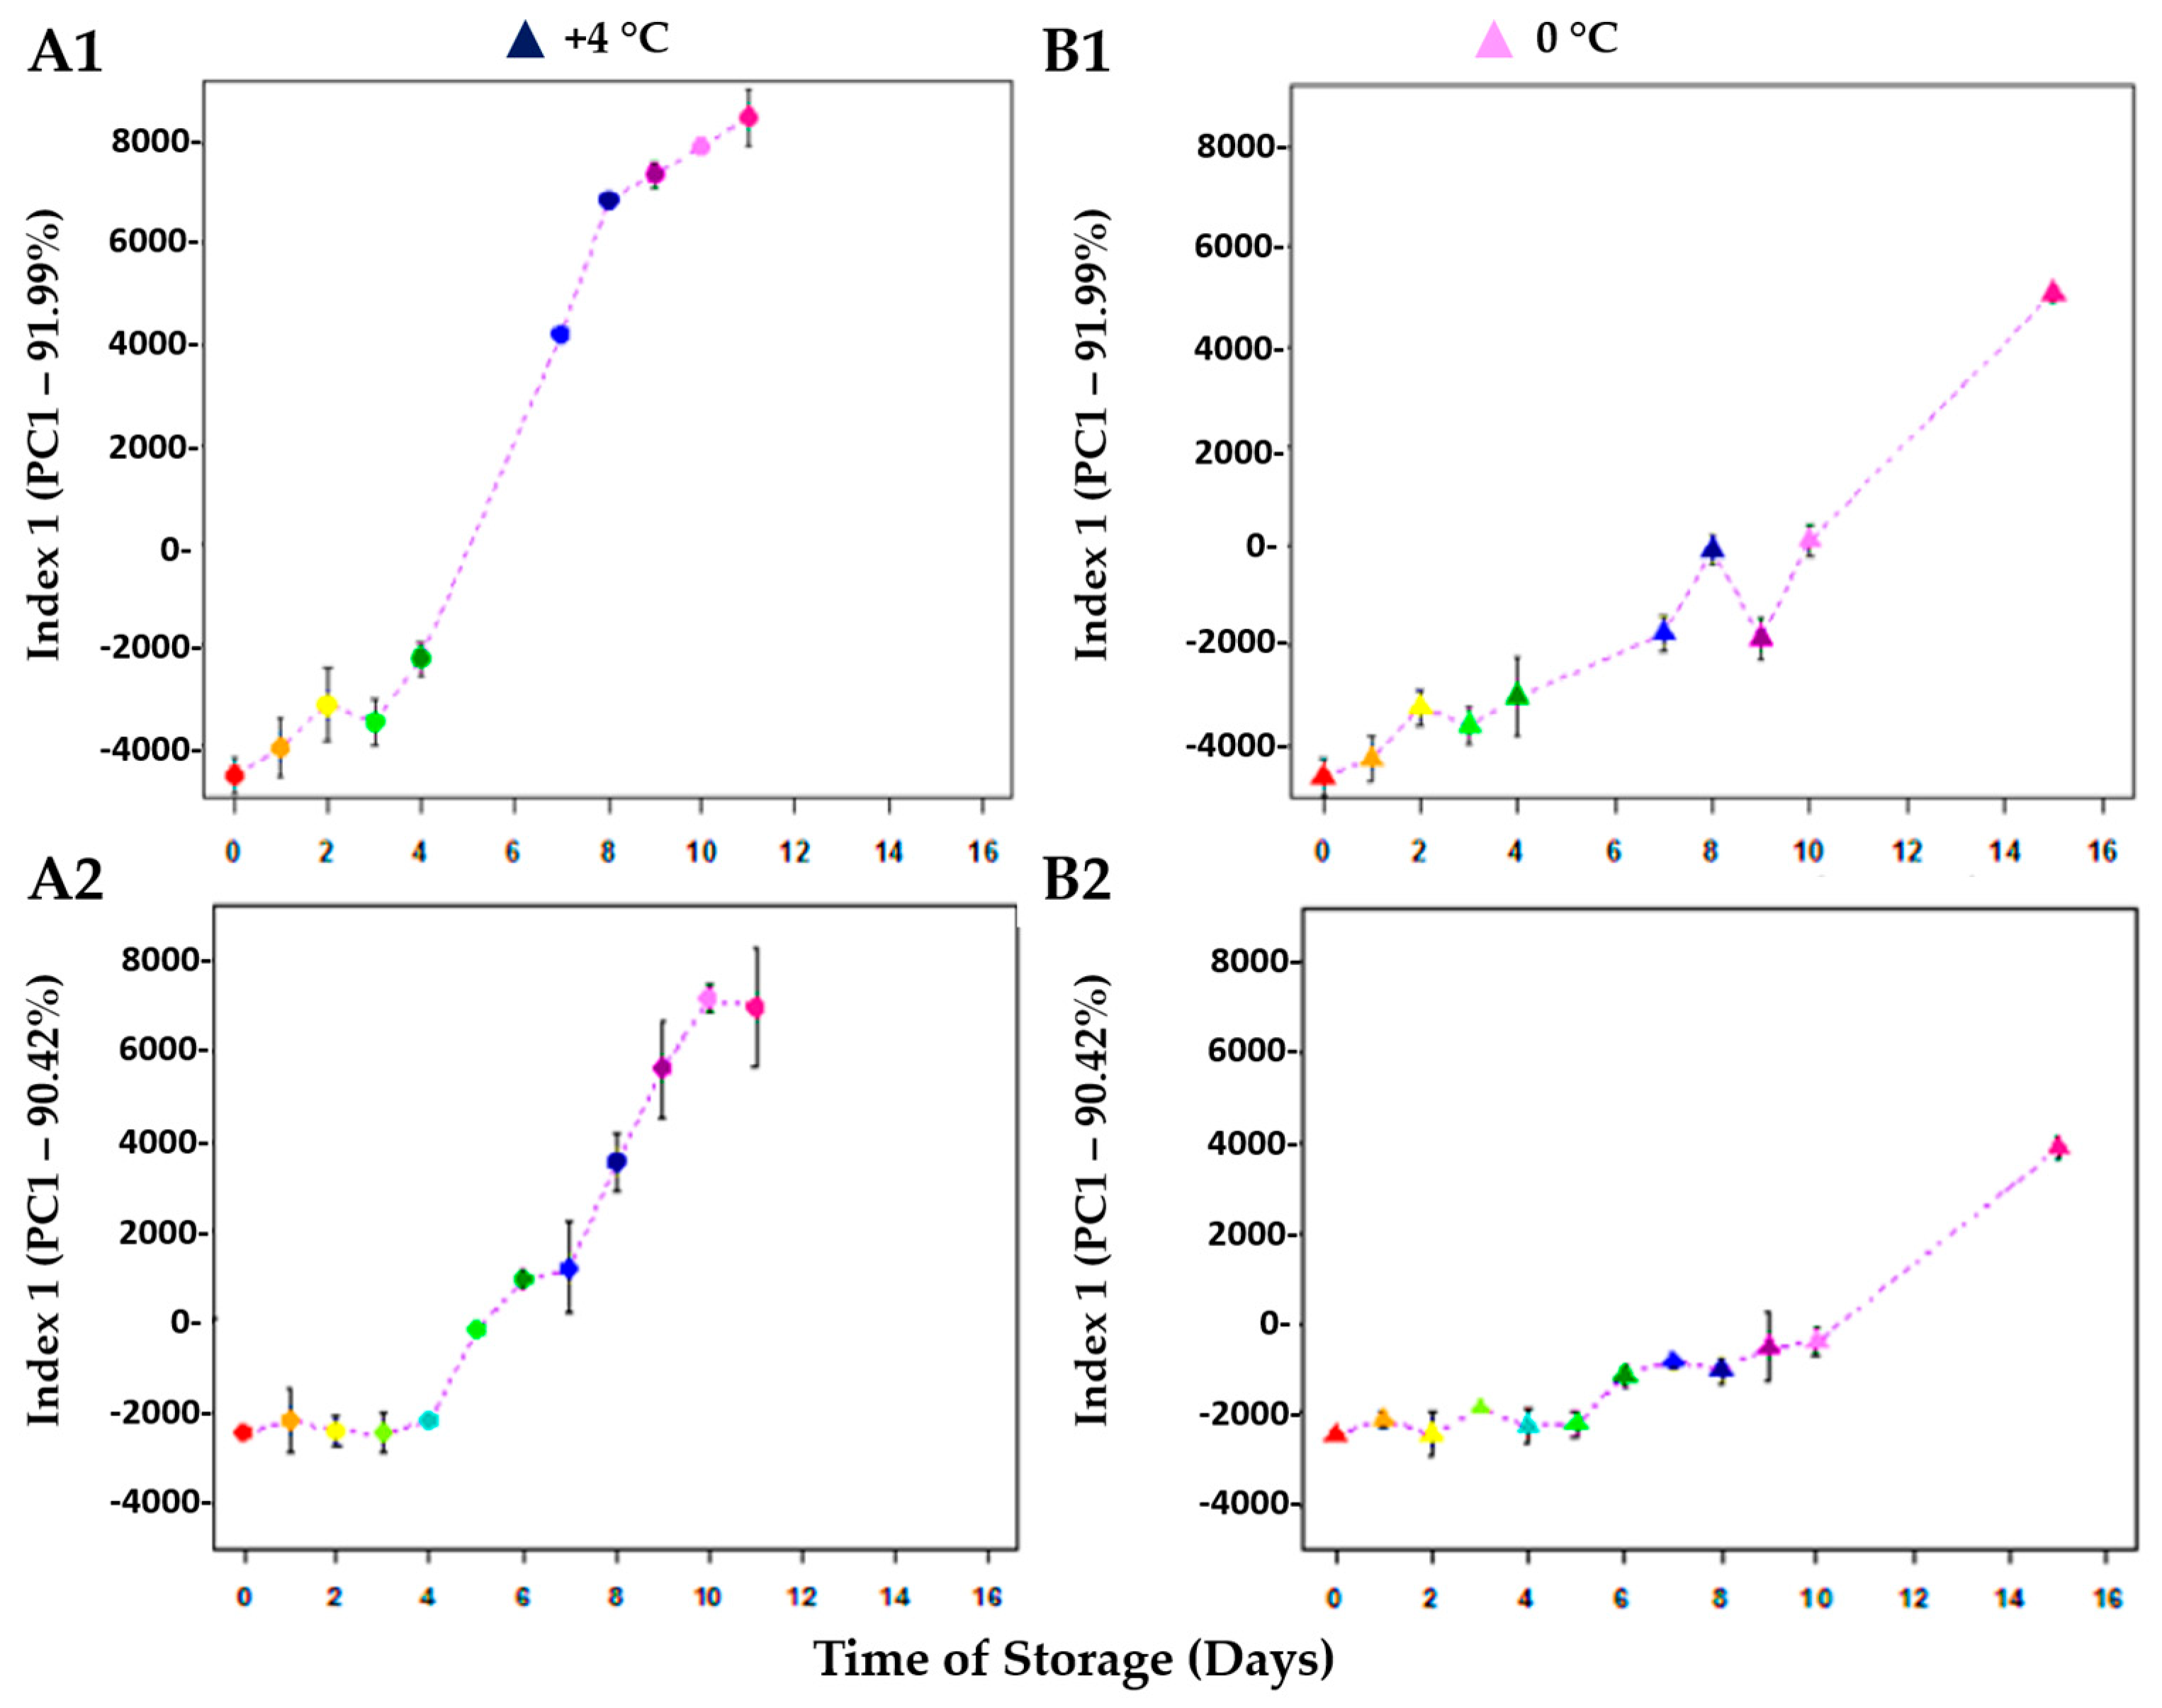
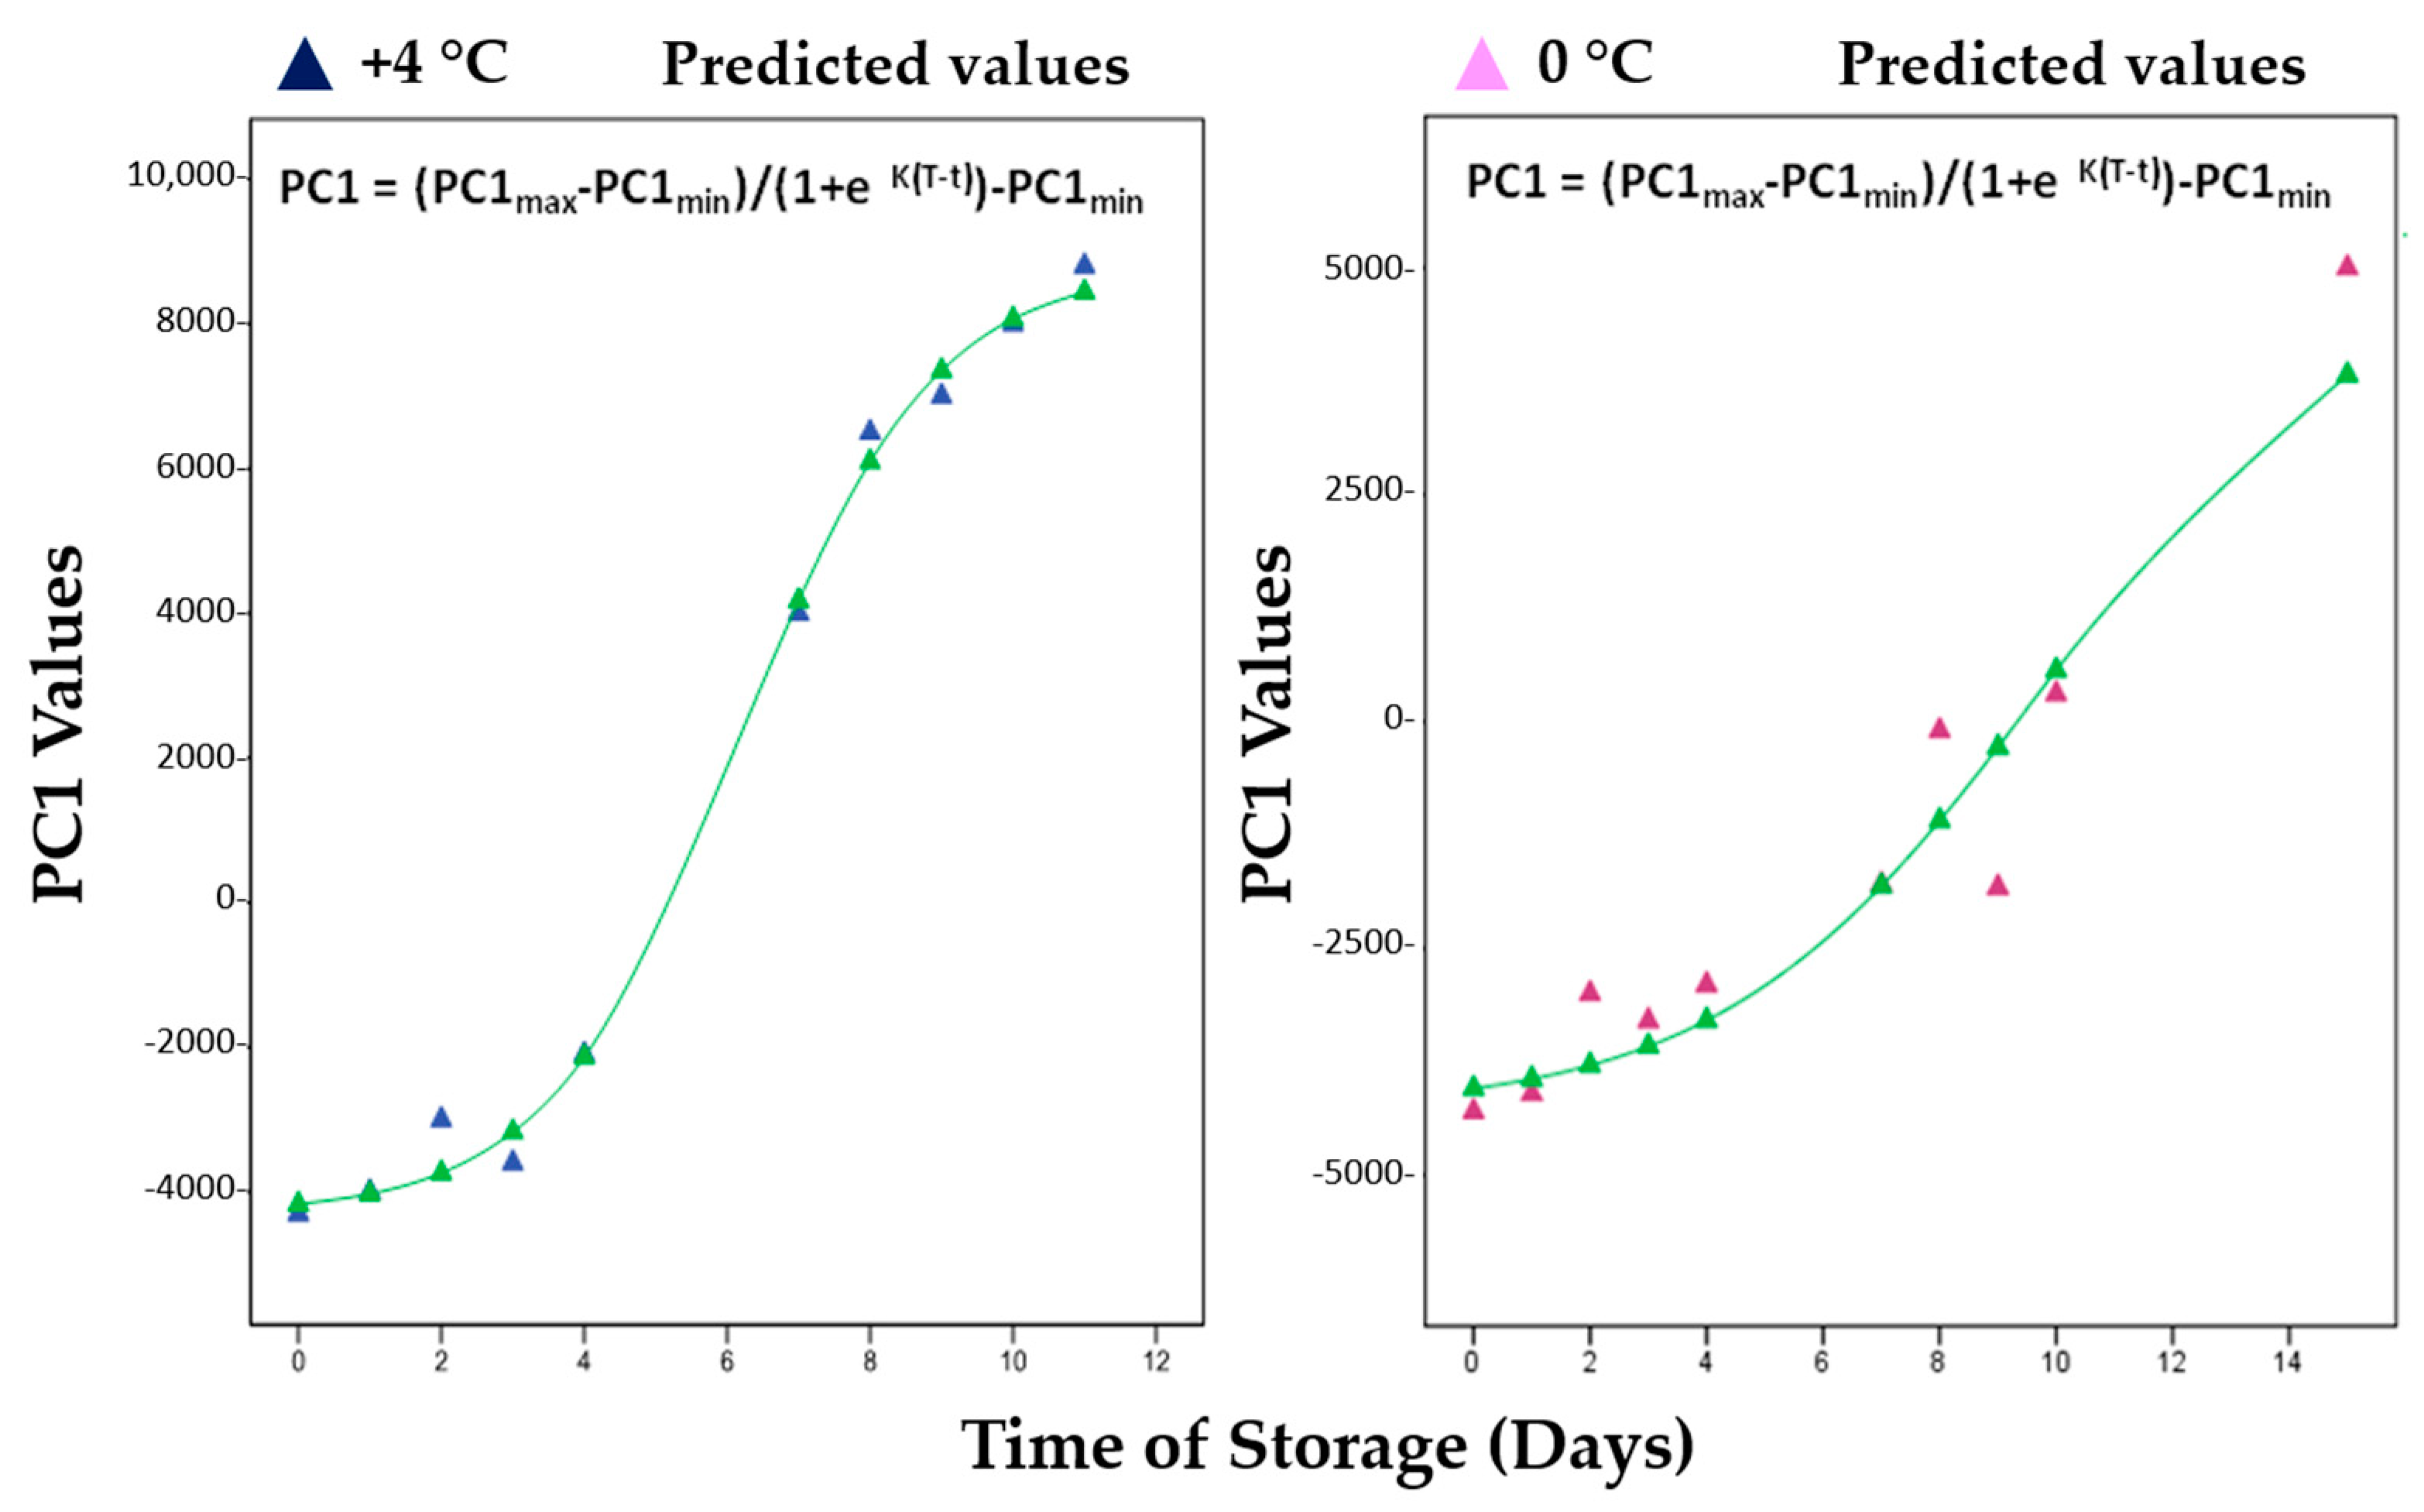
3. Results
4. Conclusions
Supplementary Materials
Author Contributions
Funding
Institutional Review Board Statement
Informed Consent Statement
Data Availability Statement
Acknowledgments
Conflicts of Interest
References
- Jaeger, S.R.; Antúnez, L.; Ares, G. An exploration of what freshness in fruit means to consumers. Food Res. Int. 2023, 165, 112491. [Google Scholar] [CrossRef] [PubMed]
- Vedovato, G.M.; Trude, A.C.B.; Kharmats, A.Y.; Martins, P.A. Degree of food processing of household acquisition patterns in a Brazilian urban area is related to food buying preferences and perceived food environment. Appetite 2015, 87, 296–302. [Google Scholar] [CrossRef] [PubMed]
- Abd El-Hay, M.M. 10-Processing and preparation of fish. In Postharvest and Postmortem Processing of Raw Food Materials; Jafari, S.M., Ed.; Woodhead Publishing: Sawston, UK, 2022; pp. 315–342. [Google Scholar]
- Sánchez-García, F.; Hernández, I.; Palacios, V.M.; Roldán, A.M. Freshness quality and shelf life evaluation of the seaweed Ulva rigida through physical, chemical, microbiological, and sensory methods. Foods 2021, 10, 181. [Google Scholar] [CrossRef]
- Prabhakar, P.K.; Vatsa, S.; Srivastav, P.P.; Pathak, S.S. A comprehensive review on freshness of fish and assessment: Analytical methods and recent innovations. Food Res. Int. 2020, 133, 109157. [Google Scholar] [CrossRef] [PubMed]
- Gram, L.; Huss, H.H. Microbiological spoilage of fish and fish products. Int. J. Food Microbiol. 1996, 33, 121–137. [Google Scholar] [CrossRef]
- Beatty, S.; Gibbons, N. The measurement of spoilage in fish. J. Biol. Board Can. 1937, 3, 77–91. [Google Scholar] [CrossRef]
- Ciampa, A.; Laghi, L.; Picone, G. Validation of a 1H-NMR Spectroscopy Quantitative Method to Quantify Trimethylamine Content and K-Index Value in Different Species of Fish. J. Food Qual. 2022, 2022, 3612095. [Google Scholar] [CrossRef]
- Gatchalian, M.M. Quality assessment through statistically-based sensory evaluation methods. TQM Mag. 1999, 11, 389–396. [Google Scholar] [CrossRef]
- Bentley, S. The evolution of legislation on freshness assessment of fish products. Comments to EC regulation 2406/96. In Annali della Facolta’di Medicina Veterinaria; Universita’di Parma: Parma, Italy, 1997. [Google Scholar]
- Bremner, H. A convenient, easy to use system for estimating the quality of chilled seafoods. Fish Process. Bull. 1985, 7, 59–70. [Google Scholar]
- Martinsdóttir, E.; Schelvis, R.; Hyldig, G.; Sveinsdóttir, K. Sensory evaluation of seafood: Methods. In Fishery Products: Quality, Safety and Authenticity; Wiley Online Library: Hoboken, NJ, USA, 2009; pp. 425–443. [Google Scholar]
- Olafsdottir, G.; Martinsdóttir, E.; Oehlenschläger, J.; Dalgaard, P.; Jensen, B.; Undeland, I.; Mackie, I.; Henehan, G.; Nielsen, J.; Nilsen, H. Methods to evaluate fish freshness in research and industry. Trends Food Sci. Technol. 1997, 8, 258–265. [Google Scholar] [CrossRef]
- Pena-Pereira, F.; Lavilla, I.; Bendicho, C. Colorimetric assay for determination of trimethylamine-nitrogen (TMA-N) in fish by combining headspace-single-drop microextraction and microvolume UV–vis spectrophotometry. Food Chem. 2010, 119, 402–407. [Google Scholar] [CrossRef]
- Ruiz-Capillas, C.; Gillyon, C.M.; Horner, W.F. Determination of volatile basic nitrogen and trimethylamine nitrogen in fish sauce by flow injection analysis. Eur. Food Res. Technol. 2000, 210, 434–436. [Google Scholar] [CrossRef]
- Ruiz-Capillas, C.; Horner, W.F.A. Determination of trimethylamine nitrogen and total volatile basic nitrogen in fresh fish by flow injection analysis. J. Sci. Food Agric. 1999, 79, 1982–1986. [Google Scholar] [CrossRef]
- Béné, A.; Hayman, A.; Reynard, E.; Luisier, J.; Villettaz, J. A new method for the rapid determination of volatile substances: The SPME-direct method: Part II. Determination of the freshness of fish. Sens. Actuators B Chem. 2001, 72, 204–207. [Google Scholar] [CrossRef]
- Nielsen, M.K.; Jørgensen, B.M. Quantitative relationship between trimethylamine oxide aldolase activity and formaldehyde accumulation in white muscle from gadiform fish during frozen storage. J. Agric. Food Chem. 2004, 52, 3814–3822. [Google Scholar] [CrossRef]
- Dalgaard, P.; Huss, H.H. Mathematical modeling used for evaluation and prediction of microbial fish spoilage. In Seafood Safety, Processing, and Biotechnology; CRC Press: Boca Raton, FL, USA, 2020; pp. 73–89. [Google Scholar]
- Prabhakar, P.K.; Srivastav, P.P.; Pathak, S.S. Kinetics of total volatile basic nitrogen and trimethylamine formation in stored rohu (Labeo rohita) fish. J. Aquat. Food Prod. Technol. 2019, 28, 452–464. [Google Scholar] [CrossRef]
- Ciampa, A.; Danesi, F.; Picone, G. NMR-Based Metabolomics for a More Holistic and Sustainable Research in Food Quality Assessment: A Narrative Review. Appl. Sci. 2023, 13, 372. [Google Scholar] [CrossRef]
- Picone, G.; Engelsen, S.B.; Savorani, F.; Testi, S.; Badiani, A.; Capozzi, F. Metabolomics as a powerful tool for molecular quality assessment of the fish Sparus aurata. Nutrients 2011, 3, 212–227. [Google Scholar] [CrossRef]
- Savorani, F.; Picone, G.; Badiani, A.; Fagioli, P.; Capozzi, F.; Engelsen, S.B. Metabolic profiling and aquaculture differentiation of gilthead sea bream by 1H NMR metabonomics. Food Chem. 2010, 120, 907–914. [Google Scholar] [CrossRef]
- Sikorski, Z.; Karnicki, Z. Resources and their ability. In Seafood: Resources, Nutritional Composition and Presentation; Sikorski, Z.E., Ed.; CRC Press: Boca Raton, FL, USA, 1990; pp. 9–28. [Google Scholar]
- Cox, D.H.; Karahadian, C. Evaluation of microbial counts, nucleotide degradation, and sensory attributes of cultured and wild yellow perch (Perca flavescens) during refrigerated storage. J. Aquat. Food Prod. Technol. 1998, 7, 5–26. [Google Scholar] [CrossRef]
- Saavedra, J.; Córdova, A.; Gálvez, L.; Quezada, C.; Navarro, R. Principal Component Analysis as an exploration tool for kinetic modeling of food quality: A case study of a dried apple cluster snack. J. Food Eng. 2013, 119, 229–235. [Google Scholar] [CrossRef]
- Parveen, A.N.; Inbarani, H.H.; Kumar, E.S. Performance analysis of unsupervised feature selection methods. In Proceedings of the 2012 International Conference on Computing, Communication and Applications, Dindigul, Tamilnadu, 22–24 February 2012; pp. 1–7. [Google Scholar]
- Ciampa, A.; Picone, G.; Laghi, L.; Nikzad, H.; Capozzi, F. Changes in the amino acid composition of Bogue (Boops boops) fish during storage at different temperatures by 1H-NMR spectroscopy. Nutrients 2012, 4, 542–553. [Google Scholar] [CrossRef] [PubMed]
- Boland, F. Trimethylammine nitrogen in seadfood method colorimetric. J. Assoc. Off. Anal. Chem. 1971, 54, 9. [Google Scholar]
- Ciampa, A. Development of Methodologies for Fish Freshness Assessment Using Metabonomics Applications. Ph.D. Thesis, University of Bologna, Bologna, Italy, 2013. [Google Scholar]
- Howgate, P. A critical review of total volatile bases and trimethylamine as indices of freshness of fish. Part 2. Formation of the bases, and application in quality assurance. Electron. J. Environ. Agric. Food Chem. 2010, 9, 29–57. [Google Scholar]
- Prato, E.; Biandolino, F. Total lipid content and fatty acid composition of commercially important fish species from the Mediterranean, Mar Grande Sea. Food Chem. 2012, 131, 1233–1239. [Google Scholar] [CrossRef]
- Huss, H.H.; Boerresen, T.; Dalgaard, P.; Gram, L.; Jensen, B. Quality and Quality Changes in Fresh Fish; FAO Documento Tecnico de Pesca: Roma, Italy, 1998. [Google Scholar]
- Benjakul, S.; Visessanguan, W.; Tanaka, M. Induced formation of dimethylamine and formaldehyde by lizardfish (Saurida micropectoralis) kidney trimethylamine-N-oxide demethylase. Food Chem. 2004, 84, 297–305. [Google Scholar] [CrossRef]
- Venugopal, V.; Shahidi, F. Structure and composition of fish muscle. Food Rev. Int. 1996, 12, 175–197. [Google Scholar] [CrossRef]
- Saito, T.; Arai, K.-i.; Matsuyoshi, M. A new method for estimating the freshness of fish. Bull. Jpn. Soc. Sci. Fish. 1959, 24, 749. [Google Scholar] [CrossRef]
- Hara, A.; Uda, F. Theoretical and experimental studies on the time-temperature tolerance of fish muscle K value [a fish freshness index]. Bull. Jpn. Soc. Sci. Fish. (Jpn.) 1984, 50, 1745–1756. [Google Scholar] [CrossRef]
- Hattula, T. Adenosine Triphosphate Breakdown Products as a Freshness Indicator of Some Fish Species and Fish Products (Unpublished VVT Publications 297 Thesis). Ph.D. Thesis, VVT (Technical Research Centre of Finland), Espoo, Finland, 1997. [Google Scholar]
- Prabhakar, P.K.; Srivastav, P.P.; Pathak, S.S.; Das, K. Mathematical modeling of total volatile basic nitrogen and microbial biomass in stored rohu (Labeo rohita) fish. Front. Sustain. Food Syst. 2021, 5, 669473. [Google Scholar] [CrossRef]
- Singh, P.; Danish, M.; Saxena, A. Spoilage of Fish-Process and Its Prevention; Department of Fishery Biology, College of Fisheries, GB Pant University of Agriculture and Technology: Pantnagar, India, 2011. [Google Scholar]
- Picone, G.; Mezzetti, B.; Babini, E.; Capocasa, F.; Placucci, G.; Capozzi, F. Unsupervised principal component analysis of NMR metabolic profiles for the assessment of substantial equivalence of transgenic grapes (Vitis vinifera). J. Agric. Food Chem. 2011, 59, 9271–9279. [Google Scholar] [CrossRef] [PubMed]
- Agnes, S.B. Nutritional Level in Edible Marine Fish Parastromateus Niger And Its Depletion during Storage. Int. J. Eng. Sci. Invention 2013, 2, 51–55. [Google Scholar]
- Giannakourou, M.; Koutsoumanis, K.; Nychas, G.; Taoukis, P. Development and assessment of an intelligent shelf life decision system for quality optimization of the food chill chain. J. Food Prot. 2001, 64, 1051–1057. [Google Scholar] [CrossRef]


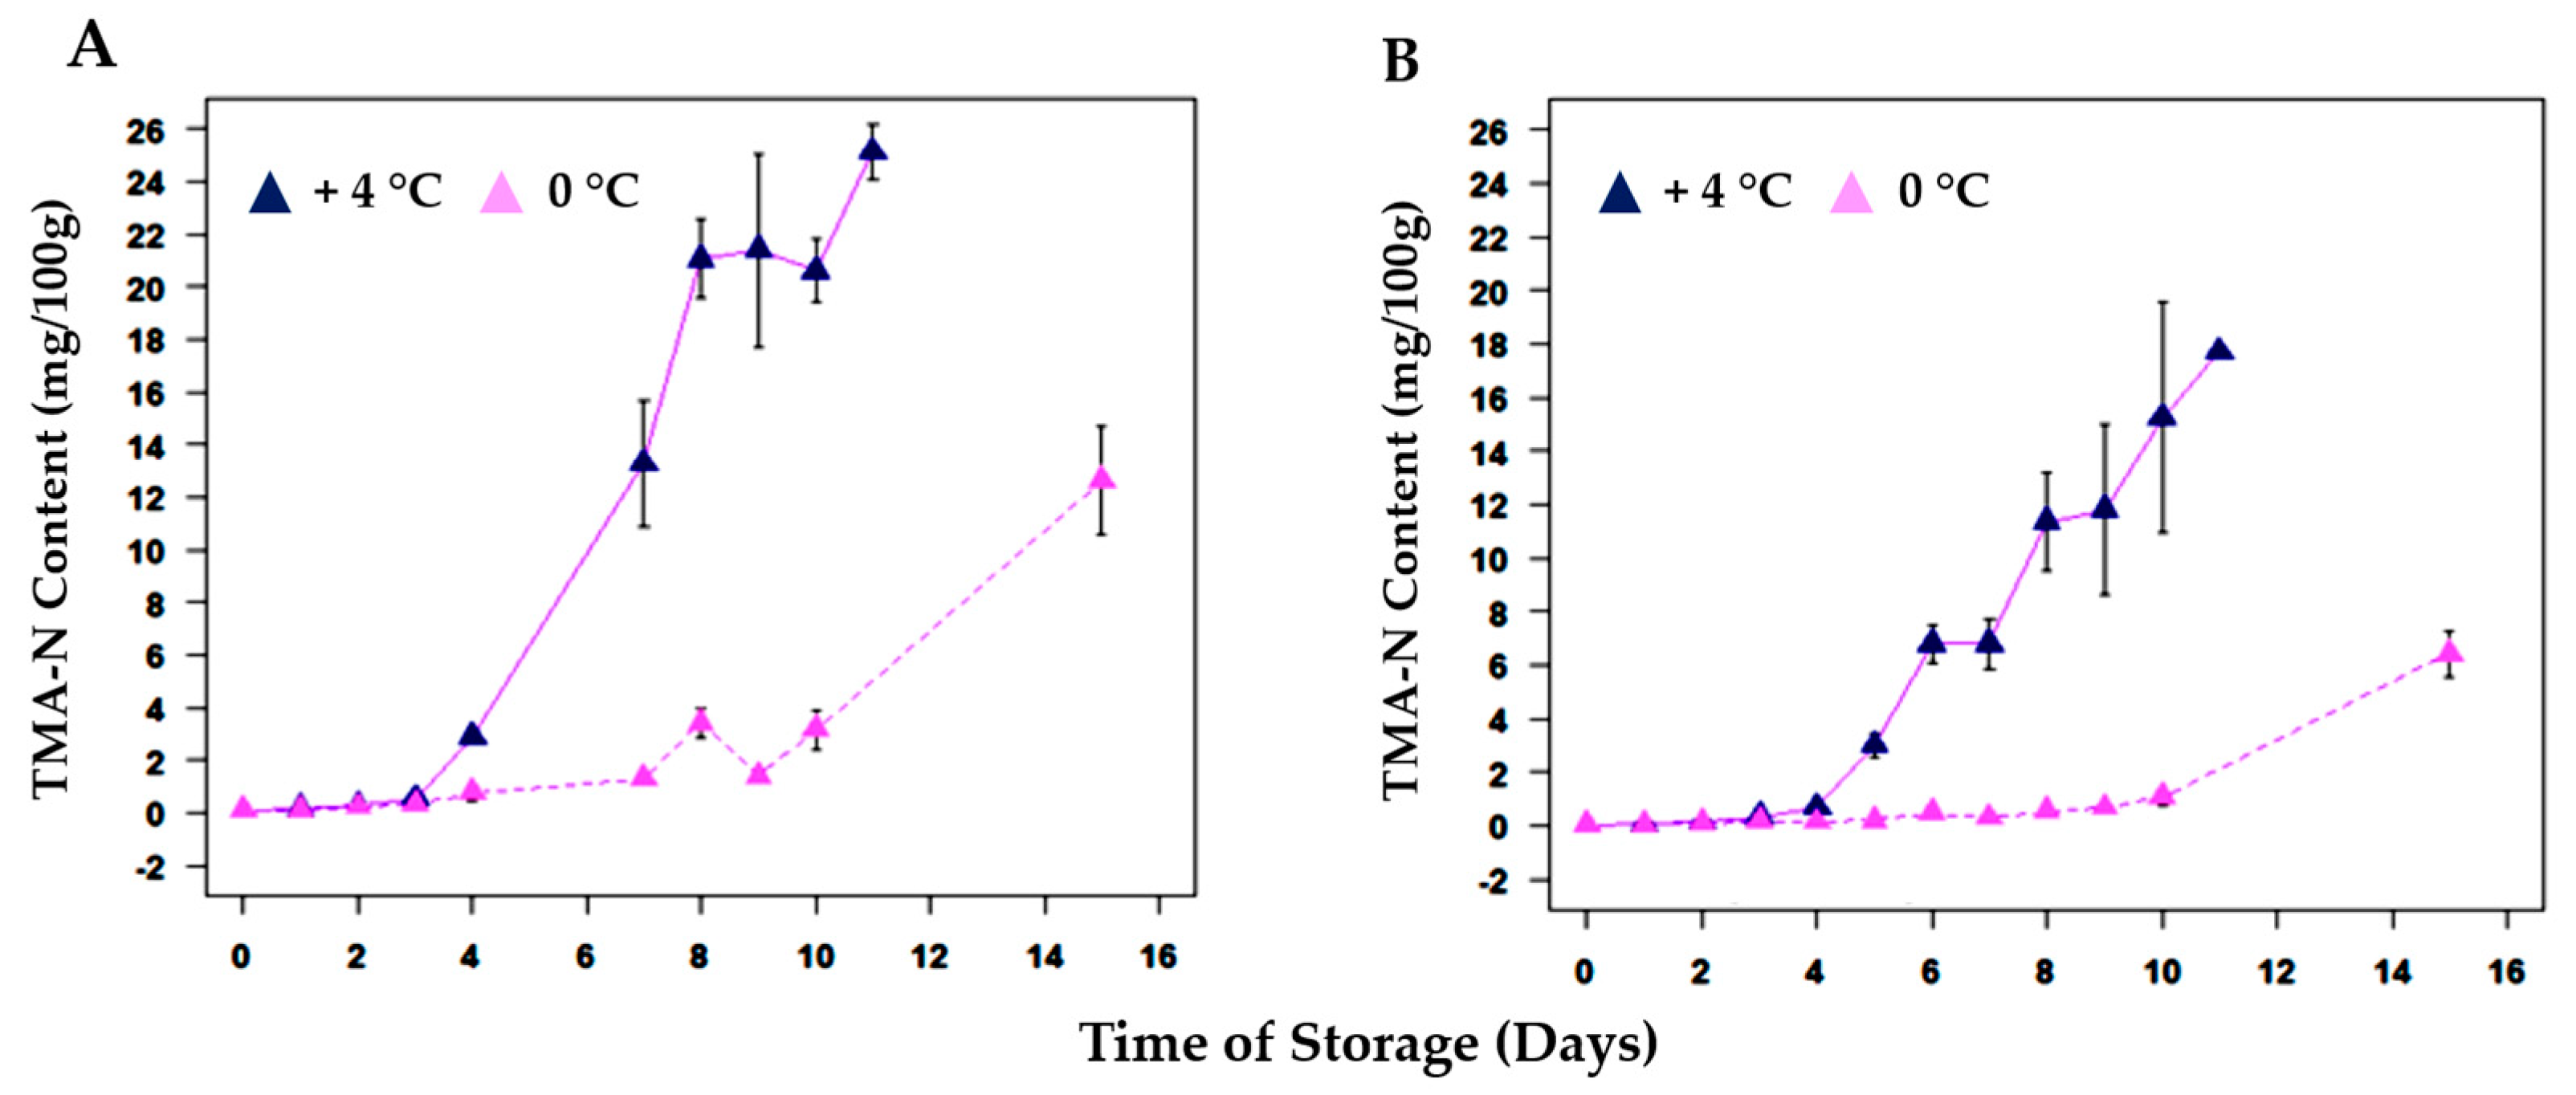
| Parameter (TMA-N) | +4 °C | 0 °C | R2 (+4 °C) * | R2 (0 °C) * |
|---|---|---|---|---|
| k (days −1) | 0.819 | 0.654 | 0.984 | 0.941 |
| T (days) | 6.662 | 11.22 | 0.984 | 0.941 |
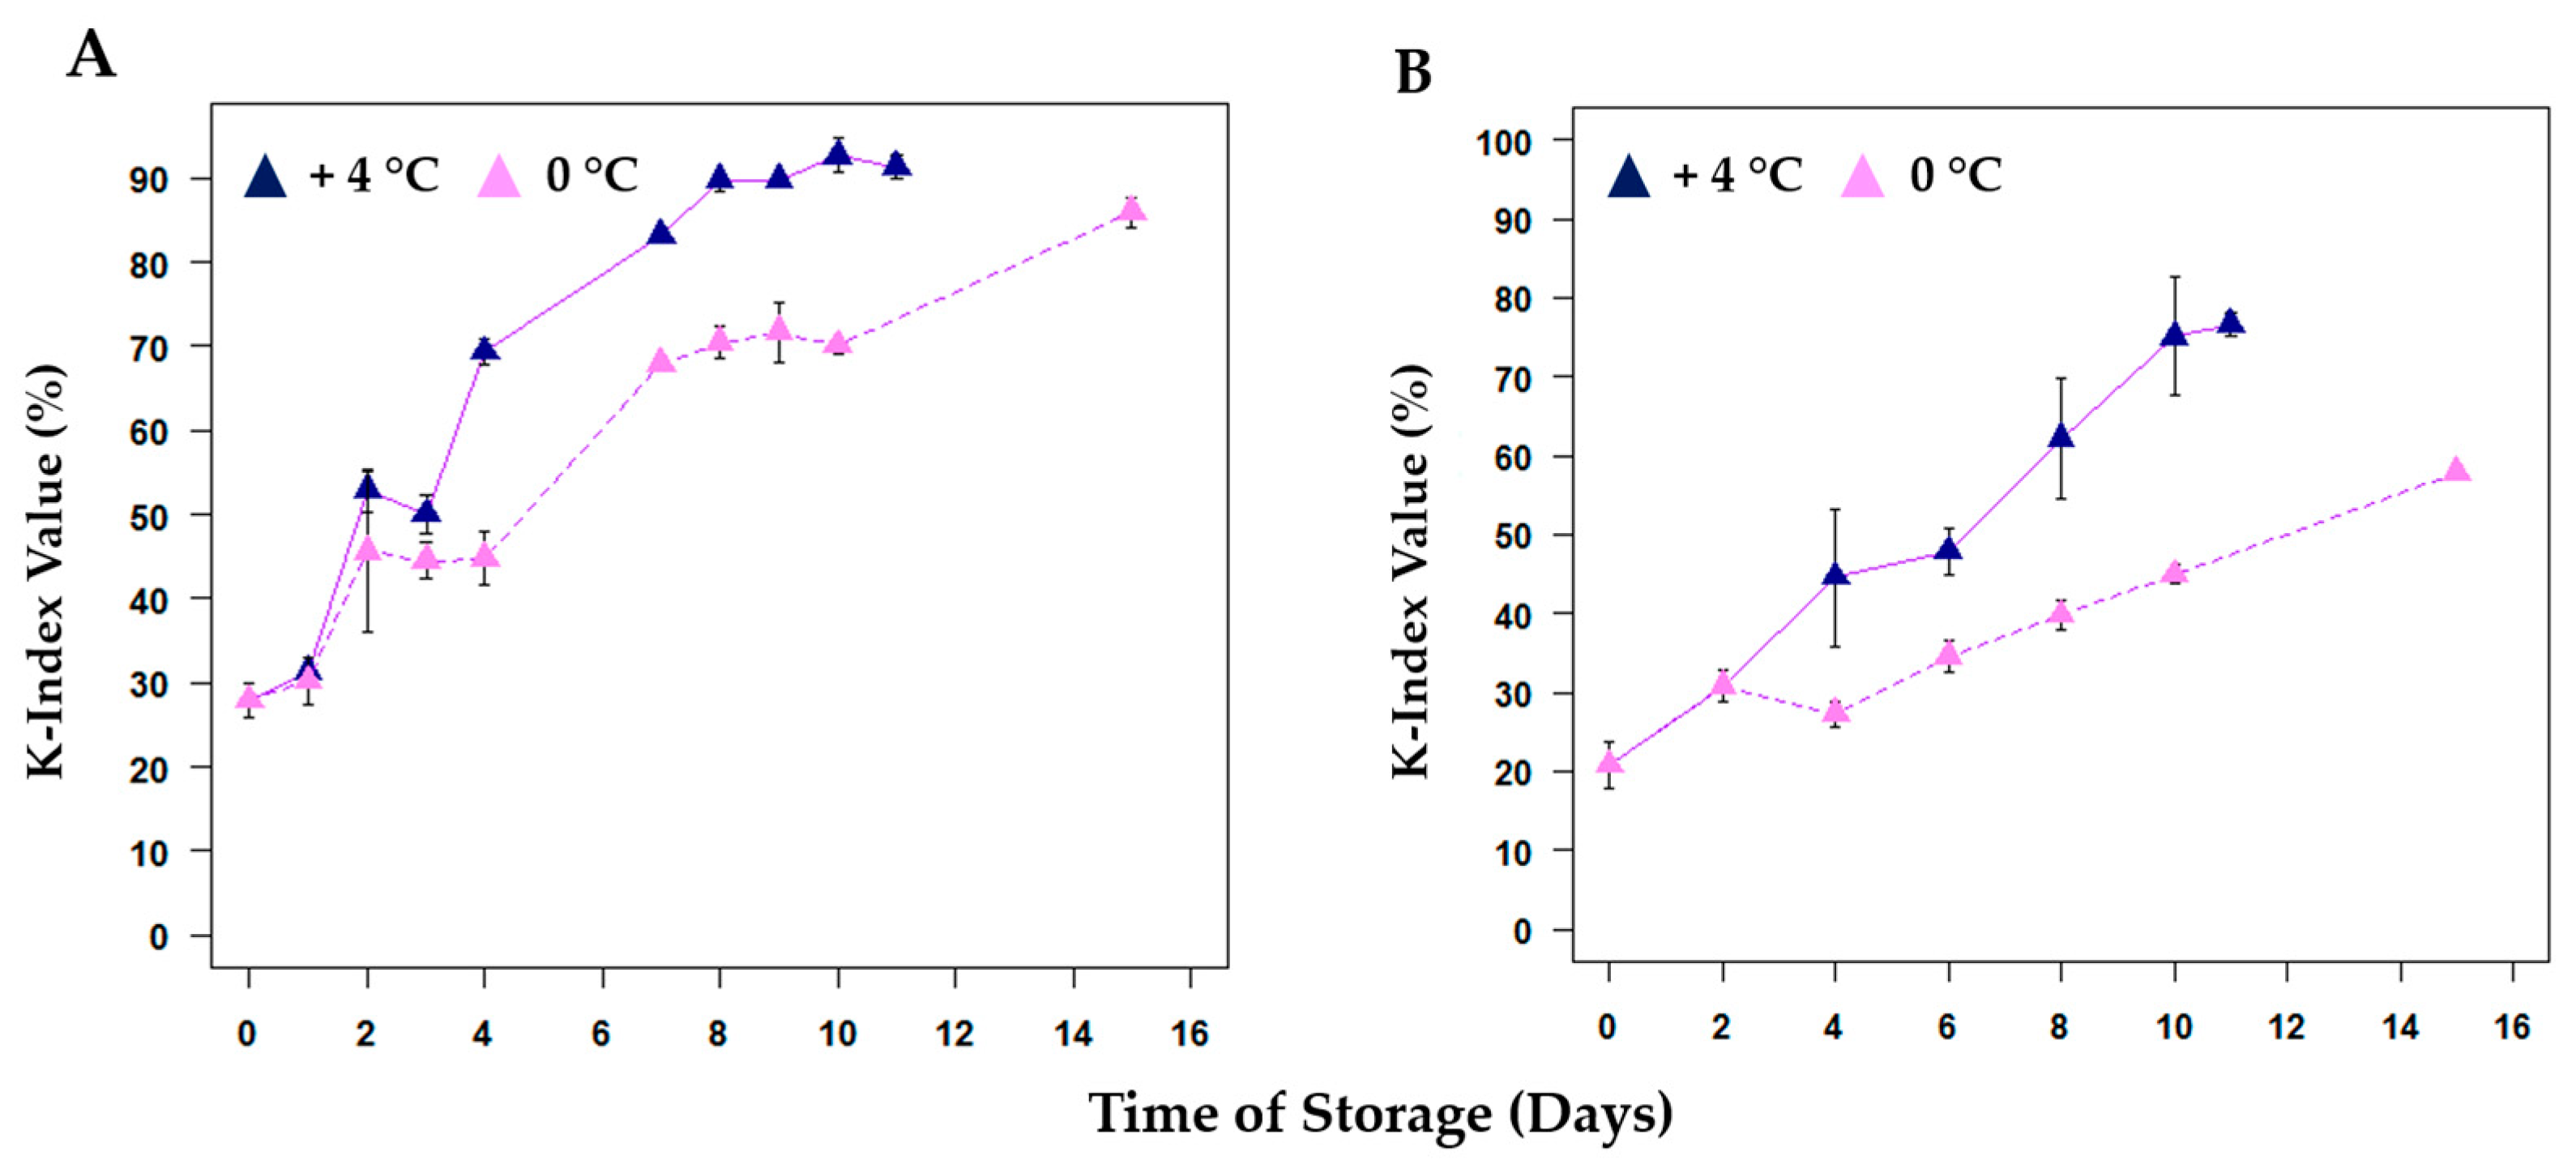
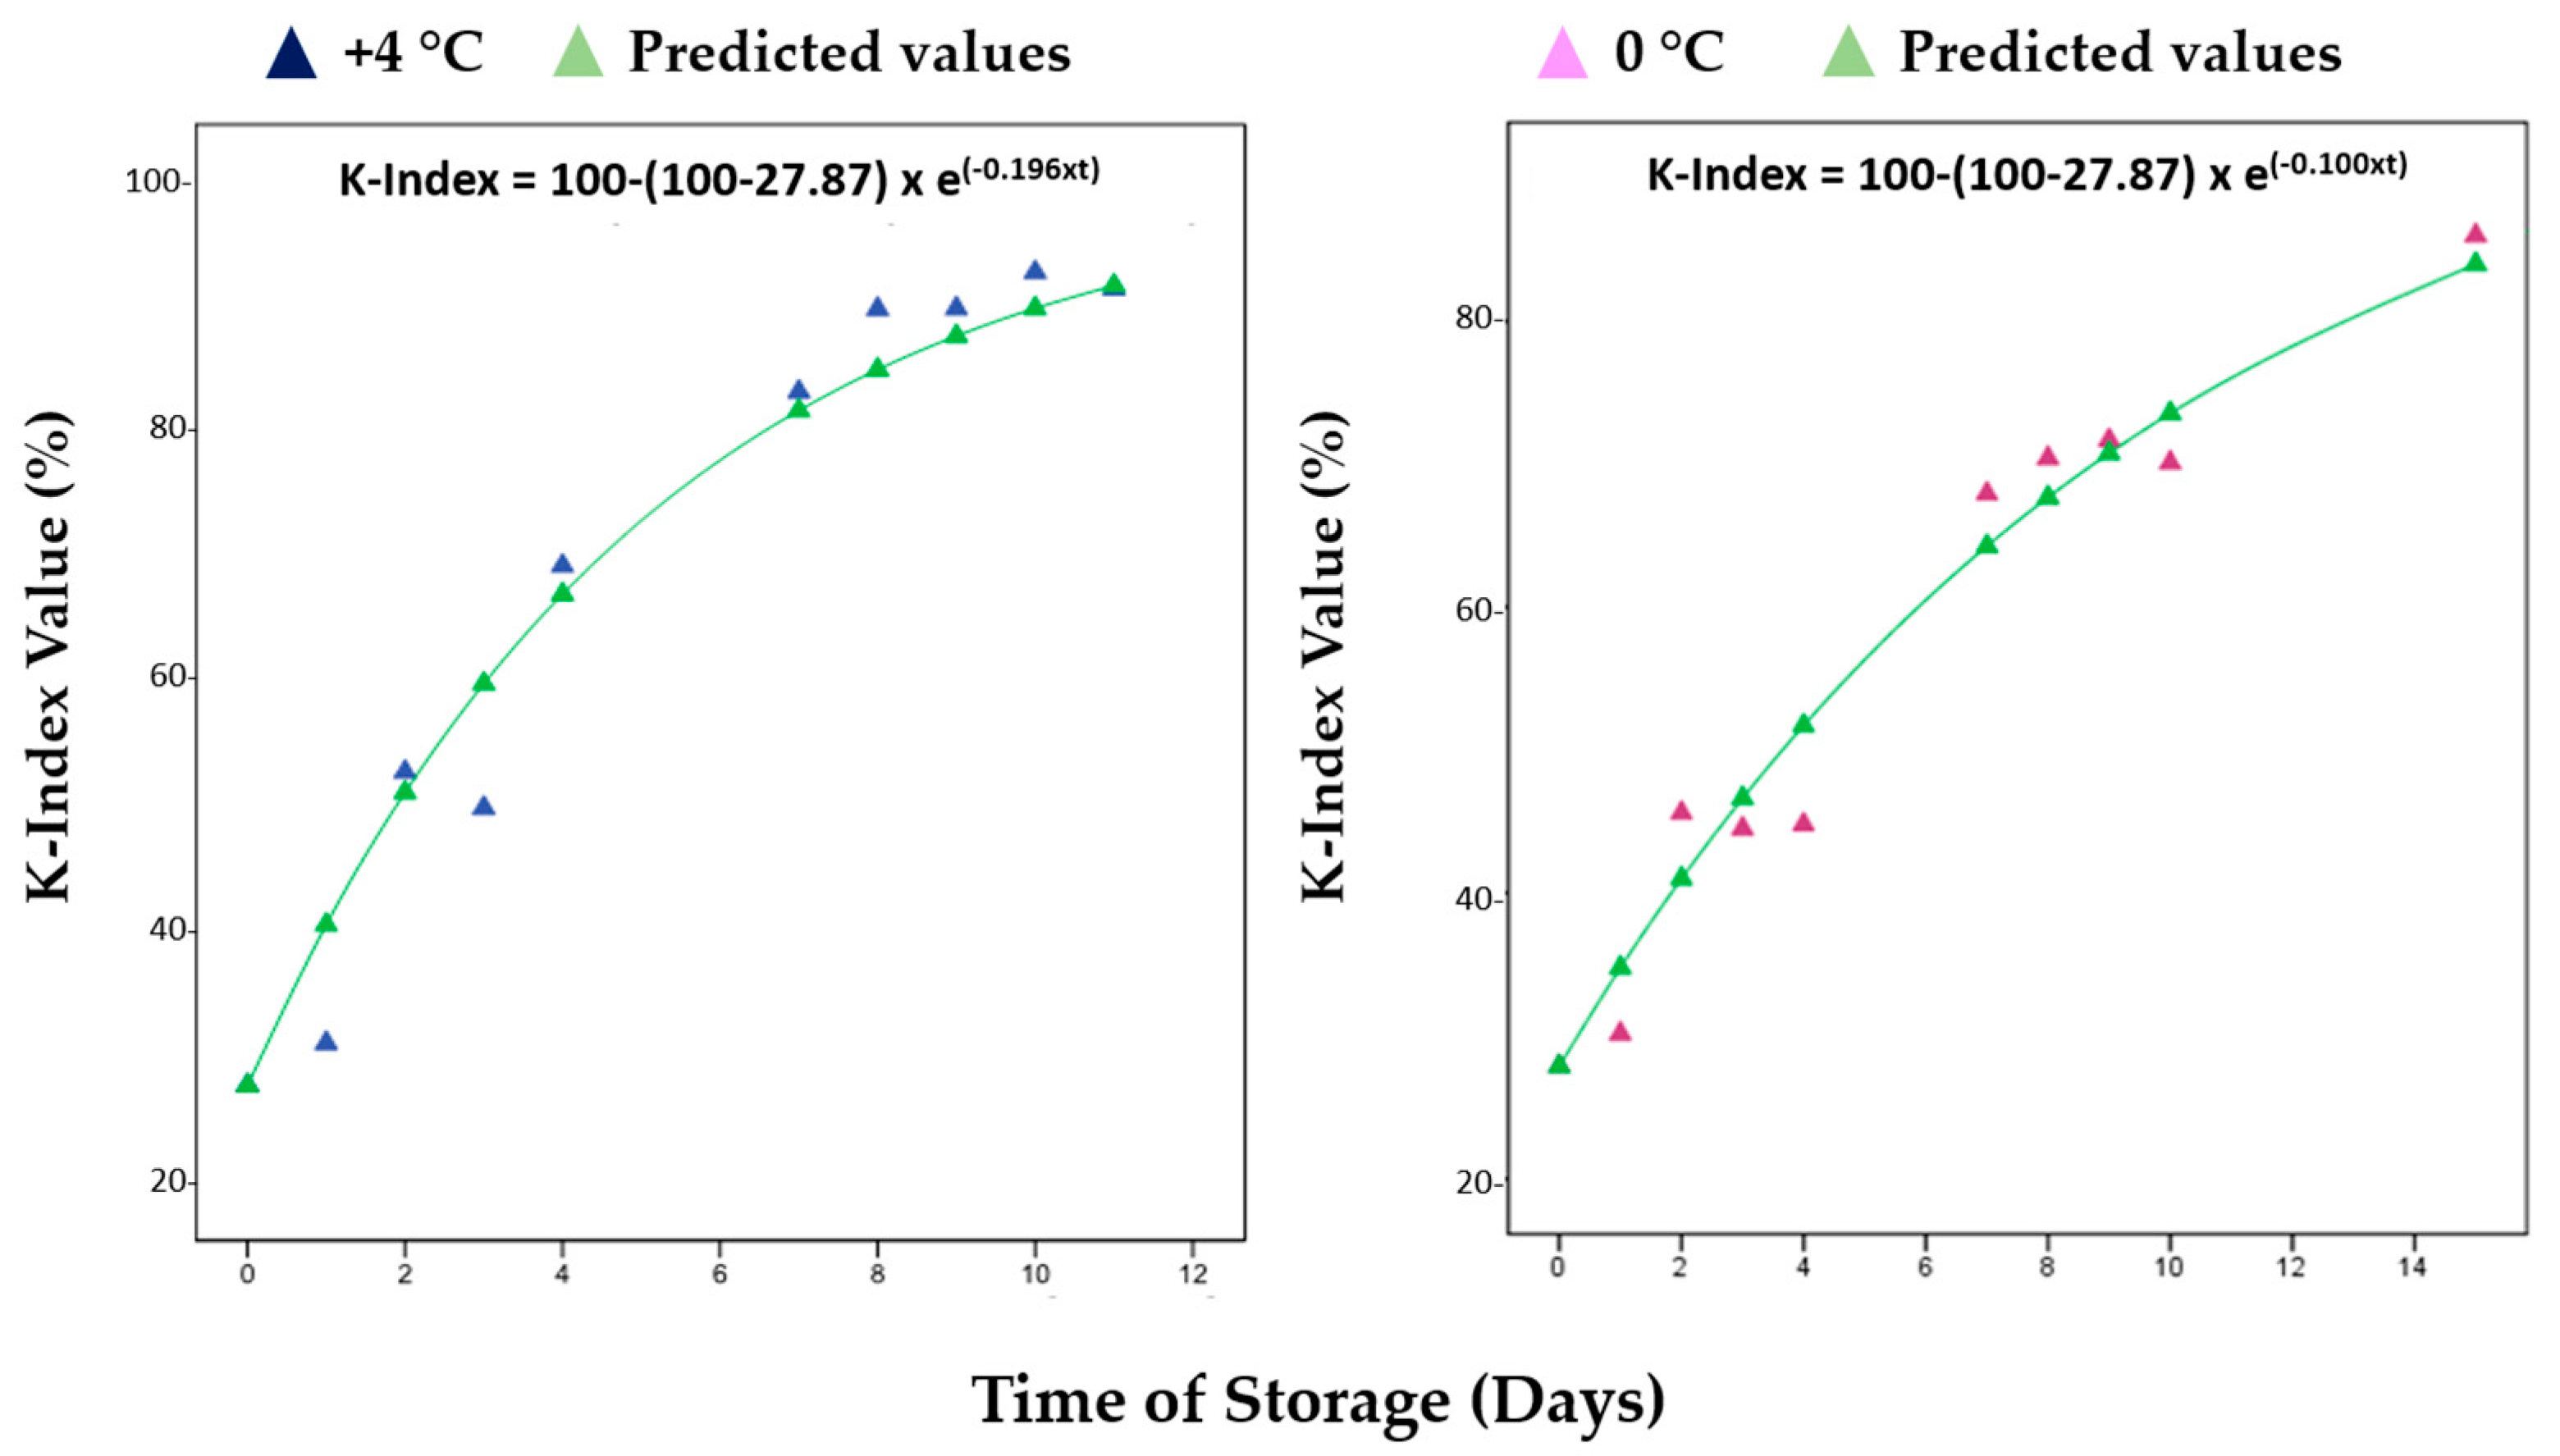
| Parameter (K-Index) | +4 °C | 0 °C | R2 (+4 °C) | R2 (0 °C) |
| k (days −1) | 0.196 | 0.100 | 0.960 | 0.962 |
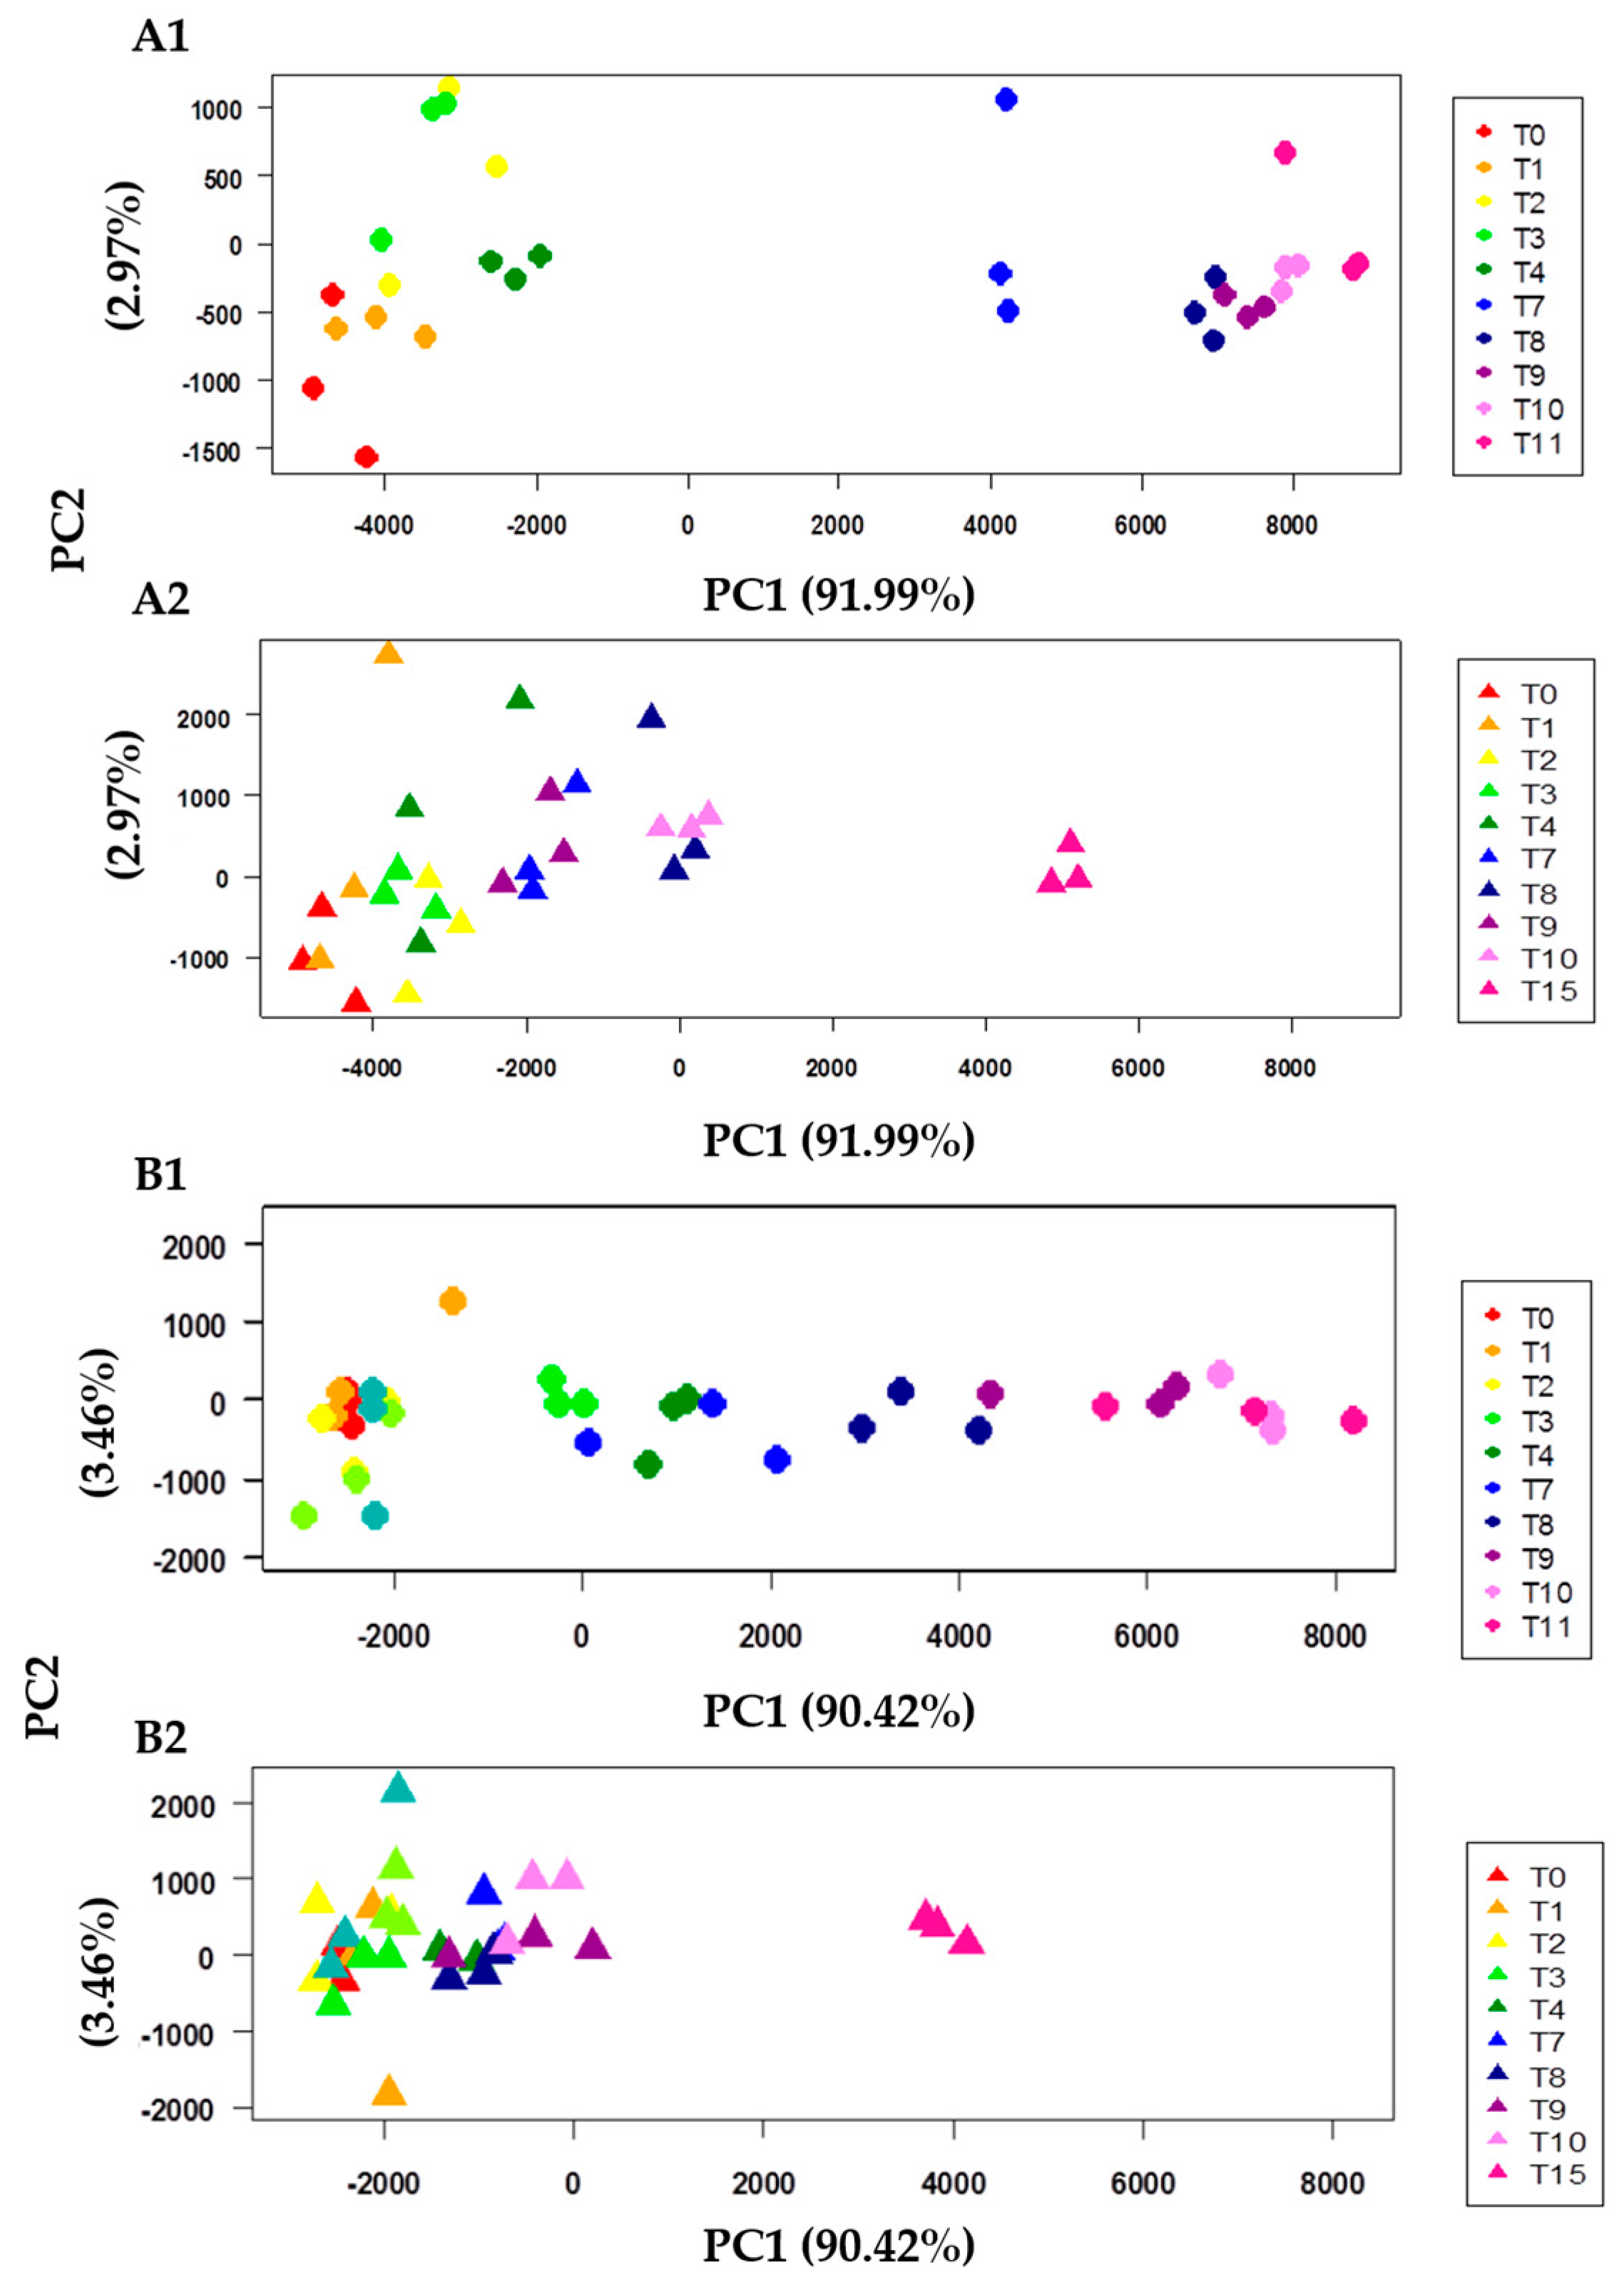
| Parameter (PC1) | +4 °C | 0 °C | R2 (+4 °C) * | R2 (0 °C) * |
|---|---|---|---|---|
| k (days −1) | 0.741 | 0.367 | 0.996 | 0.917 |
| T (days) | 6.185 | 9.749 | 0.996 | 0.917 |
Disclaimer/Publisher’s Note: The statements, opinions and data contained in all publications are solely those of the individual author(s) and contributor(s) and not of MDPI and/or the editor(s). MDPI and/or the editor(s) disclaim responsibility for any injury to people or property resulting from any ideas, methods, instructions or products referred to in the content. |
© 2023 by the authors. Licensee MDPI, Basel, Switzerland. This article is an open access article distributed under the terms and conditions of the Creative Commons Attribution (CC BY) license (https://creativecommons.org/licenses/by/4.0/).
Share and Cite
Ciampa, A.; Picone, G. Application of HR-NMR for the Metabolic Kinetic Assessment of Red Mullet (Mullus barbatus) and Bogue (Boops boops) Samples during Different Temperature Storage. Metabolites 2023, 13, 482. https://doi.org/10.3390/metabo13040482
Ciampa A, Picone G. Application of HR-NMR for the Metabolic Kinetic Assessment of Red Mullet (Mullus barbatus) and Bogue (Boops boops) Samples during Different Temperature Storage. Metabolites. 2023; 13(4):482. https://doi.org/10.3390/metabo13040482
Chicago/Turabian StyleCiampa, Alessandra, and Gianfranco Picone. 2023. "Application of HR-NMR for the Metabolic Kinetic Assessment of Red Mullet (Mullus barbatus) and Bogue (Boops boops) Samples during Different Temperature Storage" Metabolites 13, no. 4: 482. https://doi.org/10.3390/metabo13040482