Article

Changes in a Protein Profile Can Account for the Altered Phenotype of the Yeast Saccharomyces cerevisiae Mutant Lacking the Copper-Zinc Superoxide Dismutase

by
Magdalena Kwolek-Mirek
1,*,
Aleksandra Dubicka-Lisowska
2,
Sabina Bednarska
1,
Renata Zadrag-Tecza
1,* and
Pawel Kaszycki
2
1
Department of Biology, Institute of Biology and Biotechnology, College of Natural Sciences, University of Rzeszow, 35-601 Rzeszow, Poland
2
Department of Plant Biology and Biotechnology, Faculty of Biotechnology and Horticulture, University of Agriculture in Krakow, 31-425 Krakow, Poland
*
Authors to whom correspondence should be addressed.
Metabolites 2023, 13(3), 459; https://doi.org/10.3390/metabo13030459
Submission received: 20 February 2023 / Revised: 14 March 2023 / Accepted: 20 March 2023 / Published: 22 March 2023
(This article belongs to the Special Issue Advances in Functional Proteomics and Metabolomics)

Abstract

:
Copper-zinc superoxide dismutase (SOD1) is an antioxidant enzyme that catalyzes the disproportionation of superoxide anion to hydrogen peroxide and molecular oxygen (dioxygen). The yeast Saccharomyces cerevisiae lacking SOD1sod1) is hypersensitive to the superoxide anion and displays a number of oxidative stress-related alterations in its phenotype. We compared proteomes of the wild-type strain and the Δsod1 mutant employing two-dimensional gel electrophoresis and detected eighteen spots representing differentially expressed proteins, of which fourteen were downregulated and four upregulated. Mass spectrometry-based identification enabled the division of these proteins into functional classes related to carbon metabolism, amino acid and protein biosynthesis, nucleotide biosynthesis, and metabolism, as well as antioxidant processes. Detailed analysis of the proteomic data made it possible to account for several important morphological, biochemical, and physiological changes earlier observed for the SOD1 mutation. An example may be the proposed additional explanation for methionine auxotrophy. It is concluded that protein comparative profiling of the Δsod1 yeast may serve as an efficient tool in the elucidation of the mutation-based systemic alterations in the resultant S. cerevisiae phenotype.

1. Introduction

Superoxide dismutase (SOD, EC 1.15.1.1) is an antioxidant enzyme that catalyzes the two-step disproportionation of superoxide anion to hydrogen peroxide and molecular oxygen (dioxygen). In the yeast Saccharomyces cerevisiae, there are two SOD isoenzymes—a copper- and zinc-containing enzyme (CuZnSOD, SOD1) occurring in the cytosol and in the intermembrane space of mitochondria, and a manganese-containing enzyme (MnSOD, SOD2) localized in the mitochondrial matrix [1,2]. The Sod2p protein and the mitochondrial fraction of Sod1p are involved in the disproportionation of superoxide anion generated by the mitochondrial respiratory chain [2,3,4], while the cytosolic fraction of Sod1p is mainly utilized for peroxide-mediated signaling [5,6]. Sod1-derived hydrogen peroxide stabilizes a pair of plasma membrane casein kinases, Yck1p and Yck2p, that control nutrient sensing and energy metabolism [7,8,9], and plays a role in antioxidant defense by stimulating the production of NADPH [10]. Sod1p also participates in controlling the level and activity of the voltage-dependent anion-selective channel (VDAC) responsible for the proper transport of metabolites between the intermembrane space of mitochondria and cytosol [11,12]. Furthermore, in response to elevated endogenous and exogenous reactive oxygen species (ROS), Sod1p may rapidly relocate into the nucleus, then bind to the promoters and regulate the expression of genes involved in antioxidant defense and DNA damage repair [13].
The yeast S. cerevisiae seems to be an ideal model for studying the biological role of CuZnSOD. SOD1 accounts for approximately 80–90% of the total superoxide dismutase activity during yeast growth in media supplemented with glucose as a source of carbon [14]. The yeast that lacks SOD1sod1 mutant) displays a number of oxidative stress-related alterations in its phenotype as compared to the wild-type strain. These include a lower growth rate in air, inability to grow in an atmosphere of 100% oxygen in a rich cultivation medium, lysine and methionine auxotrophies [15], elevated free iron concentration [16], and inactivation of proteins containing the 4Fe-4S groups [17]. Moreover, the Δsod1 mutant exhibits an increased sensitivity to oxidative stress-inducing agents that either generate ROS, such as paraquat and menadione [18,19], or decrease the level of reduced glutathione (GSH) e.g., dithiopyridine [20] and acrolein [21]. The depletion of SOD1 was also shown to increase intracellular ROS content [22,23], promote protein carbonylation [24], and [PSI+] prion formation [25], as well as result in fragmentation of both nuclear DNA [13,26] and vacuoles [27]. In addition to the above, the SOD1 mutation was reported to stimulate the production of the cell wall chitin and to elevate sensitivity to the cell wall-perturbing agents [28]. Furthermore, the loss of either SOD1 alone or both SOD1 and SOD2 dramatically reduced the chronological and replicative lifespans of the yeast [29,30,31,32]. Interestingly, the depletion of SOD1 increased cellular GSH content [22,23], apparently as a compensatory response.
The research on the involvement and importance of superoxide dismutase in the oxidative stress protection of cells has been conducted for many years, though still many issues require better understanding. We decided to search for an explanation of the pleiotropic Δsod1 mutant phenotype in the yeast Saccharomyces cerevisiae at the proteomic level. We focused on a comparative protein electrophoretic profiling of the wild-type strain and the SOD1-lacking mutant, followed by mass-spectrometry-based identification of differentially expressed proteins. Such an approach enabled us to define the main functional protein categories responsible for the altered mutant yeast phenotype. To our best knowledge, no other study attempted to elucidate the mechanisms of complex pleiotropic effects of the Δsod1 mutation on the basis of comparative proteomics.

2. Materials and Methods

2.1. Yeast Strains and Growth Conditions

The following yeast strains were used: wild-type SP4 MATα leu1 arg4 [33], and Δsod1 mutant, isogenic to SP4, MATα leu1 arg4 sod1::natMX [34]. The yeast was grown in the standard liquid YPD medium (1% Yeast Extract, 1% Yeast Bacto-Peptone, 2% glucose) on a rotary shaker at 150 rpm, at the temperature of 28 °C.

2.2. Protein Extraction

The cells from the exponential phase of culture (~16 h) were centrifuged (4000× g, 4 min, 4 °C), washed twice with MilliQ water, and suspended in a cold homogenization buffer (20 mM phosphate buffer, pH 6.8, containing 1 mM EDTA, 0.2% DTT, and 1 mM PMSF). Then, the biomass was disrupted with 0.5 mm glass beads in 6 cycles of 30 s with intervals for cooling the sample on ice and then centrifuged (14,000× g, 15 min, 4 °C). Supernatants were transferred to fresh tubes and immediately frozen at −80 °C. Four independent biological replicates were prepared for each strain. Protein concentration was determined using the Bradford method.

2.3. Two-Dimensional Gel Electrophoresis (2-DE)

The protein samples were separated by two-dimensional gel electrophoresis. In the isoelectrofocusing step (IEF, the first dimension), the whole-cell protein extracts were loaded onto 7 cm IPG strips (Bio-Rad, Hercules, CA, USA) with pI ranging from 3 to 10. A sample of 50 µg of the protein extract was dissolved in a rehydration buffer (7 M urea, 2 M thiourea, 2% CHAPS, 0.002% bromophenol blue, 20 mM DTT, and 1% ampholyte buffer BioLyte (Bio-Rad)) to a final volume of 150 µL, and then applied onto an IPG strip. Strips were rehydrated passively for 12 h at 20 °C, followed by an isoelectrofocusing run using the Protean IEF Cell (first step: 250 V for 20 min, second step: 4000 V for 120 min, third step: 4000 V, 10,000 Volt-hours) at 20 °C with a current limit of 50 µA per strip. Prior to the SDS-PAGE, the IPG strips were equilibrated for 10 min in buffer I (1% DTT, 6 M urea, 75 mM Tris HCl, pH 8.8, 30% glycerol, 2% SDS) and then for 10 min in buffer II (2.5% iodoacetamide, 6 M urea, 75 mM Tris HCl, pH 8.8, 30% glycerol, 2% SDS). The SDS-PAGE step (the second dimension) was carried out according to Laemmli [35] using Protean II xi Cell 16 × 16 cm slab unit (Bio-Rad), using 4% stacking and 10% separating polyacrylamide gels. In order to maximize the reproducibility of the spot patterns and optimize the matching of the protein profiles, both IPG strips, obtained upon IEF of the wild-type strain and the Δsod1 mutant were placed next to each other onto one SDS-polyacrylamide gel (the “two-in-one gel” technique) and then overlaid with low melting point agarose (ReadyPrep overlay agarose, Bio-Rad). Protein electrophoretic separation was performed at 20 mA per gel, typically for 6 h. Proteins were detected with silver staining according to Jungblut and Seifert [36]. Note that three protein extracts (both WT and Δsod1) obtained upon three independent physiological experiments were used for proteome mapping and matching. To enable efficient MS analysis, additional, independent electrophoresis was carried out followed by gel staining without glutaraldehyde.

2.4. Image Analysis and Statistics

The resultant 2-DE proteome maps were digitalized and matched to identify differentiating spots. The 2-DE gel image analyses were performed using AzureSpot Analysis Software (Azure Biosystems, Dublin, CA, USA). Spot detection and matching were manually revised in the software. Protein spot intensities were normalized with regard to the total density of the gel images. For all the differentiating spots, changes in protein abundances were evaluated quantitatively based on the analysis of the respective spot intensities as determined for the Δsod1 mutant and the WT strain. In order to obtain the most reliable and repetitive data, only these spots were selected for further analyses, which had been identified as differentiating ones in all of the electrophoretic runs. Quantitative variations were statistically validated using a Student’s t-test and the statistical analysis was performed employing the SPSS 21.0 software.

2.5. Mass Spectrometry

The protein spots were excised from the gel and analysed by liquid chromatography coupled to the mass spectrometer in the Laboratory of Mass Spectrometry, Institute of Biochemistry and Biophysics, Polish Academy of Sciences (Warsaw, Poland). Samples were subjected to a standard procedure of trypsin digestion during which proteins were reduced with 100 mM DTT (30 min at 56 °C), alkylated with 0.5 M iodoacetamide (45 min in a darkroom at room temperature), and digested overnight with 10 ng/µL trypsin (Promega, Madison, WI, USA) at 37 °C. The peptide mixtures were concentrated and desalted on an RP-C18 precolumn (Waters, Budapest, Hungary), and further peptide separation was achieved on a nano-Ultra Performance Liquid Chromatography (UPLC) RP-C18 column (Waters, BEH130 C18 column, 75 µm i.d., 250 mm length) of a nanoACQUITY UPLC system, using a 160 min gradient from 5 to 30% of acetonitrile. The column outlet was directly coupled to the electrospray ionization (ESI) ion source of the Orbitrap Elite type mass spectrometer (Thermo Scientific, Waltham, MA, USA), working in the regime of data-dependent MS to MS/MS switch with HCD type peptide fragmentation. An electrospray voltage of 2 kV was used. A blank run to ensure there was no cross contamination from previous samples preceded each analysis.

2.6. Protein Identification

Raw data files were preprocessed with Mascot Distiller software (ver. 2.4.2.0, MatrixScience). The obtained peptide masses and fragmentation spectra were matched to the Saccharomyces Genome Database (SGD; 9387 sequences/4,227,730 residues) using the Mascot search engine (Mascot Daemon ver. 2.4.0, Mascot Server ver. 2.4.1, MatrixScience). The search parameters were as follows: enzyme specificity—trypsin; the protein mass was left as unrestricted; mass values as monoisotopic with one missed cleavage being allowed; peptide mass tolerance ±30 ppm; fragment mass tolerance ±0.1 Da. Alkylation of cysteine by carbamidomethylation was set as fixed and oxidation of methionine was a variable modification.

2.7. Western Blot

The protein samples were separated by SDS-PAGE and then transferred to nitrocellulose membrane (PVDF Western Blotting Membranes, Roche) by semidry immunoblotting (Bio-Rad). The presence of proteins on the membrane was confirmed by Ponceau S (Sigma-Aldrich, St. Louis, MI, USA) labeling. After blocking with PBST buffer (PBS, 0.1% Tween 20) containing 3% nonfat milk, the following primary antibodies were used: the antiyeast methionine synthase (MET6; 1:500, X-P05694-N, Abmart, Berkeley Heights, NJ, USA) and the antiyeast alcohol dehydrogenase (1:5000, ab34680, Abcam). The respective proteins were detected after incubation with the horseradish peroxidase-conjugated secondary antibodies (1:10,000, AP160P, Millipore, Merck, and 1:10,000, 111,035,003, Jackson ImmunoResearch, respectively) with a SuperSignal West PICO Chemiluminescent Substrate (Pierce Biotechnology, Waltham, MA, USA), according to the manufacturer’s protocol. The images were captured using an Azure c300 Imaging Systems.

2.8. RNA Samples

The RNA samples were obtained using a GeneMATRIX Universal RNA Purification Kit according to the manufacturer’s protocol (EURx, Gdansk, Poland). Cells from the exponential phase of culture (5 × 10⁷ cells/mL) were centrifuged, washed twice with MilliQ water, and suspended in the spheroplast buffer (1 M sorbitol, 0.1 M EDTA, 0.1% β-mercaptoethanol) containing lyticase (250 U per sample) for 30 min at 30 °C. The resultant spheroplasts were used for RNA isolation. The RNA samples were stored at −20 °C and each of them was thawed only once. The concentration and purity of RNA samples were measured with a Tecan Infinite M200 reader (Tecan Group Ltd., Männedorf, Switzerland) equipped with a NanoQuant Plate using a 260 nm/280 nm ratio.

2.9. Real-Time PCR

For first strand cDNA synthesis, 1 µg of RNA was taken using SuperScript IV VILO Master Mix with ezDNase enzyme (Thermo Fisher Scientific, Waltham, MA, USA) according to the manufacturer’s protocol, and the samples were stored at −20 °C until use. Real-time PCR was performed using LightCycler 96 (Roche Life Science, Penzberg, Germany) equipment and TaqMan chemistry. Briefly, the cDNA sample was diluted, mixed with TaqMan Fast Advanced Master Mix and TaqMan Gene Expression Assays (Applied Biosystems, Waltham, MA, USA, Life Technologies, Carlsbad, CA, USA), and PCR reaction was run in five independent repetitions. The MET6 gene expression was tested and the ACT1 gene was used as an internal control gene. The relative gene expression was calculated with the −ΔΔCT method for comparison of the individual gene expression between the WT strain and Δsod1 mutant.

3. Results

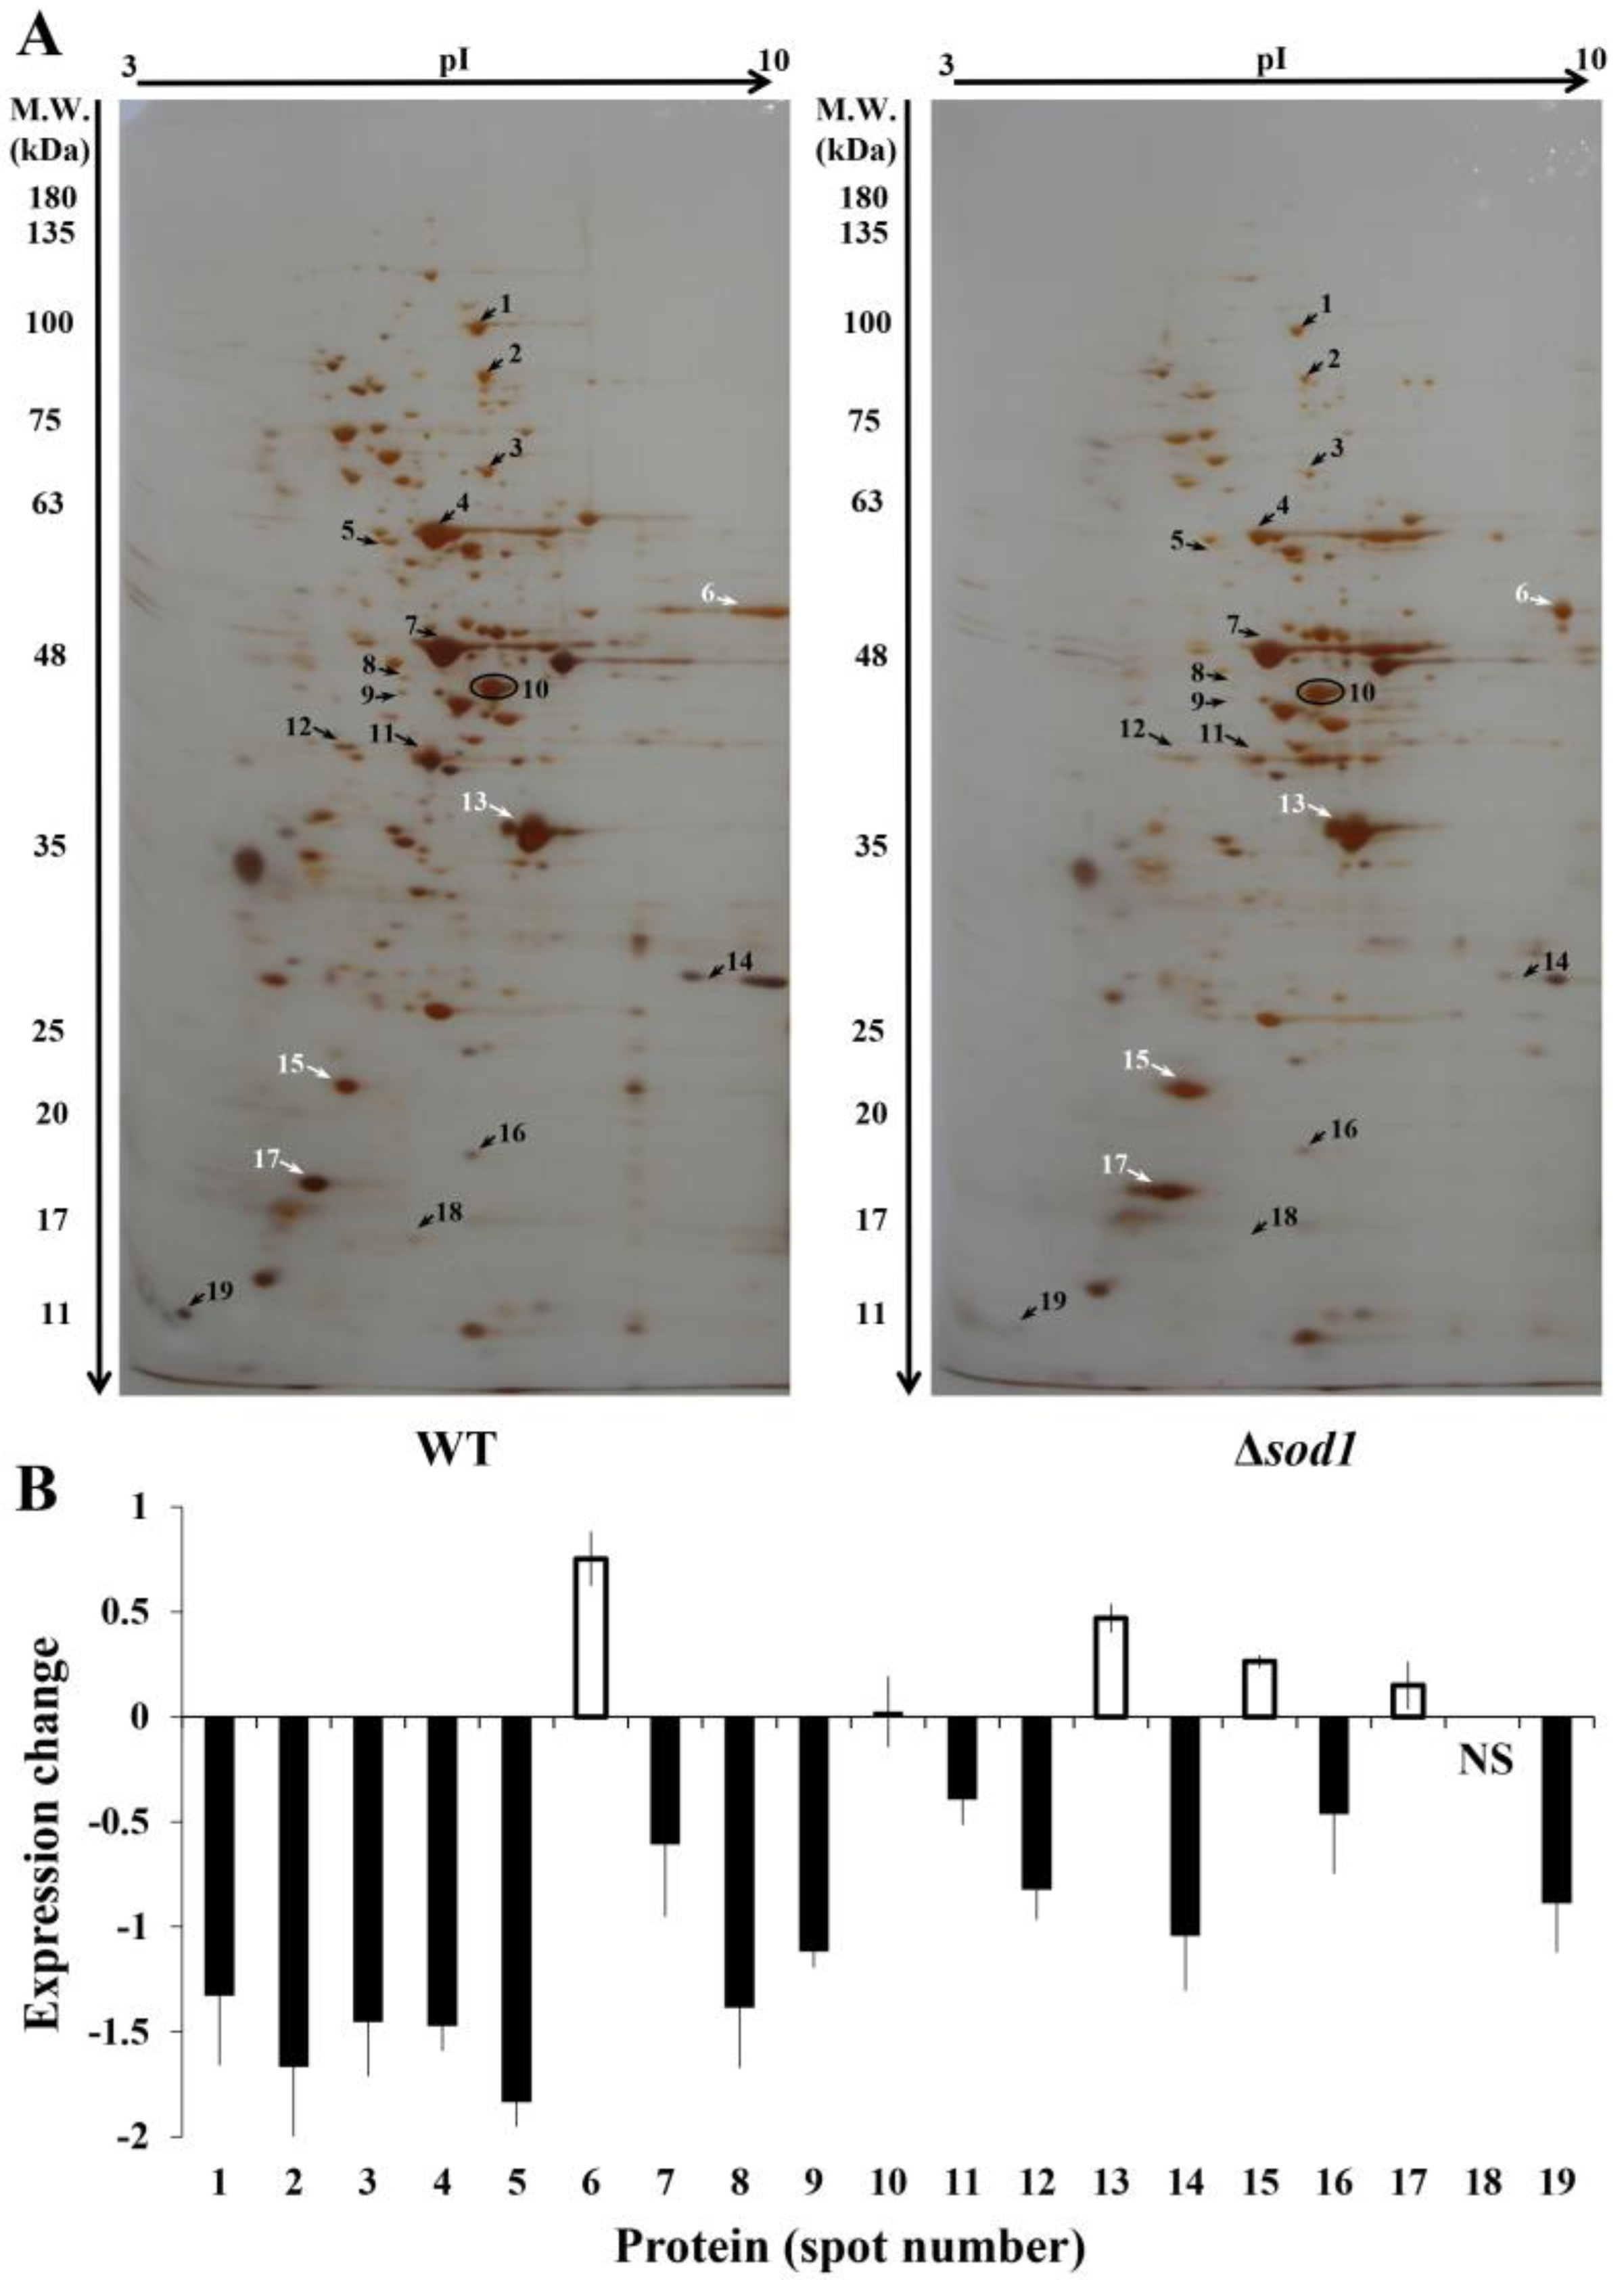
3.1. Comparative Proteome Analysis

In order to compare proteomes of the wild-type strain and the Δsod1 mutant, we performed a 2-DE analysis of the whole-cell protein extracts. For the first dimension, wide-range IPG strips were used (pI range 3–10) to enable the detection of most of the proteins involved in cellular metabolism. Eighteen electrophoretic spots with differential protein expression were detected repetitively in three independent experiments (Figure 1 and Figure S1). Fourteen of the proteins were downregulated (spots numbered 1–5, 7–9, 11, 12, 14, 16, 18, and 19 of Figure 1A, all indicated by black arrows) and four were upregulated (spots numbered 6, 13, 15 and 17 of Figure 1A, white arrows). The abundances of individual proteins were quantified by comparison of intensities of the respective spots for the Δsod1 mutant and the WT strain and were presented as the value of the expression change parameter (given as Log2 of fold) (Figure 1B). As a control, one protein (spot number 10 of Figure 1A, indicated by a circle) was chosen for further analysis, whose expression was unchanged for both strains (cf. Figure 1A,B; [37]).

3.2. Identification of Proteins

Nineteen proteins were identified with high confidence based on the scores and sequence coverage from the Saccharomyces Genome Database (SGD) (Table 1). The most abundant protein in the studied yeast extracts was ENO2 (spot number seven of Figure 1A) for which the exponentially modified Protein Abundance Index (emPAI) was 43.84 (Table 1). On the other hand, among the proteins with the least expression were TEF1/TEF2 and DYS1 (spots numbers six and eight of Figure 1A), whose emPAI were calculated as 1.01 and 1.09, respectively (Table 1).
In the case of three electrophoretic spots (numbers one, three, and six of Figure 1A), more than one protein was attributed to each particular spot. These proteins were present in the form of paralogs (spots numbered one, three and six, that is: EFT1 and EFT2; ADE17 and ADE16 as well as TEF1 and TEF2, respectively) (Table 1). Paralogous genes (proteins) are created by a duplication event and they often have a similar or the same function in the cell, though sometimes a duplicated gene may acquire new functions through mutation [38,39].
Importantly, the SOD1 protein was present, as expected, only in the WT strain and no respective spot was observed for the Δsod1 mutant (protein spot number 18 of Figure 1A). The above result proves the validity of our experimental model employed for the study. It should be pointed out here that the use of yeast strain, which was obtained by disruption of the SOD1 gene [34] allows for the assumption that all the phenotypic alterations as observed for the Δsod1 mutant are indeed effects of the lack of the single superoxide dismutase one gene and, consequently, its protein product.

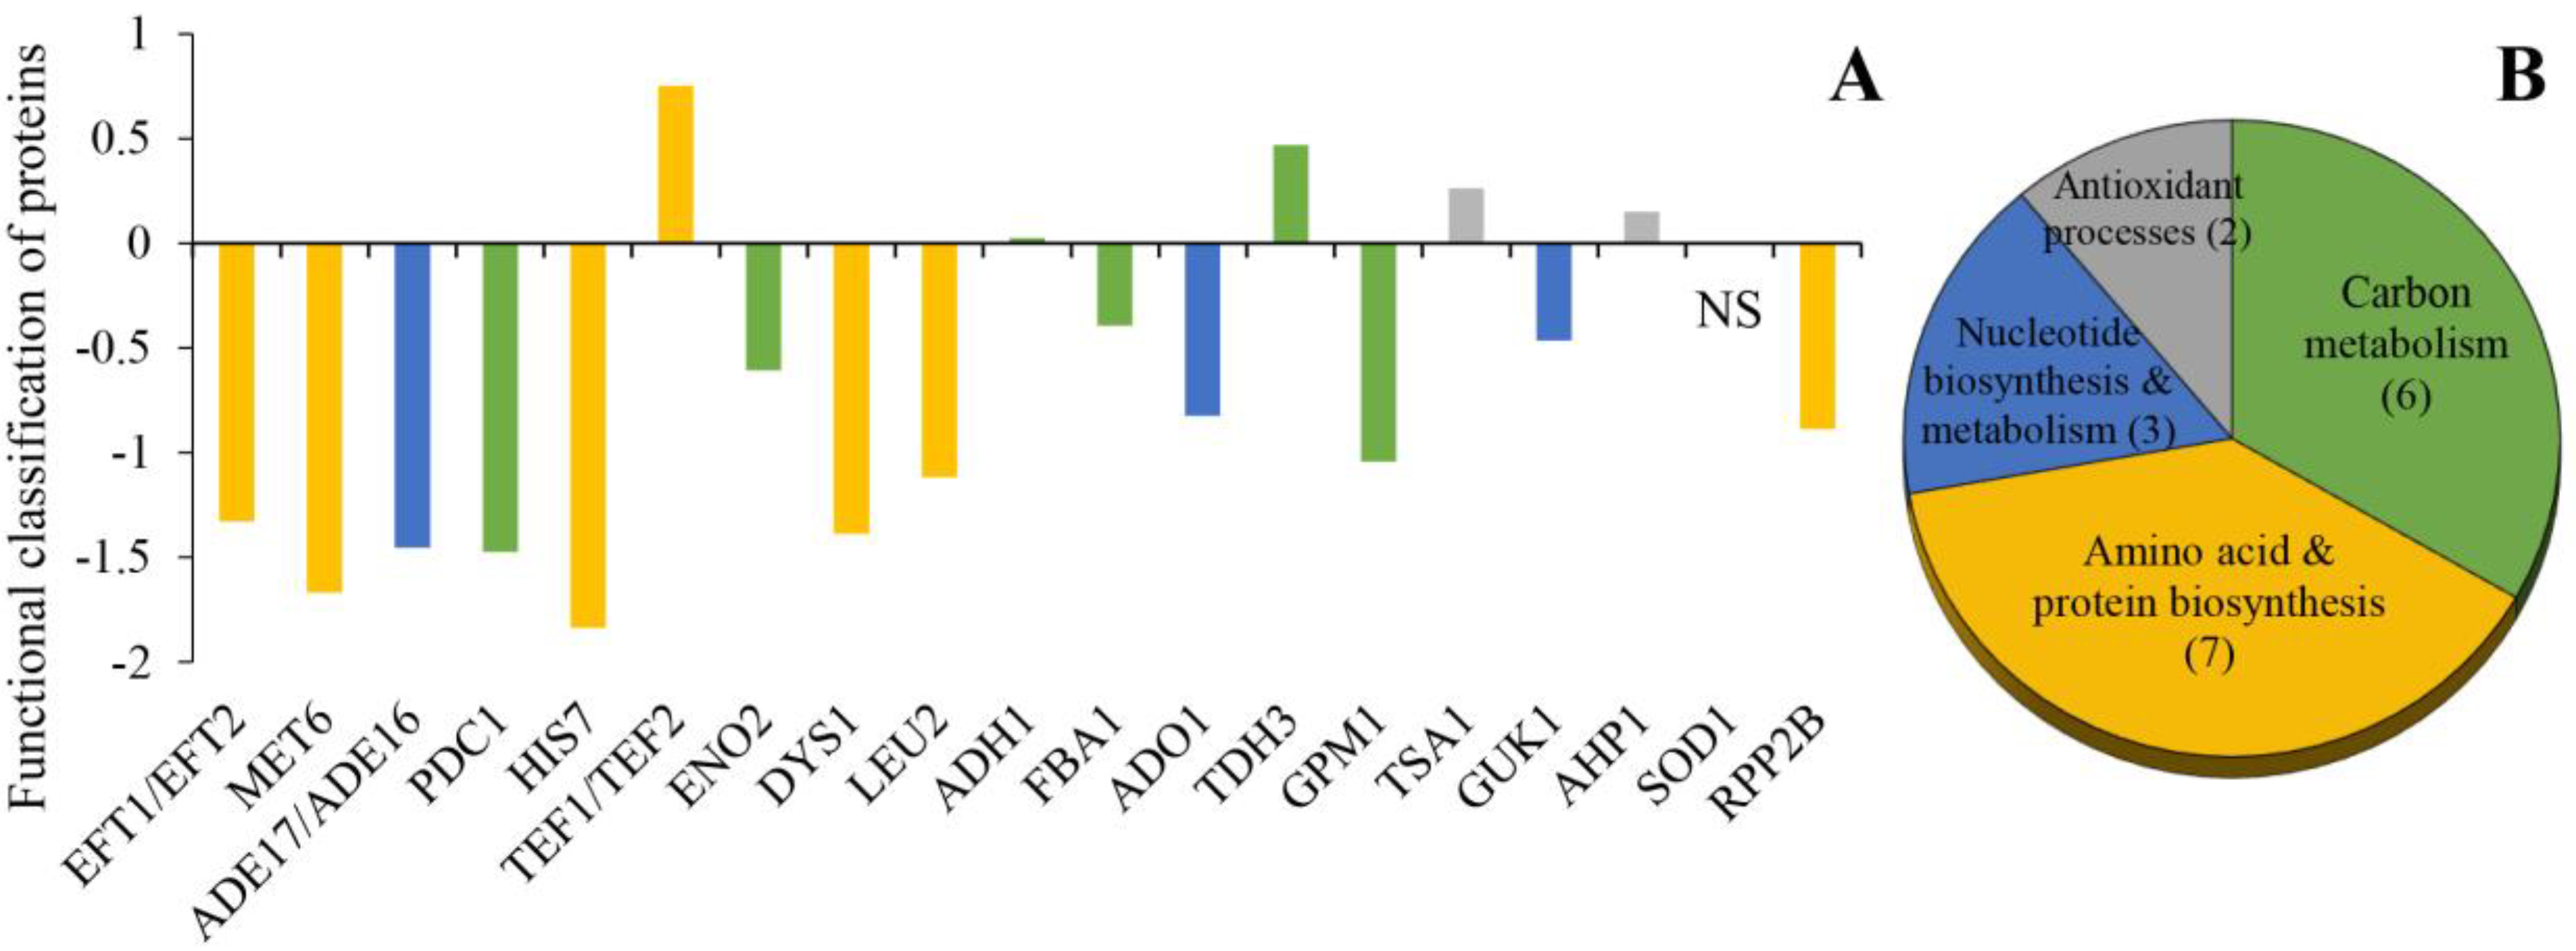
3.3. Functional Classes of the Identified Proteins

The identified proteins were divided into four different categories, namely carbon metabolism (six proteins), amino acid and protein biosynthesis (seven proteins), nucleotide biosynthesis and metabolism (three proteins), and antioxidant processes (two proteins) (Figure 2B). Proteins involved in carbon metabolism included glycolytic enzymes (FBA1, TDH3, GPM1, and ENO2) as well as enzymes involved in the conversion of pyruvate to ethanol (PDC1, ADH1) (Figure 2A). Proteins FBA1, GPM1, ENO2, and PDC1 were downregulated whereas TDH3 upregulated in the Δsod1 mutant (Figure 1 and Figure 2). In turn, the level of ADH1 protein was the same for both tested strains (Figure 1 and Figure 2). Within the next group of the identified proteins, there were those related to the biosynthesis of amino acids (MET6, LEU2, HIS7, and DYS1) and proteins (EFT1/EFT2, TEF1/TEF2, and RPP2B) (Figure 2A). The proteins MET6, LEU2, HIS7, DYS1, EFT1/EFT2, and RPP2B were downregulated and TEF1/TEF2 were upregulated in the Δsod1 mutant (Figure 1 and Figure 2). Another group contained the proteins participating in nucleotide biosynthesis and metabolism, ADE17/ADE16, ADO1, and GUK1. These proteins were downregulated in the Δsod1 mutant (Figure 1 and Figure 2). Moreover, two antioxidant proteins, TSA1 and AHP1, were detected and showed increased expression (Figure 1 and Figure 2).

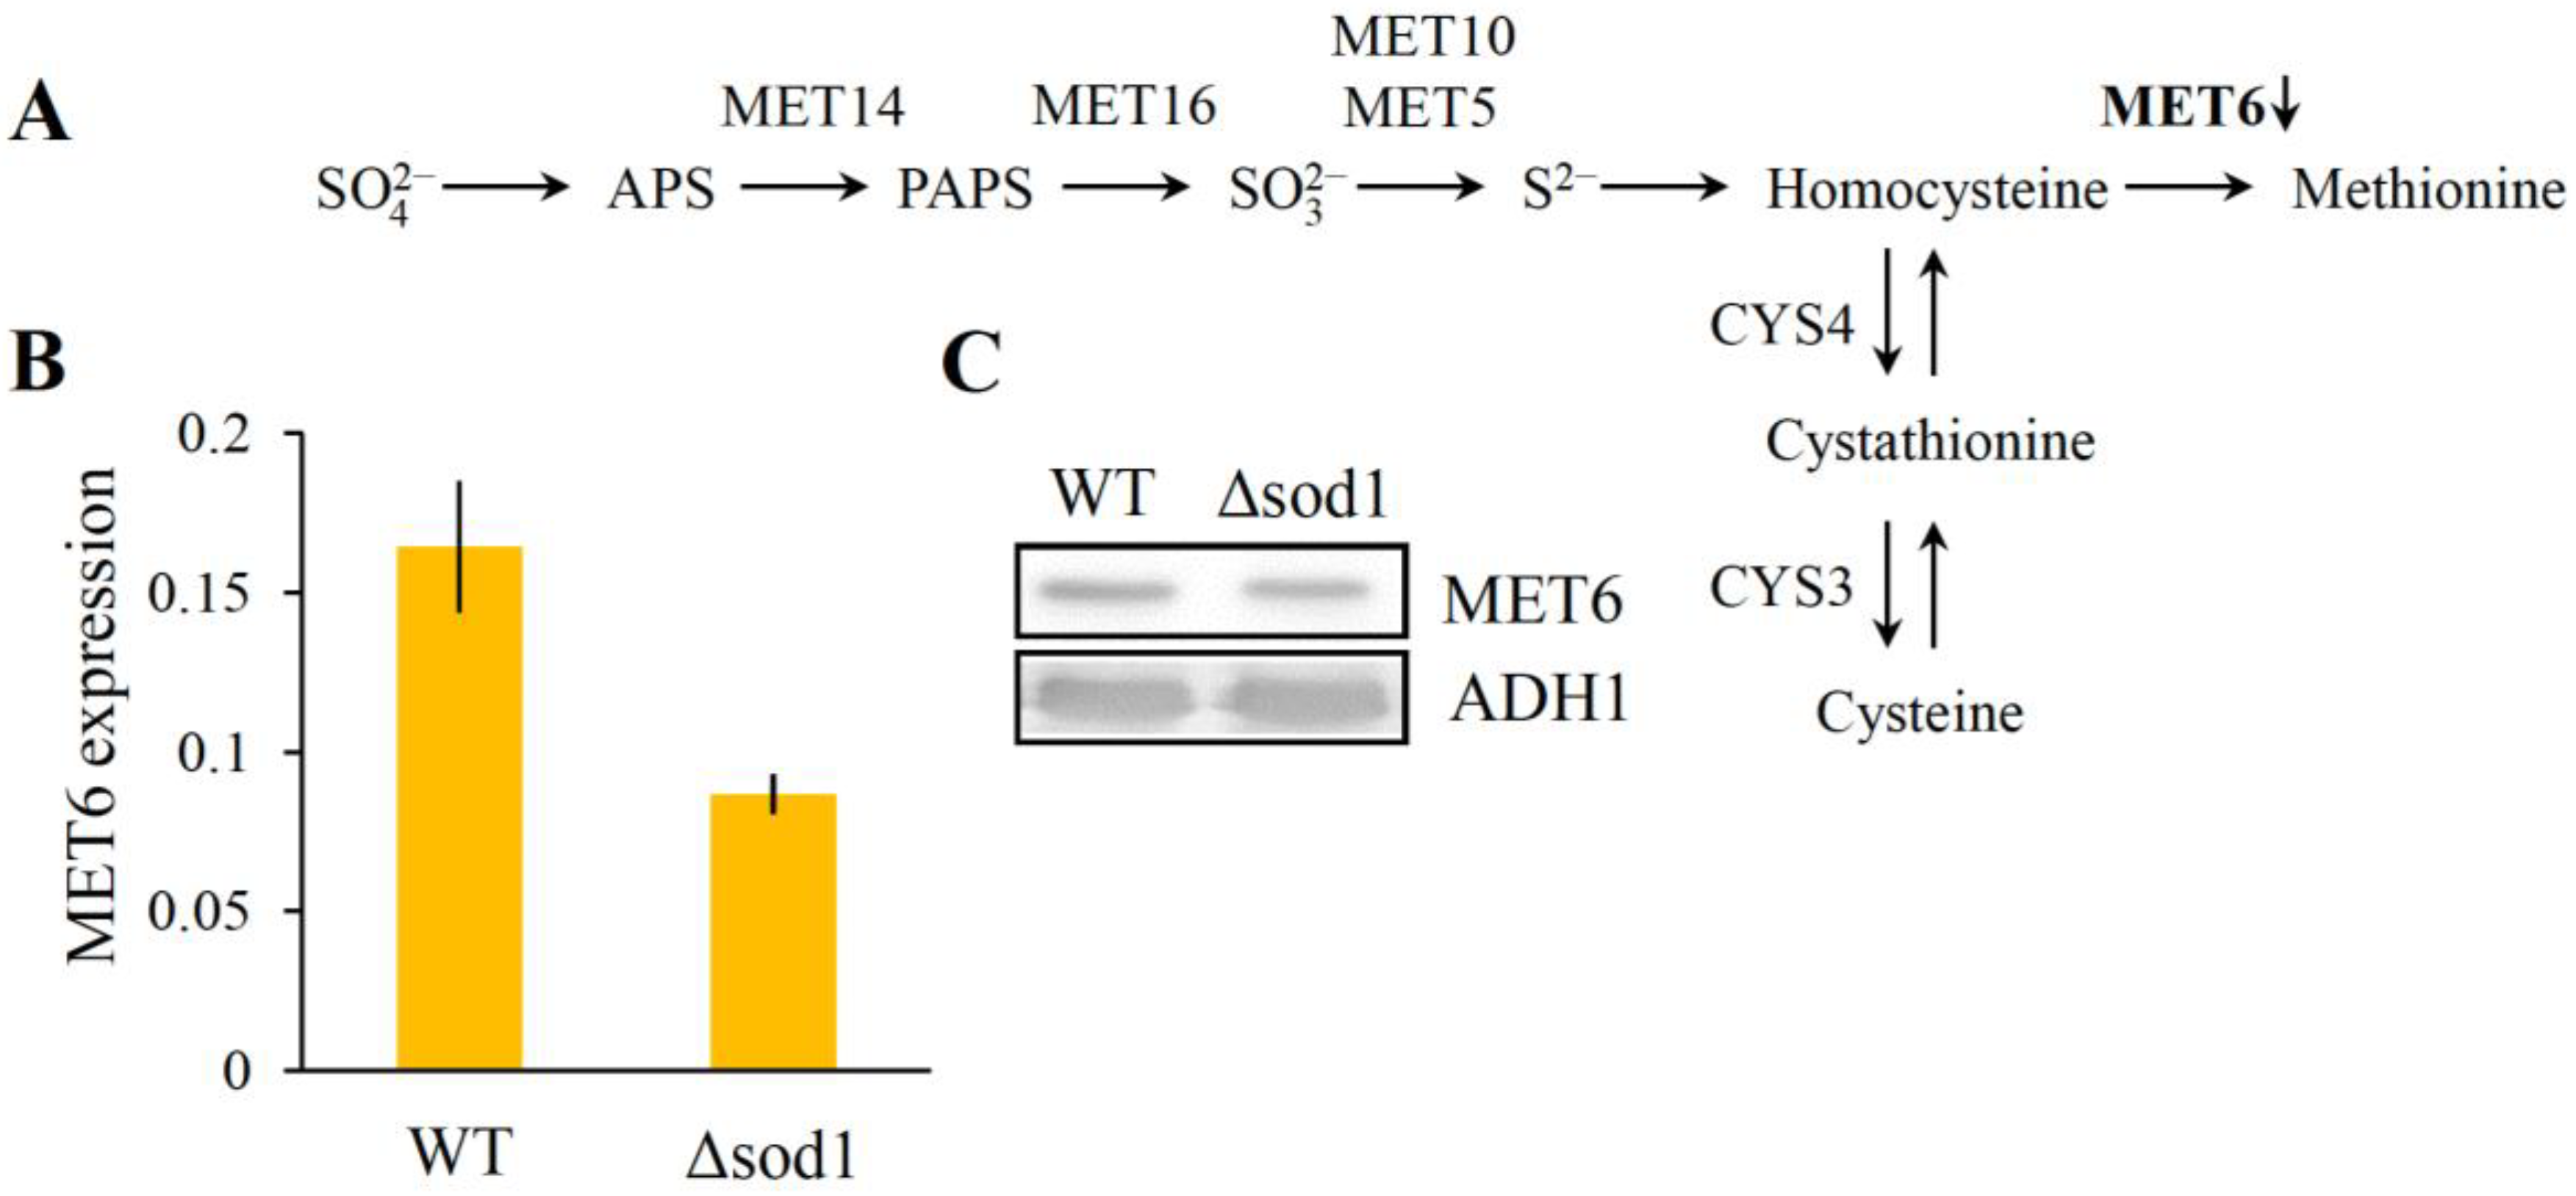
3.4. Decrease of Methionine Synthase Expression Causes Methionine Auxotrophy in the Δsod1 Mutant

The methionine synthase (MET6) is a cobalamin-independent methionine synthase involved in methionine biosynthesis and catalyzes the conversion of homocysteine to methionine (Figure 3A). The proteome analysis clearly shows that the accumulation of the MET6 protein was downregulated in the Δsod1 mutant (spot number two of Figure 1A). In order to determine the MET6 protein content, the western blot method with anti-MET6 antibodies was also employed. These results confirmed proteome analysis findings, showing a lower content of this protein in the Δsod1 mutant (Figure 3C and Figure S2). Moreover, the level of MET6 gene expression using the −ΔΔCT method for comparison to the WT strain and the Δsod1 mutant was calculated. It was shown that the expression of the MET6 gene was downregulated (1.9 times lower) in the Δsod1 mutant (Figure 3B). These results demonstrate that the decreased expression of the MET6 gene and the content of the MET6 protein may lead to methionine auxotrophy in the Δsod1 mutant.

4. Discussion

The role of superoxide dismutase in oxidative stress protection is well understood and has been thoroughly studied since the discovery of this enzyme [40]. The yeast Saccharomyces cerevisiae is a useful model for this research. The yeast strain lacking Sod1p was described for the first time by Bilinski et al. [15]. Depletion of SOD1 caused an increase in the level of intracellular superoxide and secondary ROS that were found to react with proteins, lipids, and nucleic acids. Almost 70% of all oxidized molecules in oxidatively stressed cells are of proteinaceous nature, indicating that proteins are the most prominent in vivo targets of oxidants. Protein oxidation has often been associated with the functional decline of proteins [41,42]. Therefore, in order to explain the pleiotropic effects of SOD1 deficiency in the yeast cells, we decided to compare the proteomes of the WT strain and the Δsod1 mutant employing two-dimensional gel electrophoresis. It should be noted here that previously, O’Brien et al. [24] showed the 2-DE results of mitochondrial proteins expression in the WT, Δsod1, Δsod2, and Δsod1Δsod2 mutants, as well as in the WT and Δsod1 mutant cells treated with paraquat. The authors documented that most of the protein spots had the same level of expression in both the Δsod1 mutant and the wild-type strain. Only for Idh2p, Ilv5p, Ilv2p, and Aco1p was the abundance of proteins was decreased [24]. According to our knowledge, the whole cellular proteomes of the WT yeast and the strains deficient in SOD1 have not been compared in such form yet. In our study, we used whole-cell protein extracts, which contain mainly cytosolic proteins. Eighteen proteins were observed, whose expression was altered in the Δsod1 mutant as compared to the wild-type strain (Figure 1). These proteins were found to be involved in carbon metabolism, amino acid and protein biosynthesis, nucleotide biosynthesis, and metabolism as well as antioxidant processes (Figure 2).
The glycolytic pathway plays a fundamental role in providing metabolic energy and intermediates during the fermentative growth of the yeast S. cerevisiae. Glycolytic enzymes such as FBA1, TDH3, GPM1, and ENO2 as well as PDC1, which is a key enzyme in alcoholic fermentation, were shown to have different expression levels in the Δsod1 mutant compared to the wild-type strain (Figure 1 and Figure 2). The decrease of expression of FBA1, GMP1, ENO2, and PDC1 proteins may account for the lower growth rate and altered sensitivity to various factors as earlier observed for the Δsod1 mutant [21,23,34,43]. The results of this study confirm the observations of Sehati et al. [44] relating to the metabolic alterations in the Δsod1 mutant during growth on glucose-supplemented media. The authors suggest that the increased level of superoxide anion either interferes with the cell signaling by redox-active molecules or damages key cellular components [44]. Interestingly, the level of TDH3 protein in the mutant lacking SOD1 was elevated significantly (spot number 13 of Figure 1A,B). The TDH1, TDH2, and TDH3 genes encode glyceraldehyde-3-phosphate dehydrogenase isozymes whose activity is required for both glycolysis and gluconeogenesis. The proteins Tdh2p and Tdh3p are typically present in exponentially growing cells whereas Tdh1p is primarily detected during the stationary phase [45]. As our extracts were prepared from yeast harvested at the exponential phase of growth, the above observations can explain the presence of only one of three isozymes in our model (Figure 1, Table 1). In addition to its well established metabolic function, Tdh3p has been shown to participate in several nonmetabolic processes, including DNA repair, tRNA export, regulation of mRNA stability, membrane fusion and transport, cytoskeletal dynamics, and the initiation of apoptosis [46]. Moreover, Tdh3p may interact with the NAD+-dependent histone deacetylase (Sir2) in the nucleus and promote Sir2-dependent gene silencing [47]. Overexpression of the TDH3 gene results in a decrease in the growth rate and extension of a G1 phase of the cell cycle [48]. The induction of TDH3 protein, as shown in this study (Figure 1 and Figure 2), may be one of the reasons for significant prolongation of the G1 cell cycle phase in the Δsod1 mutant, as compared to the wild-type strain (i.e., 89 min for the Δsod1 mutant and 42 min for the WT strain, both in the DBY747 genetic background; [49]). In turn, the extension of the G1 phase may lead to a prolonged generation time, which in the case of Δsod1 mutant was approximately 36% longer (i.e., 121.3 ± 4.67 min for the Δsod1 mutant and 89.2 ± 1.87 min for the WT strain, both in SP4 genetic background; [32]). Note that this effect was also observed for different genetic backgrounds [19,32,43,49].
The Δsod1 mutant exhibits methionine and lysine auxotrophies when grown in air, though not when grown anaerobically [15]. Earlier studies on the origin of the methionine auxotrophy indicate that this effect may result from the O2-dependent toxicity of sulfite (SO32−), an intermediate occurring upon normal reductive assimilation of sulfate by yeast [50]. Here, we show that the MET6 protein in the Δsod1 mutant was downregulated (spot number two of Figure 1A,B). The MET6 is a cobalamin-independent methionine synthase localized in the cytosol [51] which is involved in methionine biosynthesis (Figure 3A). Mutants that lack the MET6 gene are methionine auxotrophs [52]. Our results indicate that methionine auxotrophy in the Δsod1 mutant may not only be associated with the O2-dependent toxicity of sulfite, but also with the decreased content of the MET6 protein (Figure 1, Figure 3C and Figure S2), which is a consequence of decreased expression of the MET6 gene (Figure 3B). This hypothesis is supported by the fact that the Δsod1 mutant does not need cysteine supplementation to enable it to grow on a minimal medium since cys are formed upon the pathway, the same as that for methionine synthesis (note that MET6 is the only enzyme that differentiates these two pathways; Figure 3A, [52]). On the other hand, no changes were observed in the Δsod1 mutant as studied for the expression of proteins related to the synthesis of lysine (Figure 1). The latter fact can be explained by the different metabolic backgrounds of lysine and methionine auxotrophies. Lysine auxotrophy can be attributed to the superoxide inactivation of Lys4p, a homoaconitase catalyzing the conversion of homocitrate to homoisocitrate, which is the second step in the lysine biosynthesis pathway. Sod1p protects Lys4p against oxidation by reducing the level of the superoxide anion [17]. Therefore, we could observe a Lys auxotrophic phenotype in the Δsod1 mutant, although the expression of the Lys-relevant proteins remained unchanged. Moreover, we demonstrated a decreased expression of the LEU2 protein in the Δsod1 mutant (spot number nine of Figure 1A,B). LEU2 is a beta-isopropylmalate dehydrogenase that catalyzes the third step in leucine biosynthesis. Leucine auxotrophy for both studied strains (WT and Δsod1) is related to genetic background (SP4 MATα leu1 arg4; [33]). Lack of LEU1, the isopropylmalate isomerase that catalyzes the second step in the leucine biosynthesis, causes the repression of this pathway. Other enzymes involved in Leu biosynthesis, including LEU2, are therefore no longer required and may be present in a reduced amount. For that reason, the observed changes in the expression of the LEU2 protein (Figure 1A,B) do not lead to further changes in the Δsod1 mutant phenotype.
Another group of proteins with altered expression in the Δsod1 mutant were the ones related to the biosynthesis and metabolism of purine nucleotides. Purines are vital for cell function and cell proliferation through their effects on DNA, RNA, and ATP synthesis. ADO1 is an adenosine kinase required for the utilization of S-adenosylmethionine. This enzyme is also involved in the recycling of adenosine produced through the methyl cycle by converting it to adenosine monophosphate (AMP). The yeast strain lacking the ADO1 gene showed a reduced growth rate and revealed an extended doubling time of approximately 30% when grown in a rich medium [53]. In the present work, we provide evidence that the ADO1 protein in the Δsod1 mutant is downregulated (spot number 12 of Figure 1A,B). This is yet another factor that, in addition to the changes in carbon metabolism, may account for the Δsod1 mutant reduced growth rate and prolonged generation time. The Δsod1 mutant was also shown to accumulate less HIS7 protein relative to the WT strain (spot number five of Figure 1A,B). HIS7 is an imidazole glycerol-phosphate synthase, also called glutamine amidotransferase:cyclase, which catalyzes the fifth step in histidine biosynthesis [54]. Both the His and purine biosynthetic pathways are connected through the 5′-phosphoribosyl-5-amino-4-imidazole carboxamide (AICAR) cycle. AICAR, a byproduct of His biosynthesis, is also a purine precursor [54]. Mutants that lacked the HIS7 gene were histidine auxotrophs [55]; however, a decreased expression of His7p, as observed in our study for the Δsod1 mutant does not result in histidine auxotrophy but may account for the disturbance of purine synthesis. Here, it should be noted that the genes ADE17 and ADE16 encode AICAR transformylase isoenzymes that catalyze the penultimate step of the de novo purine biosynthesis pathway. These enzymes are bifunctional and can also produce an inosine monophosphate (IMP) cyclohydrolase activity. Ade17p is the dominant isoenzyme and appears to be an adenine-responsive enzyme, strongly repressed by adenine, whereas Ade16p is the minor isoenzyme, unresponsive to adenine levels. A disruption of the two genes resulted in adenine auxotrophy, while the expression of either gene alone was sufficient to support growth in the absence of adenine [56,57]. In this study, we have found that ADE17/ADE16 proteins were downregulated in the Δsod1 mutant (spot number three of Figure 1A,B). The lowered expression of these proteins was earlier shown to limit purine biosynthesis which, in turn, may result in a significant decrease in a relative lifespan (change in relative viability as a function of time in a stationary phase) [58]. It is known that the chronological and replicative lifespans of the Δsod1 mutant are shortened dramatically compared to the wild-type strain [29,30,31,32], and a reduced rate of purine biosynthesis may be one of the reasons for the above phenomenon. The results of this study support such an explanation since we demonstrated that the Δsod1 mutant had a decreased expression of a GUK1 protein (spot number 16 of Figure 1A,B). GUK1 is a guanylate kinase that converts guanosine monophosphate (GMP) to guanosine diphosphate (GDP). As shown earlier, the lack of the GUK1 gene led to GMP accumulation and, by a feedback mechanism, it inhibited hypoxanthine-guanine phosphoribosyltransferase activity (adenine derepression process; [59]). Therefore, the reduced expression of Guk1p may be another cause of the lower growth rate of the Δsod1 mutant when compared to the WT strain.
Changes in carbon metabolism and the deregulation of purine biosynthesis have a significant impact on the functioning of Δsod1 mutant cells, including protein biosynthesis. The altered expression of proteins involved in this process was also observed in this study (Figure 1 and Figure 2). The translation initiation factor 5A (eIF5A) is encoded by TIF51A and TIF51B paralogous genes at aerobic conditions. It is the only protein that contains an essential amino acid hypusine, formed by a posttranslational modification of a specific lysine (residue 51 in S. cerevisiae). Hypusination is a two-step process catalyzed consecutively by deoxyhypusine synthase (Dys1p) and deoxyhypusine hydroxylase, and it is absolutely required for protein function [60,61]. The DYS1 gene is essential for cell viability in yeast [62]. Here, we show that in the Δsod1, the DYS1 protein was downregulated (spot number eight of Figure 1A,B), which might decrease the hypusination of eIF5A. As documented earlier, a depletion of eIF5A in yeast resulted in a hampered protein synthesis and led to an increase in a number of G1-arrested cells [60]. Also, a significant prolongation of the Δsod1 mutant G1 phase of the cell cycle was observed [49].
In yeast, ribosomes have lateral protuberances called stalks. The stalk consists of five P proteins, P0, with a molecular mass of 34 kDa, and four small acidic proteins of 11 kDa, P1A, P1B, P2A, and P2B, all capable of forming a pentameric complex P0-(P1A-P2B)/(P1B-P2A). This structure binds to a region of 26S rRNA termed a GTPase-associated domain and plays a crucial role in protein synthesis. A P1A-P2B protein complex is a key element in stalk formation, possessing structural and functional importance, whereas the P1B-P2A protein complex is implicated in the regulation of stalk function [63]. P1/P2 heterodimers bind to P0 when both ribosomal subunits are joined and committed to translation, and they detach from the stalk just after the small and large ribosomal subunits separate from the mRNA [64]. Our study reveals downregulation of the RPP2B protein in the Δsod1 mutant (spot number 19 of Figure 1A,B), which may hinder the formation of the described protein complexes. Ribosomal translation activity regulation is based on the reversible phosphorylation of P proteins. One of the enzymes responsible for this reaction is protein kinase 60S (PK60S). Sod1p can directly influence the PK60S activity [65,66]. A mechanism of this regulation is connected with the content of amino acid clusters present in a SOD protein, similar to those occurring in the P1/P2 proteins and recognized by PK60S (competitive inhibition, [66,67]). In the case of the Δsod1 mutant, a change in P-protein phosphorylation may have a regulatory effect on the rate and function of the cell translational system, and in consequence, result in an extended time of generation and altered cell size [68,69]. Our earlier results showed that cell size in the population of the Δsod1 mutant is significantly higher than WT cells by about 5% and is in the range of 4.0–6.8 µm, whereas the WT cells take size in the range of 3.6–6.0 µm [23]. What is more, cells devoid of Sod1p show a higher rate of increase in size per generation [69]. These differences between the Δsod1 mutant and the wild-type strain were even more apparent in the case of cells arrested in the cell division phase (pheromone α-treated cells, [68]).
The ribosomal stalk interacts with the elongation factor two (EF2) which is encoded by EFT1 and EFT2 paralogous genes. EF2 catalyzes the translocation of the ribosome along the messenger RNA, presumably by stimulating ribosomal gross rearrangement that results in peptidyl-tRNA transfer and the translocation of mRNA by one codon [70,71]. Justice et al. [70] demonstrated that the use of sordatin, which acts as a selective inhibitor of fungal EF2, resulted in the inhibition of protein synthesis and led to cell death. In this work, the EFT1/EFT2 proteins were downregulated in the case of Δsod1 mutant (spot number one of Figure 1A,B), which might possibly slow down the protein synthesis and thus indirectly explain the longer time required for cell division [19,32,49]. On the other hand, the Δsod1 mutant revealed an enhanced accumulation of translational elongation factor one alpha (eEF1A) (spot number one of Figure 1A,B) which is encoded by TEF1 and TEF2 paralogous genes. eEF1A and EF2 are members of the GTPase superfamily of proteins. The eEF1A activity is stimulated by the binding of aminoacyl-tRNA, ribosomes, and most importantly, by the presence of a codon–anticodon match between the aminoacyl-tRNA and the A site codon of the ribosome-bound mRNA. The regulation of the eEF1A activity by GTPase-activating proteins and guanine-nucleotide exchange factors is important for efficient and accurate protein synthesis and, in consequence, for cell growth [72]. Interestingly, the overexpression of TEF1 or TEF2 was shown to increase cell size, interfere with the cell cycle, and slow down the yeast growth [73]. All of the above effects have been observed for the case of the SOD1-deficient mutant and were contrasted with the WT strain [32,69].
Surprisingly, among the entire group of antioxidant proteins, in the Δsod1 mutant, induction of expression was observed only for the proteins TSA1 and AHP1 (spots numbered 15 and 17 of Figure 1A, respectively; Figure 1B). Tsa1p (a thioredoxin peroxidase) and Ahp1p (a thiol-specific peroxiredoxin) are members of the peroxiredoxin family within which they have the highest and the second-highest expression levels, respectively. Peroxiredoxins (Prx) are ubiquitous thiol-specific proteins, which take part in many cellular processes. Primarily, Prx reduces hydrogen peroxide and other peroxide substrates using electrons from NADPH in the thioredoxin-dependent redox system of thiol-sulfide exchange between catalytic cysteines [74]. Moreover, Tsa1p can also act as a molecular chaperone that binds the unfolded proteins and prevents their aggregation [75,76]. The elevated expression of TSA1 and AHP1 in the Δsod1 mutant as compared to the WT strain is seemingly a cell response to ROS. The time-dependent changes in the expression of Tsa1p under oxidative stress, which could be caused by changes in protein localization, stability, translation, and by posttranslational modification, were shown previously [77]. Therefore, apart from the increased level of glutathione, the elevated levels of TSA1 and APH1 seem to contribute to the compensative reaction of Δsod1 cells, providing partial protection against oxidative stress resulting from the increased superoxide level.
The pleiotropic effects of the CuZnSOD deficiency can be conditioned on several levels, including changes in the proteome and altered regulation of activities of cellular proteins; both can result in alterations of the levels of intracellular metabolites. Our study demonstrated that many of these effects can be ascribed to the changes in the protein profile. For this reason, protein profile analysis from one side indicates the already established role of Sod1p in oxidative stress protection and from the other side suggests its less obvious role in the signaling pathways, as was recently postulated [10]. The obtained results may shed new light on the understanding of the phenotype effects resulting from Sod1p dysfunction observed in many human diseases including neurodegenerative diseases, cancer, and age-related diseases.

5. Conclusions

This study provides comparative proteome mapping of the wild-type strain and the SOD1-deficient mutant, focusing especially on the Sod1p-affected proteins in the yeast S. cerevisiae. Such an approach offers a global overview of oxidative changes elicited by the disruption of this important antioxidant enzyme. We carried out a systematic quantitative analysis of alterations detected in proteomic 2-DE maps followed by an MS-based protein identification for each differentiating spot. The results bring an explanation to some effects of SOD1 depletion in the yeast such as changes in the carbon metabolism, methionine auxotrophy, prolongation of the G1 phase of the cell cycle, extended time of generation, shortened lifespan, changes in cell size, as well as altered level of protein synthesis. Completion of these data by metabolomic analysis should allow for a better understanding of metabolic alterations caused by the lack of CuZnSOD, and thus, the biological role of this crucial antioxidant enzyme.

Supplementary Materials

The following supporting information can be downloaded at: https://www.mdpi.com/article/10.3390/metabo13030459/s1, Figure S1: Comparison of proteomes of the wild-type (WT) strain and the Δsod1 mutant which was performed by two-dimensional gel electrophoresis (2-DE) of whole-cell protein extracts; Figure S2: The methionine synthase (MET6) and alcohol dehydrogenase (ADH1) content in the wild-type (WT) strain and the Δsod1 mutant.

Author Contributions

Conceptualization, M.K.-M.; Methodology, M.K.-M., S.B., A.D.-L. and P.K.; Formal Analysis, M.K.-M.; Investigation, M.K.-M., S.B., A.D.-L. and P.K.; Resources, M.K.-M. and P.K.; Data Curation, M.K.-M.; Writing—Original Draft Preparation, M.K.-M.; Writing—Review & Editing, M.K.-M., R.Z.-T. and P.K.; Visualization, M.K.-M.; Supervision, M.K.-M.; Project Administration, M.K.-M.; Funding Acquisition, M.K.-M., R.Z.-T. and P.K. All authors have read and agreed to the published version of the manuscript.

Funding

The equipment used was sponsored in part by the Centre for Preclinical Research and Technology (CePT), a project cosponsored by the European Regional Development Fund and Innovative Economy, The National Cohesion Strategy of Poland.

Institutional Review Board Statement

Not applicable.

Informed Consent Statement

Not applicable.

Data Availability Statement

The data presented in this study are available on request from the corresponding author. The data are not publicly available due to privacy.

Conflicts of Interest

The authors declare no conflict of interest.

References

  1. Culotta, V.C.; Yang, M.; O’Halloran, T.V. Activation of superoxide dismutases: Putting the metal to the pedal. Biochim. Biophys. Acta 2006, 1763, 747–758. [Google Scholar] [CrossRef] [PubMed] [Green Version]
  2. Sturtz, L.A.; Diekert, K.; Jensen, L.T.; Lill, R.; Culotta, V.C. A fraction of yeast Cu,Zn-superoxide dismutase and its metallochaperone, CCS, localize to the intermembrane space of mitochondria. A physiological role for SOD1 in guarding against mitochondrial oxidative damage. J. Biol. Chem. 2001, 276, 38084–38089. [Google Scholar] [CrossRef] [PubMed]
  3. Herrero, E.; Ros, J.; Belli, G.; Cabiscol, E. Redox control and oxidative stress in yeast cells. Biochim. Biophys. Acta 2008, 1780, 1217–1235. [Google Scholar] [CrossRef]
  4. Kloppel, C.; Michels, C.; Zimmer, J.; Herrmann, J.M.; Riemer, J. In yeast redistribution of Sod1 to the mitochondrial intermembrane space provides protection against respiration derived oxidative stress. Biochem. Biophys. Res. Commun. 2010, 403, 114–119. [Google Scholar] [CrossRef]
  5. Wang, Y.; Branicky, R.; Noë, A.; Hekimi, S. Superoxide dismutases: Dual roles in controlling ROS damage and regulating ROS signaling. J. Cell Biol. 2018, 217, 1915–1928. [Google Scholar] [CrossRef] [PubMed] [Green Version]
  6. Montllor-Albalate, C.; Colin, A.E.; Chandrasekharan, B.; Bolaji, N.; Andersen, J.L.; Wayne Outten, F.; Reddi, A.R. Extra-mitochondrial Cu/Zn superoxide dismutase (Sod1) is dispensable for protection against oxidative stress but mediates peroxide signaling in Saccharomyces cerevisiae. Redox Biol. 2019, 21, 101064. [Google Scholar] [CrossRef]
  7. Baron, J.A.; Chen, J.S.; Culotta, V.C. Cu/Zn superoxide dismutase and the proton ATPase Pma1p of Saccharomyces cerevisiae. Biochem. Biophys. Res. Commun. 2015, 462, 251–256. [Google Scholar] [CrossRef] [Green Version]
  8. Reddi, A.R.; Culotta, V.C. SOD1 integrates signals from oxygen and glucose to repress respiration. Cell 2013, 152, 224–235. [Google Scholar] [CrossRef] [Green Version]
  9. Liu, Z.; Thornton, J.; Spírek, M.; Butow, R.A. Activation of the SPS amino acid-sensing pathway in Saccharomyces cerevisiae correlates with the phosphorylation state of a sensor component, Ptr3. Mol. Cell. Biol. 2008, 28, 551–563. [Google Scholar] [CrossRef] [Green Version]
  10. Montllor-Albalate, C.; Kim, H.; Thompson, A.E.; Jonke, A.P.; Torres, M.P.; Reddi, A.R. Sod1 integrates oxygen availability to redox regulate NADPH production and the thiol redoxome. Proc. Natl. Acad. Sci. USA 2022, 119, e2023328119. [Google Scholar] [CrossRef]
  11. Karachitos, A.; Galganska, H.; Wojtkowska, M.; Budzinska, M.; Stobienia, O.; Bartosz, G.; Kmita, H. Cu,Zn-superoxide dismutase is necessary for proper function of VDAC in Saccharomyces cerevisiae cells. FEBS Lett. 2009, 583, 449–455. [Google Scholar] [CrossRef] [PubMed] [Green Version]
  12. Magrì, A.; Di Rosa, M.C.; Tomasello, M.F.; Guarino, F.; Reina, S.; Messina, A.; De Pinto, V. Overexpression of human SOD1 in VDAC1-less yeast restores mitochondrial functionality modulating beta-barrel outer membrane protein genes. Biochim. Biophys. Acta 2016, 1857, 789–798. [Google Scholar] [CrossRef] [PubMed]
  13. Tsang, C.K.; Liu, Y.; Thomas, J.; Zhang, Y.; Zheng, X.F. Superoxide dismutase 1 acts as a nuclear transcription factor to regulate oxidative stress resistance. Nat. Commun. 2014, 5, 3446. [Google Scholar] [CrossRef] [Green Version]
  14. Reddi, A.R.; Culotta, V.C. Regulation of manganese antioxidants by nutrient sensing pathways in Saccharomyces cerevisiae. Genetics 2011, 189, 1261–1270. [Google Scholar] [CrossRef] [PubMed] [Green Version]
  15. Bilinski, T.; Krawiec, Z.; Liczmanski, A.; Litwinska, J. Is hydroxyl radical generated by the Fenton reaction in vivo? Biochem. Biophys. Res. Commun. 1985, 130, 533–539. [Google Scholar] [CrossRef]
  16. Srinivasan, C.; Liba, A.; Imlay, J.A.; Valentine, J.S.; Gralla, E.B. Yeast lacking superoxide dismutase(s) show elevated levels of “free iron” as measured by whole cell electron paramagnetic resonance. J. Biol. Chem. 2000, 275, 29187–29192. [Google Scholar] [CrossRef] [Green Version]
  17. Wallace, M.A.; Liou, L.L.; Martins, J.; Clement, M.H.; Bailey, S.; Longo, V.D.; Valentine, J.S.; Gralla, E.B. Superoxide inhibits 4Fe-4S cluster enzymes involved in amino acid biosynthesis. Cross-compartment protection by CuZn-superoxide dismutase. J. Biol. Chem. 2004, 279, 32055–32062. [Google Scholar] [CrossRef] [Green Version]
  18. Bilinski, T.; Litwinska, J.; Blaszczynski, M. Selective killing of respiratory sufficient yeast-cells by paraquat. Acta Microbiol. Pol. 1985, 34, 15–17. [Google Scholar]
  19. Gralla, E.B.; Valentine, J.S. Null mutants of Saccharomyces cerevisiae Cu,Zn superoxide dismutase: Characterization and spontaneous mutation rates. J. Bacteriol. 1991, 173, 5918–5920. [Google Scholar] [CrossRef] [Green Version]
  20. Lopez-Mirabal, H.R.; Thorsen, M.; Kielland-Brandt, M.C.; Toledano, M.B.; Winther, J.R. Cytoplasmic glutathione redox status determines survival upon exposure to the thiol-oxidant 4,4’-dipyridyl disulfide. FEMS Yeast Res. 2007, 7, 391–403. [Google Scholar] [CrossRef] [Green Version]
  21. Kwolek-Mirek, M.; Bednarska, S.; Bartosz, G.; Bilinski, T. Acrolein toxicity involves oxidative stress caused by glutathione depletion in the yeast Saccharomyces cerevisiae. Cell Biol. Toxicol. 2009, 25, 363–378. [Google Scholar] [CrossRef] [PubMed]
  22. Drakulic, T.; Temple, M.D.; Guido, R.; Jarolim, S.; Breitenbach, M.; Attfield, P.V.; Dawes, I.W. Involvement of oxidative stress response genes in redox homeostasis, the level of reactive oxygen species, and ageing in Saccharomyces cerevisiae. FEMS Yeast Res. 2005, 5, 1215–1228. [Google Scholar] [CrossRef] [PubMed] [Green Version]
  23. Maslanka, R.; Zadrag-Tecza, R.; Kwolek-Mirek, M. Linkage between Carbon Metabolism, Redox Status and Cellular Physiology in the Yeast Saccharomyces cerevisiae Devoid of SOD1 or SOD2 Gene. Genes 2020, 11, 780. [Google Scholar] [CrossRef] [PubMed]
  24. O’Brien, K.M.; Dirmeier, R.; Engle, M.; Poyton, R.O. Mitochondrial protein oxidation in yeast mutants lacking manganese-(MnSOD) or copper- and zinc-containing superoxide dismutase (CuZnSOD): Evidence that MnSOD and CuZnSOD have both unique and overlapping functions in protecting mitochondrial proteins from oxidative damage. J. Biol. Chem. 2004, 279, 51817–51827. [Google Scholar] [CrossRef] [PubMed] [Green Version]
  25. Doronina, V.A.; Staniforth, G.L.; Speldewinde, S.H.; Tuite, M.F.; Grant, C.M. Oxidative stress conditions increase the frequency of de novo formation of the yeast [PSI+] prion. Mol. Microbiol. 2015, 96, 163–174. [Google Scholar] [CrossRef] [Green Version]
  26. Muid, K.A.; Karakaya, H.C.; Koc, A. Absence of superoxide dismutase activity causes nuclear DNA fragmentation during the aging process. Biochem. Biophys. Res. Commun. 2014, 444, 260–263. [Google Scholar] [CrossRef] [Green Version]
  27. Corson, L.B.; Folmer, J.; Strain, J.J.; Culotta, V.C.; Cleveland, D.W. Oxidative Stress and Iron Are Implicated in Fragmenting Vacuoles of Saccharomyces cerevisiae Lacking Cu,Zn-Superoxide Dismutase*. J. Biol. Chem. 1999, 274, 27590–27596. [Google Scholar] [CrossRef] [Green Version]
  28. Liu, X.; Zhang, X.; Zhang, Z. Cu,Zn-superoxide dismutase is required for cell wall structure and for tolerance to cell wall-perturbing agents in Saccharomyces cerevisiae. FEBS Lett. 2010, 584, 1245–1250. [Google Scholar] [CrossRef] [Green Version]
  29. Barker, M.G.; Brimage, L.J.; Smart, K.A. Effect of Cu,Zn superoxide dismutase disruption mutation on replicative senescence in Saccharomyces cerevisiae. FEMS Microbiol. Lett. 1999, 177, 199–204. [Google Scholar] [CrossRef]
  30. Longo, V.D.; Gralla, E.B.; Valentine, J.S. Superoxide dismutase activity is essential for stationary phase survival in Saccharomyces cerevisiae. Mitochondrial production of toxic oxygen species in vivo. J. Biol. Chem. 1996, 271, 12275–12280. [Google Scholar] [CrossRef] [Green Version]
  31. Unlu, E.S.; Koc, A. Effects of deleting mitochondrial antioxidant genes on life span. Ann. N. Y. Acad. Sci. 2007, 1100, 505–509. [Google Scholar] [CrossRef] [PubMed] [Green Version]
  32. Wawryn, J.; Krzepilko, A.; Myszka, A.; Bilinski, T. Deficiency in superoxide dismutases shortens life span of yeast cells. Acta Biochim. Pol. 1999, 46, 249–253. [Google Scholar] [CrossRef] [PubMed] [Green Version]
  33. Bilinski, T.; Lukaszkiewicz, J.; Sledziewski, A. Demonstration of anaerobic catalase synthesis in the cz1 mutant of Saccharomyces cerevisiae. Biochem. Biophys. Res. Commun. 1978, 83, 1225–1233. [Google Scholar] [CrossRef]
  34. Koziol, S.; Zagulski, M.; Bilinski, T.; Bartosz, G. Antioxidants protect the yeast Saccharomyces cerevisiae against hypertonic stress. Free Radic. Res. 2005, 39, 365–371. [Google Scholar] [CrossRef]
  35. Laemmli, U.K. Cleavage of structural proteins during the assembly of the head of bacteriophage T4. Nature 1970, 227, 680–685. [Google Scholar] [CrossRef]
  36. Jungblut, P.R.; Seifert, R. Analysis by high-resolution two-dimensional electrophoresis of differentiation-dependent alterations in cytosolic protein pattern of HL-60 leukemic cells. J. Biochem. Biophys. Methods 1990, 21, 47–58. [Google Scholar] [CrossRef]
  37. Kwolek-Mirek, M.; Bednarska, S.; Dubicka-Lisowska, A.; Maslanka, R.; Zadrag-Tecza, R.; Kaszycki, P. Unbalance between Pyridine Nucleotide Cofactors in The SOD1 Deficient Yeast Saccharomyces cerevisiae Causes Hypersensitivity to Alcohols and Aldehydes. Int. J. Mol. Sci. 2023, 24, 659. [Google Scholar] [CrossRef] [PubMed]
  38. Koonin, E.V. Orthologs, paralogs, and evolutionary genomics. Annu. Rev. Genet. 2005, 39, 309–338. [Google Scholar] [CrossRef] [Green Version]
  39. Maslanka, R.; Zadrag-Tecza, R. Duplication of DNA—A mechanism for the development of new functionality of genes. Postep. Biochem. 2015, 61, 388–397. [Google Scholar]
  40. McCord, J.M.; Fridovich, I. Superoxide dismutase. An enzymic function for erythrocuprein (hemocuprein). J. Biol. Chem. 1969, 244, 6049–6055. [Google Scholar] [CrossRef]
  41. Cai, Z.; Yan, L.J. Protein Oxidative Modifications: Beneficial Roles in Disease and Health. J. Biochem. Pharmacol. Res. 2013, 1, 15–26. [Google Scholar] [PubMed]
  42. Dahl, J.U.; Gray, M.J.; Jakob, U. Protein quality control under oxidative stress conditions. J. Mol. Biol. 2015, 427, 1549–1563. [Google Scholar] [CrossRef] [PubMed] [Green Version]
  43. Das, A.B.; Sadowska-Bartosz, I.; Königstorfer, A.; Kettle, A.J.; Winterbourn, C.C. Superoxide dismutase protects ribonucleotide reductase from inactivation in yeast. Free Radic. Biol. Med. 2018, 116, 114–122. [Google Scholar] [CrossRef]
  44. Sehati, S.; Clement, M.H.; Martins, J.; Xu, L.; Longo, V.D.; Valentine, J.S.; Gralla, E.B. Metabolic alterations in yeast lacking copper-zinc superoxide dismutase. Free Radic. Biol. Med. 2011, 50, 1591–1598. [Google Scholar] [CrossRef] [PubMed] [Green Version]
  45. Delgado, M.L.; O’Connor, J.E.; Azorin, I.; Renau-Piqueras, J.; Gil, M.L.; Gozalbo, D. The glyceraldehyde-3-phosphate dehydrogenase polypeptides encoded by the Saccharomyces cerevisiae TDH1, TDH2 and TDH3 genes are also cell wall proteins. Microbiology 2001, 147, 411–417. [Google Scholar] [CrossRef] [PubMed] [Green Version]
  46. Nicholls, C.; Li, H.; Liu, J.P. GAPDH: A common enzyme with uncommon functions. Clin. Exp. Pharmacol. Physiol. 2012, 39, 674–679. [Google Scholar] [CrossRef]
  47. Ringel, A.E.; Ryznar, R.; Picariello, H.; Huang, K.L.; Lazarus, A.G.; Holmes, S.G. Yeast Tdh3 (glyceraldehyde 3-phosphate dehydrogenase) is a Sir2-interacting factor that regulates transcriptional silencing and rDNA recombination. PLoS Genet. 2013, 9, e1003871. [Google Scholar] [CrossRef] [Green Version]
  48. Stevenson, L.F.; Kennedy, B.K.; Harlow, E. A large-scale overexpression screen in Saccharomyces cerevisiae identifies previously uncharacterized cell cycle genes. Proc. Natl. Acad. Sci. USA 2001, 98, 3946–3951. [Google Scholar] [CrossRef] [Green Version]
  49. Lee, J.; Romeo, A.; Kosman, D.J. Transcriptional remodeling and G1 arrest in dioxygen stress in Saccharomyces cerevisiae. J. Biol. Chem. 1996, 271, 24885–24893. [Google Scholar] [CrossRef] [Green Version]
  50. Chang, E.C.; Kosman, D.J. O2-dependent methionine auxotrophy in Cu,Zn superoxide dismutase-deficient mutants of Saccharomyces cerevisiae. J. Bacteriol. 1990, 172, 1840–1845. [Google Scholar] [CrossRef] [Green Version]
  51. Sahu, U.; Rajendra, V.K.H.; Kapnoor, S.S.; Bhagavat, R.; Chandra, N.; Rangarajan, P.N. Methionine synthase is localized to the nucleus in Pichia pastoris and Candida albicans and to the cytoplasm in Saccharomyces cerevisiae. J. Biol. Chem. 2017, 292, 14730–14746. [Google Scholar] [CrossRef] [PubMed] [Green Version]
  52. Thomas, D.; Surdin-Kerjan, Y. Metabolism of sulfur amino acids in Saccharomyces cerevisiae. Microbiol. Mol. Biol. Rev. 1997, 61, 503–532. [Google Scholar] [PubMed]
  53. Lecoq, K.; Belloc, I.; Desgranges, C.; Daignan-Fornier, B. Role of adenosine kinase in Saccharomyces cerevisiae: Identification of the ADO1 gene and study of the mutant phenotypes. Yeast 2001, 18, 335–342. [Google Scholar] [CrossRef] [PubMed]
  54. Alifano, P.; Fani, R.; Lio, P.; Lazcano, A.; Bazzicalupo, M.; Carlomagno, M.S.; Bruni, C.B. Histidine biosynthetic pathway and genes: Structure, regulation, and evolution. Microbiol. Rev. 1996, 60, 44–69. [Google Scholar] [CrossRef]
  55. Pearce, D.A.; Sherman, F. Toxicity of copper, cobalt, and nickel salts is dependent on histidine metabolism in the yeast Saccharomyces cerevisiae. J. Bacteriol. 1999, 181, 4774–4779. [Google Scholar] [CrossRef] [Green Version]
  56. Tibbetts, A.S.; Appling, D.R. Saccharomyces cerevisiae expresses two genes encoding isozymes of 5-aminoimidazole-4-carboxamide ribonucleotide transformylase. Arch. Biochem. Biophys. 1997, 340, 195–200. [Google Scholar] [CrossRef]
  57. Tibbetts, A.S.; Appling, D.R. Characterization of two 5-aminoimidazole-4-carboxamide ribonucleotide transformylase/inosine monophosphate cyclohydrolase isozymes from Saccharomyces cerevisiae. J. Biol. Chem. 2000, 275, 20920–20927. [Google Scholar] [CrossRef] [Green Version]
  58. Garay, E.; Campos, S.E.; Gonzalez de la Cruz, J.; Gaspar, A.P.; Jinich, A.; Deluna, A. High-resolution profiling of stationary-phase survival reveals yeast longevity factors and their genetic interactions. PLoS Genet. 2014, 10, e1004168. [Google Scholar] [CrossRef] [Green Version]
  59. Lecoq, K.; Konrad, M.; Daignan-Fornier, B. Yeast GMP kinase mutants constitutively express AMP biosynthesis genes by phenocopying a hypoxanthine-guanine phosphoribosyltransferase defect. Genetics 2000, 156, 953–961. [Google Scholar] [CrossRef]
  60. Kang, H.A.; Hershey, J.W. Effect of initiation factor eIF-5A depletion on protein synthesis and proliferation of Saccharomyces cerevisiae. J. Biol. Chem. 1994, 269, 3934–3940. [Google Scholar] [CrossRef]
  61. Thompson, G.M.; Cano, V.S.; Valentini, S.R. Mapping eIF5A binding sites for Dys1 and Lia1: In Vivo evidence for regulation of eIF5A hypusination. FEBS Lett. 2003, 555, 464–468. [Google Scholar] [CrossRef] [PubMed] [Green Version]
  62. Sasaki, K.; Abid, M.R.; Miyazaki, M. Deoxyhypusine synthase gene is essential for cell viability in the yeast Saccharomyces cerevisiae. FEBS Lett. 1996, 384, 151–154. [Google Scholar] [CrossRef] [PubMed] [Green Version]
  63. Krokowski, D.; Tchorzewski, M.; Boguszewska, A.; Grankowski, N. Acquisition of a stable structure by yeast ribosomal P0 protein requires binding of P1A-P2B complex: In vitro formation of the stalk structure. Biochim. Biophys. Acta 2005, 1724, 59–70. [Google Scholar] [CrossRef]
  64. Bautista-Santos, A.; Zinker, S. The P1/P2 protein heterodimers assemble to the ribosomal stalk at the moment when the ribosome is committed to translation but not to the native 60S ribosomal subunit in Saccharomyces cerevisiae. Biochemistry 2014, 53, 4105–4112. [Google Scholar] [CrossRef] [PubMed]
  65. Abramczyk, O.; Zien, P.; Zielinski, R.; Pilecki, M.; Hellman, U.; Szyszka, R. The protein kinase 60S is a free catalytic CK2alpha’ subunit and forms an inactive complex with superoxide dismutase SOD1. Biochem. Biophys. Res. Commun. 2003, 307, 31–40. [Google Scholar] [CrossRef] [PubMed]
  66. Zielinski, R.; Pilecki, M.; Kubinski, K.; Zien, P.; Hellman, U.; Szyszka, R. Inhibition of yeast ribosomal stalk phosphorylation by Cu-Zn superoxide dismutase. Biochem. Biophys. Res. Commun. 2002, 296, 1310–1316. [Google Scholar] [CrossRef]
  67. Szyszka, R. Protein kinases phosphorylating acidic ribosomal proteins from yeast cells. Folia Microbiol. 1999, 44, 142–152. [Google Scholar] [CrossRef]
  68. Zadrag, R.; Kwolek-Mirek, M.; Bartosz, G.; Bilinski, T. Relationship between the replicative age and cell volume in Saccharomyces cerevisiae. Acta Biochim. Pol. 2006, 53, 747–751. [Google Scholar] [CrossRef] [Green Version]
  69. Zadrag-Tecza, R.; Kwolek-Mirek, M.; Bartosz, G.; Bilinski, T. Cell volume as a factor limiting the replicative lifespan of the yeast Saccharomyces cerevisiae. Biogerontology 2009, 10, 481–488. [Google Scholar] [CrossRef]
  70. Justice, M.C.; Hsu, M.J.; Tse, B.; Ku, T.; Balkovec, J.; Schmatz, D.; Nielsen, J. Elongation factor 2 as a novel target for selective inhibition of fungal protein synthesis. J. Biol. Chem. 1998, 273, 3148–3151. [Google Scholar] [CrossRef] [Green Version]
  71. Perentesis, J.P.; Phan, L.D.; Gleason, W.B.; LaPorte, D.C.; Livingston, D.M.; Bodley, J.W. Saccharomyces cerevisiae elongation factor 2. Genetic cloning, characterization of expression, and G-domain modeling. J. Biol. Chem. 1992, 267, 1190–1197. [Google Scholar] [CrossRef] [PubMed]
  72. Carr-Schmid, A.; Durko, N.; Cavallius, J.; Merrick, W.C.; Kinzy, T.G. Mutations in a GTP-binding motif of eukaryotic elongation factor 1A reduce both translational fidelity and the requirement for nucleotide exchange. J. Biol. Chem. 1999, 274, 30297–30302. [Google Scholar] [CrossRef] [PubMed] [Green Version]
  73. Munshi, R.; Kandl, K.A.; Carr-Schmid, A.; Whitacre, J.L.; Adams, A.E.; Kinzy, T.G. Overexpression of translation elongation factor 1A affects the organization and function of the actin cytoskeleton in yeast. Genetics 2001, 157, 1425–1436. [Google Scholar]
  74. Park, S.G.; Cha, M.K.; Jeong, W.; Kim, I.H. Distinct physiological functions of thiol peroxidase isoenzymes in Saccharomyces cerevisiae. J. Biol. Chem. 2000, 275, 5723–5732. [Google Scholar] [CrossRef] [Green Version]
  75. MacDiarmid, C.W.; Taggart, J.; Kerdsomboon, K.; Kubisiak, M.; Panascharoen, S.; Schelble, K.; Eide, D.J. Peroxiredoxin chaperone activity is critical for protein homeostasis in zinc-deficient yeast. J. Biol. Chem. 2013, 288, 31313–31327. [Google Scholar] [CrossRef] [PubMed] [Green Version]
  76. Weids, A.J.; Grant, C.M. The yeast peroxiredoxin Tsa1 protects against protein-aggregate-induced oxidative stress. J. Cell Sci. 2014, 127, 1327–1335. [Google Scholar] [CrossRef] [Green Version]
  77. Vogel, C.; Silva, G.M.; Marcotte, E.M. Protein expression regulation under oxidative stress. Mol. Cell. Proteom. 2011, 10, M111.009217. [Google Scholar] [CrossRef] [Green Version]
Figure 1. Comparison of the WT strain and Δsod1 mutant proteomes (A) Representative two-dimensional gel electrophoresis of protein extracts of the WT strain (lefthand side of the gel) and the Δsod1 mutant (righthand side of the gel). Differentially expressed proteins are indicated in the gels with respective numbers. Downregulated proteins are indicated by black arrows and upregulated ones by white arrows. Protein spot number 10 is a control (indicated by a circle). (B) Expression change (Log2 of fold) of proteins was calculated for the respective protein 2-DE spots of the Δsod1 mutant and the WT strain. Data are presented as a mean ± SD of three independent experiments. NS—no protein spot for the Δsod1 mutant.
Metabolites 13 00459 g001
Figure 2. Functional classification of proteins with altered expression in the Δsod1 mutant. (A) Identified proteins are divided into four functional categories: carbon metabolism—marked in green, amino acid and protein biosynthesis—marked in yellow, nucleotide biosynthesis and metabolism—marked in blue and antioxidant processes—marked in violet. Values above and below zero on the graph indicate protein up- and downregulated, respectively. NS—no protein spot for the Δsod1 mutant. (B) Number of identified proteins in each category and the proportion between them are shown in the pie chart.
Metabolites 13 00459 g002
Figure 3. The level of methionine synthase (MET6) in the WT strain and Δsod1 mutant. (A) Biosynthesis of sulfur amino acids. APS—5′-adenylylsulfate; PAPS—3′-phospho-5′-adenylylsulfate; MET14—APS kinase; MET16—PAPS reductase; MET10—α-subunit of sulfite reductase complex; MET5—β-subunit of sulfite reductase; CYS4—cystathionine β-synthase; CYS3—cystathionine γ-lyase; downward arrow indicates protein downregulation in the Δsod1 mutant compared to the WT strain. (B) The expression of the MET6 gene and (C) the content of MET6 protein in the WT strain and the Δsod1 mutant.
Metabolites 13 00459 g003
Table 1. List of proteins identified by mass spectrometry analysis.
SpotAccession Number (ORF)Protein NameDescriptionMolecular Mass [kDa]pI bMOWSE
Score
Number
of Peptides Matched
Sequence Coverage [%]emPAI
Calculated aTheoretical b
1.YOR133W
YDR385W
EFT1
EFT2 p
Elongation factor 2
Elongation factor 2
93.69
93.69
93.28
93.28
6.23
6.23
3559
3559
72
72
39
39
5.85
5.85
2.YER091CMET6Cobalamin-independent methionine synthase85.9885.856.41370364355.02
3.YMR120C
YLR028C
ADE17
ADE16 p
Enzyme of ‘de novo’ purine biosynthesis
65.56
65.64
65.26
65.28
6.52
6.52
2280
1075
41
18
26
14
4.02
1.19
4.YLR044CPDC1Major of three pyruvate decarboxylase isoenzymes61.6861.496.11285654194.54
5.YBR248CHIS7Imidazole glycerol phosphate synthase61.5461.055.15121922181.83
6.YPR080W
YBR118W
TEF1
TEF2 p
Translational elongation factor 1 alpha
50.40
50.40
50.04
50.04
9.58
9.58
684
684
16
16
10
10
1.01
1.01
7.YHR174WENO2Enolase II, a phosphopyruvate hydratase46.9446.915.8597161503543.84
8.YHR068WDYS1Deoxyhypusine synthase43.2642.885.496431191.09
9.YCL018WLEU2Beta-isopropylmalate dehydrogenase39.0438.955.4887216152.67
10.YOL086CADH1Alcohol dehydrogenase I37.2836.846.67428689209.83
11.YKL060CFBA1Fructose 1,6-bisphosphate aldolase39.8839.615.59104318112.05
12.YJR105WADO1Adenosine kinase36.5236.364.77104715101.84
13.YGR192CTDH3Glyceraldehyde-3-phosphate dehydrogenase35.8435.746.96197839217.35
14.YKL152CGPM1Tetrameric phosphoglycerate mutase27.5927.619.3470613102.92
15.YML028WTSA1Thioredoxin peroxidase21.6921.584.779572093.88
16.YDR454CGUK1Guanylate kinase20.6820.647.347891572.88
17.YLR109WAHP1Thiol-specific peroxiredoxin19.2719.114.788311393.99
18.YJR104CSOD1Cytosolic copper-zinc superoxide dismutase15.9615.855.9196316109.06
19.YDR382WRPP2BRibosomal protein P2 beta11.0411.033.807931131.27
a Molecular mass as calculated by mass spectrometry analysis, b Molecular mass and pI as given in the Saccharomyces Genome Database, p Paralogous proteins.
Disclaimer/Publisher’s Note: The statements, opinions and data contained in all publications are solely those of the individual author(s) and contributor(s) and not of MDPI and/or the editor(s). MDPI and/or the editor(s) disclaim responsibility for any injury to people or property resulting from any ideas, methods, instructions or products referred to in the content.

