
Relation between Selected Sleep Parameters, Depression, Anti-Tumor Necrosis Factor Therapy, and the Brain-Derived Neurotrophic Factor Pathway in Inflammatory Bowel Disease
 , , , and
Abstract
:1. Introduction
2. Materials and Methods
2.1. Recruitment and Patient Eligibility
2.2. Acquisition of Material
2.3. Assessment of Disease Severity and Psychological Variables
2.4. Anti-TNF Therapy
2.5. Evaluation of Gene Expression and Protein Concentration
2.6. Statistical Analysis
3. Results
4. Discussion
Author Contributions
Funding
Institutional Review Board Statement
Informed Consent Statement
Data Availability Statement
Conflicts of Interest
References
- Uździcki, A.W.; Wawrzynowicz-Syczewska, M. Characteristic features of ulcerative colitis with concomitant primary sclerosing cholangitis. Gastroenterol. Rev./Przegląd Gastroenterol. 2021, 16, 184–187. [Google Scholar] [CrossRef]
- Łodyga, M.; Eder, P.; Gawron-Kiszka, M.; Dobrowolska, A.; Gonciarz, M.; Hartleb, M.; Kłopocka, M.; Małecka-Wojciesko, E.; Radwan, P.; Reguła, J.; et al. Guidelines for the management of patients with Crohn’s disease. Recommendations of the Polish Society of Gastroenterology and the Polish National Consultant in Gastroenterology. Gastroenterol. Rev./Przegląd Gastroenterol. 2021, 16, 257–296. [Google Scholar] [CrossRef]
- Bisgaard, T.H.; Allin, K.H.; Keefer, L.; Ananthakrishnan, A.N.; Jess, T. Depression and anxiety in inflammatory bowel disease: Epidemiology, mechanisms and treatment. Nat. Rev. Gastroenterol. Hepatol. 2022, 19, 717–726. [Google Scholar] [CrossRef]
- Ditmer, M.; Gabryelska, A.; Turkiewicz, S.; Białasiewicz, P.; Małecka-Wojciesko, E.; Sochal, M. Sleep Problems in Chronic Inflammatory Diseases: Prevalence, Treatment, and New Perspectives: A Narrative Review. J. Clin. Med. 2022, 11, 67. [Google Scholar] [CrossRef]
- Araki, M.; Shinzaki, S.; Yamada, T.; Arimitsu, S.; Komori, M.; Shibukawa, N.; Mukai, A.; Nakajima, S.; Kinoshita, K.; Kitamura, S.; et al. Psychologic stress and disease activity in patients with inflammatory bowel disease: A multicenter cross-sectional study. PLoS ONE 2020, 15, e0233365. [Google Scholar] [CrossRef]
- Sakuragi, S.; Tominaga-Yoshino, K.; Ogura, A. Involvement of TrkB- and p75(NTR)-signaling pathways in two contrasting forms of long-lasting synaptic plasticity. Sci. Rep. 2013, 3, 3185. [Google Scholar] [CrossRef] [PubMed] [Green Version]
- Orhurhu, V.; Chu, R.; Ogunsola, S.; Akpala, L.; Orhurhu, M.S.; Urits, I.; Ngo, A.L.; Viswanath, O.; Kaye, A.D. The role of peripheral brain-derived neurotrophic factor in chronic osteoarthritic joint pain. Ann. Palliat. Med. 2020, 9, 1361–1365. [Google Scholar] [CrossRef] [PubMed]
- Meeker, R.B.; Williams, K.S. The p75 neurotrophin receptor: At the crossroad of neural repair and death. Neural. Regen. Res. 2015, 10, 721–725. [Google Scholar] [CrossRef] [PubMed]
- Martinowich, K.; Manji, H.; Lu, B. New insights into BDNF function in depression and anxiety. Nat. Neurosci. 2007, 10, 1089–1093. [Google Scholar] [CrossRef]
- Mongrain, V.; Warby, S.C. Determinants of Cortical Synchrony. Sleep 2012, 35, 309–310. [Google Scholar] [CrossRef] [Green Version]
- Silva Junior, J.F.; Eckeli, A.L.; Ribeiro, C.C.C.; Batista, R.F.L.; da Silva, A.A.M.; Alves, C.M.C. Influence of excessive daily sleeping and sleep quality on BDNF and NGF serum levels in adolescents. Sleep Med. 2021, 84, 415–423. [Google Scholar] [CrossRef]
- Schmitt, K.; Holsboer-Trachsler, E.; Eckert, A. BDNF in sleep, insomnia, and sleep deprivation. Ann. Med. 2016, 48, 42–51. [Google Scholar] [CrossRef]
- Castrén, E.; Monteggia, L.M. Brain-Derived Neurotrophic Factor Signaling in Depression and Antidepressant Action. Biol. Psychiatry 2021, 90, 128–136. [Google Scholar] [CrossRef]
- Monteiro, B.C.; Monteiro, S.; Candida, M.; Adler, N.; Paes, F.; Rocha, N.; Nardi, A.E.; Murillo-Rodriguez, E.; Machado, S. Relationship Between Brain-Derived Neurotrofic Factor (Bdnf) and Sleep on Depression: A Critical Review. Clin. Pract. Epidemiol. Ment. Health 2017, 13, 213–219. [Google Scholar] [CrossRef]
- Sochal, M.; Bialasiewicz, P.; Gabryelska, A.; Fichna, J.; Talar-Wojnarowska, R.; Małecka-Panas, E. Association between brain-derived neurotrophic factor and symptoms of insomnia and depression in inflammatory bowel disease (IBD) patients. Eur. Psychiatry 2021, 64, S554. [Google Scholar] [CrossRef]
- Esteban, I.; Hannestad, J.; Levanti, B.; Del Valle, M.E.; Naves, F.J.; Vega, J.A. Neurotrophin receptor proteins immunoreactivity in human gastrointestinal endocrine cells. Brain Res. Bull. 1995, 38, 539–543. [Google Scholar] [CrossRef] [PubMed]
- Grider, J.R.; Piland, B.E.; Gulick, M.A.; Qiao, L.Y. Brain-Derived Neurotrophic Factor Augments Peristalsis by Augmenting 5-HT and Calcitonin Gene-Related Peptide Release. Gastroenterology 2006, 130, 771–780. [Google Scholar] [CrossRef]
- Levanti, M.B.; Esteban, I.; Ciriaco, E.; Pérez-Piñera, P.; Cabo, R.; García-Suarez, O.; Pardo, B.; Silos-Santiago, I.; Cobo, J.; Vega, J.A. Enteric glial cells express full-length TrkB and depend on TrkB expression for normal development. Neurosci. Lett. 2009, 454, 16–21. [Google Scholar] [CrossRef] [PubMed]
- Capoccia, E.; Cirillo, C.; Gigli, S.; Pesce, M.; D’Alessandro, A.; Cuomo, R.; Sarnelli, G.; Steardo, L.; Esposito, G. Enteric glia: A new player in inflammatory bowel diseases. Int. J. Immunopathol. Pharmacol. 2015, 28, 443–451. [Google Scholar] [CrossRef] [Green Version]
- Xu, G.; Sun, Y.; He, H.; Xue, Q.; Liu, Y.; Dong, L. Effect of TrkB-PLC/IP3 pathway on intestinal inflammatory factors and enterocyte apoptosis in mice with colitis. Acta Biochim. Biophys. Sin. 2020, 52, 675–682. [Google Scholar] [CrossRef]
- Yamamori, H.; Hashimoto, R.; Ishima, T.; Kishi, F.; Yasuda, Y.; Ohi, K.; Fujimoto, M.; Umeda-Yano, S.; Ito, A.; Hashimoto, K.; et al. Plasma levels of mature brain-derived neurotrophic factor (BDNF) and matrix metalloproteinase-9 (MMP-9) in treatment-resistant schizophrenia treated with clozapine. Neurosci. Lett. 2013, 556, 37–41. [Google Scholar] [CrossRef] [Green Version]
- Medina, C.; Radomski, M.W. Role of matrix metalloproteinases in intestinal inflammation. J. Pharmacol. Exp. Ther. 2006, 318, 933–938. [Google Scholar] [CrossRef] [Green Version]
- Prakash, Y.S.; Thompson, M.A.; Pabelick, C.M. Brain-derived neurotrophic factor in TNF-alpha modulation of Ca2+ in human airway smooth muscle. Am. J. Respir. Cell Mol. Biol. 2009, 41, 603–611. [Google Scholar] [CrossRef] [PubMed] [Green Version]
- Al Qudah, M.; Alfaqih, M.; Al-Shboul, O.; Saadeh, R.; Al-Dwairi, A. Effect of cytokine treatment on the expression and secretion of brain derived neurotrophic factor in the smooth muscle of the rat colon. Biomed. Rep. 2020, 13, 55–60. [Google Scholar] [CrossRef] [PubMed]
- Sochal, M.; Krzywdzińska, M.; Gabryelska, A.; Talar-Wojnarowska, R.; Małecka-Panas, E. Efficiency and safety of one-year anti-TNF-α treatment in Crohn’s disease: A Polish single-centre experience. Gastroenterol. Rev./Przegląd Gastroenterol. 2020, 15, 156–160. [Google Scholar] [CrossRef]
- Peyrin-Biroulet, L. Anti-TNF therapy in inflammatory bowel diseases: A huge review. Minerva Gastroenterol. Dietol. 2010, 56, 233–243. [Google Scholar] [PubMed]
- Sochal, M.; Małecka-Panas, E.; Gabryelska, A.; Fichna, J.; Talar-Wojnarowska, R.; Szmyd, B.; Białasiewicz, P. Brain-derived neurotrophic factor is elevated in the blood serum of Crohn’s disease patients, but is not influenced by anti-TNF-α treatment—A pilot study. Neurogastroenterol. Motil. 2021, 33, e13978. [Google Scholar] [CrossRef] [PubMed]
- Beck, A.T.; Ward, C.H.; Mendelson, M.; Mock, J.; Erbaugh, J. An inventory for measuring depression. Arch. Gen. Psychiatry 1961, 4, 561–571. [Google Scholar] [CrossRef] [PubMed] [Green Version]
- Soldatos, C.R.; Dikeos, D.G.; Paparrigopoulos, T.J. Athens Insomnia Scale: Validation of an instrument based on ICD-10 criteria. J. Psychosom. Res. 2000, 48, 555–560. [Google Scholar] [CrossRef] [PubMed]
- Fornal-Pawłowska, M.; Wołyńczyk-Gmaj, D.; Szelenberger, W. Validation of the Polish version of the Athens Insomnia Scale. Psychiatr. Pol. 2011, 45, 211–221. [Google Scholar]
- Buysse, D.J.; Reynolds, C.F., 3rd; Monk, T.H.; Berman, S.R.; Kupfer, D.J. The Pittsburgh Sleep Quality Index: A new instrument for psychiatric practice and research. Psychiatry Res. 1989, 28, 193–213. [Google Scholar] [CrossRef] [PubMed]
- Johns, M.W. A new method for measuring daytime sleepiness: The Epworth sleepiness scale. Sleep 1991, 14, 540–545. [Google Scholar] [CrossRef] [Green Version]
- Harvey, R.F.; Bradshaw, J.M. A simple index of Crohn’s-disease activity. Lancet 1980, 1, 514. [Google Scholar] [CrossRef] [PubMed]
- Lewis, J.D.; Chuai, S.; Nessel, L.; Lichtenstein, G.R.; Aberra, F.N.; Ellenberg, J.H. Use of the noninvasive components of the Mayo score to assess clinical response in ulcerative colitis. Inflamm. Bowel. Dis. 2008, 14, 1660–1666. [Google Scholar] [CrossRef] [PubMed] [Green Version]
- Schmittgen, T.D.; Livak, K.J. Analyzing real-time PCR data by the comparative CT method. Nat. Protoc. 2008, 3, 1101–1108. [Google Scholar] [CrossRef] [PubMed]
- Coates, M.D.; Tekin, I.; Vrana, K.E.; Mawe, G.M. Review article: The many potential roles of intestinal serotonin (5-hydroxytryptamine, 5-HT) signalling in inflammatory bowel disease. Aliment. Pharmacol. Ther. 2017, 46, 569–580. [Google Scholar] [CrossRef] [Green Version]
- Steinkamp, M.; Schulte, N.; Spaniol, U.; Pflüger, C.; Hartmann, C.; Kirsch, J.; von Boyen, G.B. Brain derived neurotrophic factor inhibits apoptosis in enteric glia during gut inflammation. Med. Sci. Monit. 2012, 18, Br117–Br122. [Google Scholar] [CrossRef] [Green Version]
- Al-Qudah, M.; Shammala, D.A.; Al-Dwairi, A.; Al-Shboul, O.; Mustafa, A.G. Dextran sodium sulphate (DSS)-induced colitis alters the expression of neurotrophins in smooth muscle cells of rat colon. Physiol. Res. 2017, 66, 1009–1020. [Google Scholar] [CrossRef]
- Fujiwara, T.; Kono, S.; Katakura, K.; Abe, K.; Takahashi, A.; Gunji, N.; Yokokawa, A.; Kawashima, K.; Suzuki, R.; Wada, A.; et al. Evaluation of Brain Activity Using Near-infrared Spectroscopy in Inflammatory Bowel Disease Patients. Sci. Rep. 2018, 8, 402. [Google Scholar] [CrossRef] [Green Version]
- Chauhan, V.S.; Khan, S.A.; Kulhari, K. Correlation of brain-derived neurotrophic factor with severity of depression and treatment response. Med. J. Armed Forces India 2020. article published online. [Google Scholar] [CrossRef]
- Ristevska-Dimitrovska, G.; Shishkov, R.; Gerazova, V.P.; Vujovik, V.; Stefanovski, B.; Novotni, A.; Marinov, P.; Filov, I. Different serum BDNF levels in depression: Results from BDNF studies in FYR Macedonia and Bulgaria. Psychiatr Danub. 2013, 25, 123–127. [Google Scholar] [PubMed]
- Ballesio, A.; Zagaria, A.; Curti, D.G.; Moran, R.; Goadsby, P.J.; Rosenzweig, I.; Lombardo, C. Peripheral brain-derived neurotrophic factor (BDNF) in insomnia: A systematic review and meta-analysis. Sleep Med. Rev. 2022, 67, 101738. [Google Scholar] [CrossRef]
- More, C.E.; Papp, C.; Harsanyi, S.; Gesztelyi, R.; Mikaczo, A.; Tajti, G.; Kardos, L.; Seres, I.; Lorincz, H.; Csapo, K.; et al. Altered irisin/BDNF axis parallels excessive daytime sleepiness in obstructive sleep apnea patients. Respir. Res. 2019, 20, 67. [Google Scholar] [CrossRef] [PubMed] [Green Version]
- Gabryelska, A.; Turkiewicz, S.; Ditmer, M.; Karuga, F.F.; Strzelecki, D.; Białasiewicz, P.; Sochal, M. BDNF and proBDNF Serum Protein Levels in Obstructive Sleep Apnea Patients and Their Involvement in Insomnia and Depression Symptoms. J. Clin. Med. 2022, 11, 7135. [Google Scholar] [CrossRef]
- Santiago, G.T.P.; de Menezes Galvão, A.C.; de Almeida, R.N.; Mota-Rolim, S.A.; Palhano-Fontes, F.; Maia-de-Oliveira, J.P.; de Araújo, D.B.; Lobão-Soares, B.; Galvão-Coelho, N.L. Changes in Cortisol but Not in Brain-Derived Neurotrophic Factor Modulate the Association Between Sleep Disturbances and Major Depression. Front. Behav. Neurosci. 2020, 14, 44. [Google Scholar] [CrossRef] [PubMed]
- Grimsholm, O.; Rantapää-Dahlqvist, S.; Dalén, T.; Forsgren, S. BDNF in RA: Downregulated in plasma following anti-TNF treatment but no correlation with inflammatory parameters. Clin. Rheumatol. 2008, 27, 1289–1297. [Google Scholar] [CrossRef]
- Zamarrón, C.; Maceiras, F.; Mera, A.; Gómez-Reino, J.J. Effect of the first infliximab infusion on sleep and alertness in patients with active rheumatoid arthritis. Ann. Rheum. Dis. 2004, 63, 88–90. [Google Scholar] [CrossRef] [PubMed] [Green Version]
- Rudwaleit, M.; Gooch, K.; Michel, B.; Herold, M.; Thörner, A.; Wong, R.; Kron, M.; Chen, N.; Kupper, H. Adalimumab improves sleep and sleep quality in patients with active ankylosing spondylitis. J. Rheumatol. 2011, 38, 79–86. [Google Scholar] [CrossRef]
- Gejl, A.K.; Enevold, C.; Bugge, A.; Andersen, M.S.; Nielsen, C.H.; Andersen, L.B. Associations between serum and plasma brain-derived neurotrophic factor and influence of storage time and centrifugation strategy. Sci. Rep. 2019, 9, 9655. [Google Scholar] [CrossRef] [Green Version]
- Sochal, M.; Ditmer, M.; Gabryelska, A.; Białasiewicz, P. The Role of Brain-Derived Neurotrophic Factor in Immune-Related Diseases: A Narrative Review. J. Clin. Med. 2022, 11, 6023. [Google Scholar] [CrossRef]
- Guo, Y.; Xiao, P.; Lei, S.; Deng, F.; Xiao, G.G.; Liu, Y.; Chen, X.; Li, L.; Wu, S.; Chen, Y.; et al. How is mRNA expression predictive for protein expression? A correlation study on human circulating monocytes. Acta Biochim. Biophys. Sin. 2008, 40, 426–436. [Google Scholar] [CrossRef] [PubMed] [Green Version]


| IBD | |||||
|---|---|---|---|---|---|
| Parameter | All | Exacerbation | Remission | HC | p |
| n | 80 | 47 | 33 | 44 | - |
| Women (%, n) | 56.2% (n = 45) | 53.2% (n = 25) | 60.6% (n = 20) | 50% (n = 22) | 0.504 a 0.510 b |
| Age (median, IQR) | 34.5 (28.0–41.0) | 34.0 (29.0–41.0) | 36 (25.0–42.0) | 31.5 (25–45.5) | 0.806 a 0.607 b |
| BMI (kg/m2) | 23.2 (20.6–25.8) | 23.5 (20.8–27.1) | 22.5 (19.7–25.0) | 23.9 (20.6–26.8) | 0.578 a 0.132 b |
| Smoker (%, n) | 13.8% (n = 11) | 12.8% (n = 6) | 15.2% (n = 5) | 11.4% (n = 5) | 0.786 a 0.754 b |
| Chronic diseases (%, n) | 23.8% (n = 19) | 31.9% (n = 15) | 12.1% (n = 4) | 13.6% (n = 6) | 0.243 a 0.061 b |
| Steroids (%, n) | 32.5% (n = 26) | 51.1% (n = 24) | 6.1% (n = 2) | 0% (n = 0) | - 0.490 b |
| Immunomodulators (%, n) | 35.0% (n = 28) | 31.9% (n = 15) | 39.4% (n = 13) | 0% (n = 0) | - p < 0.001 b |
| Baseline TNF mRNA expression | 78; 12.599 (6.03–47.59) | 46; 10.951 (5.79–43.04) | 32; 16.395 (7.01–57.75) | 44; 16.491 (9.65–26.64) | 0.817 a 0.222 b |
| Years from diagnosis | - | 8.0 (3.00–12.00) | 7.0 (4.0–10.0) | - | - 0.496 b |
| Surgery in the medical history | 30.0% (n = 24) | 31.9% (n = 15) | 27.3% (n = 9) | 25.0% (n = 11) | 0.605 a 0.805 b |
| mRNA BDNF | proBDNF Protein | BDNF Protein | |
|---|---|---|---|
| IBD | (n = 80); 655.70 (2.36–2850.57) | (n = 80); 14.69 (10.46–17.74) | (n = 80); 80; 25.36 (20.39–33.67) |
| HC | (n = 44); 1325.99(765.48–2261.07) | (n = 44); 11.56 (7.370–16.52) | (n = 44); 19.04(13.16–26.80) |
| p | 0.008 | <0.001 | 0.008 |
| CD | (n = 49); 908.73 (17.06–3450.79) | (n = 49); 15.30(11.48–17.51) | (n = 49); 23.11(18.18–30.14) |
| UC | (n = 31); 306.07 (1.83–1830.11) | (n = 31); 13.31 (10.06–18.11) | (n = 31); 28.92 (23.65–37.89) |
| p | 0.218 | 0.366 | 0.007 |
| Ex | (n = 47); 605.81 (1.82–3088.55) | (n = 47); 14.71 (10.34–17.49) | (n = 47); 25.00 (20.05–33.16) |
| R | (n = 33); 705.60(2.81–1830.11) | (n = 33); 14.54 (10.86–18.47) | (n = 33); 27.37(21.00–34.17) |
| p | 0.977 | 0.431 | 0.566 |
| Ex | (n = 47); 605.81 (1.83–3088.55) | (n = 47); 14.71(10.34–17.49) | (n = 47); 25.00(20.05–33.16) |
| HC | (n = 44); 1325.99(765.48–2261.07) | (n = 44); 11.58 (7.37–16.52) | (n = 44); 19.04 (13.16–26.80) |
| p | 0.025 | 0.043 | 0.002 |
| R | (n = 33); 705.60 (2.81–1830.11) | (n = 33); 14.54(10.86–18.47) | (n = 33); 27.37(21.00–34.17) |
| HC | (n = 44); 1325.99(765.48–2261.07) | (n = 44); 11.58(7.37–16.52) | (n = 44); 19.04 (13.16–26.80) |
| p | 0.019 | 0.009 | <0.001 |
| IBD | |||
|---|---|---|---|
| n | r | p | |
| mRNA BDNF | |||
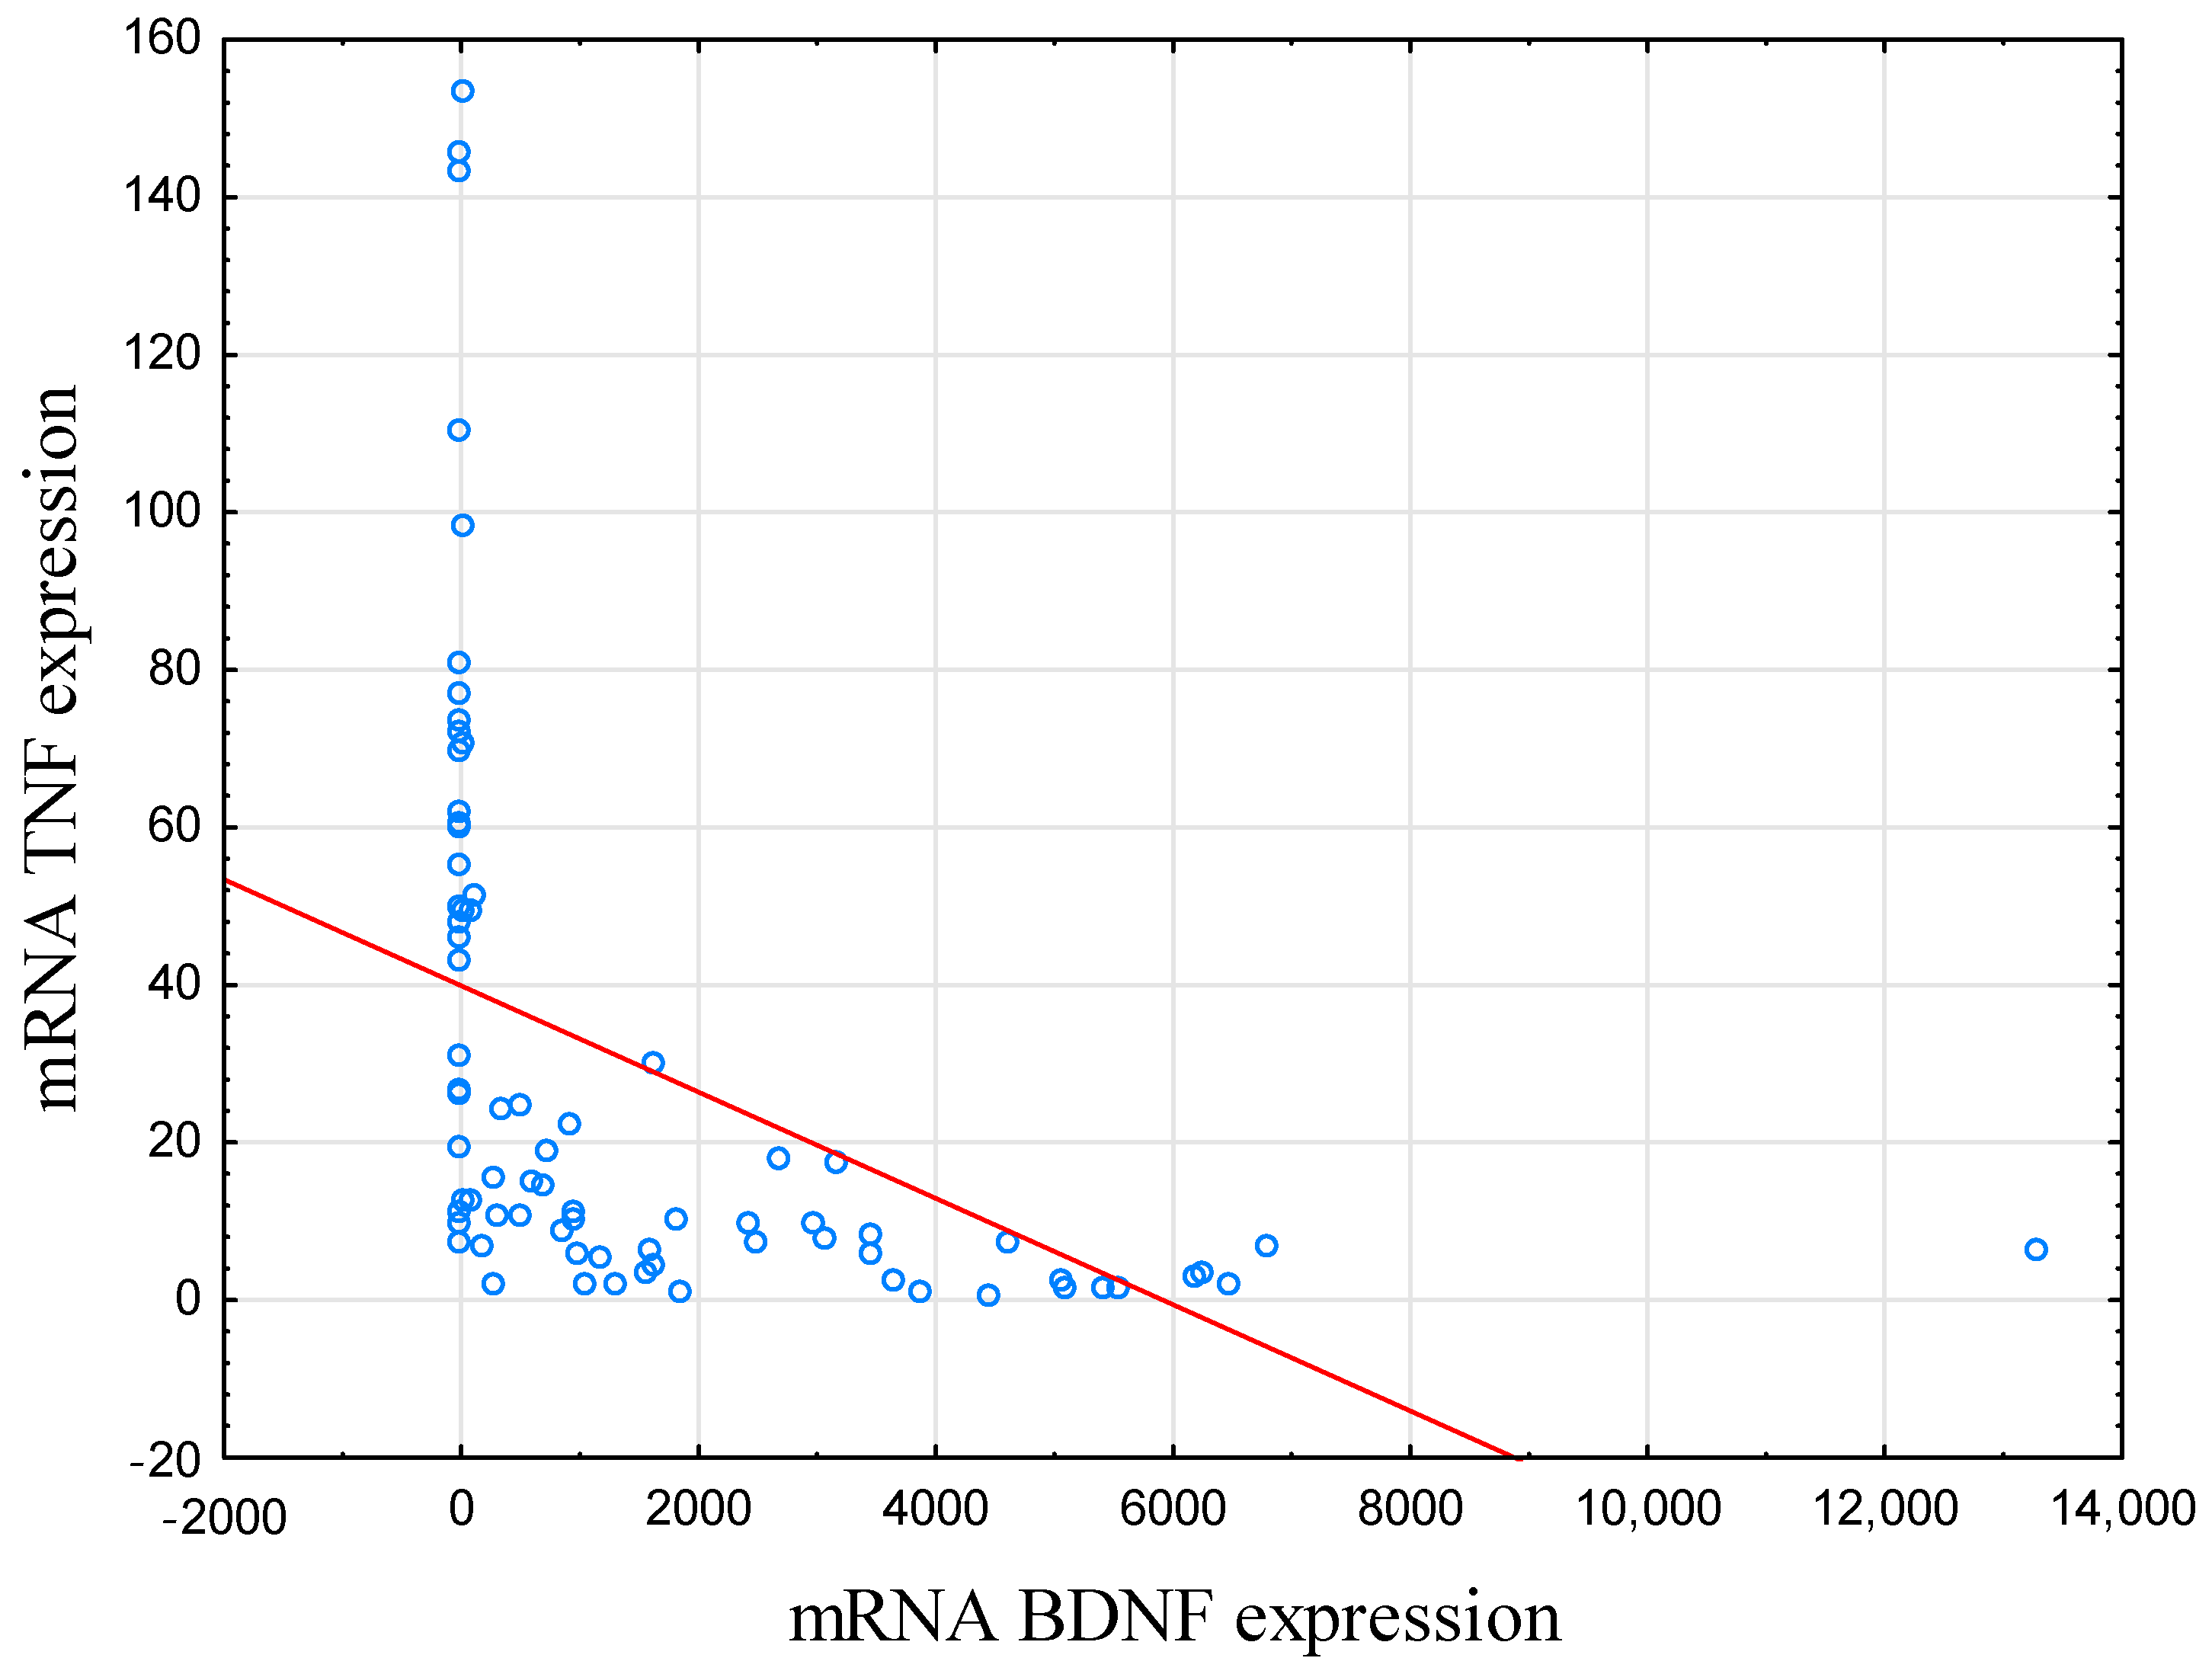
| mRNA TNF | 78 | −0.76 | <0.001 |
| BDNF | 80 | −0.11 | 0.329 |
| proBDNF | 80 | 0.02 | 0.880 |
| Sleep latency | 80 | 0.03 | 0.799 |
| Total sleep time | 80 | 0.13 | 0.270 |
| Total time spent in bed | 80 | 0.12 | 0.278 |
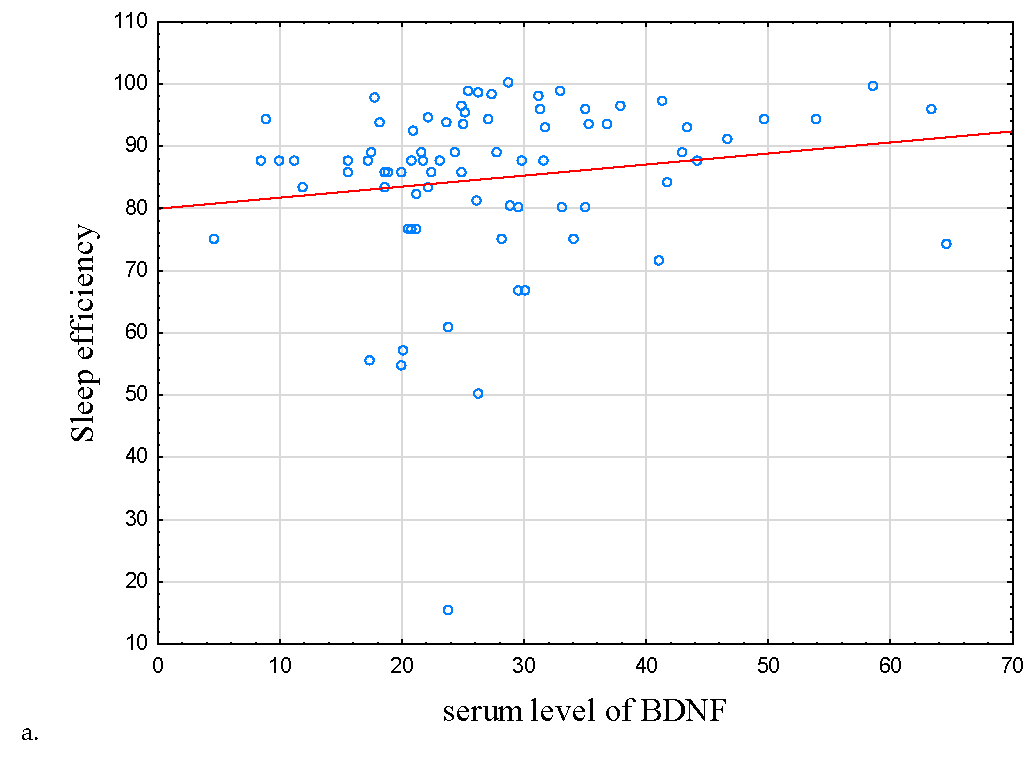
| Sleep efficiency [%] | 80 | 0.09 | 0.441 |
| BDNF protein | |||
| mRNA TNF | 78 | 0.17 | 0.150 |
| proBDNF | 80 | 0.29 | 0.009 |
| Sleep latency | 80 | −0.13 | 0.266 |
| Total sleep time | 80 | 0.04 | 0.704 |
| Total time spent in bed | 80 | −0.08 | 0.487 |
| Sleep efficiency [%] | 80 | 0.23 | 0.037 |
| proBDNF protein | |||
| mRNA TNF | 78 | 0.07 | 0.519 |
| Sleep latency | 80 | −0.03 | 0.802 |
| Total sleep time | 80 | <0.00 | 0.995 |
| Total time spent in bed | 80 | −0.15 | 0.185 |
| Sleep efficiency [%] | 80 | 0.15 | 0.190 |
| IBD | Exacerbation | Remission | ||||
|---|---|---|---|---|---|---|
| r | p | r | p | r | p | |
| mRNA BDNF | ||||||
| AIS | 0.06 | 0.619 | −0.02 | 0.875 | 0.20 | 0.263 |
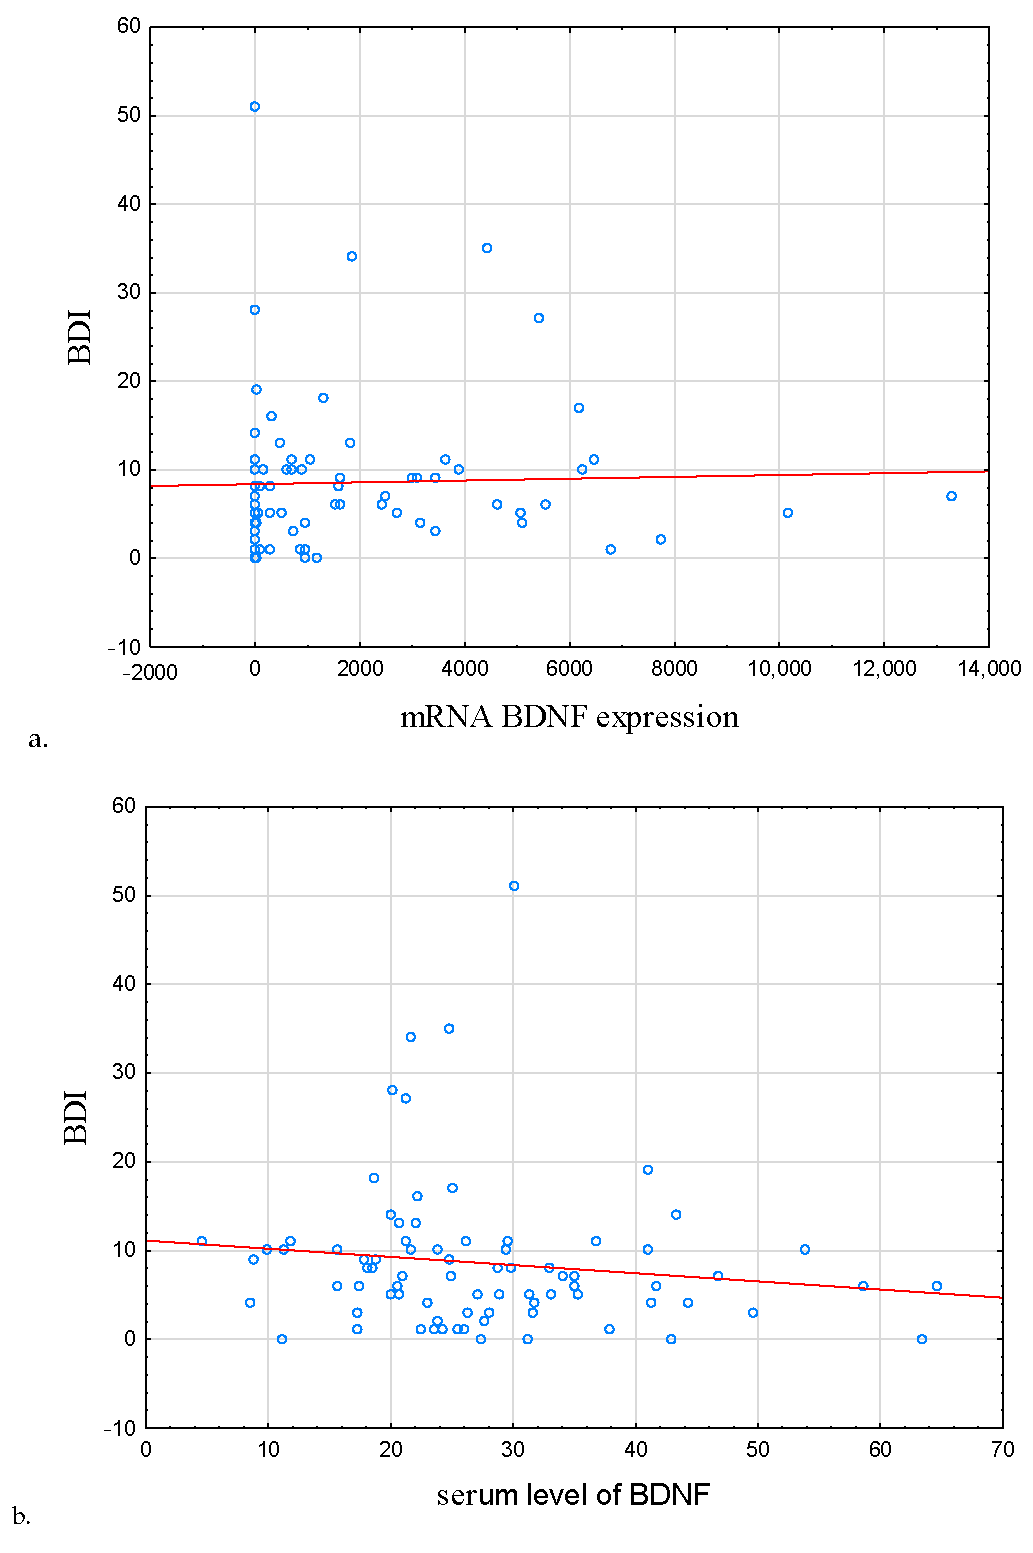
| BDI | 0.09 | 0.415 | −0.11 | 0.463 | 0.36 | 0.038 |
| ESS | 0.04 | 0.715 | 0.04 | 0.780 | 0.04 | 0.821 |
| PSQI | −0.01 | 0.936 | −0.09 | 0.533 | 0.09 | 0.611 |
| BDNF protein | ||||||
| AIS | −0.04 | 0.760 | −0.05 | 0.738 | 0.02 | 0.917 |
| BDI | −0.20 | 0.078 | −0.05 | 0.719 | −0.35 | 0.046 |
| ESS | 0.09 | 0.425 | 0.13 | 0.396 | 0.08 | 0.674 |
| PSQI | −0.12 | 0.310 | −0.11 | 0.456 | −0.04 | 0.836 |
| proBDNF protein | ||||||
| AIS | 0.01 | 0.906 | −0.01 | 0.956 | 0.09 | 0.640 |
| BDI | −0.12 | 0.307 | −0.03 | 0.822 | −0.16 | 0.381 |
| ESS | −0.08 | 0.504 | 0.20 | 0.263 | −0.10 | 0.576 |
| PSQI | 0.04 | 0.759 | 0.17 | 0.267 | −0.08 | 0.672 |
| Pre-Therapy | After 14 Weeks | p | |
|---|---|---|---|
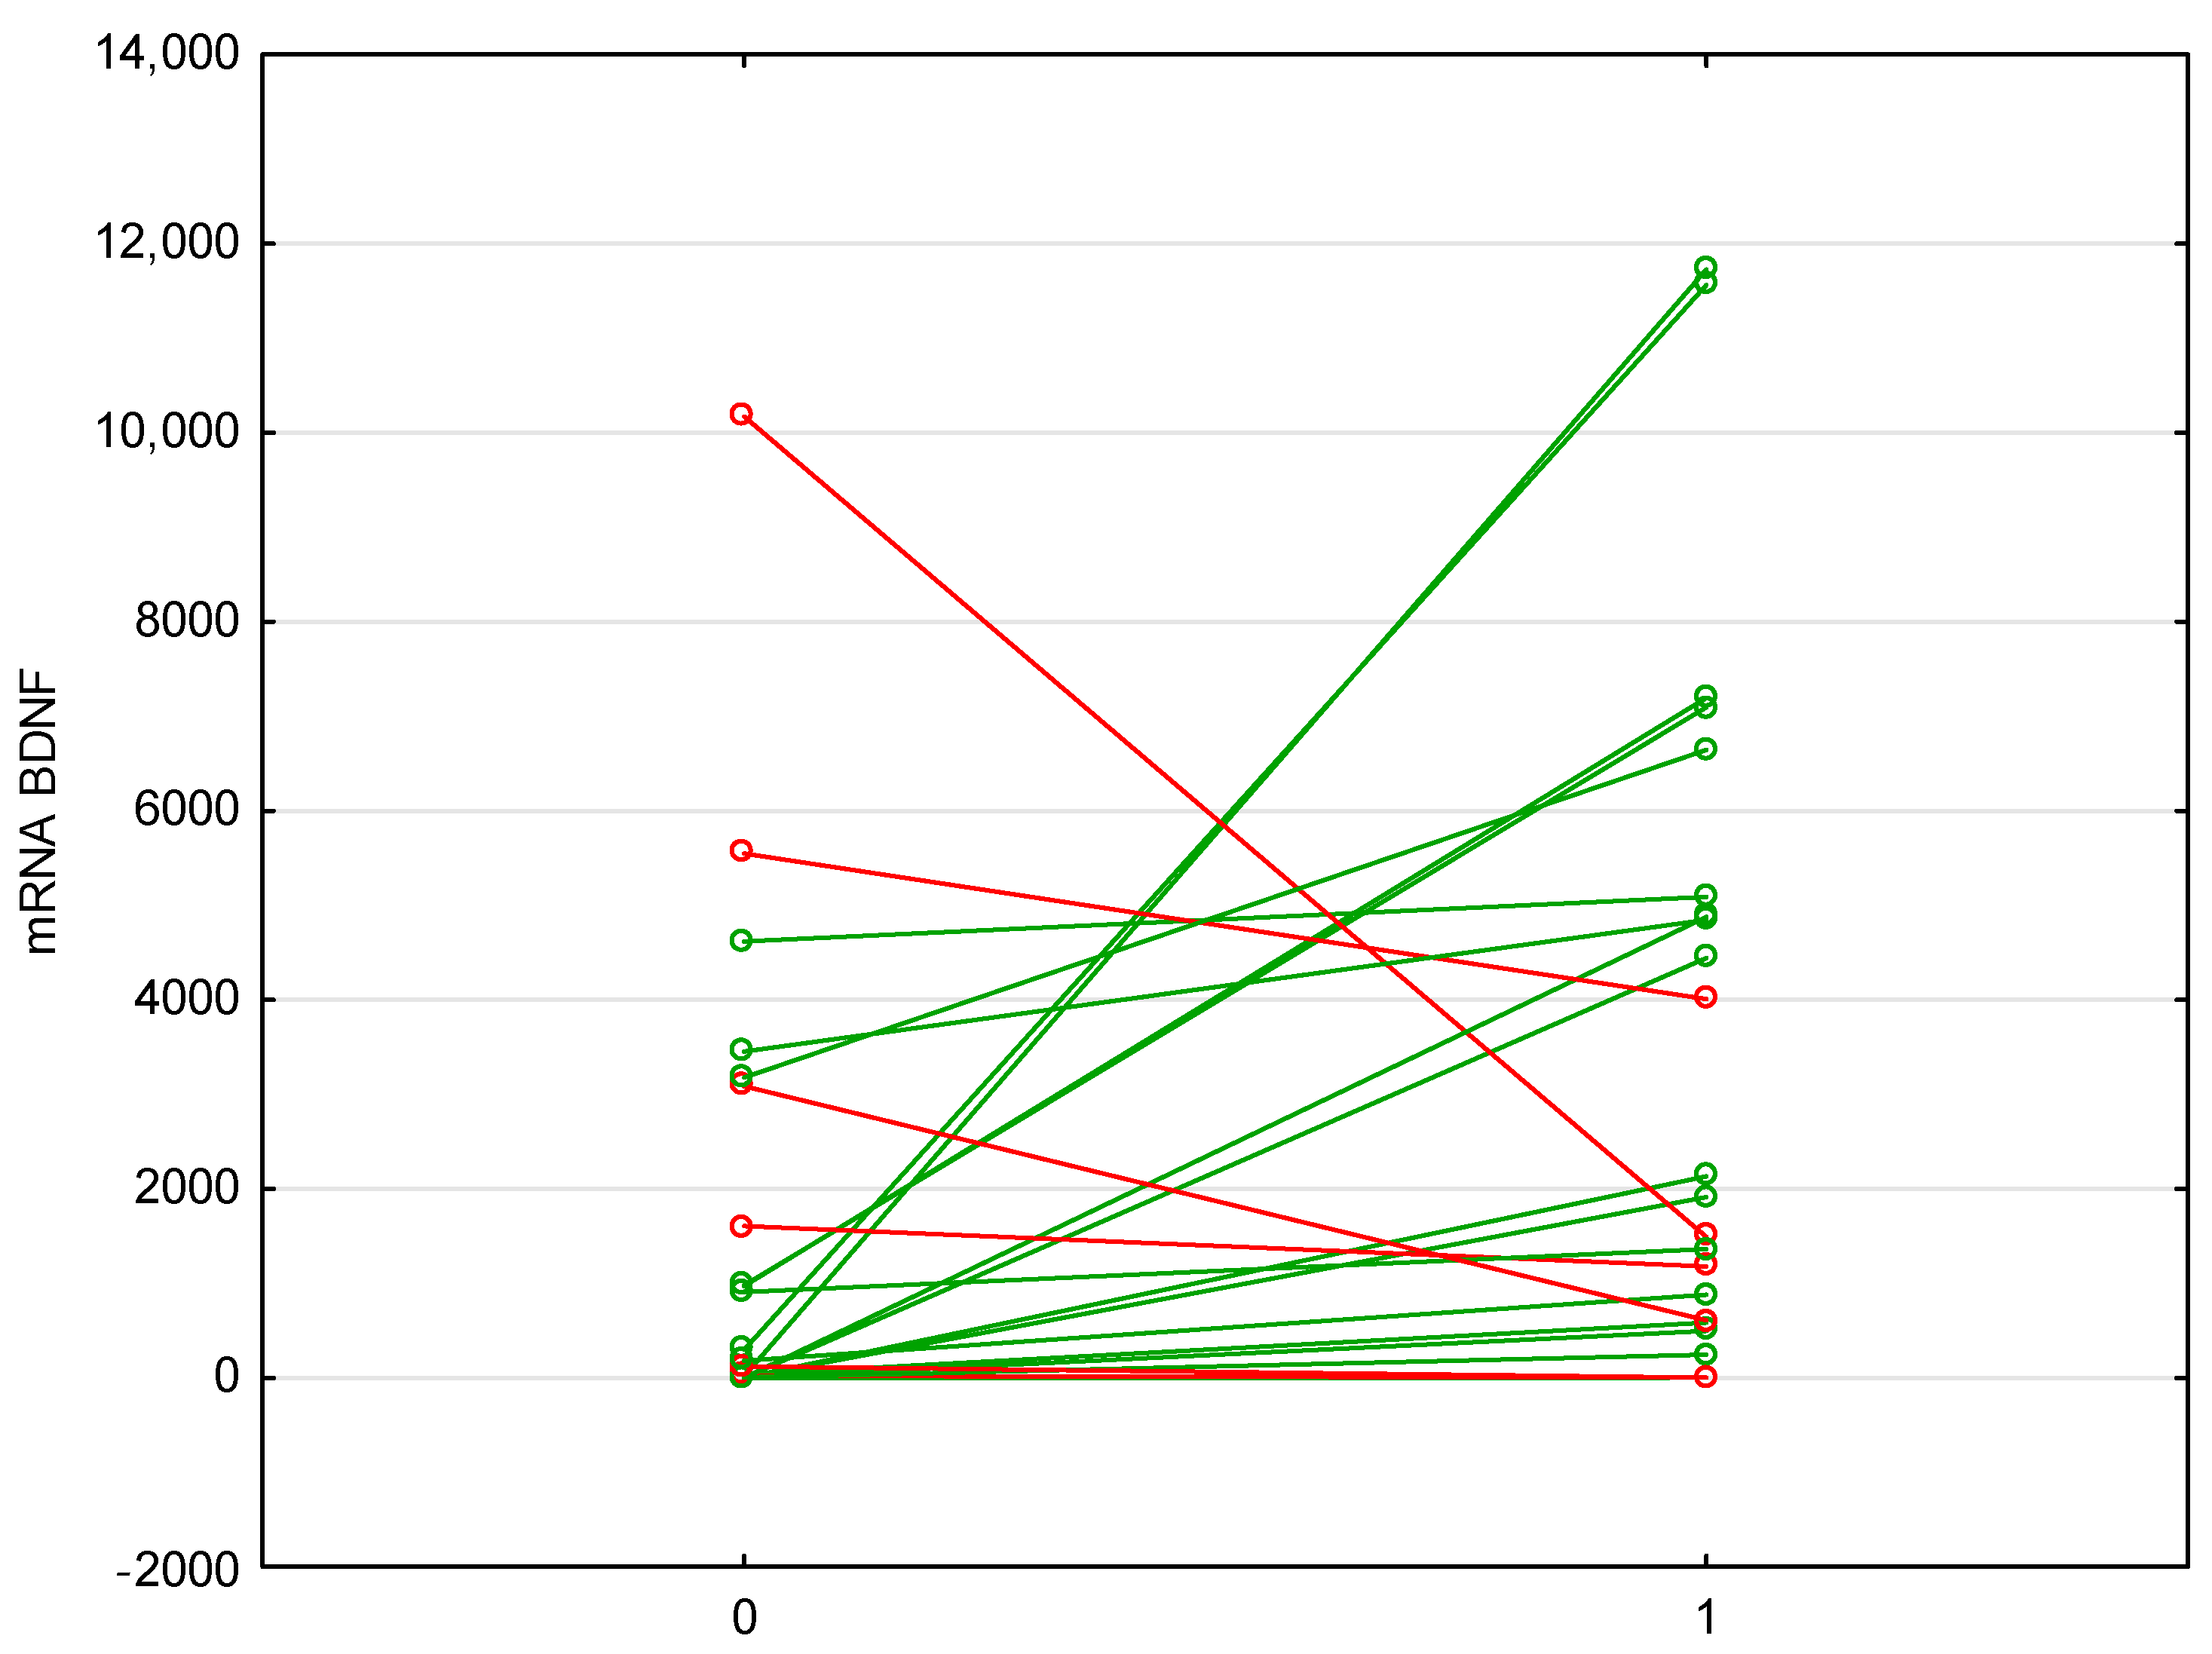
| mRNA BDNF | (n = 26); 151.13 (1.30–1604.28) | (n = 25); 1914.45 (585.17–4880.16) | 0.009 |
| mRNA TNF | (n = 25); 15.59 (7.05–49.44) | (n = 24); 7.84 (2.92–16.05) | 0.045 |
| BDNF protein | (n = 26); 22.81 (17.51–30.14) | (n = 25); 23.14 (16.01–29.20) | 0.716 |
| proBDNF protein | (n = 26); 13.25 (10.34–17.51) | (n = 26); 13.28 (10.54–17.59) | 0.829 |
| IBD | |||
|---|---|---|---|
| n | r | p | |
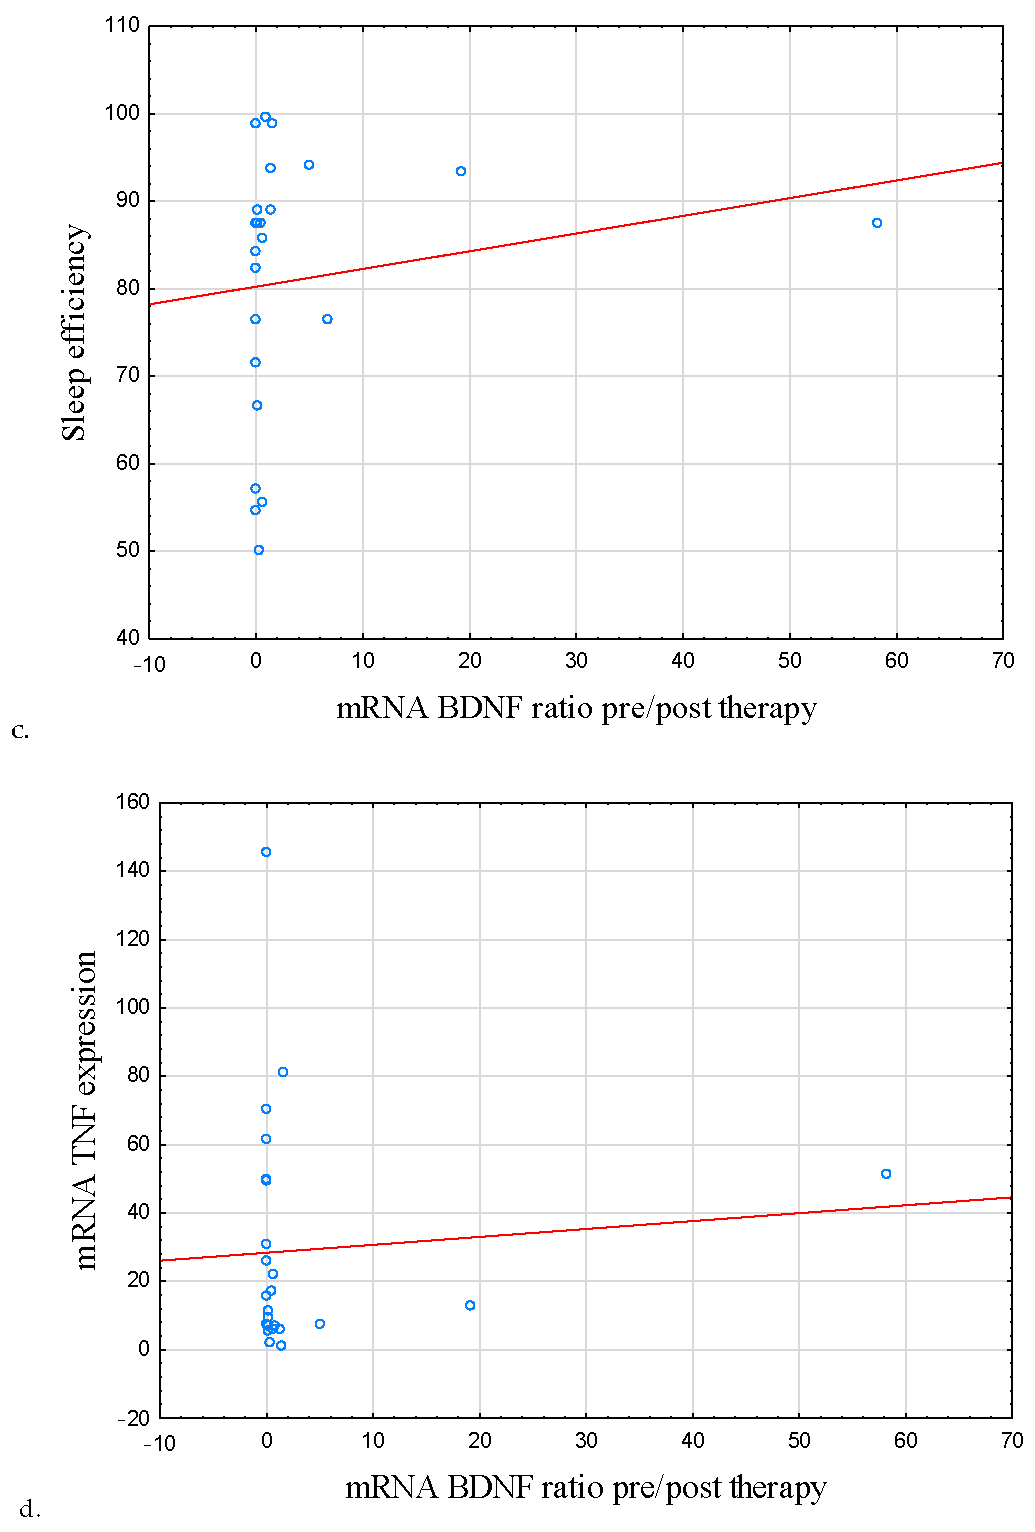
| mRNA BDNF ratio pre/post therapy | |||
| BDI | 25 | −0.31 | 0.134 |
| AIS | 25 | −0.41 | 0.042 |
| ESS | 25 | −0.34 | 0.092 |
| Sleep efficiency | 25 | 0.44 | 0.028 |
| PSQI | 25 | −0.44 | 0.027 |
| BDNF protein ratio pre/post therapy | |||
| BDI | 24 | 0.45 | 0.658 |
| AIS | 24 | 0.23 | 0.288 |
| ESS | 24 | 0.06 | 0. 798 |
| Sleep efficiency | 24 | −0.09 | 0.679 |
| PSQI | 24 | 0.11 | 0.579 |
| proBDNF protein ratio pre/post therapy | |||
| BDI | 26 | −0.07 | 0.749 |
| AIS | 26 | −0.16 | 0.425 |
| ESS | 26 | 0.14 | 0.496 |
| Sleep efficiency | 26 | 0.32 | 0.111 |
| PSQI | 26 | −0.04 | 0.839 |
| IBD | |||
|---|---|---|---|
| n | r | p | |
| mRNA BDNF ratio pre/post therapy and mRNA TNF ratio pre/post therapy | 23 | −0.57 | 0.004 |
| BDNF ratio pre/post therapy and mRNA TNF ratio pre/post therapy | 21 | −0.19 | 0.420 |
| proBDNF and mRNA TNF ratio pre/post therapy | 23 | −0.03 | 0.866 |
Disclaimer/Publisher’s Note: The statements, opinions and data contained in all publications are solely those of the individual author(s) and contributor(s) and not of MDPI and/or the editor(s). MDPI and/or the editor(s) disclaim responsibility for any injury to people or property resulting from any ideas, methods, instructions or products referred to in the content. |
© 2023 by the authors. Licensee MDPI, Basel, Switzerland. This article is an open access article distributed under the terms and conditions of the Creative Commons Attribution (CC BY) license (https://creativecommons.org/licenses/by/4.0/).
Share and Cite
Sochal, M.; Ditmer, M.; Binienda, A.; Gabryelska, A.; Białasiewicz, P.; Talar-Wojnarowska, R.; Fichna, J.; Małecka-Wojciesko, E. Relation between Selected Sleep Parameters, Depression, Anti-Tumor Necrosis Factor Therapy, and the Brain-Derived Neurotrophic Factor Pathway in Inflammatory Bowel Disease. Metabolites 2023, 13, 450. https://doi.org/10.3390/metabo13030450
Sochal M, Ditmer M, Binienda A, Gabryelska A, Białasiewicz P, Talar-Wojnarowska R, Fichna J, Małecka-Wojciesko E. Relation between Selected Sleep Parameters, Depression, Anti-Tumor Necrosis Factor Therapy, and the Brain-Derived Neurotrophic Factor Pathway in Inflammatory Bowel Disease. Metabolites. 2023; 13(3):450. https://doi.org/10.3390/metabo13030450
Chicago/Turabian StyleSochal, Marcin, Marta Ditmer, Agata Binienda, Agata Gabryelska, Piotr Białasiewicz, Renata Talar-Wojnarowska, Jakub Fichna, and Ewa Małecka-Wojciesko. 2023. "Relation between Selected Sleep Parameters, Depression, Anti-Tumor Necrosis Factor Therapy, and the Brain-Derived Neurotrophic Factor Pathway in Inflammatory Bowel Disease" Metabolites 13, no. 3: 450. https://doi.org/10.3390/metabo13030450