Targeted Desorption Electrospray Ionization Mass Spectrometry Imaging for Drug Distribution, Toxicity, and Tissue Classification Studies

 , ,
, ,  , ,
, ,
Abstract
:
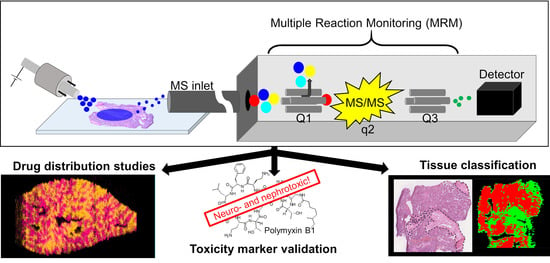
1. Introduction
2. Materials and Methods
2.1. Chemicals
2.2. Tissue Processing for MSI
2.3. Drug Distribution Studies
2.3.1. Sample Collection
2.3.2. Metabolite Identification
2.3.3. DESI-MSI
2.3.4. MALDI-MSI
2.4. Toxicity Study of Polymyxin B Induced Kidney Injury
2.4.1. Sample Collection
2.4.2. Mass Spectrometry Imaging
2.5. Tissue Classification Study
2.5.1. Clinical Sample Collection
2.5.2. Mass Spectrometry Imaging
3. Results
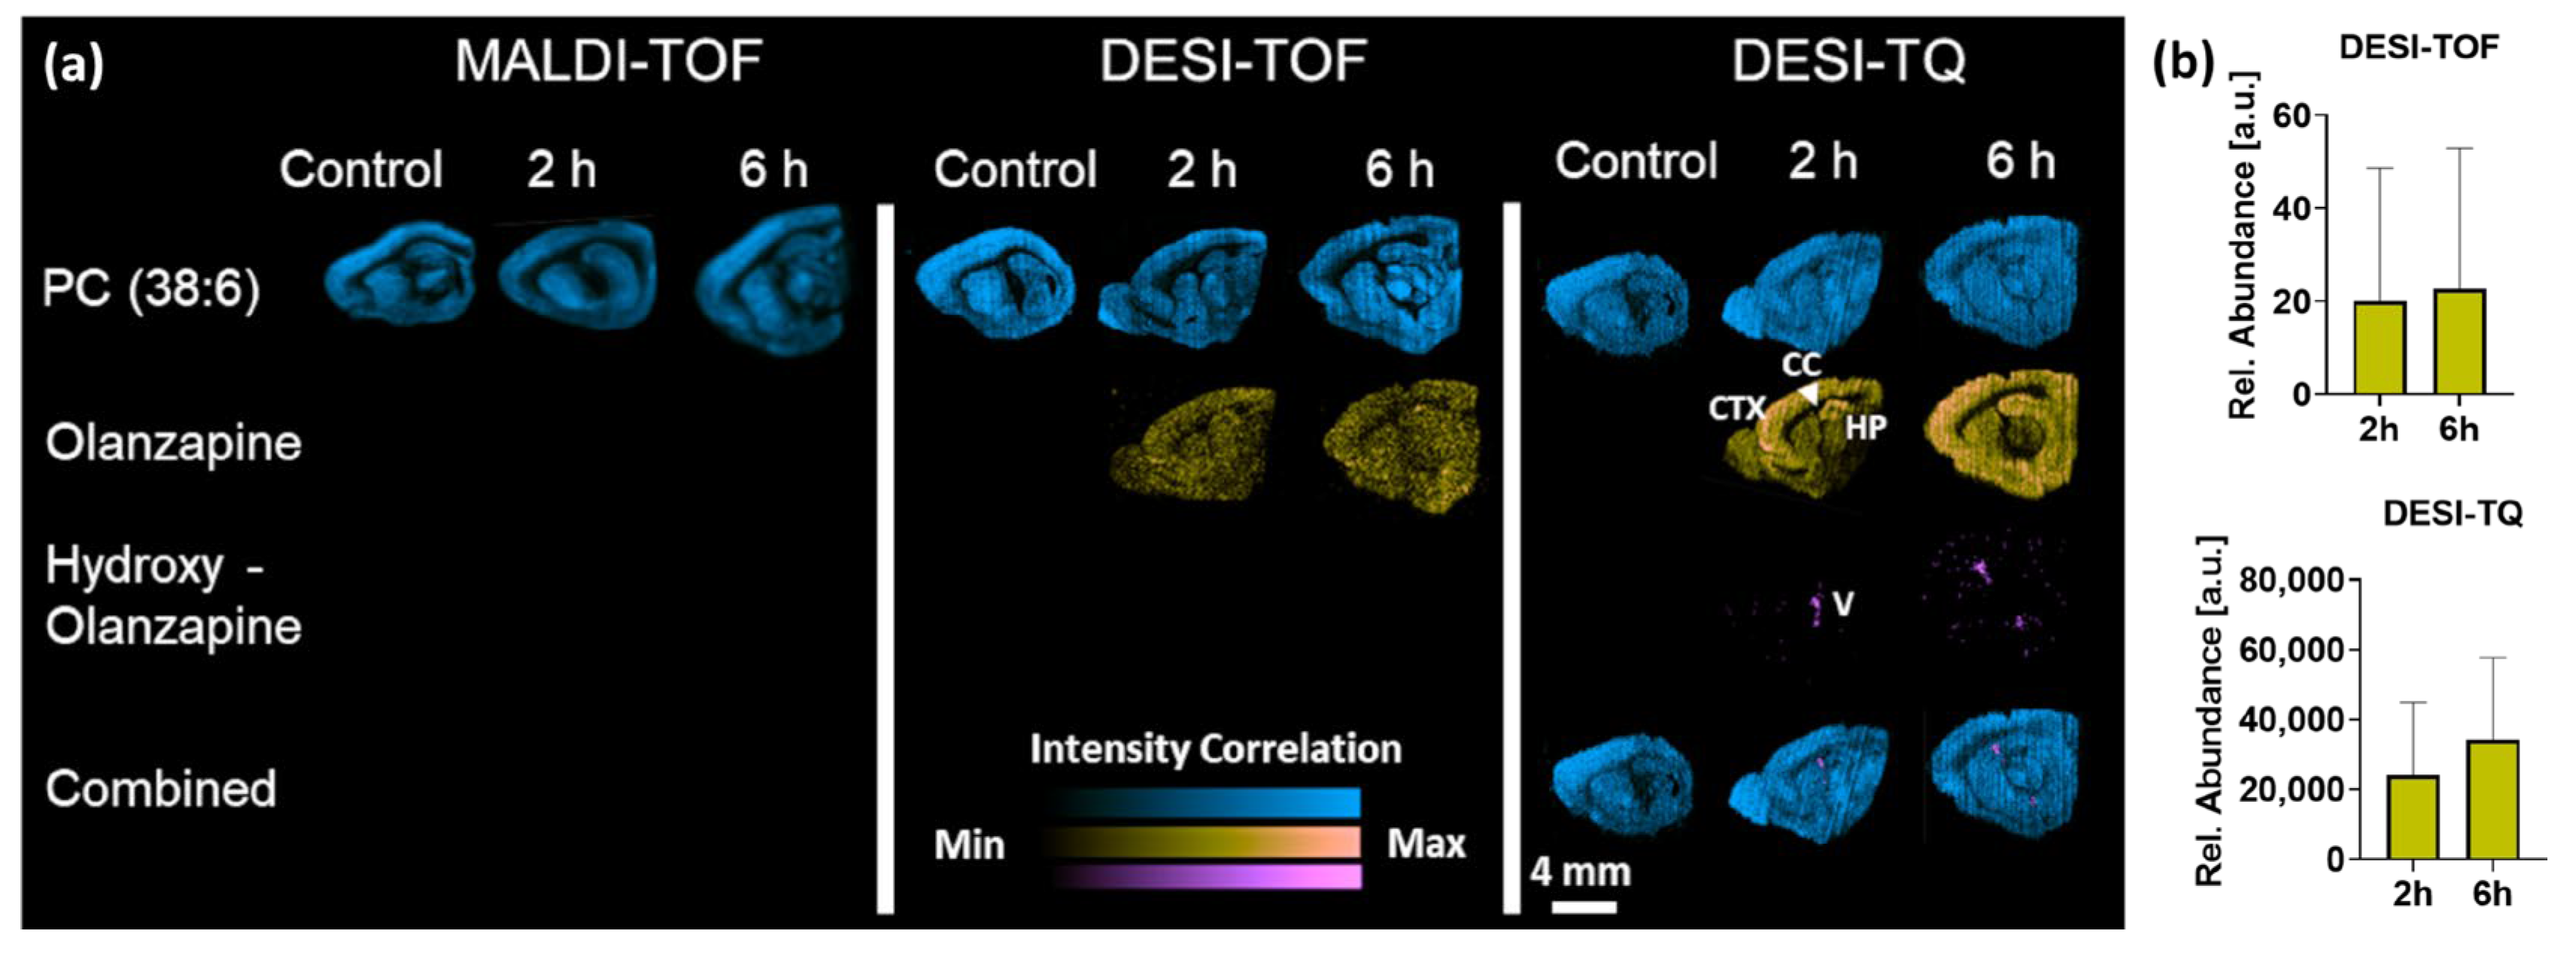
3.1. Drug Distribution Study
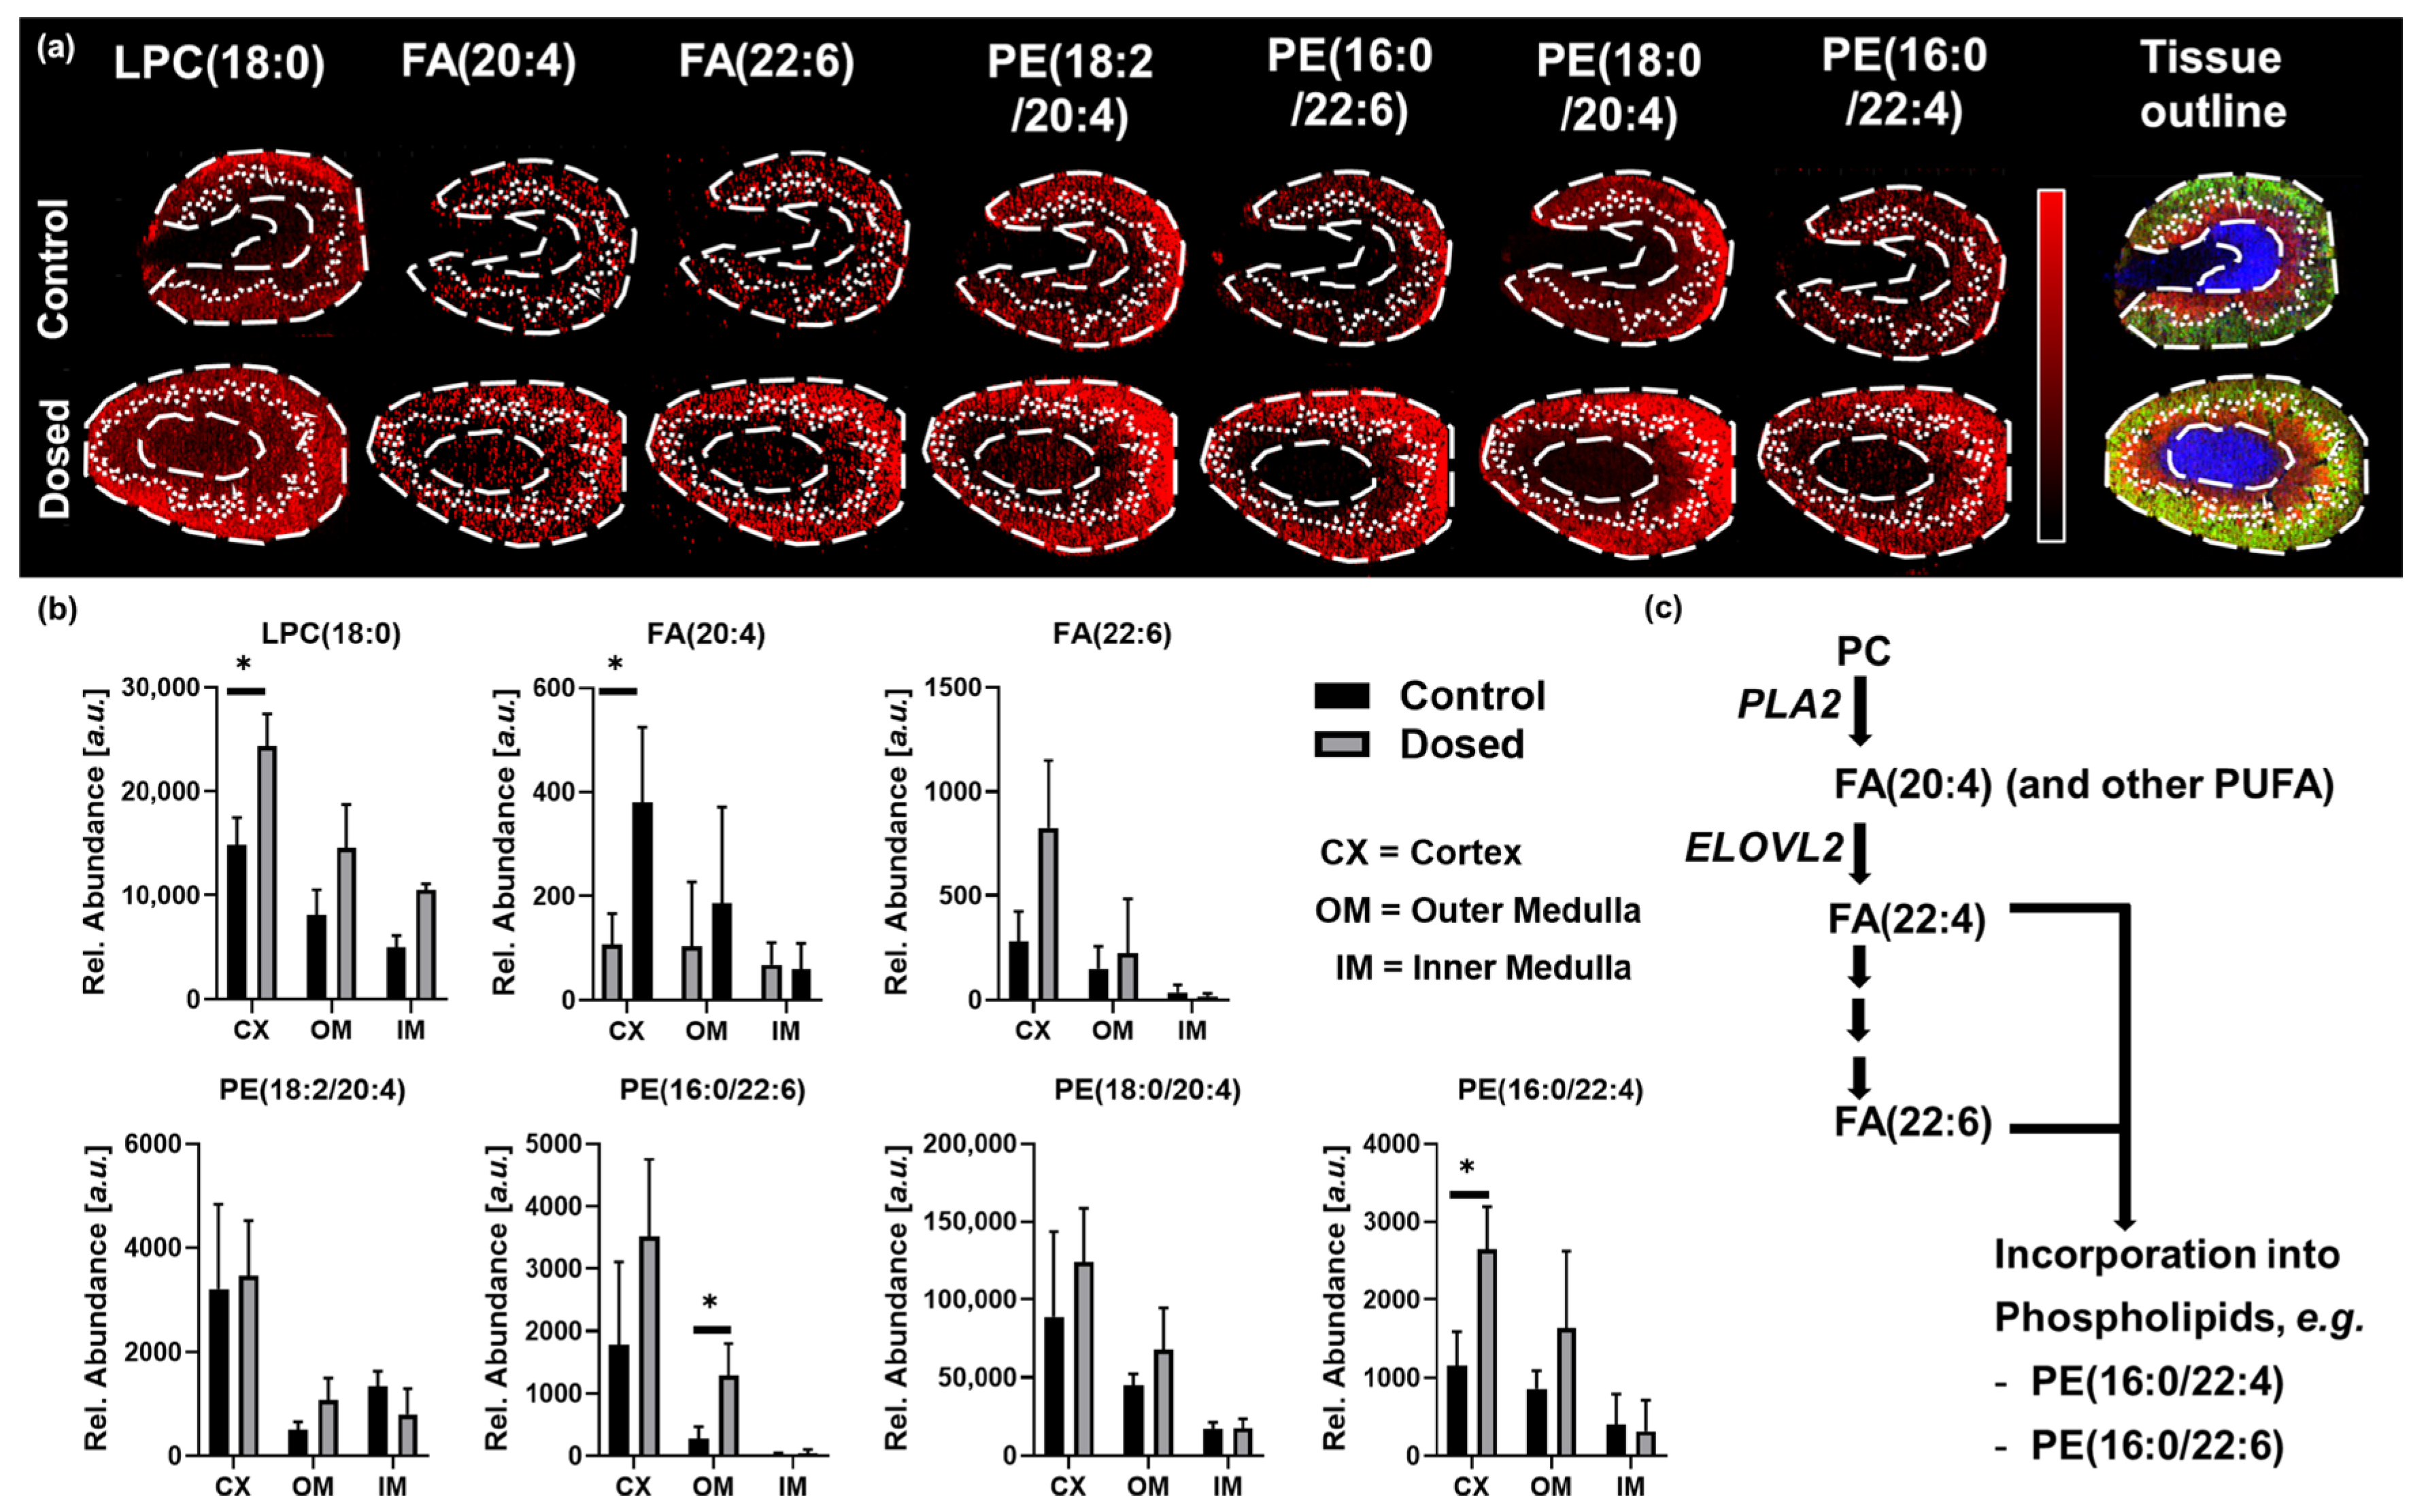
3.2. Toxicity Study: Polymyxin B Induced Kidney Injury
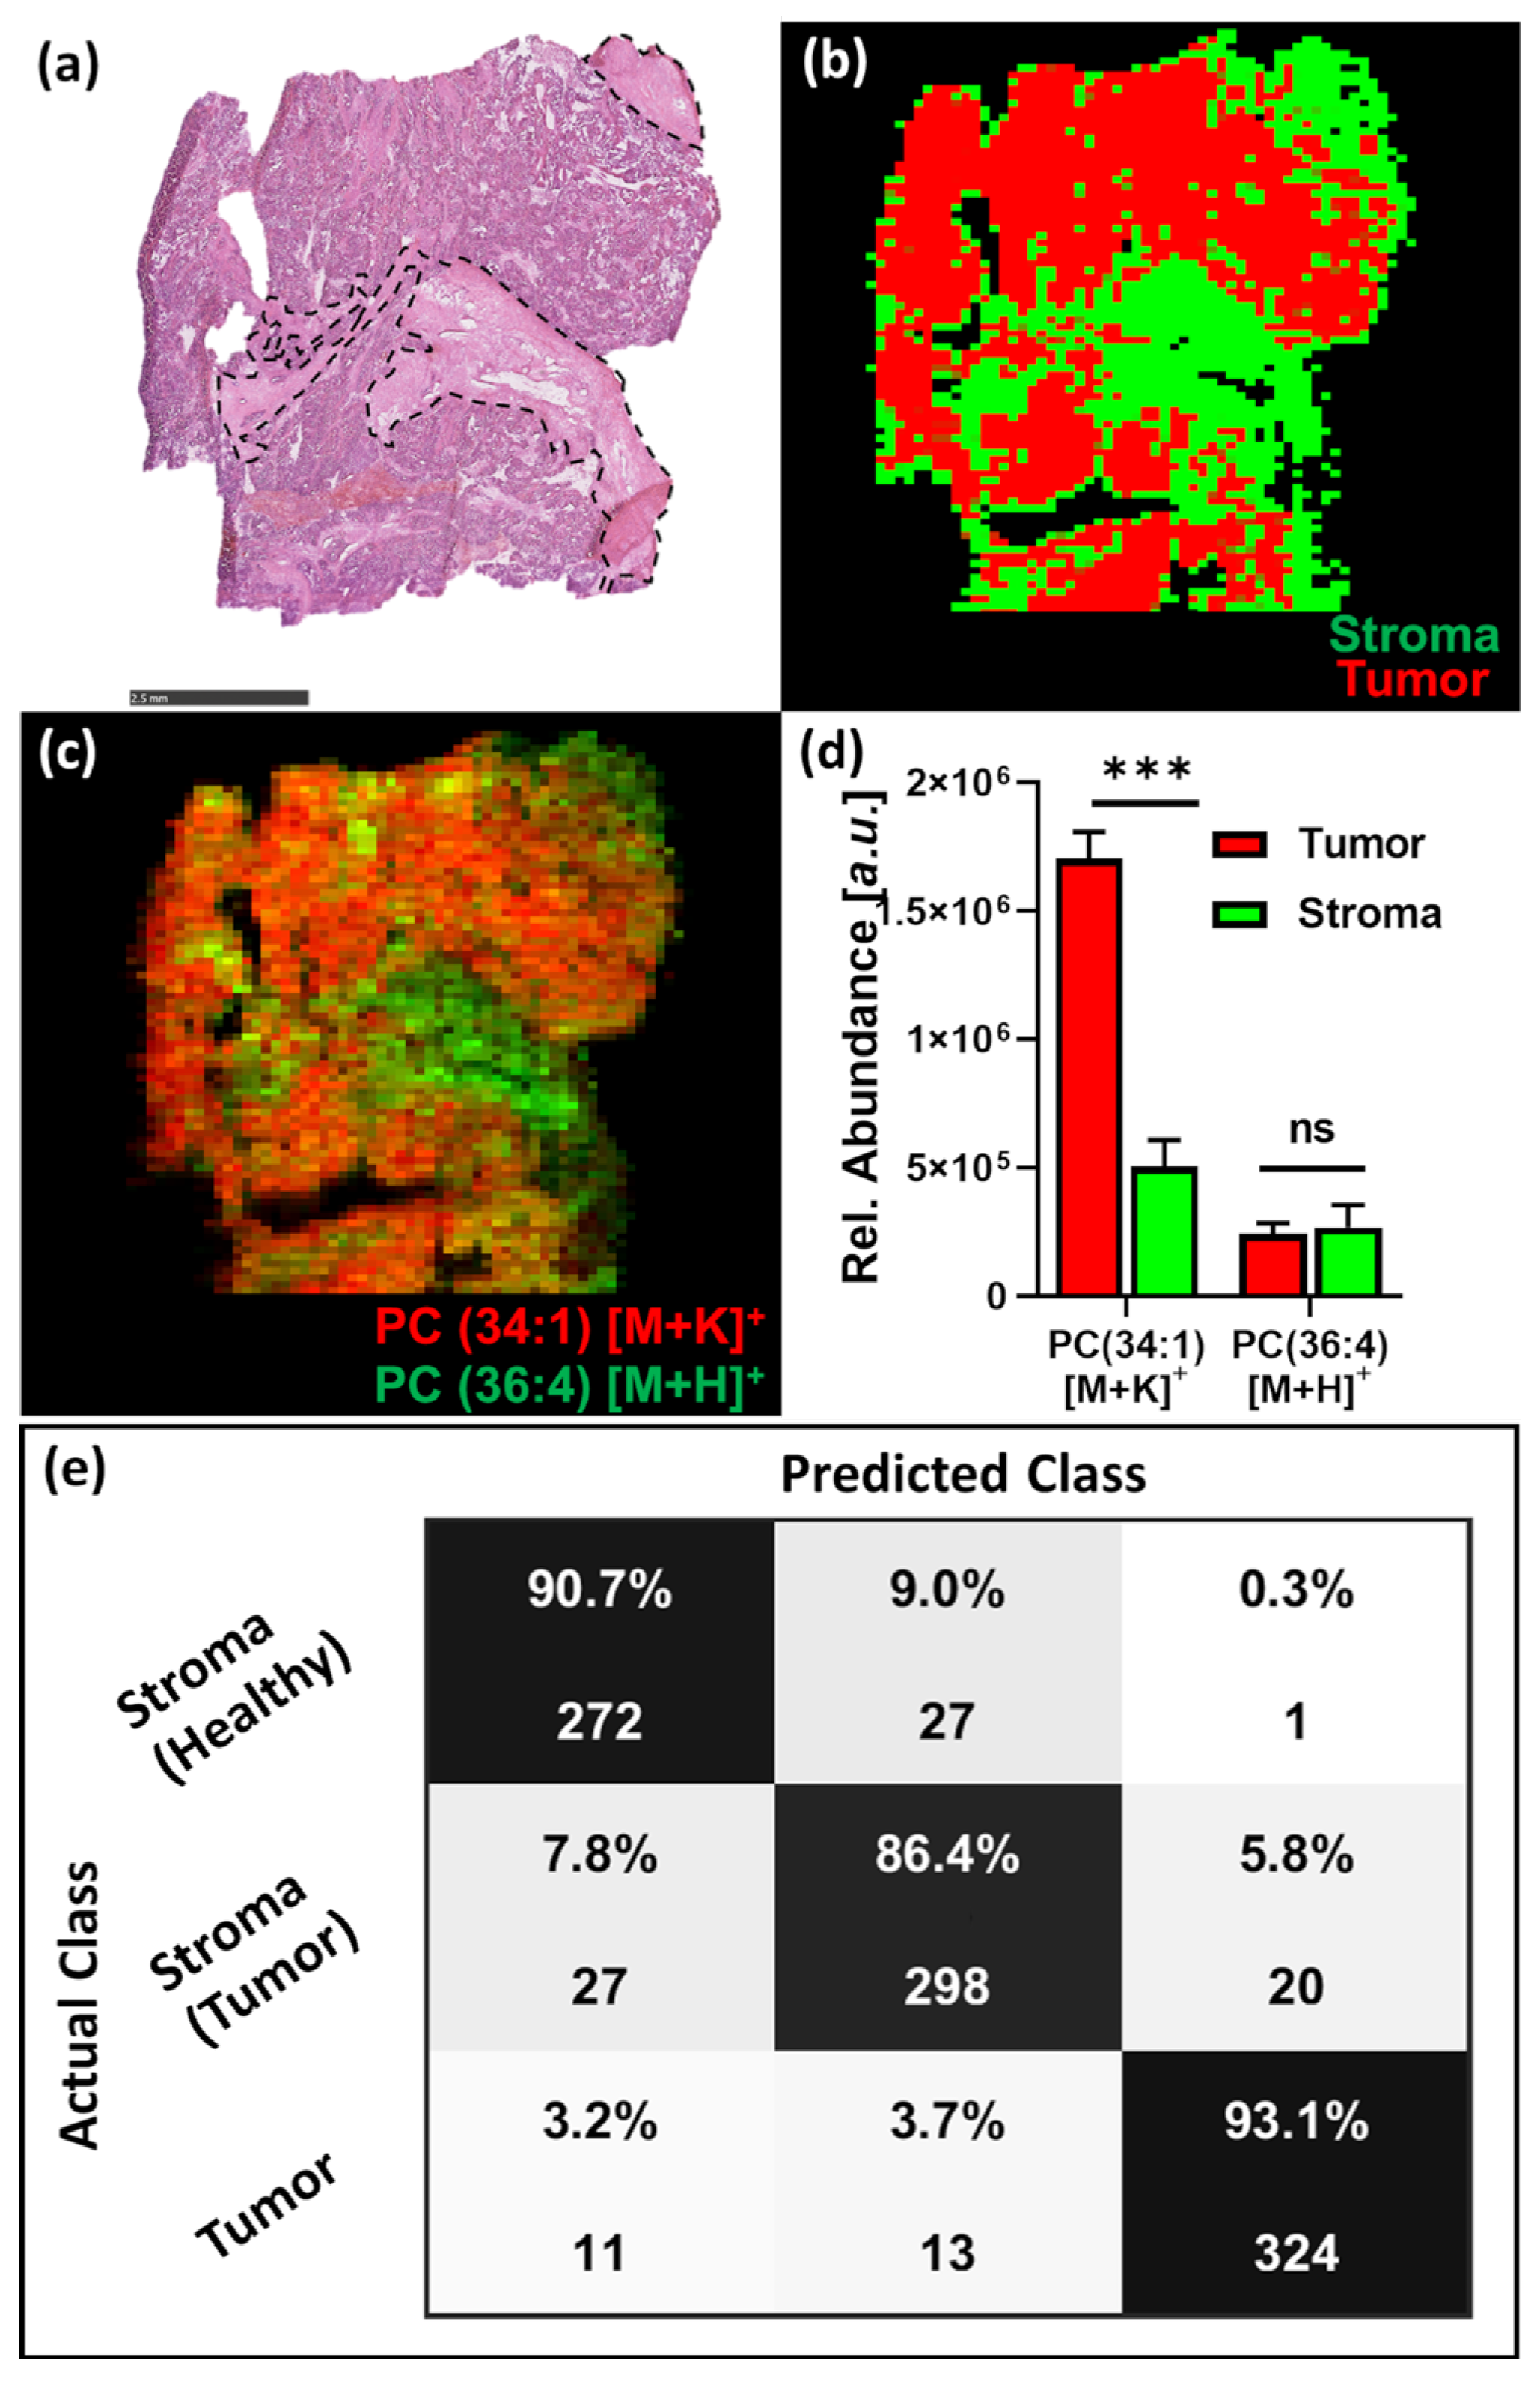
3.3. Tissue Classification Study
4. Discussion
Supplementary Materials
Author Contributions
Funding
Institutional Review Board Statement
Informed Consent Statement
Data Availability Statement
Acknowledgments
Conflicts of Interest
References
- Prentice, B.M.; Chumbley, C.W.; Caprioli, R.M. Absolute Quantification of Rifampicin by MALDI Imaging Mass Spectrometry Using Multiple TOF/TOF Events in a Single Laser Shot. J. Am. Soc. Mass Spectrom. 2017, 28, 136–144. [Google Scholar] [CrossRef] [Green Version]
- Tata, A.; Perez, C.J.; Hamid, T.S.; Bayfield, M.A.; Ifa, D.R. Analysis of Metabolic Changes in Plant Pathosystems by Imprint Imaging DESI-MS. J. Am. Soc. Mass Spectrom. 2015, 26, 641–648. [Google Scholar] [CrossRef] [Green Version]
- Manicke, N.E.; Dill, A.L.; Ifa, D.R.; Cooks, R.G. High-resolution tissue imaging on an orbitrap mass spectrometer by desorption electrospray ionization mass spectrometry. J. Mass Spectrom. 2010, 45, 223–226. [Google Scholar] [CrossRef]
- Rompp, A.; Guenther, S.; Takats, Z.; Spengler, B. Mass spectrometry imaging with high resolution in mass and space (HR(2) MSI) for reliable investigation of drug compound distributions on the cellular level. Anal. Bioanal. Chem. 2011, 401, 65–73. [Google Scholar] [CrossRef]
- Krasny, L.; Hoffmann, F.; Ernst, G.; Trede, D.; Alexandrov, T.; Havlicek, V.; Guntinas-Lichius, O.; von Eggeling, F.; Crecelius, A.C. Spatial Segmentation of MALDI FT-ICR MSI Data: A Powerful Tool to Explore the Head and Neck Tumor In Situ Lipidome. J. Am. Soc. Mass Spectrom. 2015, 26, 36–43. [Google Scholar] [CrossRef]
- Wildburger, N.C.; Wood, P.L.; Gumin, J.; Lichti, C.F.; Emmett, M.R.; Lang, F.F.; Nilsson, C.L. ESI-MS/MS and MALDI-IMS Localization Reveal Alterations in Phosphatidic Acid, Diacylglycerol, and DHA in Glioma Stem Cell Xenografts. J. Proteome Res. 2015, 14, 2511–2519. [Google Scholar] [CrossRef] [Green Version]
- Prideaux, B.; Dartois, V.; Staab, D.; Weiner, D.M.; Goh, A.; Via, L.E.; Barry, C.E., III; Stoeckli, M. High-sensitivity MALDI-MRM-MS imaging of moxifloxacin distribution in tuberculosis-infected rabbit lungs and granulomatous lesions. Anal. Chem. 2011, 83, 2112–2118. [Google Scholar] [CrossRef] [Green Version]
- Kennedy, J.H.; Aurand, C.; Shirey, R.; Laughlin, B.C.; Wiseman, J.M. Coupling desorption electrospray ionization with solid-phase microextraction for screening and quantitative analysis of drugs in urine. Anal. Chem. 2010, 82, 7502–7508. [Google Scholar] [CrossRef]
- Kennedy, J.H.; Wiseman, J.M. Evaluation and performance of desorption electrospray ionization using a triple quadrupole mass spectrometer for quantitation of pharmaceuticals in plasma. Rapid Commun. Mass Spectrom. 2010, 24, 309–314. [Google Scholar] [CrossRef]
- Wiseman, J.M.; Ifa, D.R.; Zhu, Y.; Kissinger, C.B.; Manicke, N.E.; Kissinger, P.T.; Cooks, R.G. Desorption electrospray ionization mass spectrometry: Imaging drugs and metabolites in tissues. Proc. Natl. Acad. Sci. USA 2008, 105, 18120. [Google Scholar] [CrossRef] [Green Version]
- Lamont, L.; Eijkel, G.B.; Jones, E.A.; Flinders, B.; Ellis, S.R.; Porta Siegel, T.; Heeren, R.M.A.; Vreeken, R.J. Targeted Drug and Metabolite Imaging: Desorption Electrospray Ionization Combined with Triple Quadrupole Mass Spectrometry. Anal. Chem. 2018, 90, 13229–13235. [Google Scholar] [CrossRef] [Green Version]
- Swales, J.G.; Tucker, J.W.; Strittmatter, N.; Nilsson, A.; Cobice, D.; Clench, M.R.; Mackay, C.L.; Andren, P.E.; Takats, Z.; Webborn, P.J.; et al. Mass spectrometry imaging of cassette-dosed drugs for higher throughput pharmacokinetic and biodistribution analysis. Anal. Chem. 2014, 86, 8473–8480. [Google Scholar] [CrossRef] [Green Version]
- Tillner, J.; Wu, V.; Jones, E.A.; Pringle, S.D.; Karancsi, T.; Dannhorn, A.; Veselkov, K.; McKenzie, J.S.; Takats, Z. Faster, More Reproducible DESI-MS for Biological Tissue Imaging. J. Am. Soc. Mass Spectrom. 2017, 28, 2090–2098. [Google Scholar] [CrossRef] [Green Version]
- Nilsson, A.; Goodwin, R.J.; Swales, J.G.; Gallagher, R.; Shankaran, H.; Sathe, A.; Pradeepan, S.; Xue, A.; Keirstead, N.; Sasaki, J.C.; et al. Investigating nephrotoxicity of polymyxin derivatives by mapping renal distribution using mass spectrometry imaging. Chem. Res. Toxicol. 2015, 28, 1823–1830. [Google Scholar] [CrossRef]
- Kallback, P.; Nilsson, A.; Shariatgorji, M.; Andren, P.E. msIQuant—Quantitation Software for Mass Spectrometry Imaging Enabling Fast Access, Visualization, and Analysis of Large Data Sets. Anal. Chem. 2016, 88, 4346–4353. [Google Scholar] [CrossRef]
- Takáts, Z.; Wiseman, J.M.; Cooks, R.G. Ambient mass spectrometry using desorption electrospray ionization (DESI): Instrumentation, mechanisms and applications in forensics, chemistry, and biology. J. Mass Spectrom. 2005, 40, 1261–1275. [Google Scholar] [CrossRef]
- Khatib-Shahidi, S.; Andersson, M.; Herman, J.L.; Gillespie, T.A.; Caprioli, R.M. Direct molecular analysis of whole-body animal tissue sections by imaging MALDI mass spectrometry. Anal. Chem. 2006, 78, 6448–6456. [Google Scholar] [CrossRef]
- Lamont, L.; Hadavi, D.; Viehmann, B.; Flinders, B.; Heeren, R.M.A.; Vreeken, R.J.; Porta Siegel, T. Quantitative mass spectrometry imaging of drugs and metabolites: A multiplatform comparison. Anal. Bioanal. Chem. 2021, 413, 2779–2791. [Google Scholar] [CrossRef]
- Azad, M.A.; Akter, J.; Rogers, K.L.; Nation, R.L.; Velkov, T.; Li, J. Major pathways of polymyxin-induced apoptosis in rat kidney proximal tubular cells. Antimicrob. Agents Chemother. 2015, 59, 2136–2143. [Google Scholar] [CrossRef] [Green Version]
- Azad, M.A.; Finnin, B.A.; Poudyal, A.; Davis, K.; Li, J.; Hill, P.A.; Nation, R.L.; Velkov, T.; Li, J. Polymyxin B Induces Apoptosis in Kidney Proximal Tubular Cells. Antimicrob. Agents Chemother. 2013, 57, 4329–4335. [Google Scholar] [CrossRef] [Green Version]
- Robichaud, G.; Garrard, K.P.; Barry, J.A.; Muddiman, D.C. MSiReader: An open-source interface to view and analyze high resolving power MS imaging files on Matlab platform. J. Am. Soc. Mass Spectrom. 2013, 24, 718–721. [Google Scholar] [CrossRef] [Green Version]
- Calder, P.C. Polyunsaturated fatty acids and inflammatory processes: New twists in an old tale. Biochimie 2009, 91, 791–795. [Google Scholar] [CrossRef]
- Yang, L.V.; Radu, C.G.; Wang, L.; Riedinger, M.; Witte, O.N. Gi-independent macrophage chemotaxis to lysophosphatidylcholine via the immunoregulatory GPCR G2A. Blood 2005, 105, 1127–1134. [Google Scholar] [CrossRef] [Green Version]
- Ryborg, A.K.; Deleuran, B.; Thestrup-Pedersen, K.; Kragballe, K. Lysophosphatidylcholine: A chemoattractant to human T lymphocytes. Arch. Dermatol. Res. 1994, 286, 462–465. [Google Scholar] [CrossRef]
- Pauter, A.M.; Olsson, P.; Asadi, A.; Herslof, B.; Csikasz, R.I.; Zadravec, D.; Jacobsson, A. Elovl2 ablation demonstrates that systemic DHA is endogenously produced and is essential for lipid homeostasis in mice. J. Lipid Res. 2014, 55, 718–728. [Google Scholar] [CrossRef] [Green Version]
- Smith, A.; Galli, M.; Piga, I.; Denti, V.; Stella, M.; Chinello, C.; Fusco, N.; Leni, D.; Manzoni, M.; Roversi, G.; et al. Molecular signatures of medullary thyroid carcinoma by matrix-assisted laser desorption/ionisation mass spectrometry imaging. J. Proteom. 2019, 191, 114–123. [Google Scholar] [CrossRef]
- Woolman, M.; Katz, L.; Gopinath, G.; Kiyota, T.; Kuzan-Fischer, C.M.; Ferry, I.; Zaidi, M.; Peters, K.; Aman, A.; McKee, T.; et al. Mass Spectrometry Imaging Reveals a Gradient of Cancer-like Metabolic States in the Vicinity of Cancer Not Seen in Morphometric Margins from Microscopy. Anal. Chem. 2021, 93, 4408–4416. [Google Scholar] [CrossRef]
- Doria, M.L.; McKenzie, J.S.; Mroz, A.; Phelps, D.L.; Speller, A.; Rosini, F.; Strittmatter, N.; Golf, O.; Veselkov, K.; Brown, R.; et al. Epithelial ovarian carcinoma diagnosis by desorption electrospray ionization mass spectrometry imaging. Sci. Rep. 2016, 6, 39219. [Google Scholar] [CrossRef] [Green Version]
- McMahon, J.; O’Brien, C.J.; Pathak, I.; Hamill, R.; McNeil, E.; Hammersley, N.; Gardiner, S.; Junor, E. Influence of condition of surgical margins on local recurrence and disease-specific survival in oral and oropharyngeal cancer. Br. J. Oral Maxillofac. Surg. 2003, 41, 224–231. [Google Scholar] [CrossRef]
- Ganly, I.; Patel, S.; Shah, J. Early stage squamous cell cancer of the oral tongue—Clinicopathologic features affecting outcome. Cancer 2012, 118, 101–111. [Google Scholar] [CrossRef]


Disclaimer/Publisher’s Note: The statements, opinions and data contained in all publications are solely those of the individual author(s) and contributor(s) and not of MDPI and/or the editor(s). MDPI and/or the editor(s) disclaim responsibility for any injury to people or property resulting from any ideas, methods, instructions or products referred to in the content. |
© 2023 by the authors. Licensee MDPI, Basel, Switzerland. This article is an open access article distributed under the terms and conditions of the Creative Commons Attribution (CC BY) license (https://creativecommons.org/licenses/by/4.0/).
Share and Cite
Dannhorn, A.; Doria, M.L.; McKenzie, J.; Inglese, P.; Swales, J.G.; Hamm, G.; Strittmatter, N.; Maglennon, G.; Ghaem-Maghami, S.; Goodwin, R.J.A.; et al. Targeted Desorption Electrospray Ionization Mass Spectrometry Imaging for Drug Distribution, Toxicity, and Tissue Classification Studies. Metabolites 2023, 13, 377. https://doi.org/10.3390/metabo13030377
Dannhorn A, Doria ML, McKenzie J, Inglese P, Swales JG, Hamm G, Strittmatter N, Maglennon G, Ghaem-Maghami S, Goodwin RJA, et al. Targeted Desorption Electrospray Ionization Mass Spectrometry Imaging for Drug Distribution, Toxicity, and Tissue Classification Studies. Metabolites. 2023; 13(3):377. https://doi.org/10.3390/metabo13030377
Chicago/Turabian StyleDannhorn, Andreas, Maria Luisa Doria, James McKenzie, Paolo Inglese, John G. Swales, Gregory Hamm, Nicole Strittmatter, Gareth Maglennon, Sadaf Ghaem-Maghami, Richard J. A. Goodwin, and et al. 2023. "Targeted Desorption Electrospray Ionization Mass Spectrometry Imaging for Drug Distribution, Toxicity, and Tissue Classification Studies" Metabolites 13, no. 3: 377. https://doi.org/10.3390/metabo13030377