Article

Assessing the Effectiveness of Chemical Marker Extraction from Amazonian Plant Cupuassu (Theobroma grandiflorum) by PSI-HRMS/MS and LC-HRMS/MS

by
Nerilson M. Lima
1,
Gesiane S. Lima
1,
Gabriel F. dos Santos
1,
Gagan Preet
2,
Lanaia I. L. Maciel
1,
Teresinha de Jesus A. S. Andrade
3,
Marcel Jaspars
2,
Andrea R. Chaves
1,* and
Boniek G. Vaz
1,*
1
Institute of Chemistry, Federal University of Goias, Goiânia 74690-900, Brazil
2
Marine Biodiscovery Centre, Department of Chemistry, University of Aberdeen, Aberdeen AB24 3UE, UK
3
Federal Institute of Maranhão, Timon Campus, Timon 65635-468, Brazil
*
Authors to whom correspondence should be addressed.
Metabolites 2023, 13(3), 367; https://doi.org/10.3390/metabo13030367
Submission received: 25 January 2023 / Revised: 14 February 2023 / Accepted: 20 February 2023 / Published: 1 March 2023

Abstract

:
Employing a combination of liquid chromatography electrospray ionization and paper spray ionization high-resolution tandem mass spectrometry, extracts from cupuassu (Theobroma grandiflorum) pulp prepared with either water, methanol, acetonitrile or combinations thereof were subjected to metabolite fingerprinting. Among the tested extractors, 100% methanol extracted preferentially phenols and cinnamic acids derivatives, whereas acetonitrile and acetonitrile/methanol were more effective in extracting terpenoids and flavonoids, respectively. And while liquid chromatography- mass spectrometry detected twice as many metabolites as paper spray ionization tandem mass spectrometry, the latter proved its potential as a screening technique. Comprehensive structural annotation showed a high production of terpenes, mainly oleanane triterpene derivatives. of the mass spectra Further, five major metabolites with known antioxidant activity, namely catechin, citric acid, epigallocatechin-3′-glucuronide, 5,7,8-trihydroxyflavanone, and asiatic acid, were subjected to molecular docking analysis using the antioxidative enzyme peroxiredoxin 5 (PRDX5) as a model receptor. Based on its excellent docking score, a pharmacophore model of 5,7,8-trihydroxyflavanone was generated, which may help the design of new antioxidants.

Graphical Abstract

1. Introduction

Cupuassu (Theobroma grandiflorum Willd. ex Spreng. K.), a member of the Malvaceae family, is a tropical fruit widely grown in the Amazon Rainforest, especially in northern Brazil, and is commonly related to cacao (Theobroma cacao L.). T. grandiflorum has brown-colored fruit with a length of around 12–25 cm, and a weight of 1 to 2 kg per fruit. The pulp presents a yellowish-white color and is highly appreciated due to its excellent texture and intense flavor [1,2]. Cupuassu is of great economic importance, since the pulp is of great interest in the cosmetics industry in the preparation of fragrances and widely used in food technology due to its nutritional value and commercial applications in the preparation of juices, sorbets, ice creams, jams, liquors, sweets, and derived products [3,4,5]. The fruit pulp has a characteristic acidic taste and is a rich source of antioxidant polyphenols such as catechin, 8-hydroxy-flavones, proanthocyanidins, flavan-3-ols, and citric acid [5,6,7].
Considering the biotechnological potential of cupuassu and the scarcity of chromatographic and spectrometric data that allow for a comprehensive metabolic characterization of its fruits, there is a need to develop analytical methodologies and apply state-of-the-art technologies for the qualitative and quantitative determination of metabolites for this widely consumed fruit. Mass spectrometry (MS)-based analytical platforms stand out for their ability to dereplicate complex samples and detect trace-level molecules due to their high selectivity, sensitivity, speed, and versatility [8,9,10,11]. In addition to its high resolving power and the ability to provide high-precision molecular formulas, this technique can be hyphenated to chromatographic separation equipment, increasing its metabolic coverage capacity [10,11,12].
Aiming to reduce the multistep, laborious, and high-solvent-consumption process usually involved in conventional MS methods, ambient mass spectrometry (AMS) techniques have been increasingly applied to the analysis of natural products [13,14,15]. Paper spray ionization (PSI) is one of the most used ambient ionization techniques in food chemistry and metabolite fingerprinting of fruits, as it provides reliable and rapid results at low cost [16,17,18,19,20,21,22].
For PSI-MS analysis, a relatively small sample volume (less than about 50 μL) is placed onto a triangular piece of paper held in front of the mass spectrometer inlet. Sample ionization is conducted by applying a high voltage to the paper moistened with a small amount of solution. There are different ways to load the sample: it can be directly loaded onto the paper surface, combined with the wetting solution, or removed from surfaces using the paper as a wipe [21,23].
The aim of this study was to apply liquid chromatography–high-resolution mass spectrometry (LC-HRMS/MS) and paper spray ionization–high-resolution mass spectrometry (PSI-HRMS/MS) to the metabolic characterization of cupuassu (T. grandiflorum) pulp extracted with different solvents. Mass spectra obtained were comprehensively using various dereplication tools. Finally, the holistic biological properties of the compounds identified were predicted by applying molecular docking approaches.

2. Materials and Methods

2.1. Chemicals

HPLC-grade methanol (MeOH) and acetonitrile (ACN) were acquired from Tedia (Fairfield, CT, USA). Ultrapure water was obtained using a water purification system (Master System MS2000, Gehaka, São Paulo, Brazil).

2.2. Sample Preparation

Theobroma grandiflorum fruits were purchased from a local market in Manaus, Brazil. The pulp of T. grandiflorum fruits was sliced manually using a sterile knife and dried at 30 °C for 48 h. Aliquots of 1 g of dried pulp were extracted separately using 10 mL of water (H2O), methanol (MeOH), acetonitrile (ACN), H2O/MeOH (1:1, v/v), MeOH/ACN (1:1, v/v), ACN/H2O (1:1, v/v), and H2O/MeOH/ACN (1:1:1, v/v/v) [24,25]. The extracts were diluted to a concentration of 500 µg mL−1 prior to LC-HRMS/MS and PSI-HR-MS/MS analyses.

2.3. LC-MS Analysis

LC-MS/MS analyses were performed as described in a previous study [26] on an HPLC-UV 1220 Infinity II instrument (Agilent Technologies, Santa Clara, CA, USA) coupled with a Q-Exactive hybrid quadrupole-Orbitrap high-resolution mass spectrometer (Thermo Scientific, Waltham, MA, USA) using an electrospray ionization source. An InfinityLab Poroshell 120 EC-C18 column (4.6 × 100 mm × 2.7 μm Agilent) was used in this study. All samples were analyzed using a gradient elution program. The binary mobile phase comprised A (water with 0.1% formic acid) and B (methanol). The mobile phase was acidified (0.1% formic acid) in order to reduce the issue of coelution and tailing effect. The gradient elution started at 5% B and was linearly increased to 100% B in 40 min and kept constant for 10 min at 100% B. The eluent was then restored to the initial conditions within 10 min. The flow rate was set at 0.3 mL min−1. The injection volume was 30 μL, and the column temperature was set at 35 °C. The ESI source conditions were set as follows: spray voltage, 3.5 kV (in both ionization modes); capillary temperature, 250 °C (positive mode) and 320 °C (negative mode); S-lens RF level, 60 V (in both ionization modes); sheath gas flow rate, 47 L min−1 (positive mode) and 35 L min−1 (negative mode); and aux gas flow rate, 11 L min−1 (positive mode) and 10 L min−1 (negative mode). In both ESI positive and negative modes, high-resolution mass spectra were obtained in the full MS/data-dependent-MS2 (dd-MS2) mode. The mass range in the full MS scanning experiments was m/z 100–1200. The top 5 (TopN, 5; loop count, 5) most abundant precursors were sequentially transferred for collision-induced fragmentation acquisition. The collision energies for target analytes were 20, 30, and 35 eV. Resolving power was set at 140,000 and 70,000 for full MS and dd-MS2 acquisitions, respectively.

2.4. PSI-MS

PSI-MS analysis was performed using previously described protocols [27,28,29]. The membrane was cut into an equilateral triangle with 1 cm sides and held by a metal clip connected to the voltage source of the mass spectrometer. The membrane was positioned approximately 4 mm from the mass spectrometer inlet. The extract (15 μL) was deposited on the membrane and dried under ambient conditions for 1 min. Subsequently, the voltage source was turned on, and 15 μL of acidified methanol (0.1% formic acid, v/v) was used as a spray solvent. The analyses were performed in triplicate using a Q-Exactive hybrid quadrupole-Orbitrap mass spectrometer (Thermo Scientific) with the following instrumental parameters: positive ionization mode; spray voltage, 3.5 kV; acquisition time, 1 min; capillary temperature, 275 °C; capillary voltage, 38 V; and tube lens, 50 V.

2.5. Compound Characterization

The files acquired by the Q-Exactive hybrid quadrupole-Orbitrap mass spectrometer for the cupuassu extracts were converted from raw to mzML format using MSConvert software (ProteoWizard, Palo Alto, CA, USA). Then, the data were processed using MZmine software, version 2.53. We used metadata to organize compound information according to the online workflow available in the GNPS (Global Natural Products Social Molecular Networking) documentation. Structural annotation and data mining were performed using the experimental and in silico tools available in the GNPS platform [26].

2.6. Molecular Docking

Molecular docking analysis was performed using Autodock Vina v.1.2.0 (The Scripps Research Institute, La Jolla, CA, USA) docking software [30]. The receptor site was predicted using LigandScout 4.4 (Inte: Ligand) advanced software [31], which identifies putative binding pockets by creating a grid surface and calculating the buriedness value of each grid point on the surface.
The resulting pocket grid consists of several clusters of grid points rendered using an iso surface connecting the grid points to each other. The iso surface represents an empty space that may be suitable for creating a pocket. The x-ray crystal structures of tyrosinase from Bacillus megatarium (PDB: 3NM8) [32] and human peroxiredoxin 5, a novel type of mammalian peroxiredoxin (PDB: 1HD2) [33], were retrieved from the Protein Data Bank and utilized to perform docking simulations.
The box center and size coordinates for PDB: 3NM8 were −5.59208 Å × −3.33416 Å × 10.2111 Å and 31.5668 Å × 22.6662 Å × 23.0593 Å, and those for PDB: 1HD2 were 18.9015 Å × 44.192 Å × 28.1802 Å and 12.81 Å × 17.1255 Å × 15.8749 Å, respectively, around the active site. The following default search parameters were used: 10 binding modes; exhaustiveness, 8; and maximum energy difference, 3 kcal/mol. Chimera 1.16 and UCSF_USA [34,35] were used for visualization and calculation of protein-ligand interactions.

2.7. 3D Pharmacophore Model Generation

LigandScout 4.4 by Inte Ligand advanced software (Wolber and Langer, Vienna, Austria) [31] was used to generate a 3D pharmacophore model. The espresso algorithm was used to generate a ligand-based pharmacophore. The compatibility of the generated pharmacophore model with the pharmacophore hypothesis was determined using default settings for LigandScout. The relative pharmacophore-fit scoring function, and merged feature pharmacophore type were used for ligand-based pharmacophore creation, and the feature tolerance scale factor was set to 1.0. The best model was selected from the 10 generated models.

3. Results and Discussion

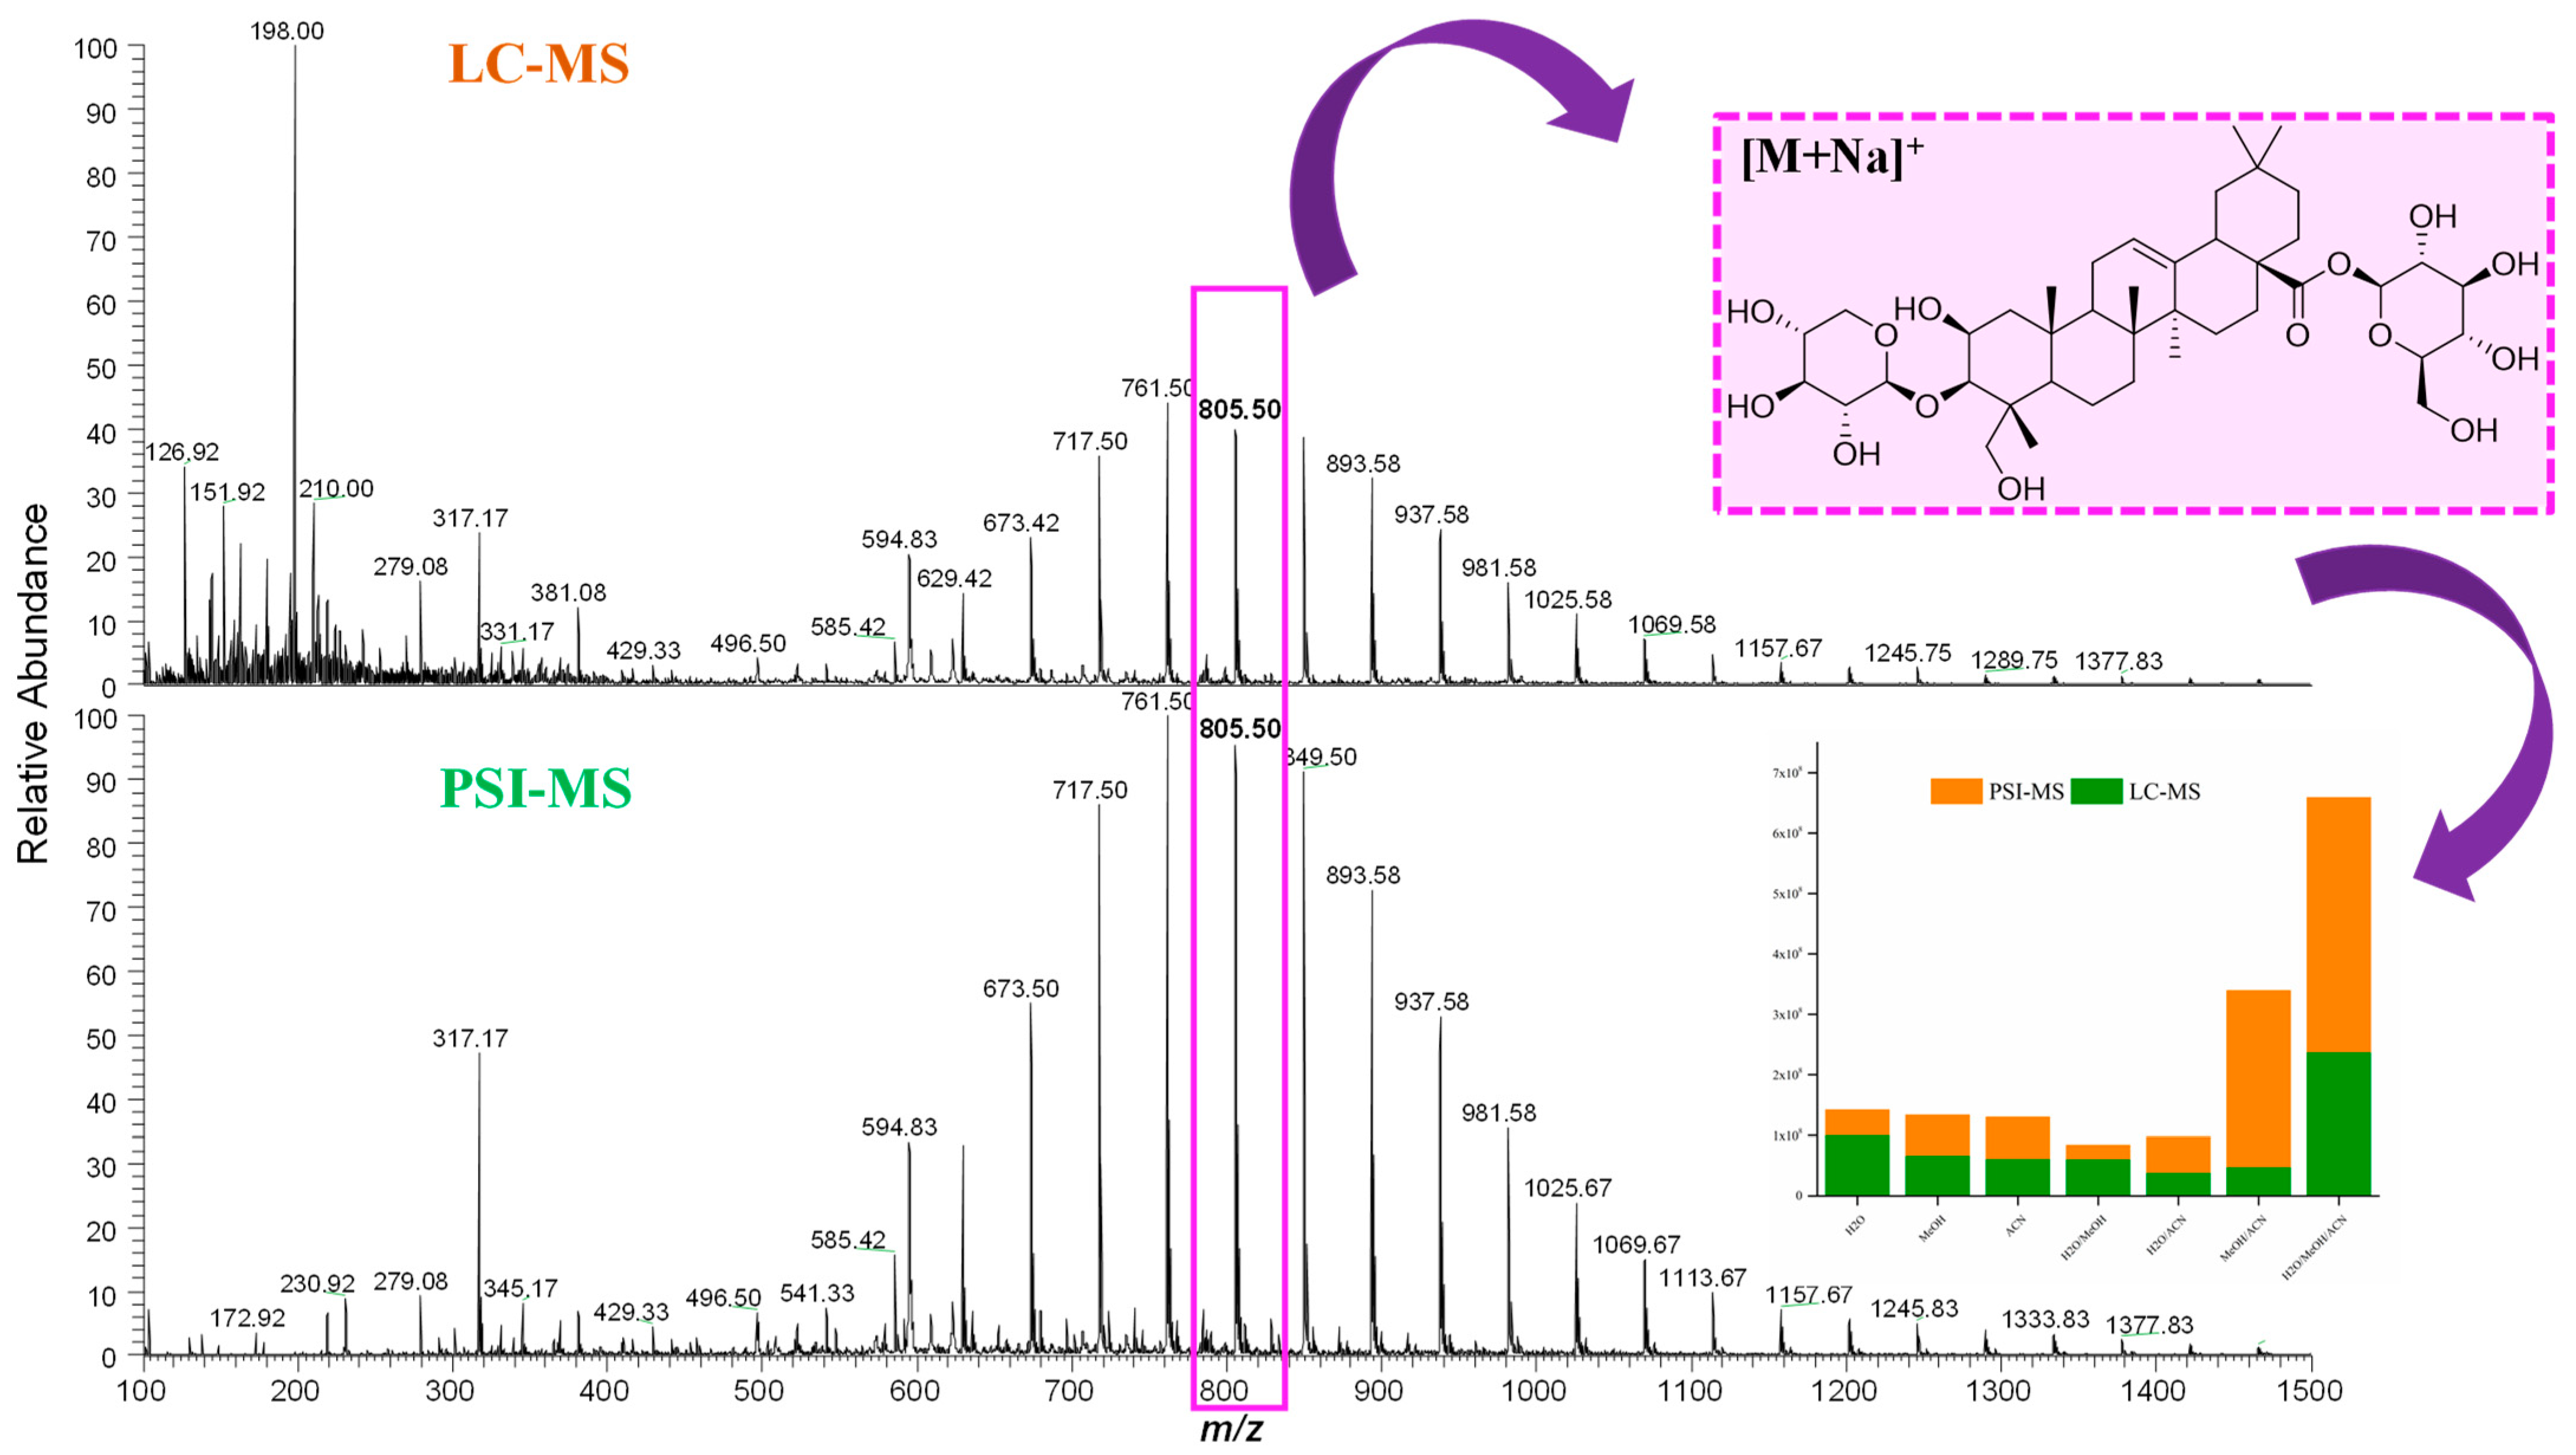
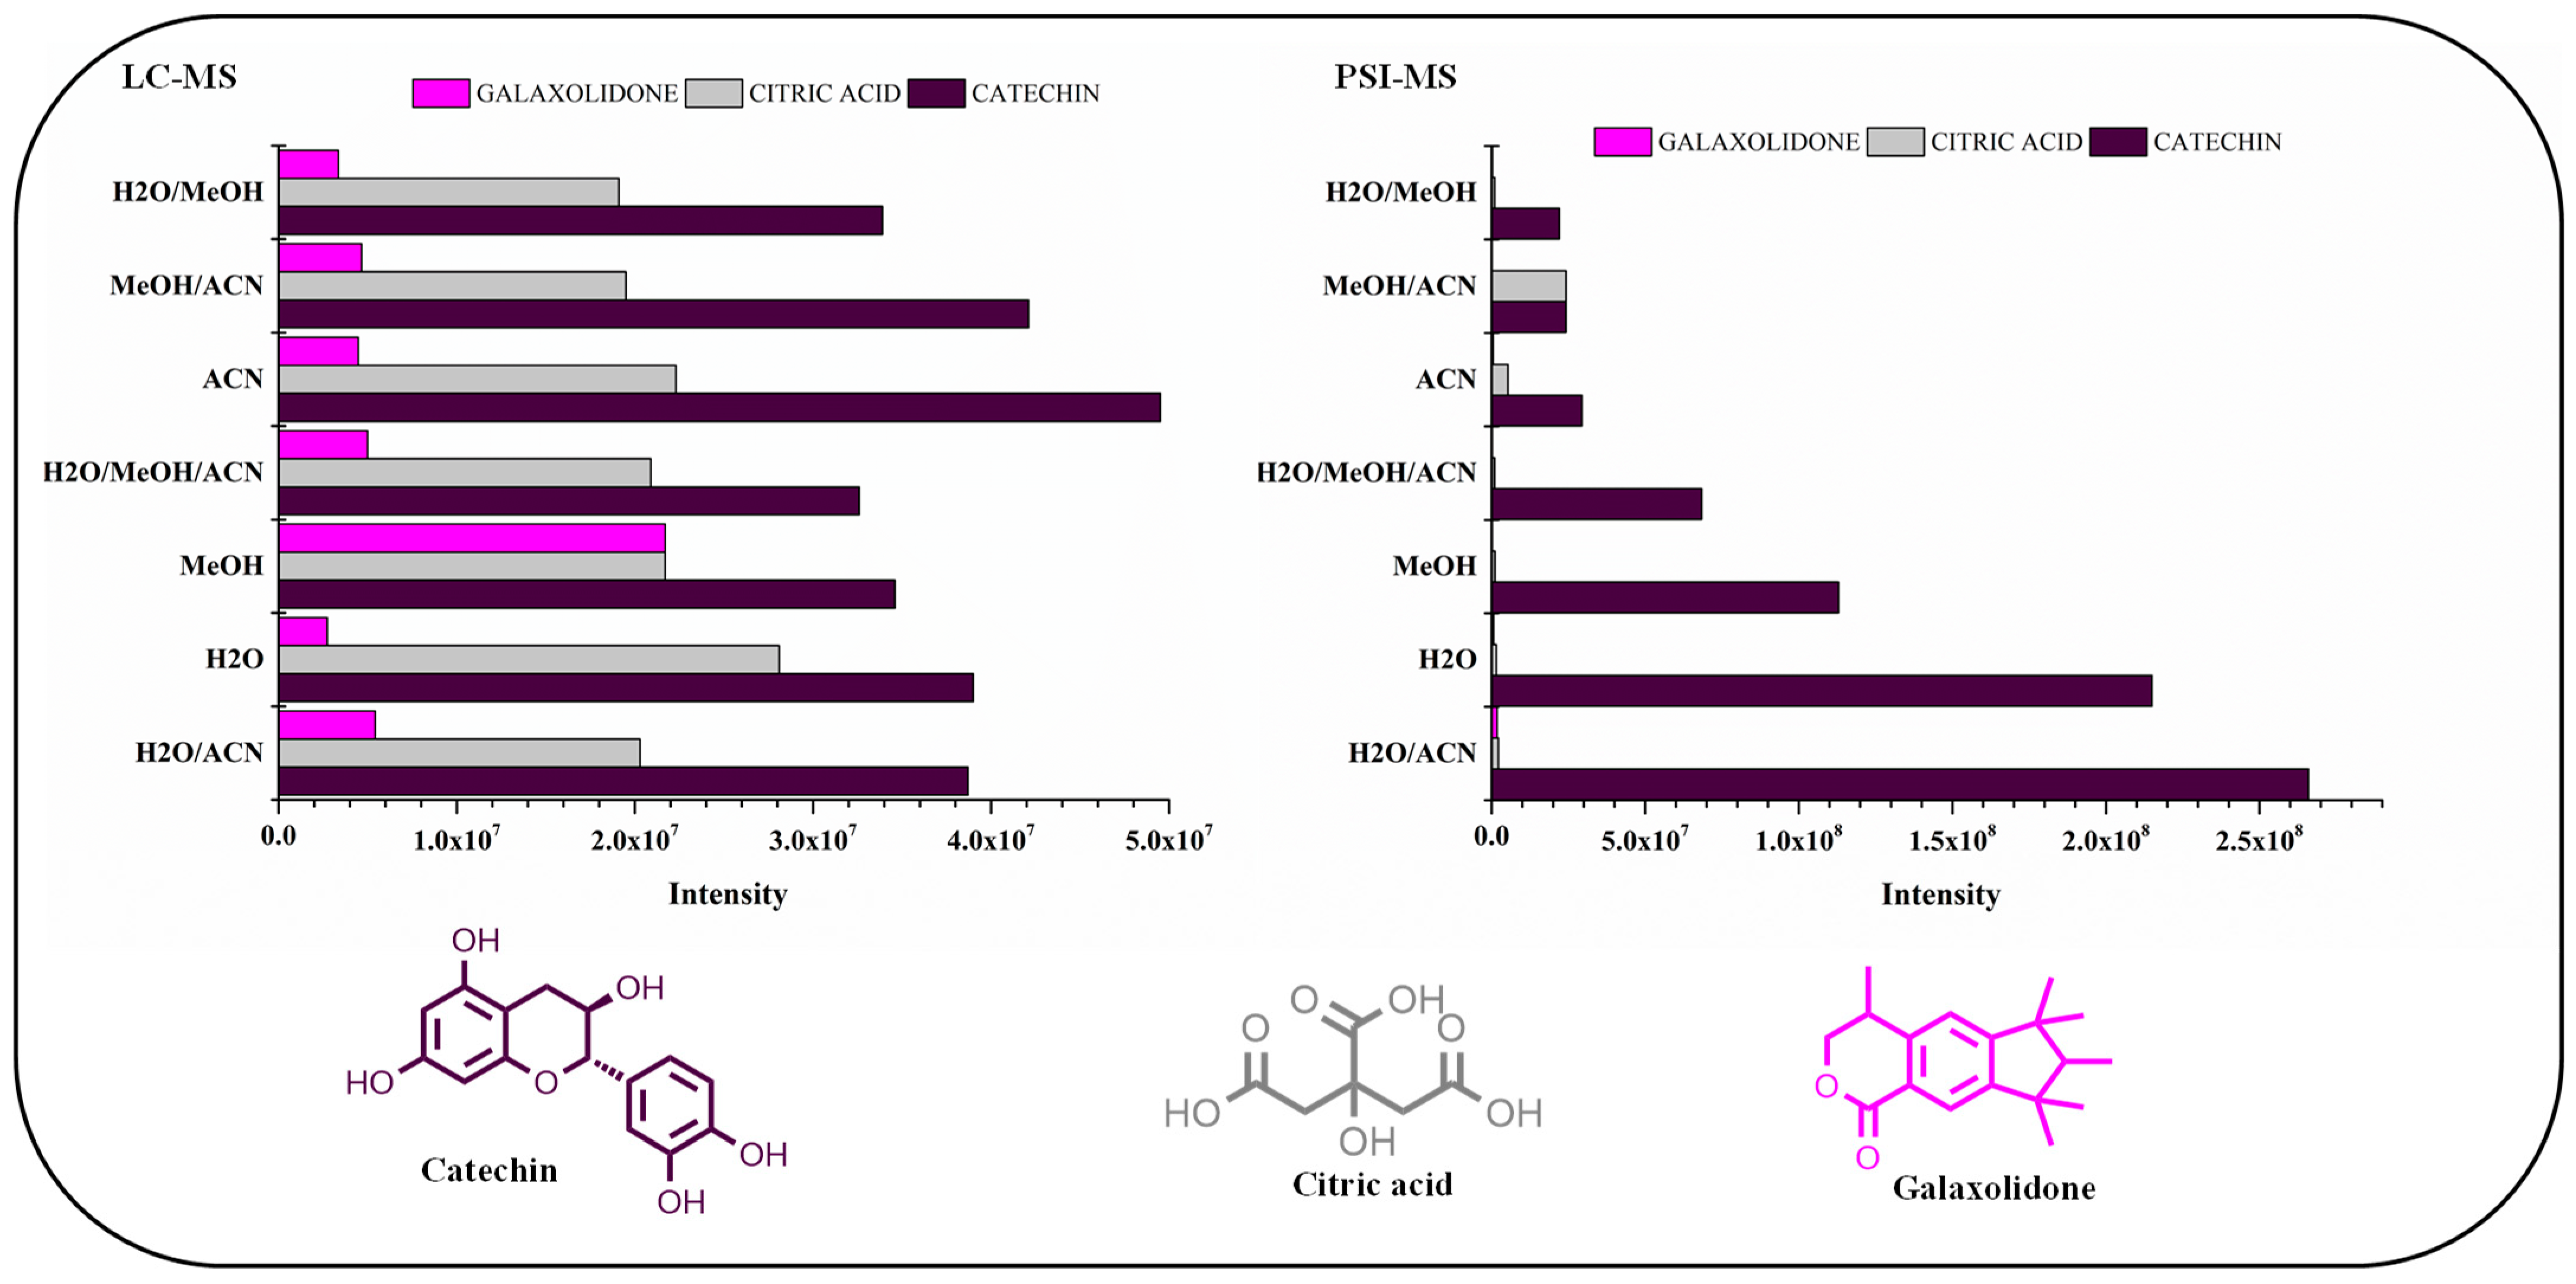
3.1. Comprehensive Metabolite Annotation of Cupuassu (T. grandiflorum) Pulp Extract

Paper spray ionization–high-resolution mass spectrometry (PSI-HRMS/MS) liquid chromatography–high-resolution mass spectrometry (LC-HRMS/MS) data were used for the comprehensive structural annotation of cupuassu pulp extract. The metabolite annotation was based on accurate mass (m/z) and MS/MS fragmentation pattern and compared with data from the literature. UV spectra and chromatographic retention time data obtained from the chromatographic analysis were used to distinguish isobaric and isomeric compounds and improve the confidence level of the metabolic annotations [36,37,38,39]. Tandem mass spectrometry (MS/MS) data collected in positive ionization mode (ESI(+)) were applied for dereplication, and in silico fragmentation tools combined with classical molecular networking (MN) [40], feature-based molecular networking (FBMN) [41], Dereplicator+ [42], network annotation propagation (NAP) [43], Moldiscovery [44], MS2LDA [45], and MolNetEnhancer [46] resulted in level 2 identification according to the Metabolomic Standard Initiative (MSI) [47]. In order to evaluate the concentration of metabolites in the samples, we applied the FBMN tool using the relative abundance of ions from the data processing performed using MzMine2 software. To assist in statistical analyses, we also used the MS-DIAL and Progenesis QI tools.
The tools employed in this study provided candidates with high confidence in structural annotation and can guide the discovery of biologically active compounds.
The remarkable biotechnological potential of cupuassu pulp is evidenced by the wide molecular diversity of compounds identified.. The evaluation of the metabolic content using computational tools allowed the structural annotation of 20 metabolites with elevated confidence level, in addition to the complexity of substances derived from the triterpenoid oleanane (Table 1). Inspection of the hits suggested by the GNPS spectral library identified spectral library matching candidates with similarity greater than 90%, m/z error (ppm) less than 10, and the most shared peaks in the MS/MS spectrum. All the annotated metabolites have been previously described in the Theobroma genus.
The library matches obtained using the classical molecular network (MN) yielded a total of 1220 hits with 315 unique library compounds. The propagation of structural annotation was performed using in silico fragmentation tools, automated chemical classification, and molecular fragmentation data decomposition tools such as network annotation propagation (NAP), Dereplicator+, Moldiscovery, MS2LDA, and MolNetEnhancer. The Moldiscovery tool yielded a total of 2495 unique metabolites, whereas the in silico dereplication tool Dereplicator+ yielded 341 unique metabolites, and the tool NAP yielded 196 metabolites by NAP-fusion in silico prediction. The MolNetEnhancer tool showed a wide metabolic diversity, mainly polyphenols, organic acids, and terpenes.

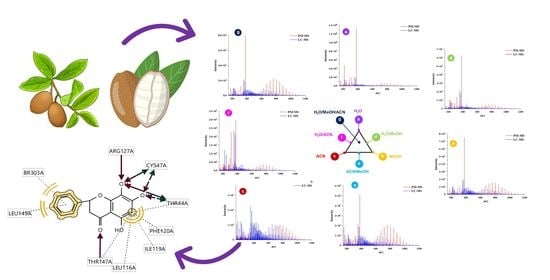
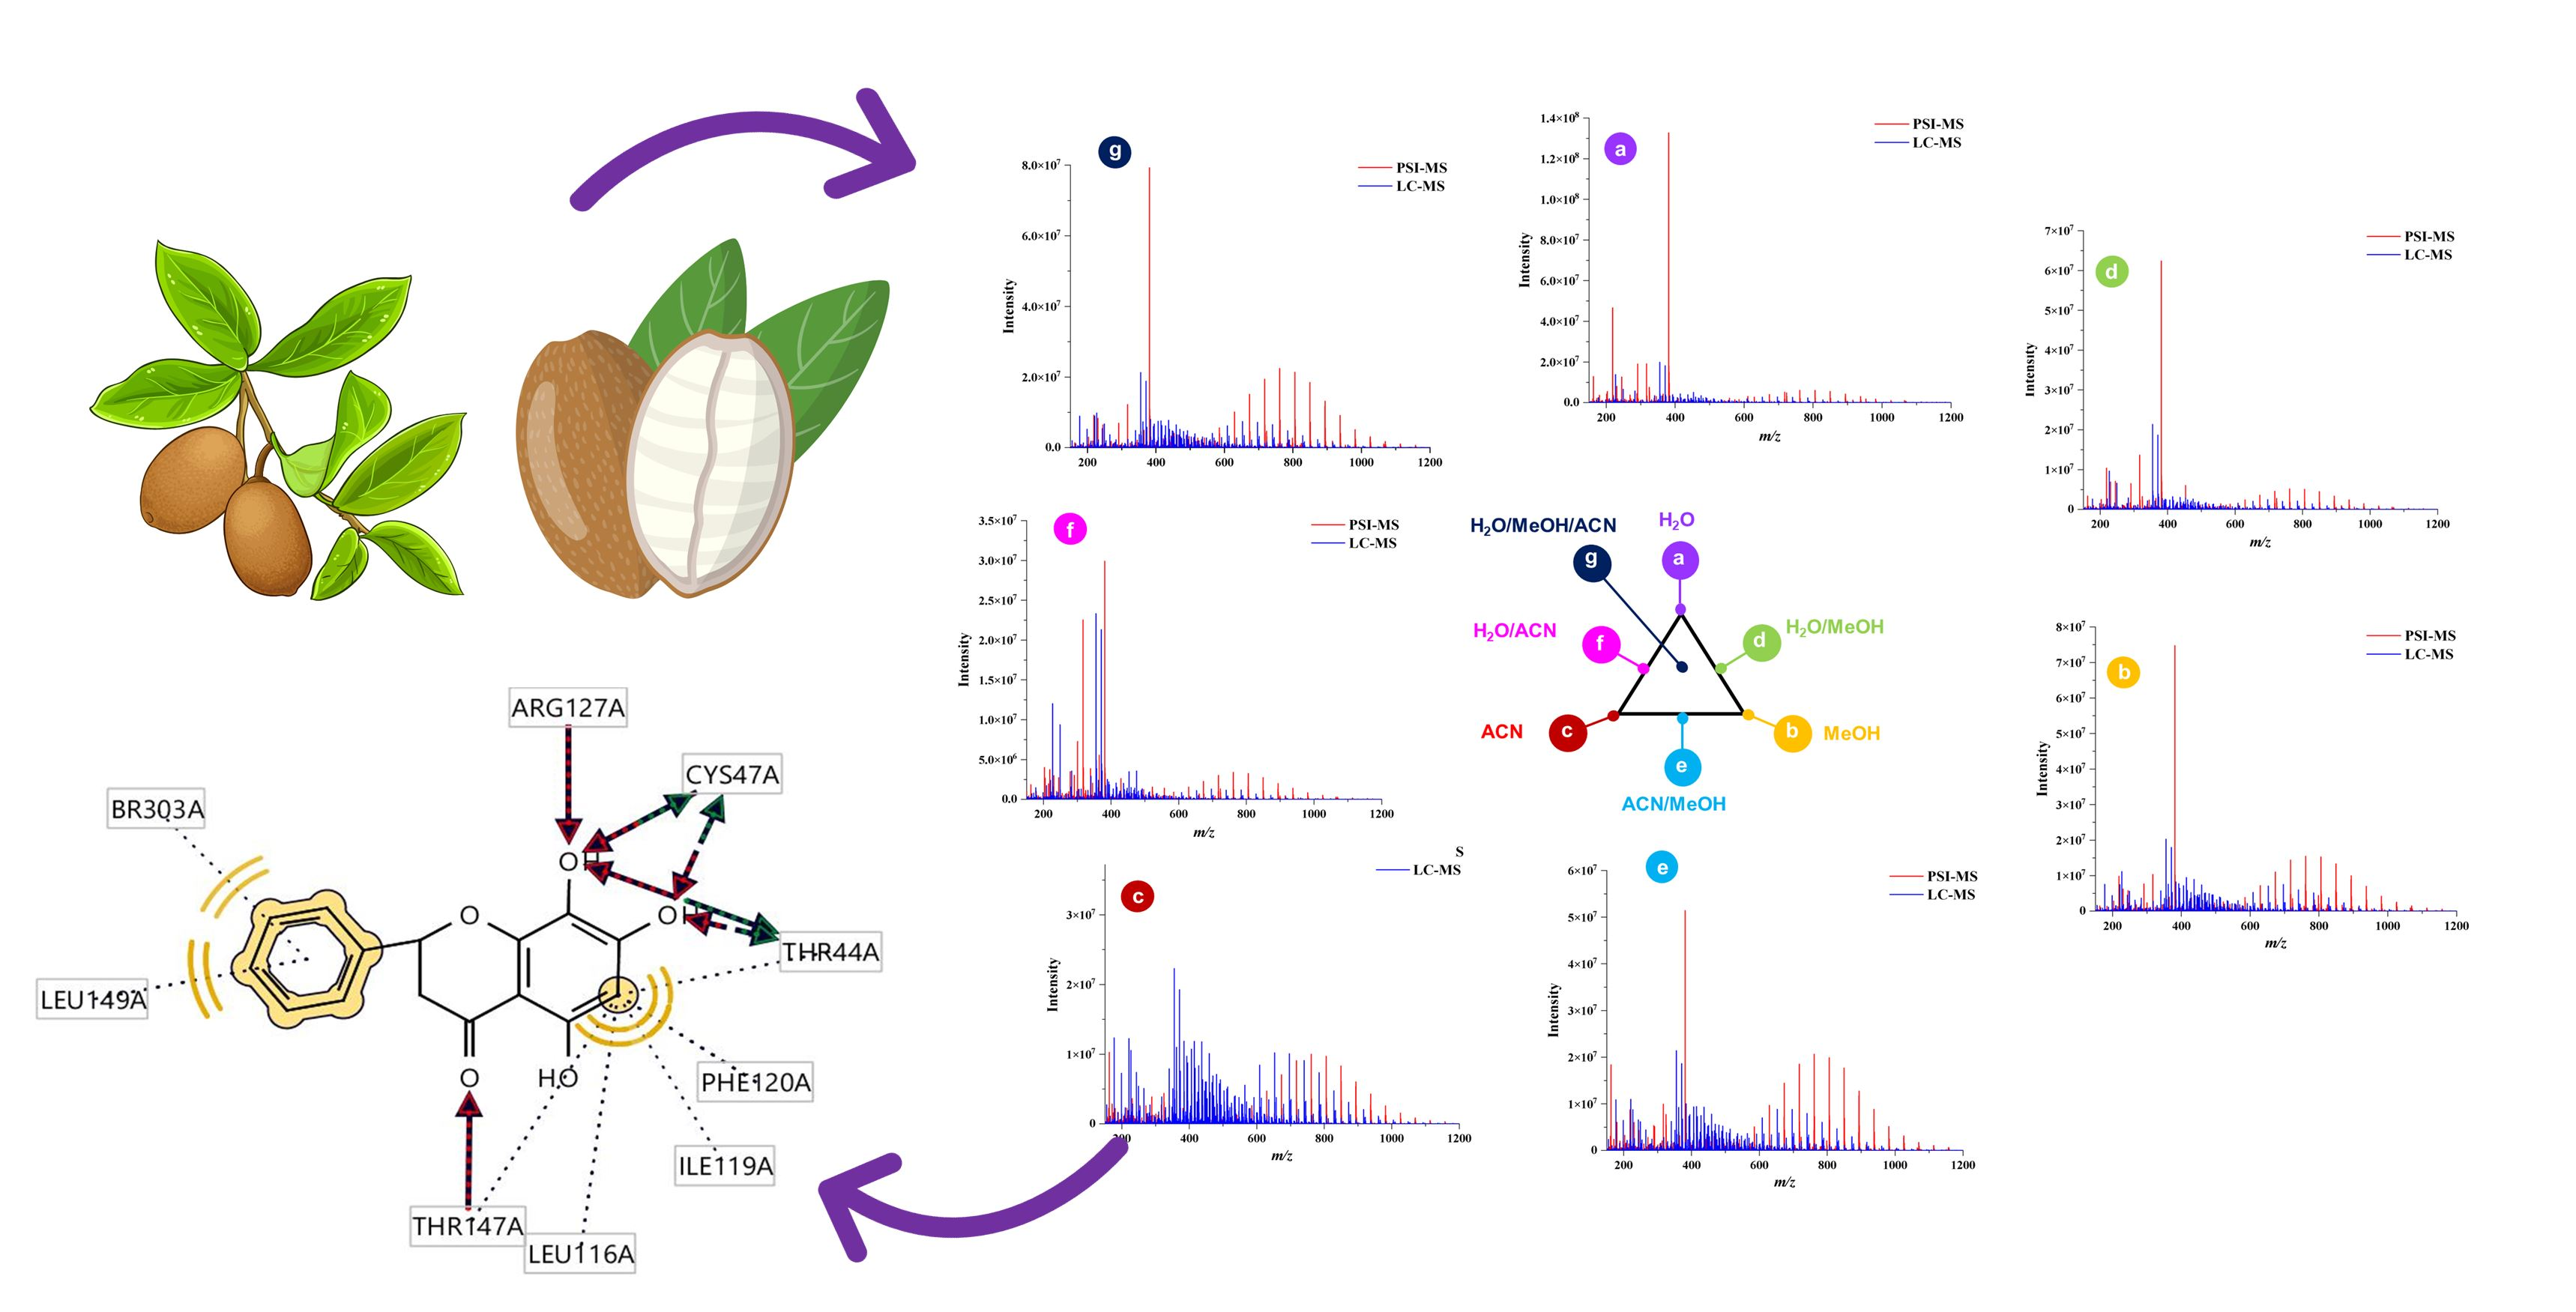
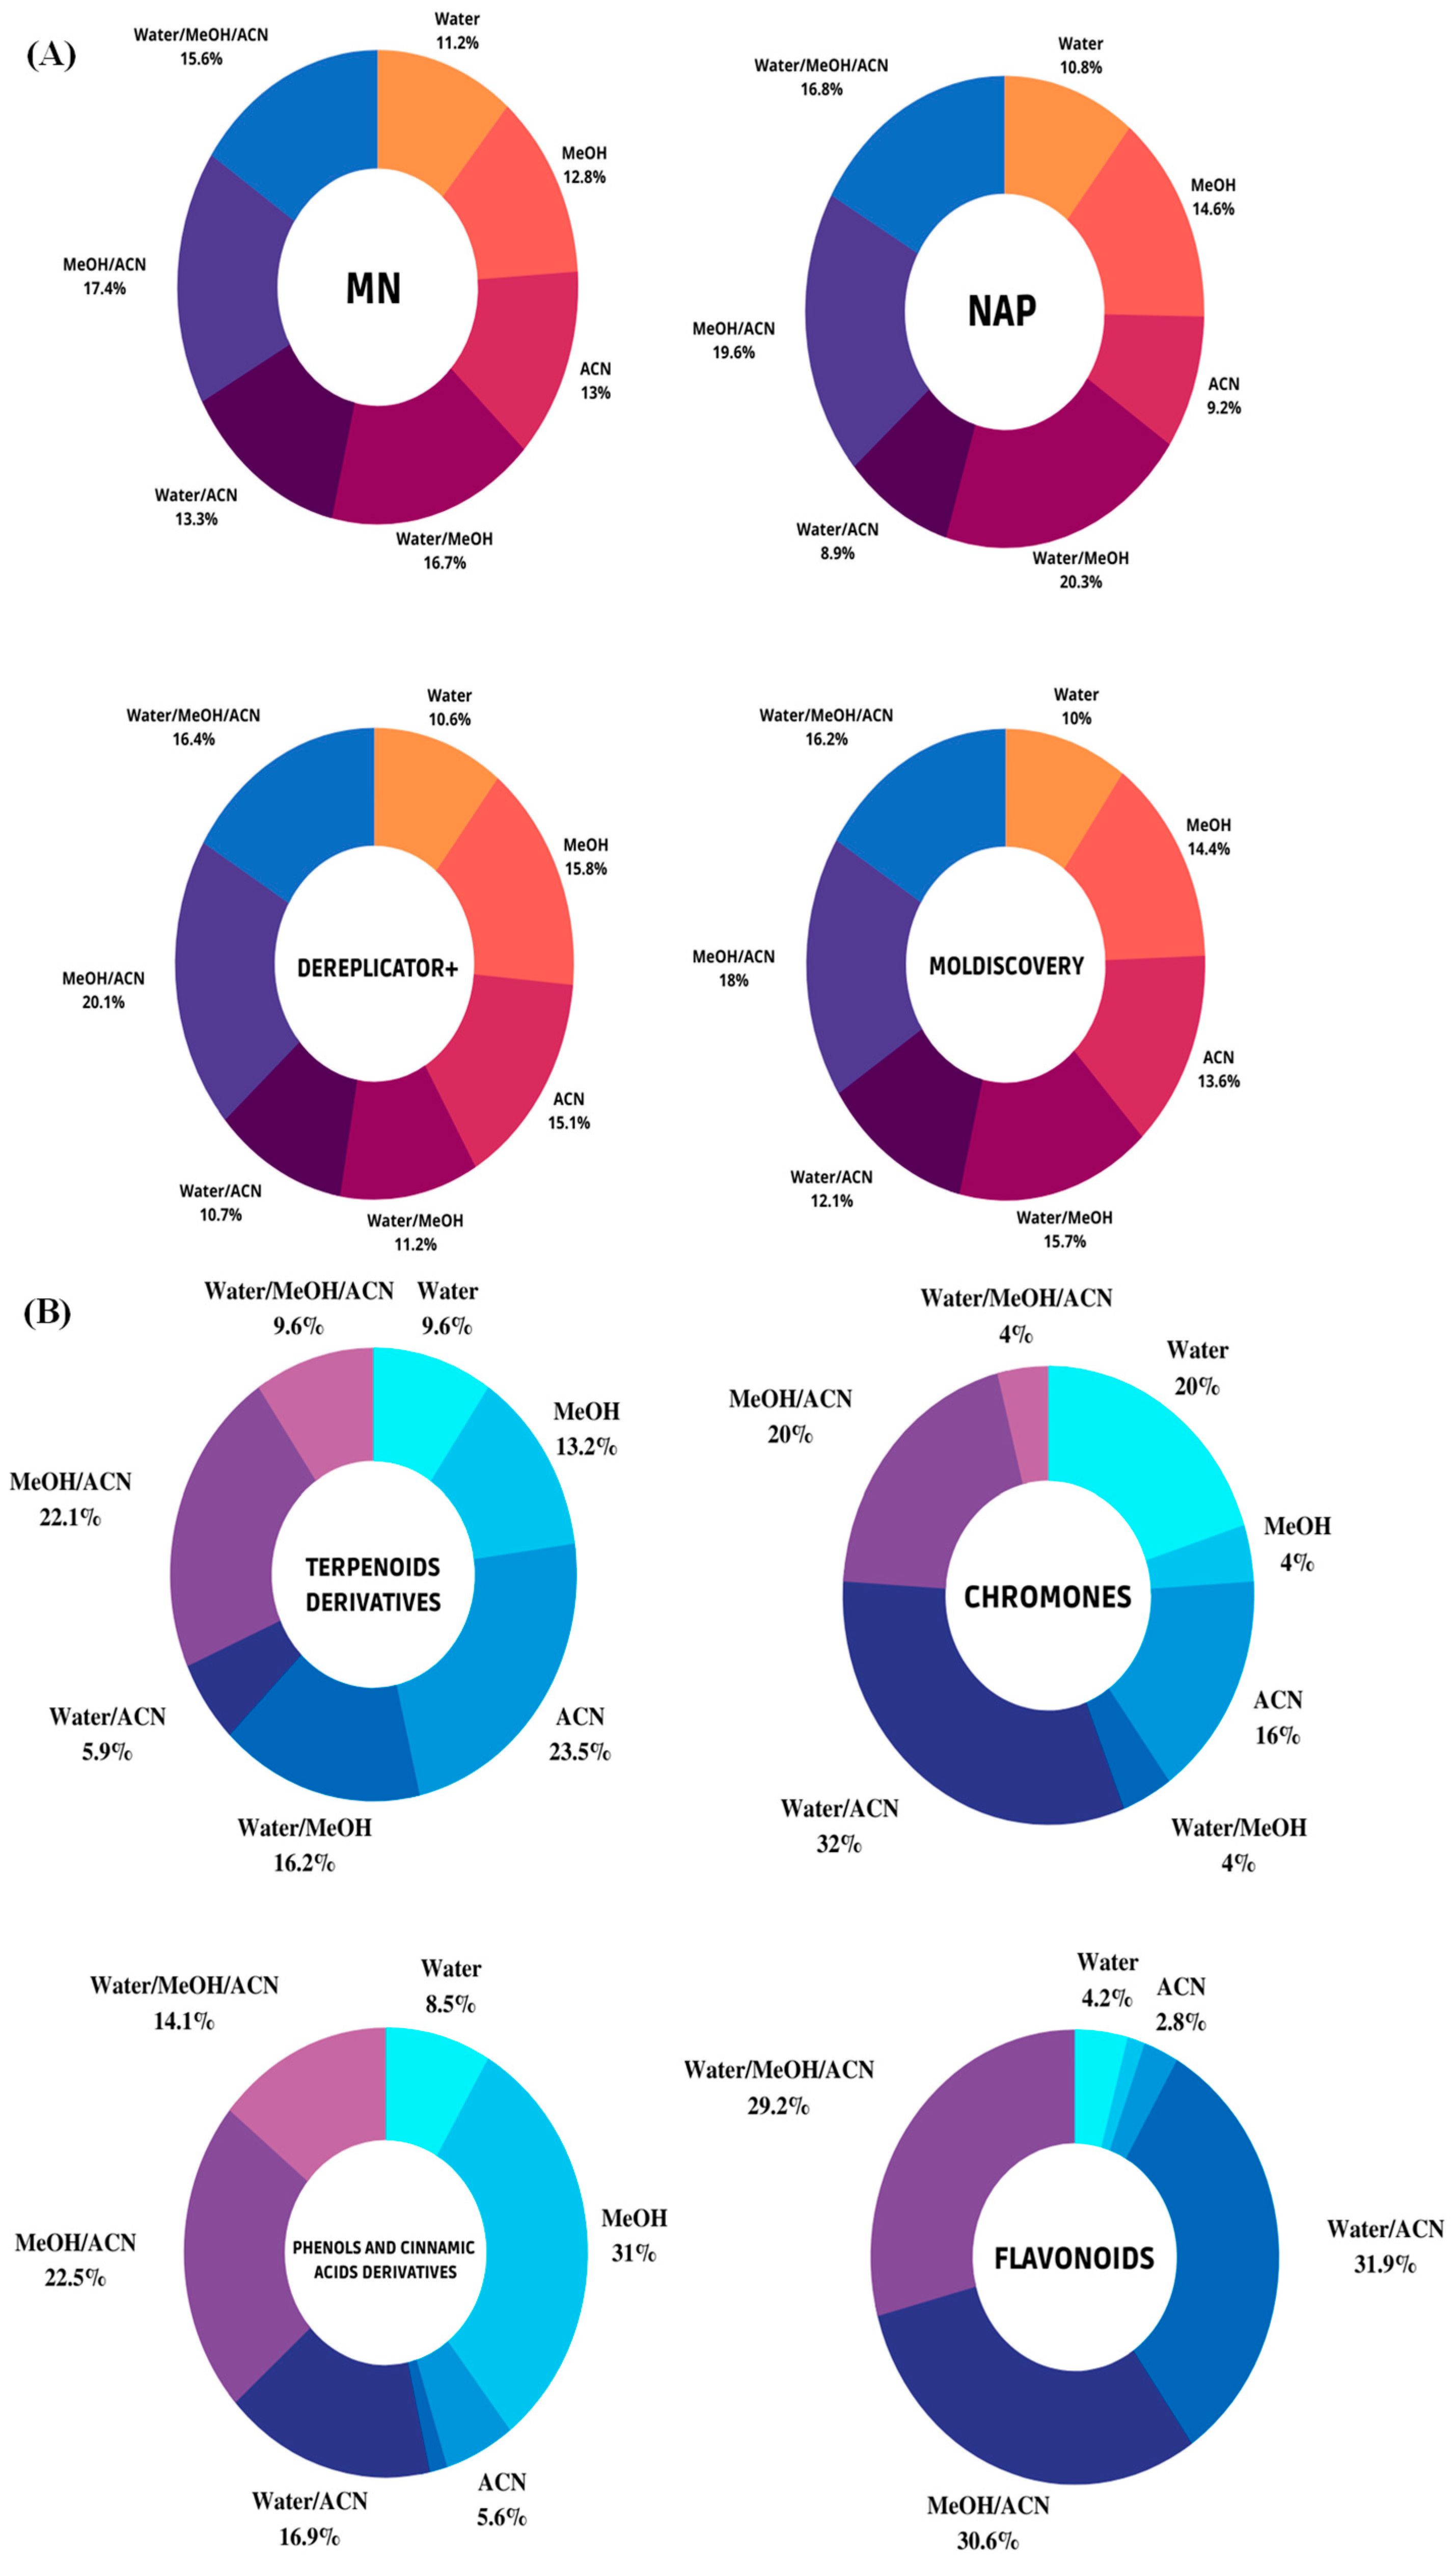
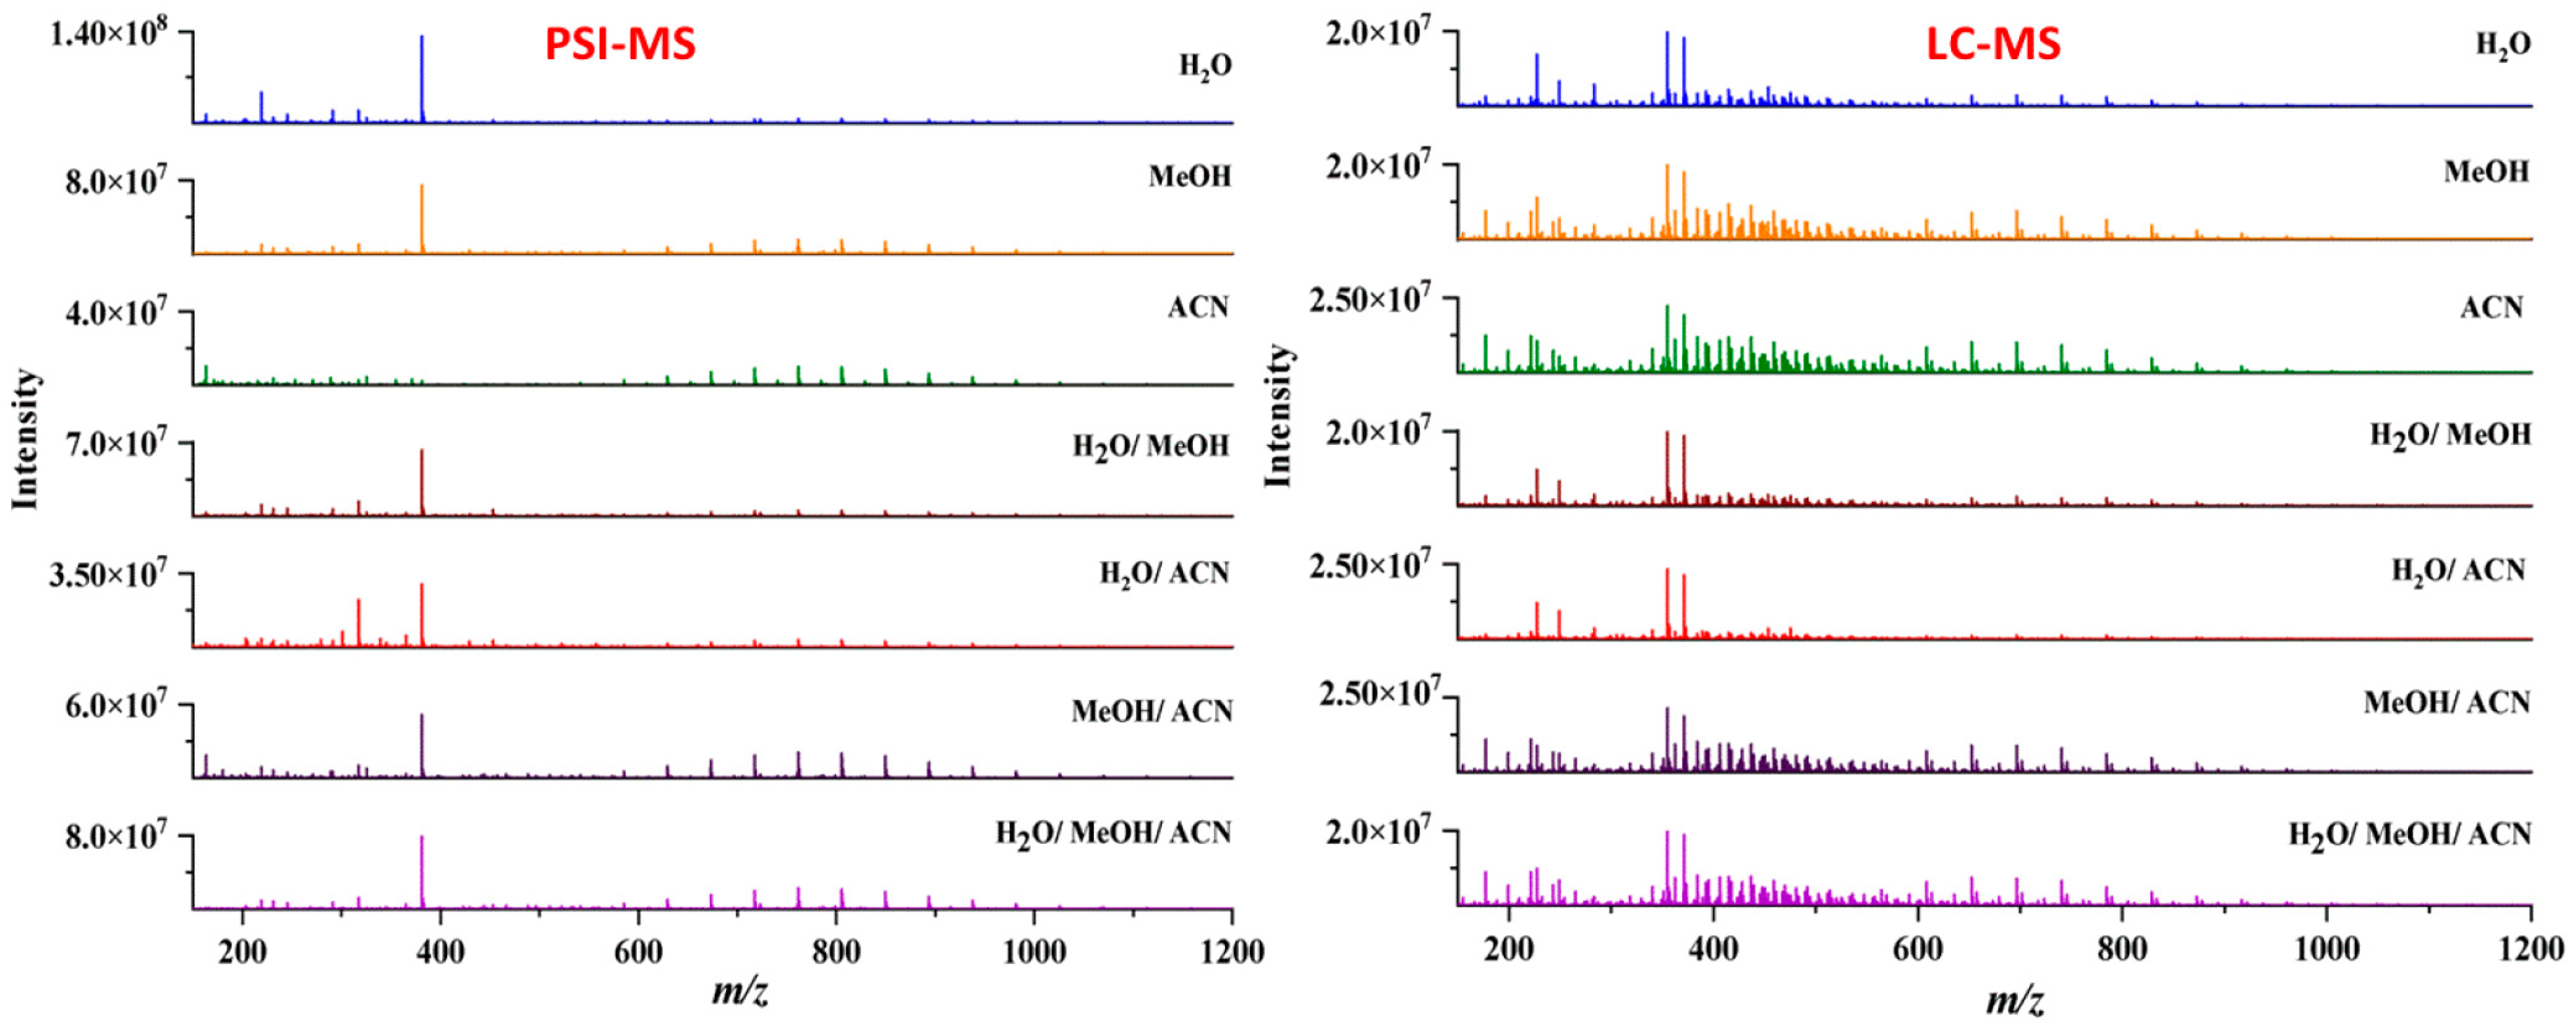
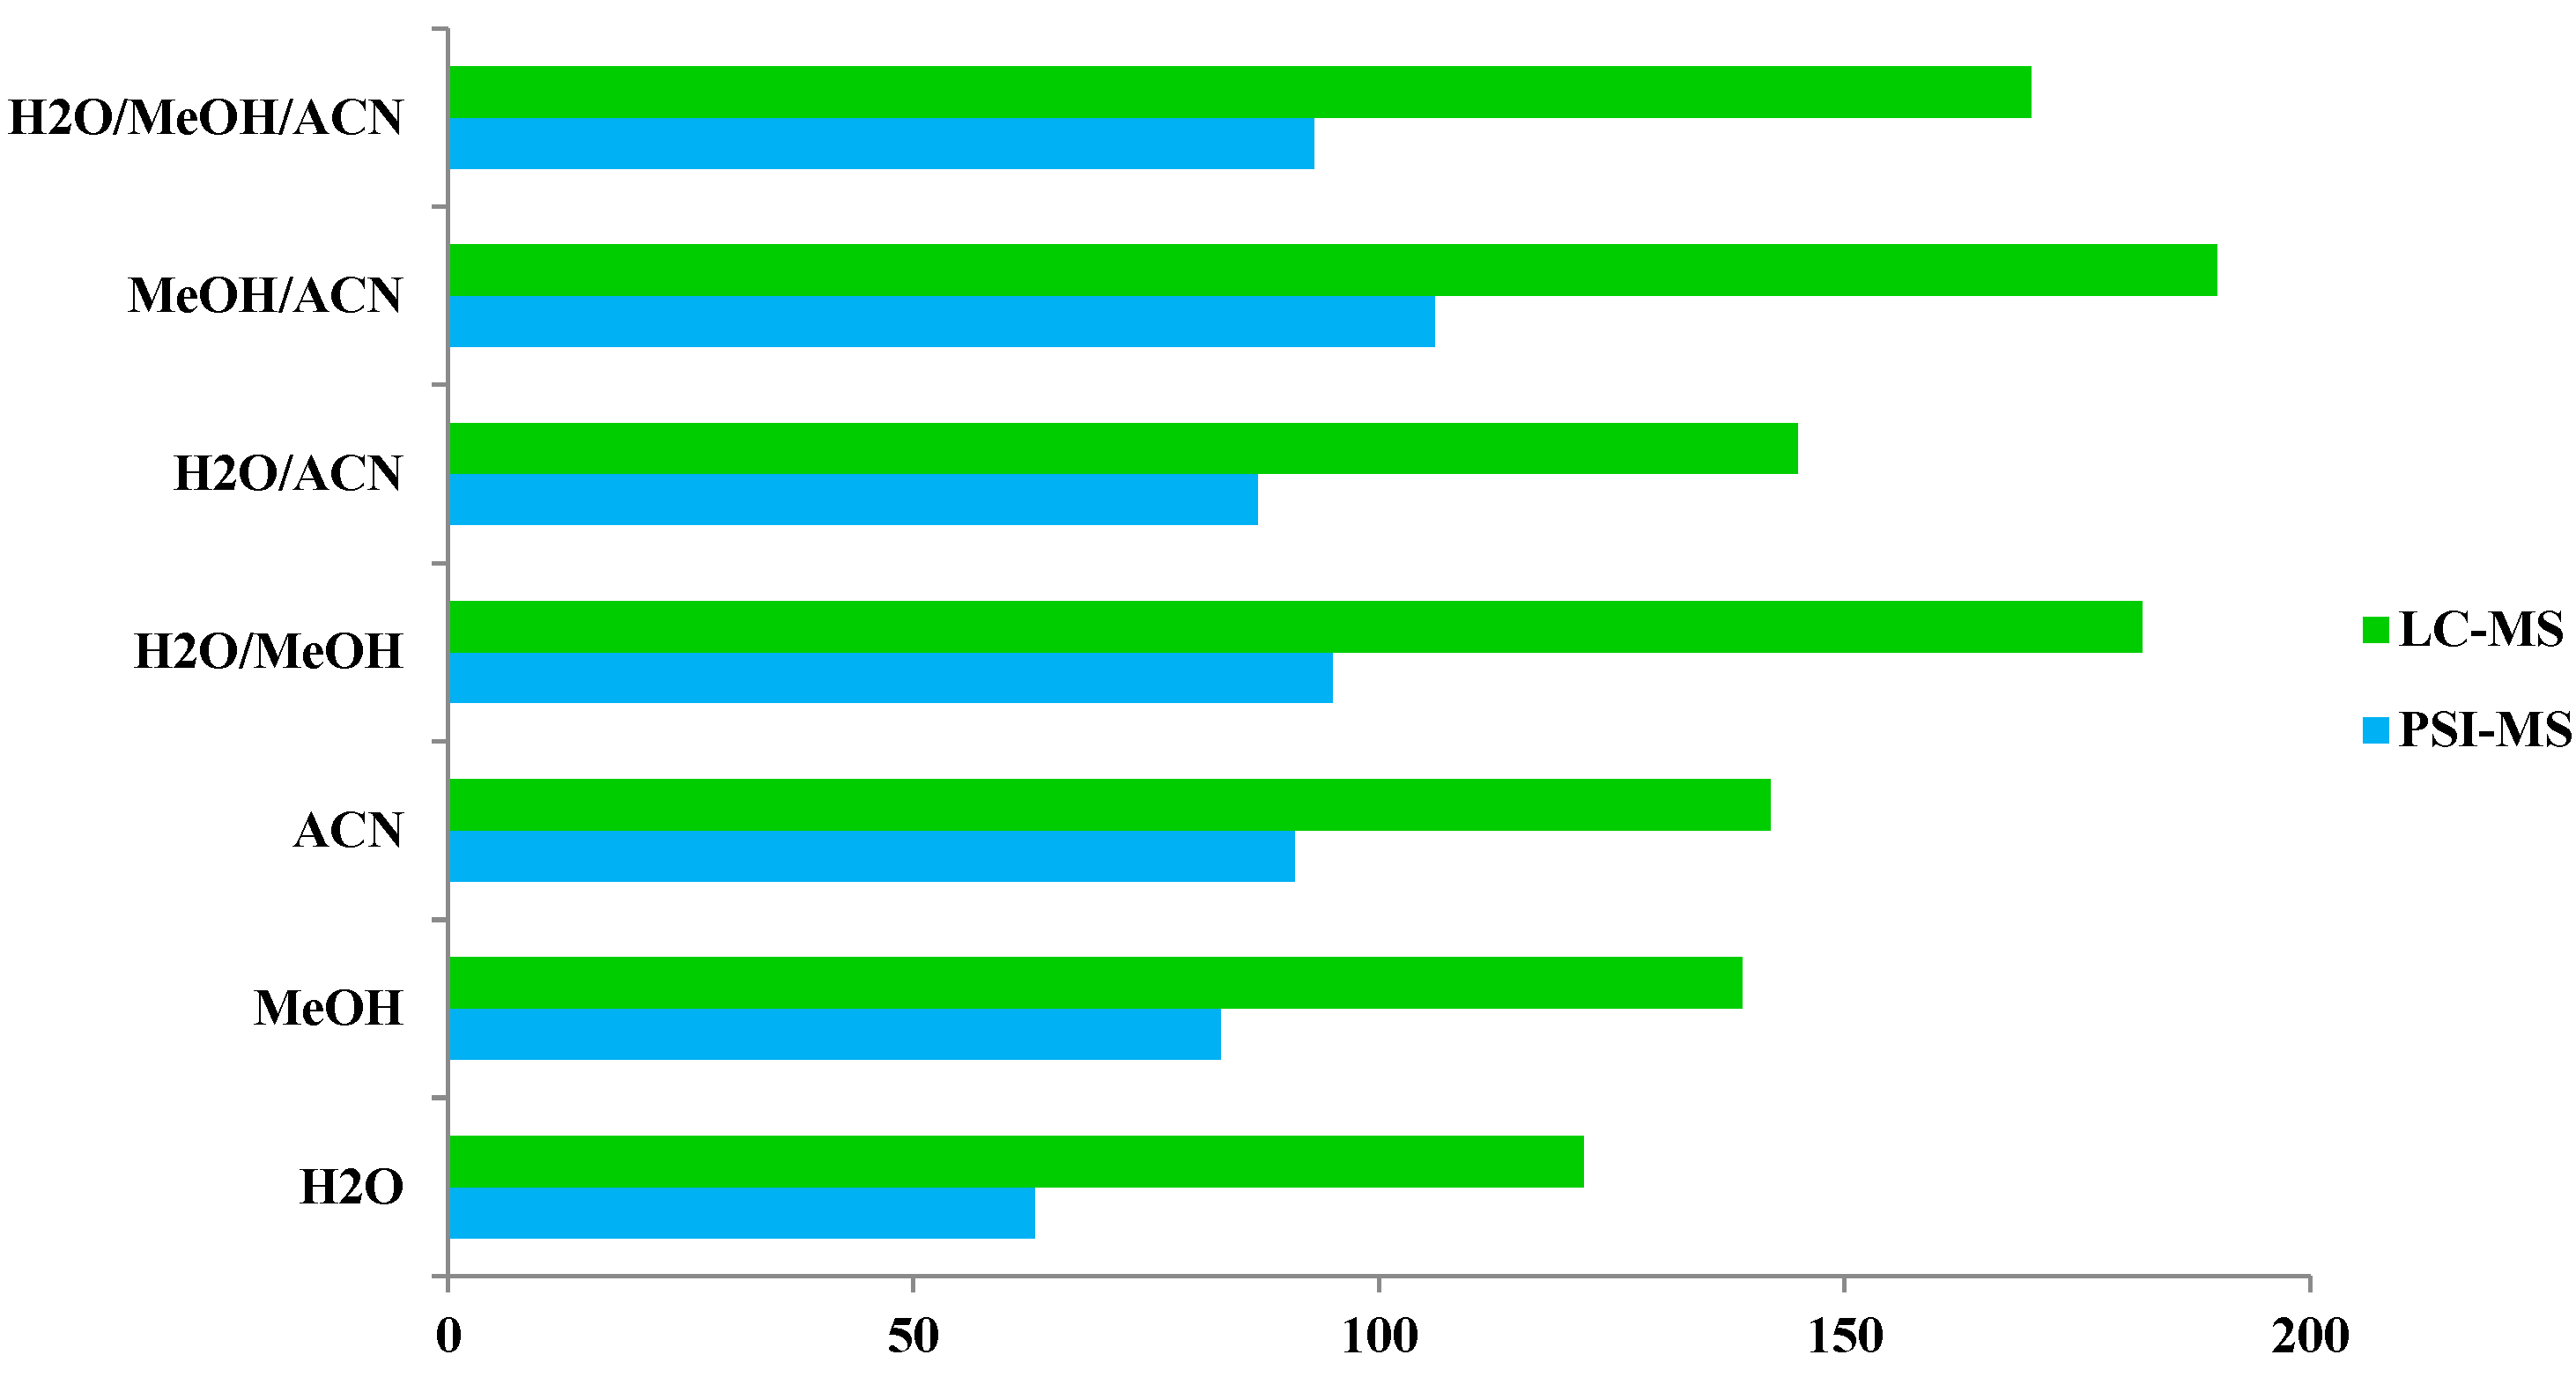
3.2. Assessing the Effectiveness of Metabolite Extraction from Cupuassu Pulp by PSI-HRMS/MS and LC-HRMS/MS

The efficiency of metabolite extraction from cupuassu pulp using solvents of different polarities and mixtures thereof was evaluated by both, PSI-HRMS/MS and LC-HRMS/MS. Extracts were prepared in duplicate using H2O, MeOH, ACN, H2O/MeOH (1:1, v/v), MeOH/ACN (1:1, v/v), ACN/H2O (1:1, v/v), and H2O/MeOH/ACN (1:1:1, v/v/v), respectively. The extraction potential of pure solvents and mixtures thereof can be evaluated according to their physicochemical properties, such as the dielectric constant, i.e., the capacity of a solvent to separate electrolytes into ions [48]. Given that interatomic and intermolecular attractions influence the dielectric constant, mixtures of polar protic solvents (water and methanol) and polar aprotic solvent (CH3CN) were used in binary and ternary solvent mixture systems. This parameter was evaluated using the most common mixture analysis method, which employs a weighted average of the mixture components [49]. In order to predict the appropriate composition for the extraction of bioactive metabolites and chemical markers from cupuassu pulp, H2O (dielectric constants of 80.00), MeOH (dielectric constants of 33.00), ACN (dielectric constants of 37.50), H2O/MeOH 1:1 (dielectric constants of 56.50), MeOH/ACN 1:1 (dielectric constants of 35.25), ACN/H2O 1:1 (dielectric constants of 58.75), and H2O/MeOH/ACN (dielectric constants of 50.17) [50] were evaluated according to the number of detected hits employing molecular networks, metabolic dereplication tools, and in silico fragmentation tools such as classical molecular networking (MN), network annotation propagation (NAP), Dereplicator+, and Moldiscovery (Figure 1A).
A large number of hits was detected by LC-HRMS/MS-based untargeted metabolomics. However, only the unique metabolites provided by each tool were evaluated. In addition, these tools allowed us to discriminate ions of interest in these datasets and to assess the abundance of compounds in the samples by analyzing the ion area, since all extracts were prepared and analyzed at the same concentration. This information helped predict which extraction system was most effective in extracting the chemical markers and biologically active substances of interest for this research. Qualitative evaluation of the chemical constituents of the sample through analysis of the number of unique metabolites obtained after inspection of the hits generated by the MN, NAP, Dereplicator+, and Moldiscovery tools showed that a greater number of metabolites was putatively annotated in the MeOH/ACN extracts (17.4%), H2O/MeOH (16.7%), and H2O/MeOH/ACN (15.6%) using molecular networking (MN), indicating a possibly better efficiency of extraction of known metabolites using solvent mixtures rather than pure solvent. Correspondingly, NAP, Dereplicator+, and Moldiscovery yielded a greater number of unique metabolites for extracts prepared with MeOH/ACN (19.6% for NAP, 20.1% for Dereplicator+, and 18% for Moldiscovery) and H2O/MeOH/ACN (16.8% for NAP, 16.4% for Dereplicator+, and 16.2% Moldiscovery) (Figure 1A). ACN proved to be a selective solvent in the extraction of medium-polarity compounds, even in combination with polar protic solvents such as water and methanol.
Combining the outputs from molecular networking (MN), network annotation propagation (NAP), and Dereplicator+ with MolNetEnhancer, it was possible to substantially increase the number and diversity of metabolite annotations. At the “class” and “subclass” level, flavonoids, terpenoid derivatives, chromones, and phenol and cinnamic acid derivatives dominated. More than 50% of the putatively annotated metabolites belong to the terpenoid derivative class. Due to its predominantly low-polar characteristic, pure ACN was the most selective solvent in the extraction of these metabolites (23.5%), followed by ACN/MeOH (22.1%), and MeOH/H2O (16.2%), with the latter proving particularly effective in extracting glycosylated terpenoids.
Regarding the chromone class, pure water (20%) and mixtures containing ACN, such as H2O/ACN (32%) and MeOH/ACN (20%), proved the most effective extractor systems, while methanol was inefficient in the extraction of this class. Phenols and cinnamic acid derivatives are widely occurring metabolites in plants, which were predominantly extracted using methanol (31%) and MeOH/ACN (22.5%), as they are low-molecular-weight polar molecules. On the other hand, MeOH/ACN (30.6%), H2O/ACN (31.9%), and H2O/MeOH/ACN (29.2%) were more selective than pure solvents in the extraction of flavonoid compounds (Figure 1B).
Comparison of PSI-HRMS/MS and LC-HRMS/MS in metabolic profiling of cupuassu pulp extracts showed, that LC-HRMS/MS detected more secondary metabolites than PSI-HRMS/MS, reflecting the different physicochemical properties of paper and a C18 stationary phase. A complexity of low-molecular-weight metabolites was detected byLC-HRMS/MS, while PSI-HRMS/MS showed better efficiency in the analysis of terpenoid derivatives, which is the class of compounds mostly found in the samples. In addition, a smaller number of ions was detected by the PSI-HRMS/MS technique regardless of the extractor system used (Figure 2).
Examination of phytochemical content showed that PSI-MS yielded the largest number of metabolites in MeOH/ACN extracts of cupuassu pulp extracts, while the extractor systems MeOH/H2O and MeOH/ACN gave the best results for RPLC-MS (Figure 3 and Figure 4). The paucity of metabolites found in the aqueous extract indicates a low content of highly polar compounds such as sugars and heterosides or failure of their detection by the techniques used. The PSI-MS technique detected fewer phenolic compounds than LC-HRMS/MS irrespectively of the extraction solvent used. (Overall, PSI-MS detected between 60 and 100 compound in the various extracts (Figure 4). LC-MS, in comparison, yielded between 125 and close to 200 metabolites, with water and acetonitrile/methanol being the least and most effective extraction solvent, respectively.
After chemical characterization of cupuassu pulp extracts, 22 oleanane triterpenoids derivatives were detected, whose mass difference of 44 Da indicates a variation of C2H4O in the terpene structure, which is highlighted in the molecular network presented in Figure 5. It was observed that the oleanane triterpenoid derivatives are the major constituents found in these samples. When investigating the influence of PSI-MS and LC-MS techniques on the extraction of oleanane triterpenoids, a greater abundance of this group of metabolites was observed in the PSI-MS spectrum (Figure 5). Considering that the choice of extraction solvents also influences the extraction yield of these compounds, the abundance of the major oleanane triterpenoids derivatives, i.e., the asiatic acid compound of m/z 805.50 [M+Na]+, was evaluated. Based on the physicochemical properties of Asiatic acid, it can be concluded that it is a polar compound due to the presence of hydroxyls and two sugar molecules. Thus, when evaluating the effect of the polarity of the solvent mixture components in the extraction of Asiatic acid, it was observed that the H2O/MeOH and H2O/ACN extractor systems were unable to completely extract this compound using either of the applied techniques. Based on the area of this compound, the H2O/MeOH/ACN system showed greater efficiency in the extraction of Asiatic acid using the PSI-MS technique, while a greater abundance of this metabolite was detected using the LC-MS technique with H2O/MeOH/ACN and MeOH/ACN systems (Figure 5).
PSI-MS and LC-MS showed high sensitivity in the detection of the chemical markers of T. grandiflorum, the maximum signal intensity of which reached values of 2E8 and 3E7 for PSI-MS and LC-MS for MS1 analysis, respectively.
Among the tested techniques, PSI-MS proved to be the technique of choice for analysis of this group of compounds, with wide potential for quantification and/or qualitative screening. As a consequence of the structural similarity of the metabolite oleanane triterpenoid derivatives, the influence of the analysis parameters and the properties of the PSI-MS and LC-MS techniques were investigated using abundant metabolites found in samples that have different physicochemical properties such as molecular weight and polarity, including catechin, citric acid, and galaxolidone compounds. The graph presented in Figure 5 was constructed based on the area of ions associated with catechin, citric acid, and galaxolidone compounds, representing the relative abundance of the major compounds annotated from cupuassu pulp extracts samples using mixtures of acetonitrile/methanol/water obtained in LC-HRMS/MS and PSI-HRMS/MS analyses (Figure 6).
The catechin compound was found in high abundance in all extracts and was detected by both techniques. The LC-MS technique was efficient in detecting catechin in all extractor systems used, with the highest abundance found in pure ACN and mixtures with acetonitrile, H2O/ACN, and MeOH/ACN. Applying the PSI-MS technique, a greater abundance of catechin was detected in the extracts with H2O, H2O/ACN, and H2O/MeOH, showing that using paper as a substrate influences the extraction and ionization of polar compounds. Previous reports showed that in altering the solvent–substrate systems, variation is observed in the number of detected ions caused by the change in the extraction and ionization efficiency of the analytes deposited on the paper [51]. Our findings show that catechin was easily extracted using polar solvent mixtures, since flavan-3-ols are easily extracted with polar organic solvents and aqueous mixtures [52].
Regarding citric acid and galaxolidone, low detection of these metabolites was observed using the PSI-MS technique. Citric acid was abundantly extracted in all extractor systems and was easily detected by LC-MS. However, PSI-MS was not effective in detecting this metabolite, possibly because its low molecular weight and its highly polar characteristic are factors that can influence the PSI analysis since a chromatographic separation on paper is possible due to the different interactions that occur between the substrate and the analyte. Such effects have been reported before [53]. This on-paper separation may be responsible for the reduction in sensitivity of the analysis of highly polar analytes such as citric acid, as the paper substrate can retain analytes with hydrophilic properties, resulting in low separation [54]. The methanol used for paper spraying also influences analyte extraction, transportation, and spray ionization, as the solvent transports the analytes to the spray tip, extracts the matrix components, and transfers the analytes to the MS system [55]. Concerning the compound galaxolidone, the methanol-extracting solvent was more efficient in extracting this metabolite using the LC-MS technique. However, evaluation of galaxolidone using the PSI-MS technique shows that many factors may have influenced the detection of the low abundance of this analyte using the chromatographic technique. Many factors such as the solubility of the compound in the acidified solvent that transports the metabolite to the spray tip, suppression of ionization by other matrix components, the volatilization capacity of the compound using the ambient ionization method, and the porosity of the paper substrate may have affected the analysis of galaxolidone using PSI-MS. Although the PSI technique was not as efficient as LC-MS in the detection of citric acid and galaxolidone, it was successfully employed in the detection of other biologically active metabolites such as catechin and other flavonoids. In addition, PSI offers many advantages over other chromatographic techniques such as reduced analysis time and solvent consumption.

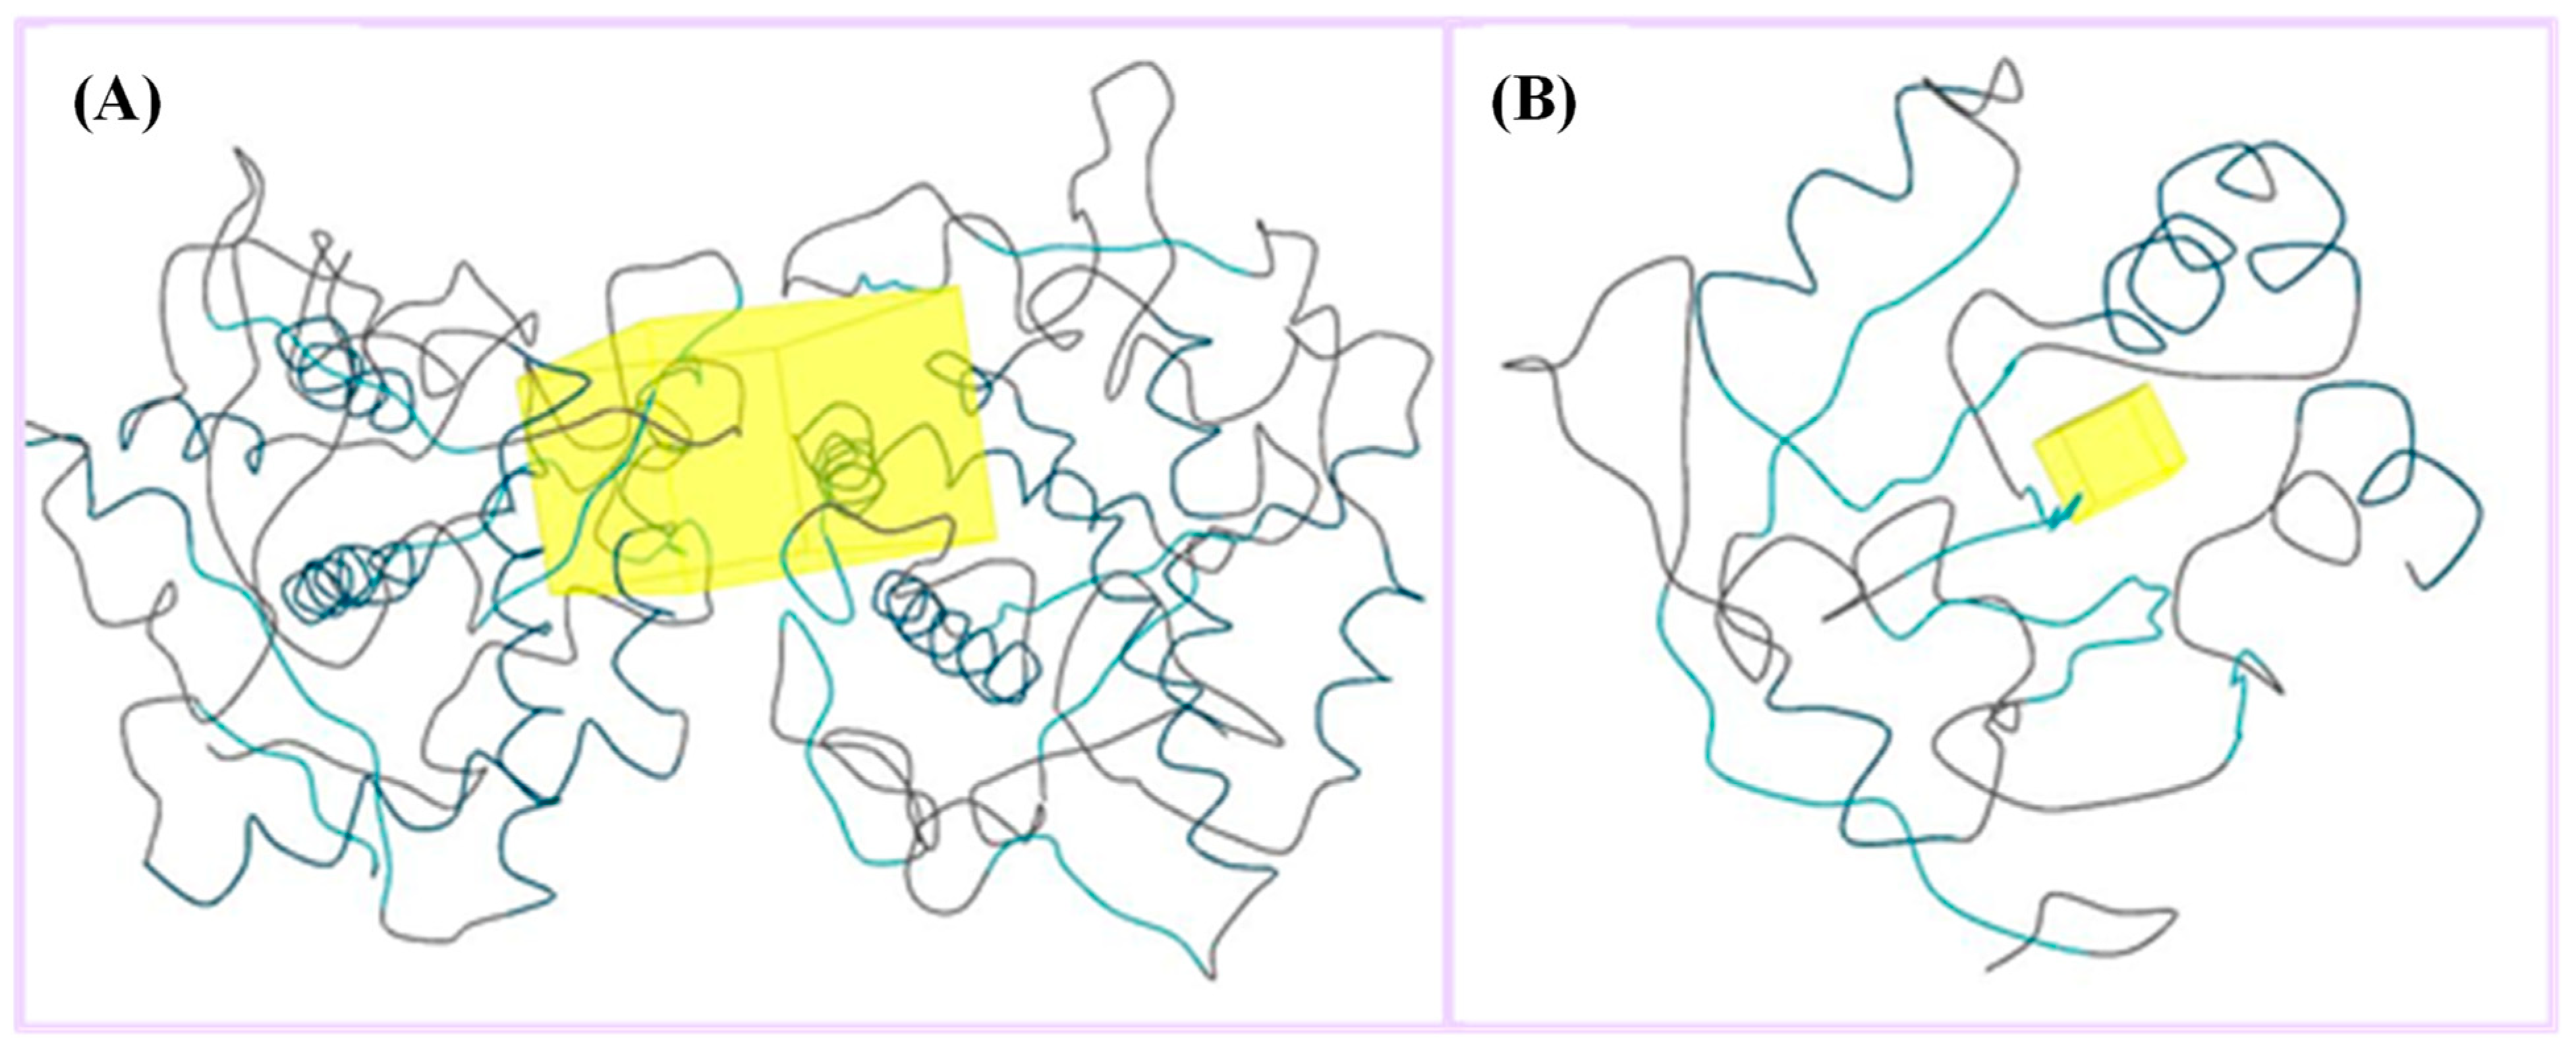
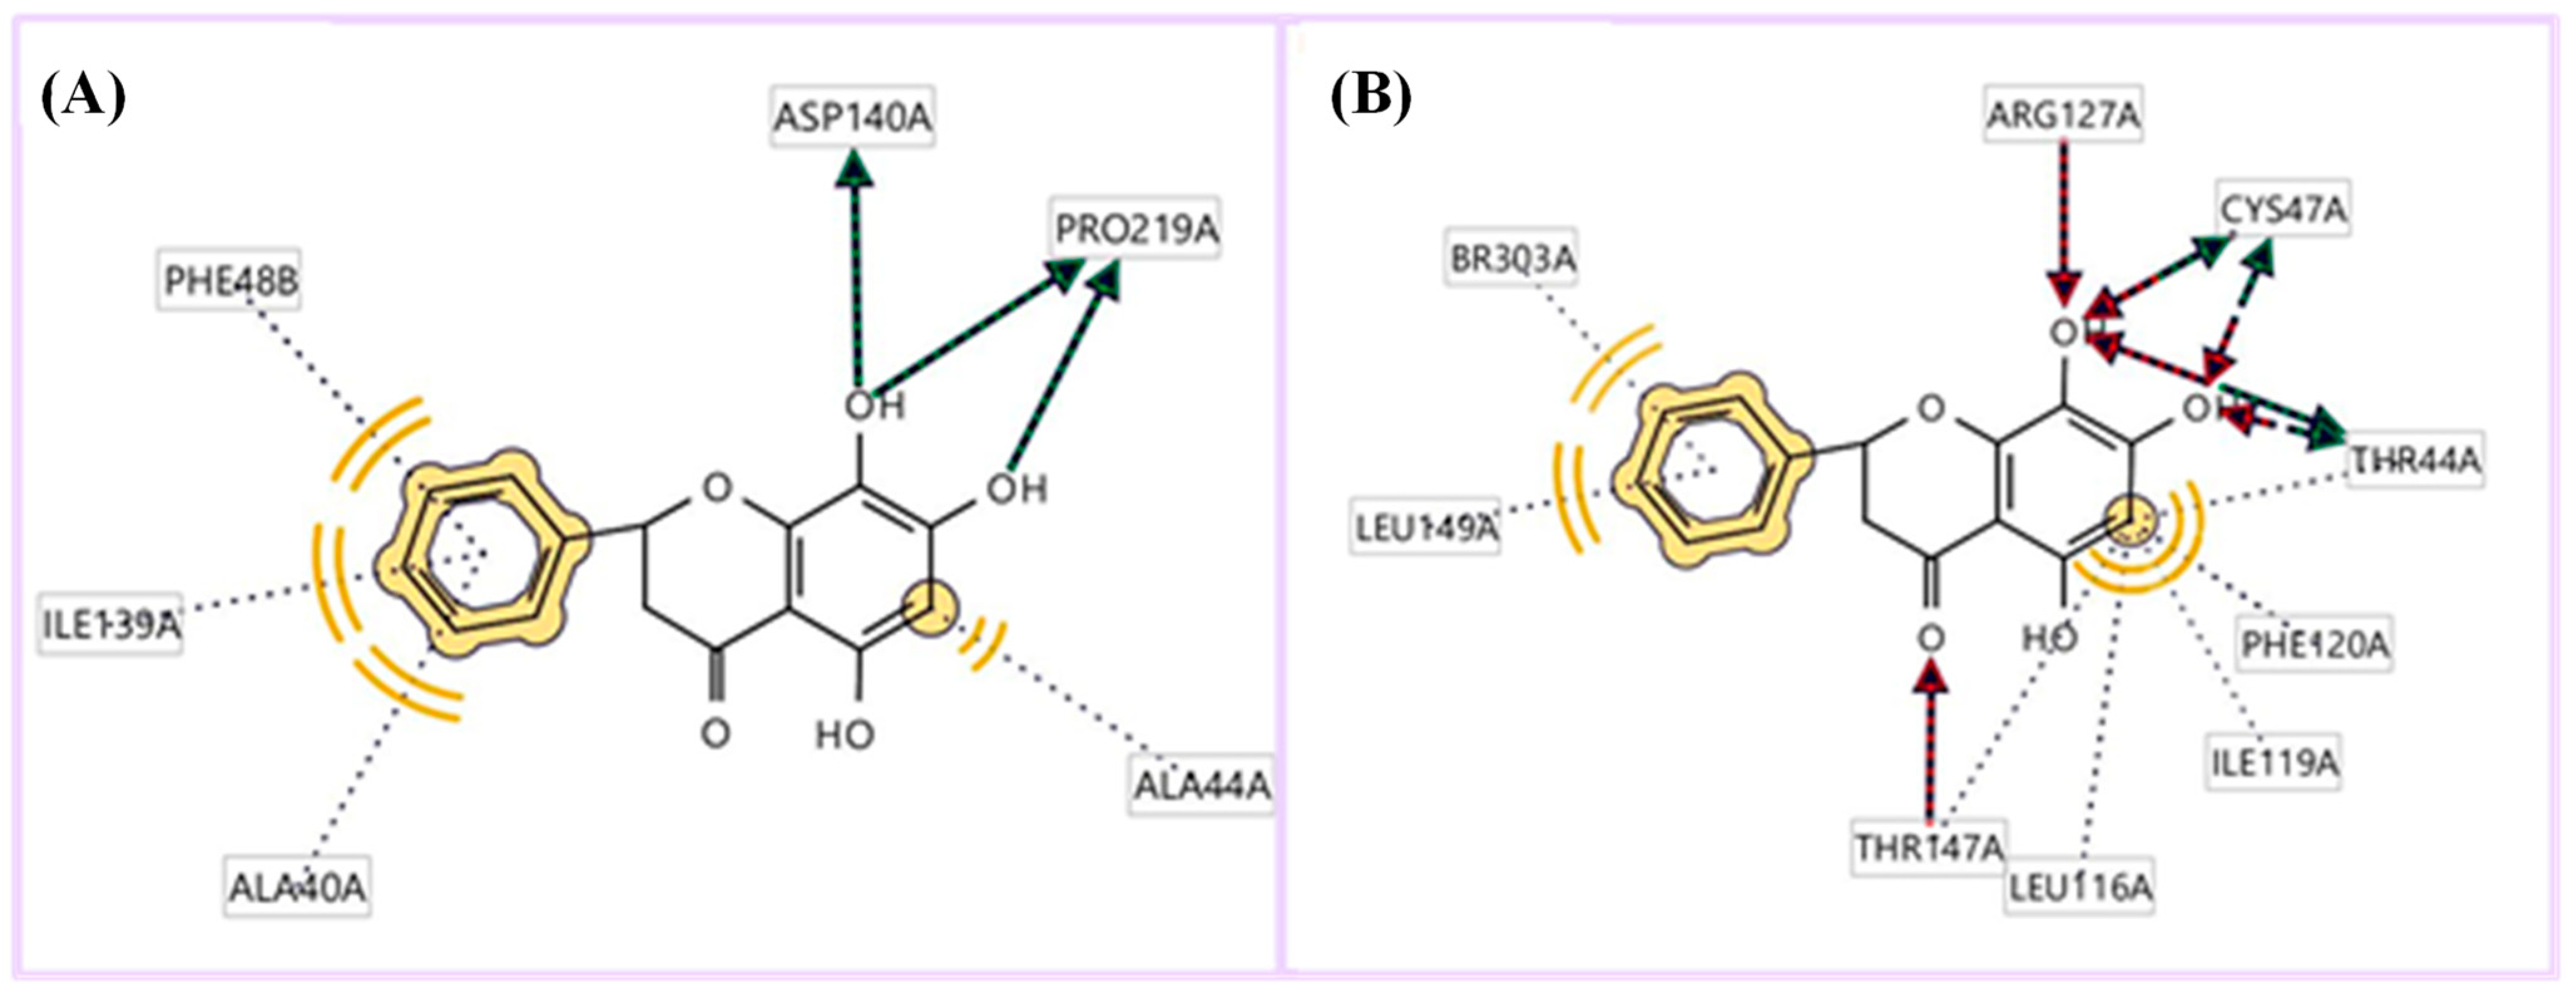
3.3. Determination of Antioxidant Properties Using Molecular Docking

The established antioxidant activities of the major metabolites were explored, and catechin, epigallocatechin-3′-glucuronide, citric acid, 5,7,8-trihydroxyflavanone, and asiatic acid were identified as the main bioactive components; we then undertook a molecular docking study. Two enzymes were used in this docking study: tyrosinase and PRDX5. Tyrosinase is considered the main active enzyme in the biosynthesis of the pigment melanin [32]. Since tyrosinase is known as the limiting-step enzyme in the process of melanogenesis, its connected inhibitors have become very important, considered depigmenting agents in disorders related to hyperpigmentation. Currently available tyrosinase inhibitors are toxic in nature and/or less efficient, and there is a constant requirement for better inhibitors from nature, as they may cause no or less harmful side effects. PRDX5 has antioxidative and cytoprotective functions during oxidative stress. In order to determine the differences in binding, as well as the interactions between the compound structures and the two proteins, rigid receptor docking (RRD) experiments were performed [33].
All docking poses were compared and analyzed relative to quercetin that served as a standard antioxidant. First, a docking experiment was performed on the crystal structure of tyrosinase taken from the protein data bank of Bacillus megaterium with identification PDB: 3NM8 [32]. Tyrosinase is the most widely distributed enzyme, with copper as its main constituent, belonging to the class of the type 3 copper enzyme family, and is involved in the formation of melanin pigment in a number of organisms. The second docking experiment was carried out on human peroxiredoxin 5 (PDB code 1HD2), which belongs to the widely expressed six-member peroxiredoxin family of antioxidant enzymes [29]. Peroxiredoxins reduce hydrogen peroxide and alkyl hydroperoxides by reducing equivalents from thiol-containing donor molecules, for example, trypanothione, thioredoxin, glutathione, and AhpF, and they are found in both prokaryotes and eukaryotes.
The five major metabolites were subjected to docking experiments, and their interactions with tyrosinase and PRDX5 were investigated in detail, as shown in Figure 7. Based on binding energies and residues interacting with the structures, the best-docked complexes were selected for analysis. Compared to quercetin, only 5,7,8-trihydroxyflavanone yielded a better docking score for tyrosinase. In the case of PRDX5, the docking score of 5,7,8-trihydroxyflavanone (−7.0 kcal/mol) was only surpassed by that of epigallocatechin-3′-glucuronide (−7.7 kcal/mol). Together with asiatic acid (−6.8 kcal/mol), the docking scores of these three compounds were better than that of the standard quercetin (-6.3 kcal/mol) (Table 2). Based on these results, further analyses were conducted with 5,7,8-trihydroxyflavanone.
LIGPLOTs for 5,7,8-trihydroxyflavanone are shown in Figure 8A,B. 5,7,8-trihydroxyflavanone interacts with tyrosinase, forming H interactions involving residues Ala44A, Ala40A, Ile139A, and Phe48B. Tyrosinase residues Asp140A and Pro219A were involved in hydrogen bonding, whereas with Human Peroxiredoxin 5, the 5,7,8-trihydroxyflavanone interacts to form H interactions with Thr44A, Phe120A, Ile119A, Leu116A, Leu149A, and Br303A. Human peroxiredoxin 5 residues Cys47A, Arg127A, and Thr44A were involved in hydrophobic interactions, whereas Cys47A and Thr44A were involved in hydrogen bonding.

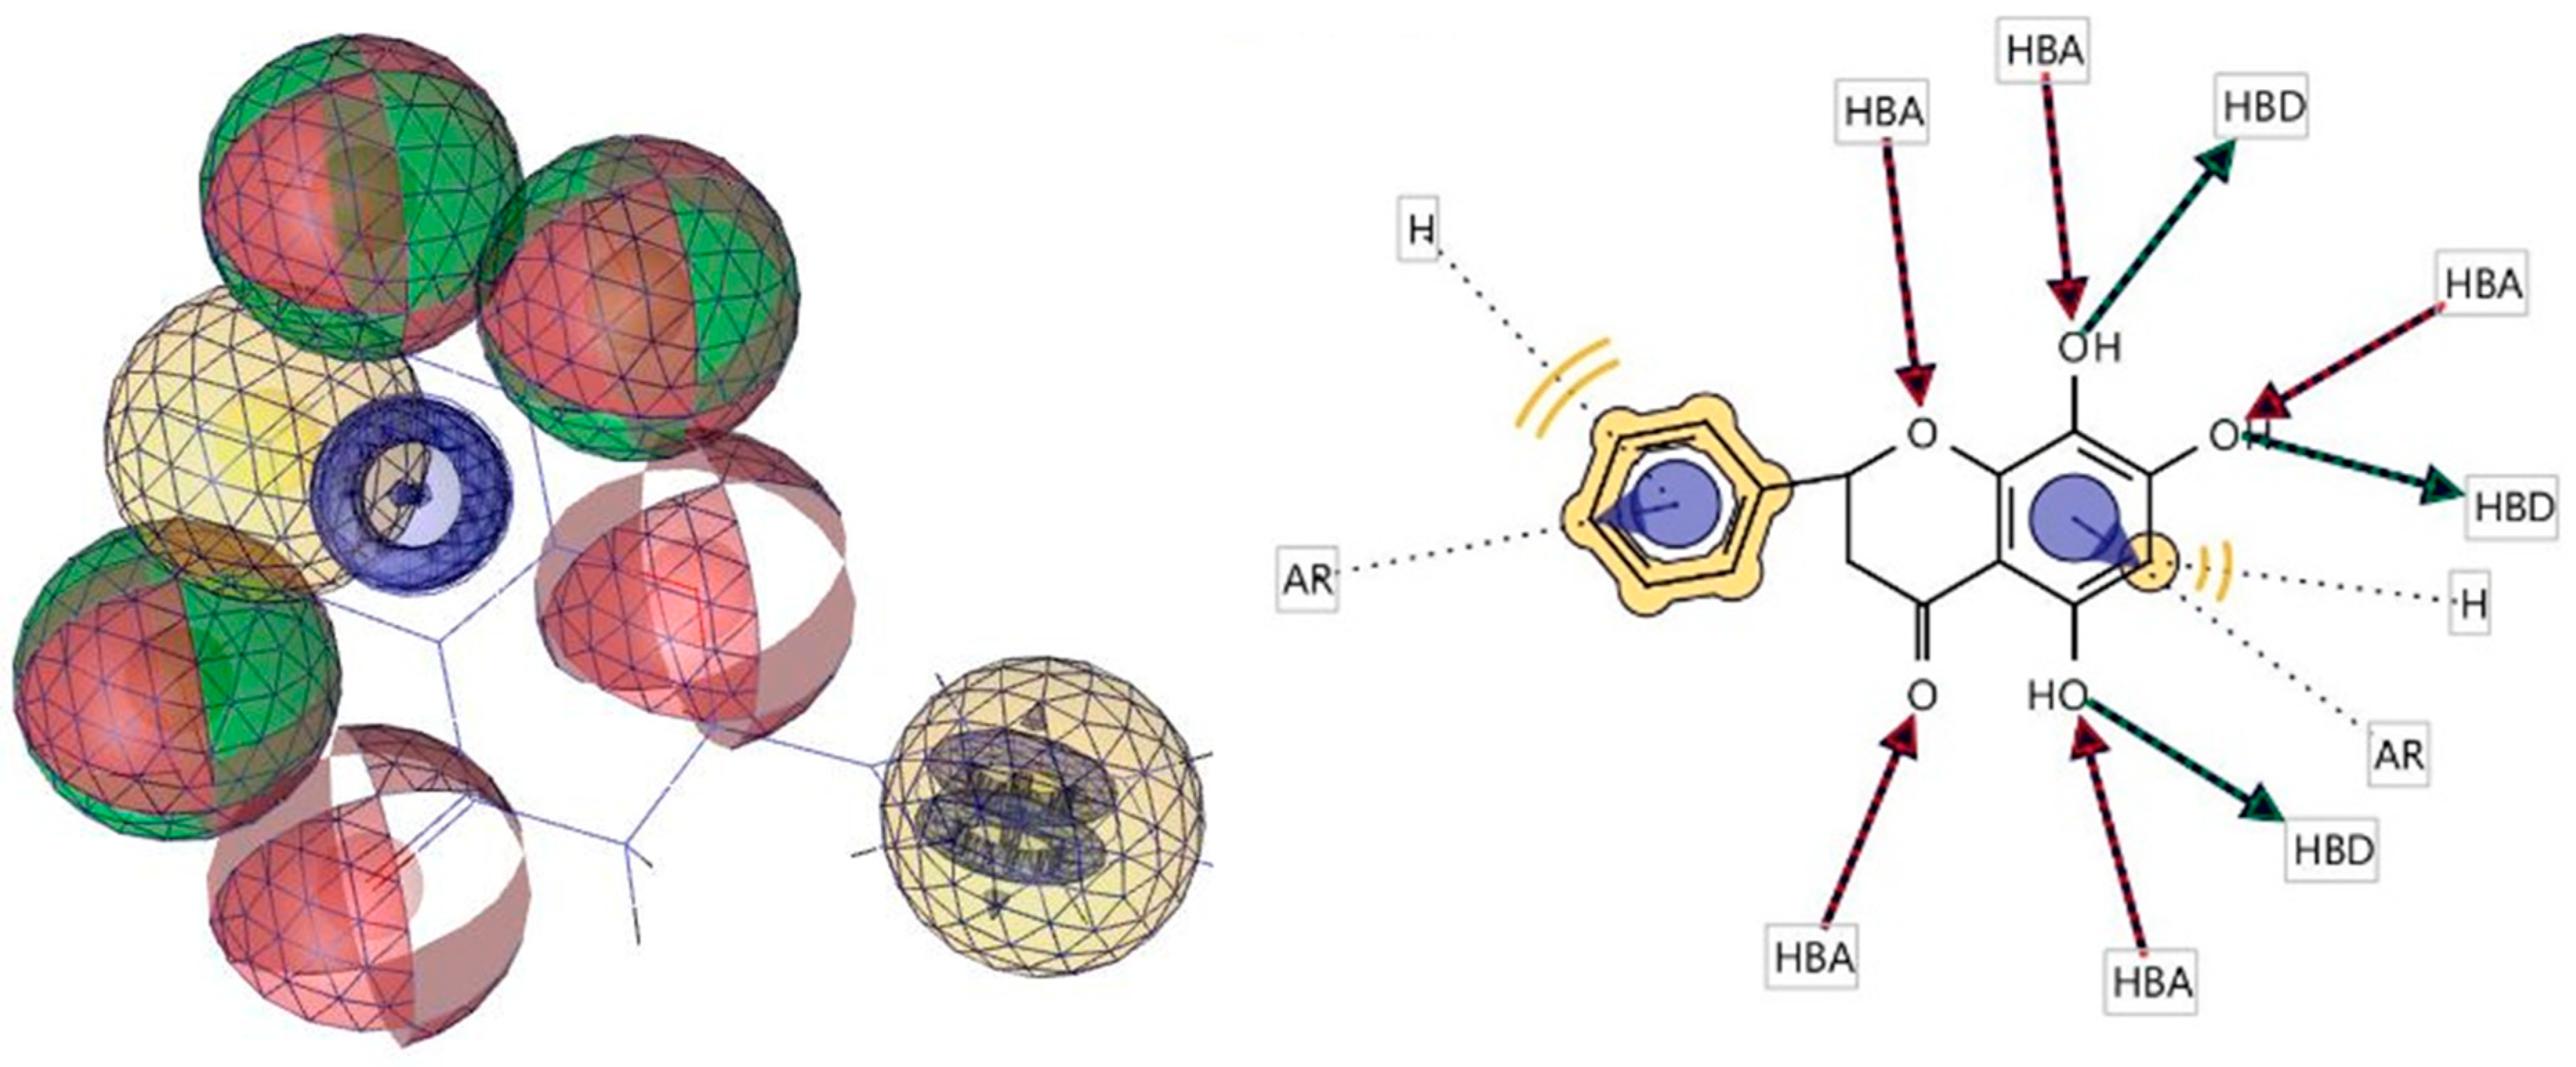
3.4. Pharmacophore Evaluation

Using the lowest-energy conformers of 5,7,8-trihydroxyflavanone, a pharmacophore model was generated by performing a pharmacophore evaluation experiment [31]. The generated model of the pharmacophore has four key features, which are described as hydrogen bond acceptors (HBAs), hydrogen bond donors (HBDs), hydrophobic interactions (H), and aromatic interactions (Ar). Representations of 3D and 2D pharmacophoric features of every compound structure are shown in Figure 9.

4. Conclusions

Among the different solvent systems tested for the extraction of metabolites from cupuassu (T. grandiflorum) pulp, a 50:50 mixture of methanol and acetonitrile yielded the largest number of metabolites extracted, with LC-MS detecting close to 200 metabolites, whereas PSI-MS detected only a little bit more than 100 compounds. The performance of PSI-MS was found to be influenced by the hydrophilic properties of the analytes, their solubility in acidified methanol, which was used as spray solvent, and their interactions with the paper substrate. Molecular docking analysis of the five major metabolites showed 5,7,8-trihydroxyflavanone to bind particularly well to both, tyrosinase and peroxiredoxin 5, the former catalyzing the oxidation of L-tyrosine to dopaquinone, a precursor of melanin, while the latter is an important cytoprotective enzyme that that inhibits endogenous and exogenous peroxide accumulation. A pharmacophore model of 5,7,8-trihydroxyflavanone revealed a number of molecular features for its recognition by receptors that may guide future studies on the selection and design of new antioxidant structures.

Author Contributions

Conceptualization: G.F.d.S., N.M.L. and G.S.L., methodology: N.M.L., G.S.L., G.F.d.S., G.P. and L.I.L.M.; writing—original draft preparation: N.M.L., G.P. and T.d.J.A.S.A.; writing—review and editing: G.S.L., M.J., A.R.C. and B.G.V.; supervision: M.J., A.R.C. and B.G.V.; funding acquisition: B.G.V. All authors have read and agreed to the published version of the manuscript.

Funding

This research received no external funding.

Institutional Review Board Statement

Not applicable.

Informed Consent Statement

Not applicable.

Data Availability Statement

All support data used in this study are available from the authors. Data is not publicly available due to privacy.

Acknowledgments

The authors acknowledge the institutional and financial support from the Brazilian Federal Agency for Support and Evaluation of Graduate Education (CAPES) and the Brazilian Research Council (CNPq).

Conflicts of Interest

The authors declare no conflict of interest.

References

  1. Febrianto, N.A.; Zhu, F. Comparison of Bioactive Components and Flavor Volatiles of Diverse Cocoa Genotypes of Theobroma grandiflorum, Theobroma bicolor, Theobroma subincanum and Theobroma cacao. Food Res. Int. 2022, 161, 111764. [Google Scholar] [CrossRef] [PubMed]
  2. Jean-marie, E.; Jiang, W.; Bereau, D.; Robinson, J.-C. Theobroma cacao and Theobroma grandiflorum: Botany, Composition and Pharmacological Activities of Pods and Seeds. Foods 2022, 11, 3966. [Google Scholar] [CrossRef]
  3. Lim, T.K. Theobroma grandiflorum . In Edible Medicinal and Non Medicinal Plants; Springer: Dordrecht, The Netherlands, 2012; pp. 252–258. [Google Scholar]
  4. Vriesmann, L.C.; Silveira, J.L.M.; Petkowicz, C.L.D.O. Rheological Behavior of a Pectic Fraction from the Pulp of Cupuassu (Theobroma grandiflorum). Carbohydr. Polym. 2010, 79, 312–317. [Google Scholar] [CrossRef]
  5. Cucaita, N.A.; Hernández, M.S.; Gutiérrez, R.H. Comparison between Chocolate and an Analog Product Made from Copoazú (Theobroma grandiflorum). Acta Hortic. 2014, 1047, 231–236. [Google Scholar] [CrossRef]
  6. Barros, H.R.d.M.; García-Villalba, R.; Tomás-Barberán, F.A.; Genovese, M.I. Evaluation of the Distribution and Metabolism of Polyphenols Derived from Cupuassu (Theobroma grandiflorum) in Mice Gastrointestinal Tract by UPLC-ESI-QTOF. J. Funct. Foods 2016, 22, 477–489. [Google Scholar] [CrossRef]
  7. Pugliese, A.G.; Tomas-barberan, F.A.; Truchado, P.; Genovese, M.I. Flavonoids, Proanthocyanidins, Vitamin C, and Antioxidant Activity of Theobroma grandiflorum (Cupuassu) Pulp and Seeds. J. Agric. Food Chem. 2013, 61, 2720–2728. [Google Scholar] [CrossRef] [PubMed]
  8. Ióca, L.P.; Romminger, S.; Santos, M.F.C.; Bandeira, K.F.; Rodrigues, F.T.; Kossuga, M.H.; Nicacio, K.J.; Ferreira, E.L.F.; Morais-Urano, R.P.; Passos, M.S.; et al. A Strategy for the Rapid Identification of Fungal Metabolites and the Discovery of the Antiviral Activity of Pyrenocine a and Harzianopyridone. Quim. Nova 2016, 39, 720–731. [Google Scholar] [CrossRef]
  9. Lima, N.M.; Andrade, T.J.A.S.; Silva, D.H.S. Dereplication of Terpenes and Phenolic Compounds from Inga Edulis Extracts Using HPLC-SPE-TT, RP-HPLC-PDA and NMR Spectroscopy. Nat. Prod. Res. 2021, 36, 488–492. [Google Scholar] [CrossRef]
  10. Kind, T.; Fiehn, O. Seven Golden Rules for Heuristic Filtering of Molecular Formulas Obtained by Accurate Mass Spectrometry. BMC Bioinform. 2007, 8, 105. [Google Scholar] [CrossRef] [Green Version]
  11. Hubert, J.; Nuzillard, J.-M.; Renault, J.-H. Dereplication Strategies in Natural Product Research: How Many Tools and Methodologies behind the Same Concept? Phytochem. Rev. 2017, 16, 55–95. [Google Scholar] [CrossRef]
  12. Weidt, S.; Haggarty, J.; Kean, R.; Cojocariu, C.I.; Silcock, P.J.; Rajendran, R.; Ramage, G.; Burgess, K.E.V. A Novel Targeted/Untargeted GC-Orbitrap Metabolomics Methodology Applied to Candida albicans and Staphylococcus aureus Biofilms. Metabolomics 2016, 12, 189. [Google Scholar] [CrossRef] [PubMed] [Green Version]
  13. Canuto, G.A.B.; Da Costa, J.L.; Da Cruz, P.L.R.; De Souza, A.R.L.; Faccio, A.T.; Klassen, A.; Rodrigues, K.T.; Tavares, M.F.M. Metabolomics: Definitions, State-of-the-Art and Representative Applications. Quim. Nova 2018, 41, 75–91. [Google Scholar]
  14. Yu, M.; Wen, R.; Jiang, L.; Huang, S.; Fang, Z.; Chen, B.; Wang, L. Rapid Analysis of Benzoic Acid and Vitamin C in Beverages by Paper Spray Mass Spectrometry. Food Chem. 2018, 268, 411–415. [Google Scholar] [CrossRef]
  15. Cooks, R.G.; Ouyang, Z.; Takats, Z.; Wiseman, J.M. Ambient Mass Spectrometry. Science 2006, 311, 1566–1570. [Google Scholar] [CrossRef]
  16. Liu, J.; Wang, H.; Manicke, N.E.; Lin, J.; Cooks, R.G.; Ouyang, Z. Development, Characterization, and Application of Paper Spray Ionization. Anal. Chem. 2010, 82, 2463–2471. [Google Scholar] [CrossRef] [PubMed]
  17. Deng, J.; Yang, Y. Chemical Fingerprint Analysis for Quality Assessment and Control of Bansha Herbal Tea Using Paper Spray Mass Spectrometry. Anal. Chim. Acta 2013, 785, 82–90. [Google Scholar] [CrossRef]
  18. Silva, V.D.M.; Arquelau, P.B.F.; Silva, M.R.; Augusti, R.; Melo, J.O.F.; Fante, C.A. Use of Paper Spray-Mass Spectrometry to Determine the Chemical Profile of Ripe Banana Peel Flour and Evaluation of Its Physicochemical and Antioxidant Properties. Quim. Nova 2020, 43, 579–585. [Google Scholar] [CrossRef]
  19. Di, L.; Taverna, D.; Indelicato, S.; Napoli, A.; Sindona, G.; Mazzotti, F. Rapid Assay of Resveratrol in Red Wine by Paper Spray Tandem Mass Spectrometry and Isotope Dilution. Food Chem. 2017, 229, 354–357. [Google Scholar]
  20. Bartella, L.; Bouza, M.; Rocío-Bautista, P.; Di, L.; García-Reyes, F.; Molina-Díaz, A. Direct Wine Profiling by Mass Spectrometry (MS): A Comparison of Different Ambient MS Approaches. Microchem. J. 2022, 179, 107479. [Google Scholar] [CrossRef]
  21. Moura, A.C.M.; Lago, I.N.; Cardoso, C.F.; dos Reis Nascimento, A.; Pereira, I.; Vaz, B.G. Rapid Monitoring of Pesticides in Tomatoes (Solanum Lycopersicum L.) during Pre-Harvest Intervals by Paper Spray Ionization Mass Spectrometry. Food Chem. 2020, 310, 125938. [Google Scholar] [CrossRef]
  22. Loyola, A.C.F.e.; Silva, V.D.M.; Silva, M.R.; Rodrigues, C.G.; dos Santos, A.N.; Melo, J.O.F.; Augusti, R.; Fante, C.A.A. A Use of Paper Spray Mass Spectrometry for Determining the Chemicalprofile of Green Cavendish Banana (Musa AAA) Peel and Pulp Flours and Evaluation of Its Functional Potential. J. Braz. Chem. Soc. Chem. Soc. 2021, 32, 953–963. [Google Scholar]
  23. Wang, H.; Liu, J.; Cooks, R.G.; Ouyang, Z. Paper Spray for Direct Analysis of Complex Mixtures Using Mass. Angew. Chem. Int. Ed. 2010, 49, 877–880. [Google Scholar] [CrossRef] [PubMed]
  24. Baj, T.; Baryluk, A.; Sieniawska, E. Application of Mixture Design for Optimum Antioxidant Activity of Mixtures of Essential Oils from Ocimum basilicum L., Origanum majorana L. and Rosmarinus officinalis L. Ind. Crops Prod. 2018, 115, 52–61. [Google Scholar] [CrossRef]
  25. DiCiaula, M.C.; Lopes, G.C.; Scarminio, I.S.; De Mello, J.C.P. Optimization of Solvent Mixtures for Extraction from Bark of Schinus terebinthifolius by a Statistical Mixture-Design Technique and Development of a Uv-Vis Spectrophotometric Method for Analysis of Total Polyphenols in the Extract. Quim. Nova 2014, 37, 158–163. [Google Scholar] [CrossRef] [Green Version]
  26. Lima, G.S.; Lima, N.M.; Roque, J.V.; De Aguiar, D.V.A.; Oliveira, V.A.; Santos, G.F.; Chaves, A.R.; Vaz, B.G. LC-HRMS/MS-Based Metabolomics Approaches Applied to the Detection of Antifungal Compounds and a Metabolic Dynamic Assessment of Orchidaceae. Molecules 2022, 27, 7937. [Google Scholar] [CrossRef]
  27. Pereira, I.; Rodrigues, M.F.; Chaves, A.R.; Vaz, B.G. Molecularly Imprinted Polymer (MIP) Membrane Assisted Direct Spray Ionization Mass Spectrometry for Agrochemicals Screening in Foodstuffs. Talanta 2018, 178, 507–514. [Google Scholar] [CrossRef]
  28. Santos, A.M.S.; Faria, R.C.; Pereira, I.; de Lima, L.A.S.; Leal, C.M.; Nascimento, A.R.; Simas, R.C.; Lima, N.M.; Vaz, B.G. Paper Spray Ionization Mass Spectrometry Applied for Quantification of Pesticides and Discrimination from Tomato Varieties (Solanum lycopersicum). J. Food Compos. Anal. 2022, 109, 104467. [Google Scholar] [CrossRef]
  29. Ramalho, R.R.F.; Pereira, I.; Lima, G.S.; Santos, G.F.; Maciel, L.I.L.; Simas, R.C.; Vaz, B.G. Fumonisin B1 Analysis in Maize by Molecularly Imprinted Polymer Paper Spray Ionization Mass Spectrometry (MIP-PSI-MS). J. Food Compos. Anal. 2022, 107, 104362. [Google Scholar] [CrossRef]
  30. Trott, O.; Olson, A.J. AutoDock Vina: Improving the Speed and Accuracy of Docking with a New Scoring Function, Efficient Optimization, and Multithreading. J. Comput. Chem. 2010, 31, 455–461. [Google Scholar] [CrossRef] [Green Version]
  31. Wolber, G.; Langer, T. LigandScout: 3-D Pharmacophores Derived from Protein-Bound Ligands and Their Use as Virtual Screening Filters. J. Chem. Inf. Model. 2005, 45, 160–169. [Google Scholar] [CrossRef]
  32. Sendovski, M.; Kanteev, M.; Ben-Yosef, V.S.; Adir, N.; Fishman, A. First Structures of an Active Bacterial Tyrosinase Reveal Copper Plasticity. J. Mol. Biol. 2011, 405, 227–237. [Google Scholar] [CrossRef] [PubMed]
  33. Declercq, J.P.; Evrard, C.; Clippe, A.; Stricht, D.; Vander, S.; Bernard, A.; Knoops, B. Crystal Structure of Human Peroxiredoxin 5, a Novel Type of Mammalian Peroxiredoxin at 1.5 Å Resolution. J. Mol. Biol. 2001, 311, 751–759. [Google Scholar] [CrossRef] [PubMed] [Green Version]
  34. Pettersen, E.F.; Goddard, T.D.; Huang, C.C.; Couch, G.S.; Greenblatt, D.M.; Meng, E.C.; Ferrin, T.E. UCSF Chimera—A Visualization System for Exploratory Research and Analysis. J. Comput. Chem. 2004, 25, 1605–1612. [Google Scholar] [CrossRef] [Green Version]
  35. SAMSON: Software for Adaptive Modeling and Simulation of Nanosystems; OneAngstrom: Grenoble, France, 2022.
  36. Phapale, P.; Palmer, A.; Gathungu, R.M.; Kale, D.; Brügger, B.; Alexandrov, T. Public LC-Orbitrap-MS/MS Spectral Library for Metabolite Identification. J. Proteome Res. 2021, 20, 2089–2097. [Google Scholar] [CrossRef]
  37. Kuhl, C.; Tautenhahn, R.; Bottcher, C.; Larson, T.R.; Neumann, S. CAMERA: An Integrated Strategy for Compound Spectra Extraction and Annotation of Liquid Chromatography/Mass Spectrometry Data Sets. Anal. Chem. 2012, 84, 283–289. [Google Scholar] [CrossRef] [Green Version]
  38. Wernisch, S.; Pennathur, S. Evaluation of Coverage, Retention Patterns, and Selectivity of Seven Liquid Chromatographic Methods for Metabolomics. Anal. Bioanal. Chem. 2016, 408, 6079–6091. [Google Scholar] [CrossRef] [Green Version]
  39. Brodsky, L.; Moussaieff, A.; Shahaf, N.; Aharoni, A.; Rogachev, I. Evaluation of Peak Picking Quality in LC−MS Metabolomics Data. Anal. Chem. 2010, 82, 9177–9187. [Google Scholar] [CrossRef]
  40. Wang, M.; Carver, J.J.; Phelan, V.V.; Sanchez, L.M.; Garg, N.; Peng, Y.; Nguyen, D.D.; Watrous, J.; Kapono, C.A.; Luzzatto-Knaan, T.; et al. Sharing and Community Curation of Mass Spectrometry Data with Global Natural Products Social Molecular Networking. Nat. Biotechnol. 2016, 34, 828–837. [Google Scholar] [CrossRef] [Green Version]
  41. Nothias, L.F.; Petras, D.; Schmid, R.; Dührkop, K.; Rainer, J.; Sarvepalli, A.; Protsyuk, I.; Ernst, M.; Tsugawa, H.; Fleischauer, M.; et al. Feature-Based Molecular Networking in the GNPS Analysis Environment. Nat. Methods 2020, 17, 905–908. [Google Scholar] [CrossRef]
  42. Mohimani, H.; Gurevich, A.; Shlemov, A.; Mikheenko, A.; Korobeynikov, A.; Cao, L.; Shcherbin, E.; Nothias, L.F.; Dorrestein, P.C.; Pevzner, P.A. Dereplication of Microbial Metabolites through Database Search of Mass Spectra. Nat. Commun. 2018, 9, 4035. [Google Scholar] [CrossRef] [Green Version]
  43. da Silva, R.R.; Wang, M.; Nothias, L.F.; van der Hooft, J.J.J.; Caraballo-Rodríguez, A.M.; Fox, E.; Balunas, M.J.; Klassen, J.L.; Lopes, N.P.; Dorrestein, P.C. Propagating Annotations of Molecular Networks Using in Silico Fragmentation. PLoS Comput. Biol. 2018, 14, e1006089. [Google Scholar] [CrossRef]
  44. Cao, L.; Guler, M.; Tagirdzhanov, A.; Lee, Y.Y.; Gurevich, A.; Mohimani, H. MolDiscovery: Learning Mass Spectrometry Fragmentation of Small Molecules. Nat. Commun. 2021, 12, 3718. [Google Scholar] [CrossRef]
  45. Van Der Hooft, J.J.J.; Wandy, J.; Barrett, M.P.; Burgess, K.E.V.; Rogers, S. Topic Modeling for Untargeted Substructure Exploration in Metabolomics. Proc. Natl. Acad. Sci. USA 2016, 113, 13738–13743. [Google Scholar] [CrossRef] [Green Version]
  46. Ernst, M.; Kang, K.B.; Caraballo-Rodríguez, A.M.; Nothias, L.F.; Wandy, J.; Chen, C.; Wang, M.; Rogers, S.; Medema, M.H.; Dorrestein, P.C.; et al. Molnetenhancer: Enhanced Molecular Networks by Integrating Metabolome Mining and Annotation Tools. Metabolites 2019, 9, 144. [Google Scholar] [CrossRef] [Green Version]
  47. Sumner, L.W.; Amberg, A.; Barrett, D.; Beale, M.H.; Beger, R.; Daykin, C.A.; Fan, T.W.M.; Fiehn, O.; Goodacre, R.; Griffin, J.L.; et al. Proposed Minimum Reporting Standards for Chemical Analysis. Metabolomics 2007, 3, 211–221. [Google Scholar] [CrossRef] [Green Version]
  48. Day, R.A.; Underwood, A.L. Quantitative Analysis, 6th ed.; Prentice-Hall: Hoboken, NJ, USA, 1991. [Google Scholar]
  49. Jouyban, A.; Soltanpour, S.; Chan, H. A Simple Relationship between Dielectric Constant of Mixed Solvents with Solvent Composition and Temperature. Int. J. Pharm. 2004, 269, 353–360. [Google Scholar] [CrossRef]
  50. Mao, H.; Qiu, Z. Development and Application of Ultra-High Temperature Drilling Fluids in Offshore Oilfield around Bohai Sea Bay Basin, China. In Proceedings of the The Offshore Technology Conference Asia, Kuala Lumpur, Malaysia, 22–25 March 2016; pp. 1201–1222. [Google Scholar]
  51. Zhang, Z.; Xu, W.; Manicke, N.E.; Cooks, R.G.; Ouyang, Z. Silica Coated Paper Substrate for Paper-Spray Analysis of Therapeutic Drugs in Dried Blood Spots. Anal. Chem. 2012, 84, 931–938. [Google Scholar] [CrossRef] [Green Version]
  52. Feng, R.; Wang, Q.; Tong, W.; Xiong, J.; Wei, Q.; Zhou, W.; Yin, Z.; Jia, R.; Song, X.; Zou, Y.; et al. Extraction and Antioxidant Activity of Flavonoids of Morus nigra. Int. J. Clin. Exp. Med. 2015, 8, 22328–22336. [Google Scholar]
  53. Hu, B.; So, P.K.; Yao, Z.P. Analytical Properties of Solid-Substrate Electrospray Ionization Mass Spectrometry. J. Am. Soc. Mass Spectrom. 2013, 24, 57–65. [Google Scholar] [CrossRef] [Green Version]
  54. Vega, C.; Spence, C.; Zhang, C.; Bills, B.J.; Manicke, N.E. Ionization Suppression and Recovery in Direct Biofluid Analysis Using Paper Spray Mass Spectrometry. J. Am. Soc. Mass Spectrom. 2016, 27, 726–734. [Google Scholar] [CrossRef] [Green Version]
  55. Ren, Y.; Wang, H.; Liu, J.; Zhang, Z.; McLuckey, M.N.; Ouyang, Z. Analysis of Biological Samples Using Paper Spray Mass Spectrometry: An Investigation of Impacts by the Substrates, Solvents and Elution Methods. Chromatographia 2013, 76, 1339–1346. [Google Scholar] [CrossRef] [Green Version]
Figure 1. (A) Circle diagrams illustrate the percentages of unique metabolites obtained by classical molecular networking (MN), Dereplicator+, Moldiscovery, and NAP fusion from LC-MS spectra of cupuassu (T. grandiflorum) pulp extracts. (B) Impact of solvent used on the percentage of major chemical classes detected by LC-HRMS/MS analysis in positive ion mode ESI incupuassu pulp extracts.
Metabolites 13 00367 g001
Figure 2. Qualitative comparison of the chemical profiles obtained by paper spray ionization mass spectrometry (PSI-MS) and liquid chromatography–mass spectrometry (LC-MS) from cupuassu (T. grandiflorum) pulp extracts prepared with acetonitrile/methanol/water.
Metabolites 13 00367 g002
Figure 3. Comparison of chemical profiles obtained by paper spray ionization–mass spectrometry (PSI-MS) and liquid chromatography–mass spectrometry (LC-MS) for the different extraction solvents.
Metabolites 13 00367 g003
Figure 4. Comparison of the number of compounds detected by paper spray ionization mass spectrometry (PSI-MS) and liquid chromatography–mass spectrometry (LC-MS) in the different cupuassu pulp extracts.
Metabolites 13 00367 g004
Figure 5. LC-MS and PSI-MS mass spectra showing the extraction efficiency of oleanane triterpenoid derivatives and their abundance according to the extraction system using mixtures of acetonitrile/methanol/water from cupuassu (T. grandiflorum) pulp extracts.
Metabolites 13 00367 g005
Figure 6. Relative abundance of the major compounds annotated from cupuassu (T. grandiflorum) pulp extract samples using mixtures of acetonitrile/methanol/water obtained in LC-HRMS/MS and PSI-HRMS/MS analyses.
Metabolites 13 00367 g006
Figure 7. (A) Binding site (yellow color) of tyrosinase from Bacillus megaterium; (B) binding site (yellow color) of human peroxiredoxin 5.
Metabolites 13 00367 g007
Figure 8. LIGPLOTs showing interacting residues of (A) tyrosinase complex and (B) human peroxiredoxin 5 with 5,7,8-trihydroxyflavanone. Red arrow dotted lines, HBAs; green arrow dotted lines, HBDs; yellow lines, H interactions.
Metabolites 13 00367 g008
Figure 9. Three-dimensional and two-dimensional representations of pharmacophoric features of 5,7,8-trihydroxyflavanone used in three-dimensional pharmacophore generation. Red, HBAs; green, HBDs; yellow, H; purple, Ar.
Metabolites 13 00367 g009
Table 1. Results of the metabolite annotation of cupuassu (T. grandiflorum) through LC-HRMS/MS analysis in positive ion mode ESI.
Exact Mass (Da)Molecular FormulaError (ppm)Metabolite NameChemical StructureChemical Class
290.079C15H14O68CatechinMetabolites 13 00367 i001Flavonoid
496.1216C22H24O1310(−)-Epigallocatechin-3′-glucuronideMetabolites 13 00367 i002Flavonoid
322.1205C20H18O425,7-Dihydroxy-8-prenylflavoneMetabolites 13 00367 i003Flavonoid
270.0528C15H10O513,5,7-TrihydroxyflavoneMetabolites 13 00367 i004Flavonoid
272.0684C15H12O535,7,8-trihydroxyflavanoneMetabolites 13 00367 i005Flavonoid
432.1267C18H24O1202-Methyl-4-oxo-4H-pyran-3-yl 6-O-(4-carboxy-3-hydroxy-3-methylbutanoyl)-beta-D-glucopyranosideMetabolites 13 00367 i006Chromone
260.1048C15H16O410HeteropeuceninMetabolites 13 00367 i007Chromone
192.027C6H8O70Citric acidMetabolites 13 00367 i008Organic acid
178.0629C10H10O314-Methoxycinnamic acidMetabolites 13 00367 i009Phenylpropanoid
134.0731C9H10O1Cinnamic alcoholMetabolites 13 00367 i010Phenylpropanoid
430.1838C20H30O1002-Phenylethyl 6-O-(6-deoxy-alpha-L-mannopyranosyl)-beta-D-glucopyranosideMetabolites 13 00367 i011Phenylpropanoid
272.1776C18H24O20GalaxolidoneMetabolites 13 00367 i012Terpene
250.1568C15H22O39Hydroxyvalerenic acidMetabolites 13 00367 i013Terpene
274.1568C17H22O310NimbidiolMetabolites 13 00367 i014Terpene
332.1987C20H28O497|A,15-Dihydroxydehydroabietic acidMetabolites 13 00367 i015Terpene
250.1568C15H22O3102-[(2S,4aR,8aS)-2-hydroxy-4a-methyl-8-methylidene-3,4,5,6,7,8a-hexahydro-1H-naphthalen-2-yl]prop-2-enoic acidMetabolites 13 00367 i016Terpene
320.2351C20H32O310(1R,4aR,5S)-5-(3-hydroxy-3-methylpent-4-enyl)-1,4a-dimethyl-6-methylidene-3,4,5,7,8,8a-hexahydro-2H-naphthalene-1-carboxylic acidMetabolites 13 00367 i017Terpene
442.381C30H50O20AllobetulinolMetabolites 13 00367 i018Terpene
488.3501C30H48O54Asiatic acidMetabolites 13 00367 i019Terpene
426.3861C30H50O2Lup-20(29)-en-3-olMetabolites 13 00367 i020Terpene
Table 2. Docking analysis of the five major metabolites from cupuassu (T. grandiflorum) on different protein receptors with respect to quercetin.
CompoundDocking Score (kcal/mol)
PDB:3nm8
(Bacterial tyrosinase)
Docking Score (kcal/mol)
PDB: 1HD2
(Human Peroxiredoxin 5)
Quercetin (standard)−10.4−6.3
Citric acid−5.8−4.5
Catechin−7.5−6.1
5,7,8-Trihydroxyflavanone−11.4−7.0
Asiatic acid−8.0−6.8
Epigallocatechin-3′-glucuronide−9.0−7.7
Disclaimer/Publisher’s Note: The statements, opinions and data contained in all publications are solely those of the individual author(s) and contributor(s) and not of MDPI and/or the editor(s). MDPI and/or the editor(s) disclaim responsibility for any injury to people or property resulting from any ideas, methods, instructions or products referred to in the content.

