Article

Metabolic Profile of Whole Unstimulated Saliva in Patients with Sjögren’s Syndrome

1
Dentistry and Oral-Maxillofacial Surgery Unit, University of Modena and Reggio Emilia, Largo del Pozzo 71, 41125 Modena, Italy
2
Department for Life Quality Studies, University of Bologna, Corso d’Augusto 237, 47921 Rimini, Italy
3
Department of Chemical and Geological Sciences, University of Modena and Reggio Emilia, Via G. Campi 103, 41125 Modena, Italy
4
Pathology Unit, Azienda USL-IRCCS di Reggio Emilia, Viale Risorgimento 80, 42123 Reggio Emilia, Italy
5
Dermatology Unit, University of Modena and Reggio Emilia, Largo del Pozzo 71, 41125 Modena, Italy
6
Centro Universitario Odontoiatria, University of Parma, Via Gramsci 14, 43126 Parma, Italy
7
Rheumatology Unit, University of Modena and Reggio Emilia, Largo del Pozzo 71, 41125 Modena, Italy
*
Authors to whom correspondence should be addressed.
Metabolites 2023, 13(3), 348; https://doi.org/10.3390/metabo13030348
Submission received: 5 February 2023 / Revised: 22 February 2023 / Accepted: 24 February 2023 / Published: 27 February 2023
(This article belongs to the Special Issue Salivary Metabolomics for Oral and Systemic Diseases Volume 2)

Abstract

:
Primary Sjögren’s Syndrome (pSS) is a multi-system autoimmune disease that involves the exocrine glands. Lymphocytes infiltrate the gland tissue, leading to anatomical modification and hypofunction. Even if the prognosis of pSS is favorable, quality of life is typically reduced due to the diverse manifestations of the disease. The aim of this study is to compare the salivary metabolomes of pSS with healthy controls (HCs). Seven cases were selected from a cohort of pSS patients, and six age- and sex-matched HCs were recruited from a cohort of volunteers. Whole unstimulated saliva was collected for NMR analysis. Our metabolomic analysis focused on 360 ms total echo 1D 1H NMR CPMG spectra. Metabolites detected with CPMG NMR spectra were assigned through 2D NMR spectra (COSY, TOCSY, and HSQC). About 50 metabolites were detected and assigned. Unsupervised exploratory PCA returned partial clustering, and PLS-DA improved the separation between pSS and HCs, highlighting a pool of metabolites distinctly describing each group. Despite the limited number of samples, the presented preliminary data are promising. PLS-DA indicated well-defined group separation, suggesting that the application of 1H-NMR metabolomics is suitable for the study of pSS.

1. Introduction

Primary Sjögren’s Syndrome (pSS) is a chronic, slowly progressing autoimmune disease characterized by xerostomia and keratoconjunctivitis sicca as clinical hallmarks. pSS may evolve from organ-specific autoimmune exocrinopathy to systemic disease.
pSS’s prevalence is widely described as fewer than 50 cases per 100,000 inhabitants. Women are six to nine times more likely to be affected than men, and the typical age at diagnosis is around 60–70 years [1].
Distinctive recurrent phases are associated with the pathogenesis of pSS: (1) environmental stimuli (e.g., viral infections) act to trigger a certain condition involving genetic predisposition, the presence of epigenetic factors, and hormonal regulation; (2) overturn of normal exocrine gland function (e.g., salivary, lacrimal, and diffuse glandular tissue of the esophagus, stomach, bowel, pancreas, and bladder) caused by alteration of epithelial cell activity [2]; and (3) B and T lymphocytes become hyperactive, leading to glandular tissue infiltration. Consequently, B-cells intensify auto-antibody production. The chronic inflammation in pSS worsens the glandular structure modification and contributes to hypofunction [3].
The following clinical manifestations are consequences of systemic involvement: dryness secondary to exocrinopathy, autoimmune epithelitis with periepithelial lymphocytic infiltration of target organs, associated organ-specific autoimmunity with specific autoantibodies, the presence of immune complexes or cryoglobulinemia, and clonal lymphocytic expansion [4]. During the natural course of the disease, 75% of patients will develop at least one extraglandular manifestation, which can occur at diagnosis or during follow-up. In general, the manifestations caused by lymphocytic infiltration of a target organ are indolent and durable (e.g., sicca syndrome, renal tubular acidosis, pulmonary involvement) while the autoimmune disorders linked to immune complexes or autoantibodies have a more unpredictable course, with flares and remissions. Overall, quality of life is strongly reduced due to the diverse manifestations of the disease. pSS can be disabling and associated with significant functional status impairment related to oral and/or ocular dryness, systemic activity, pain, fatigue and daytime somnolence, anxiety, psychological distress, and depression symptoms [5].
The progression of pSS is favorable, with the patient’s life expectancy being comparable to that of the general population. However, a sub-group of patients will have unfavorable prognoses. Specific risk factors are identifiable, such as advanced age, atypical parotid gland imaging (e.g., scintigraphy), extraglandular involvement, vasculitis, anti-SSB/Ro positivity, reduction in serum complement components (e.g., C3, C4, and CH50 inflammatory protein), and cryoglobulinemia.
The excess mortality is generally attributed to the development of non-Hodgkin’s lymphoma, solid tumors, or uncommon (but severe) visceral involvement, such as cardiovascular disease and infections [6]. In spite of the predominantly female involvement, evidence of a higher incidence of lymphoma and interstitial lung disease in males with pSS has been reported, suggesting a sex-specific preference for some clinical manifestations [7].
There is still no single clinical, laboratory, pathological, or radiological feature that could serve as a gold standard for the diagnosis and/or classification of this syndrome [8]. Diagnostic criteria are provided in the 2016 ACR/EULAR Consensus of Classification Criteria for pSS, which are based on the sum of weighted scores applied to five items: anti-SSA/Ro antibody positivity, a focus score of ≥1 foci/4 mm2, an ocular staining score ≥5 (or van Bijsterveld score ≥ 4) in at least one eye, a Schirmer’s test result of ≤5 mm/5 min, and an unstimulated salivary flow rate (SFR) of ≤0.1 mL/minute [9].
The chemical–physical properties and volume of whole saliva (WS) can grossly vary among people, as well as in the same person, according to endogenous and exogenous factors (e.g., age, gender, circadian rhythm, psychological state, nutrition, diseases, drugs, and environmental exposures). Moreover, qualitative variations of saliva related to the presence and concentration of specific categories of molecules have been described [10,11]. Additionally, saliva has recently been widely investigated in order to understand its role in potential systemic disease and cancer diagnosis [12,13].
As the salivary glands are a major site of autoimmune destruction in pSS, changes in salivary components may reflect the pathogenesis of the disease. Taking advantage of emerging ‘omics’ technologies, saliva has been explored for the discovery of biomarkers for the diagnosis and prognosis of pSS [8].
More than a few proteomic studies have shown differential protein expression in the saliva of pSS patients and healthy control subjects, which could lead to the identification of potential biomarkers [14]. In addition, transcriptome analysis of the saliva from pSS patients and controls revealed differences in mRNA expression levels [15].
Metabolomics has been successfully proposed to characterize pSS saliva, compared with that of healthy controls (HCs). Saliva from patients with pSS has been studied using different mass spectrometry techniques: gas chromatography–mass spectrometry (GC–MS) [16] and ultra-performance liquid chromatography–mass spectrometry (UPLC–HRMS) [17].
Some other studies report the use of Nuclear Magnetic Resonance (NMR) spectroscopy on salivary samples [18,19] for pSS investigation.
It has been shown that NMR is a powerful and reproducible technique for metabolic profiling and, when combined with multivariate analysis, it can be used as a biomarker diagnostic tool [20]. Mikkonen et al. have investigated the salivary metabolic profile of patients with pSS. They identified 24 metabolites in samples of stimulated saliva; metabolites such as choline, butyrate, proline, taurine, alanine, phenylalanine, and glycine have been shown to have significantly higher concentrations in saliva from pSS patients than HCs [19]. Moreover, Herrala et al. described 21 variables that emerged from the inter- and intra-individual evaluation of salivary samples collected at different time points and compared with HCs. Levels and outputs of some peculiar metabolites, such as choline, taurine, alanine, and glycine significantly distinguished cases from controls, suggesting their potential application for pSS diagnosis and follow-up [18].
The use of NMR spectroscopy has several advantages. The technique does not require pre-treatment of the sample and the amount of sample needed is limited, which is significant in our study [21]. The NMR analysis does not exceed half an hour and allows for the simultaneous detection of small and large metabolites in the sample. 2D NMR experiments allow the assignment of new metabolites, even in the absence of a standard, with a skeleton reconstruction process described elsewhere [22].
Finally, NMR spectroscopy allows unbiased quantification and greater reproducibility of data.
The aim of this study is to improve the NMR database of metabolites on pSS saliva and to compare the salivary metabolome of pSS with HCs through the application of untargeted metabolomics performed with 1H-NMR.

2. Materials and Methods

2.1. Population selection

The evaluated subjects were part of a single-center case-control study (Ethical Committee Code: 1183/2018/SPER/AOUMO).
Between 2011 and 2017, 124 patients received a biopsy of the minor salivary glands due to suspicion of SS. Related histological slides were re-assessed to standardize the diagnostic criteria [9,23]. All patients were in follow-up with the rheumatology service of University of Modena and Reggio Emilia at the time of review of specimens. These results were matched with data collected during clinical and serological evaluations.
A total of 60 diagnoses were confirmed for pSS, which constituted the cohort for further sample selection.
Strict selection criteria were applied in order to obtain the most homogeneous study population. Patients with a history of head and neck radiotherapy, HIV or HCV infection, lymphoma, sarcoidosis, graft versus host disease, and use of anticholinergic drugs were excluded. Furthermore, the presence of oral lesions, active oral infections, diabetes, smoking habits, and oncological diseases also constituted exclusion criteria. Unstimulated whole salivary flow was assessed under the following standardized conditions: the subject was advised to refrain from intake of any food or beverage (except for water) as well as from smoking one hour before the test session; immediately before collection, patients rinsed their mouth with water for 1 min; and patients passively drooled or spat into a measuring container over 15 min [24].
After the application of exclusion criteria, between January and July 2019, 7 female cases were selected for salivary investigation (mean age 65.4). In addition, 6 sex- and age-matched HCs were selected from a cohort of volunteers.
The serological status of patients was also considered, to evaluate the level of anti-SSA/Ro, anti-SSB/La, rheumatoid factor (RF), and antinuclear antibody (ANA). Moreover, clinical information such as referred symptoms and other test results were considered (e.g., Schirmer test). The characteristics of the patients are summarized in Table 1.

2.2. Saliva Collection

A thorough oral evaluation was performed to determine potential pathological conditions. Saliva samples were collected using standard techniques, according to Navazesh [25]. All recruited patients were asked not to eat, drink, smoke, or use oral hygiene products one hour before saliva collection. Immediately before collection, patients rinsed their mouths with water for 1 min. Samples from the two groups were collected in the morning (9:00 to 12:00) to minimize the influence of the circadian rhythm on salivary composition. Unstimulated whole saliva was passively collected or spat into a sterile Eppendorf cuvette, which was kept on ice during the entire process. All samples were immediately frozen in liquid nitrogen for transportation and stored in a refrigerator at −80 °C until further analysis. Specimen anonymization took place at this stage.

2.3. Sample Preparation

Each frozen saliva sample was thawed at room temperature and centrifuged at 15,000× g rpm for 10 min at 4 °C to remove cells, cellular debris, and mucins, according to Gardner et al. [26]. To equalize the pH measurements, all samples were buffered with a solution containing trisodium phosphate (TSP), 500 μL of supernatant was mixed with 100 μL of TSP buffer (pH 7.45), and 500 μL of this solution was used for NMR.

2.4. NMR Data Collection and Analysis

The 1H-NMR metabolomics was blindly performed, as the operator was not aware of the provenance of the samples. An NMR Bruker Avance III HD 600 MHz spectrometer was used for data acquisition. One- (1H) and two-dimensional experiments—e.g., homonuclear 1H,1H correlation spectroscopy (COSY), total correlation spectroscopy (TOCSY), and 1H,13C heteronuclear single quantum coherence (HSQC)—were performed in order to identify the metabolites. The 1D 1H-NMR Carr–Purcell–Meiboom–Gill (CPMG) pulse sequence was used to highlight the narrow signals of metabolites and attenuate the broad signals of macromolecules. Due to the aqueous nature of saliva, pre-saturation was applied to suppress the water signal. The NMR spectra were pre-processed as previously reported [27]. In brief, the 1H CPMG NMR spectra were acquired with 4 s water pre-saturation, 2.27 s acquisition time, 106k data points, 40 ppm spectral width, and total echo time of 360 ms (2 ms single echo) 256 scans. They were zero-filled to 128 k and processed (TopSpin ® 4.0.7, Bruker Corp., Billerica, MA, USA) with a 0.5 Hz exponential line broadening, then manually phased and baseline corrected. The residual water signal was cut, and the spectra were aligned, binned (0.001 ppm), and normalized with respect to the total area in the range of 0.8–8.5 ppm (MNova, Mestrelab Research, S.L., Santiago de Compostela, Spain; Metaboanalyst 4.0, XiaLab, McGill University, Montreal, QC, Canada) to 7706 final spectral points. The chemical shift scale was calibrated with respect to the Me3Si signal of trimethylsilylpropanoic acid (TSP) at 0 ppm. The areas of selected signals from 30 metabolites were estimated by deconvolution through the MNova Line Fitting routine. Each spectrum was normalized with respect to its total spectral area (after cutting the residual water signal) prior to computing the point-by-point mean spectra for the two classes and their standard deviations (Figure 1).

2.5. Statistical Analysis
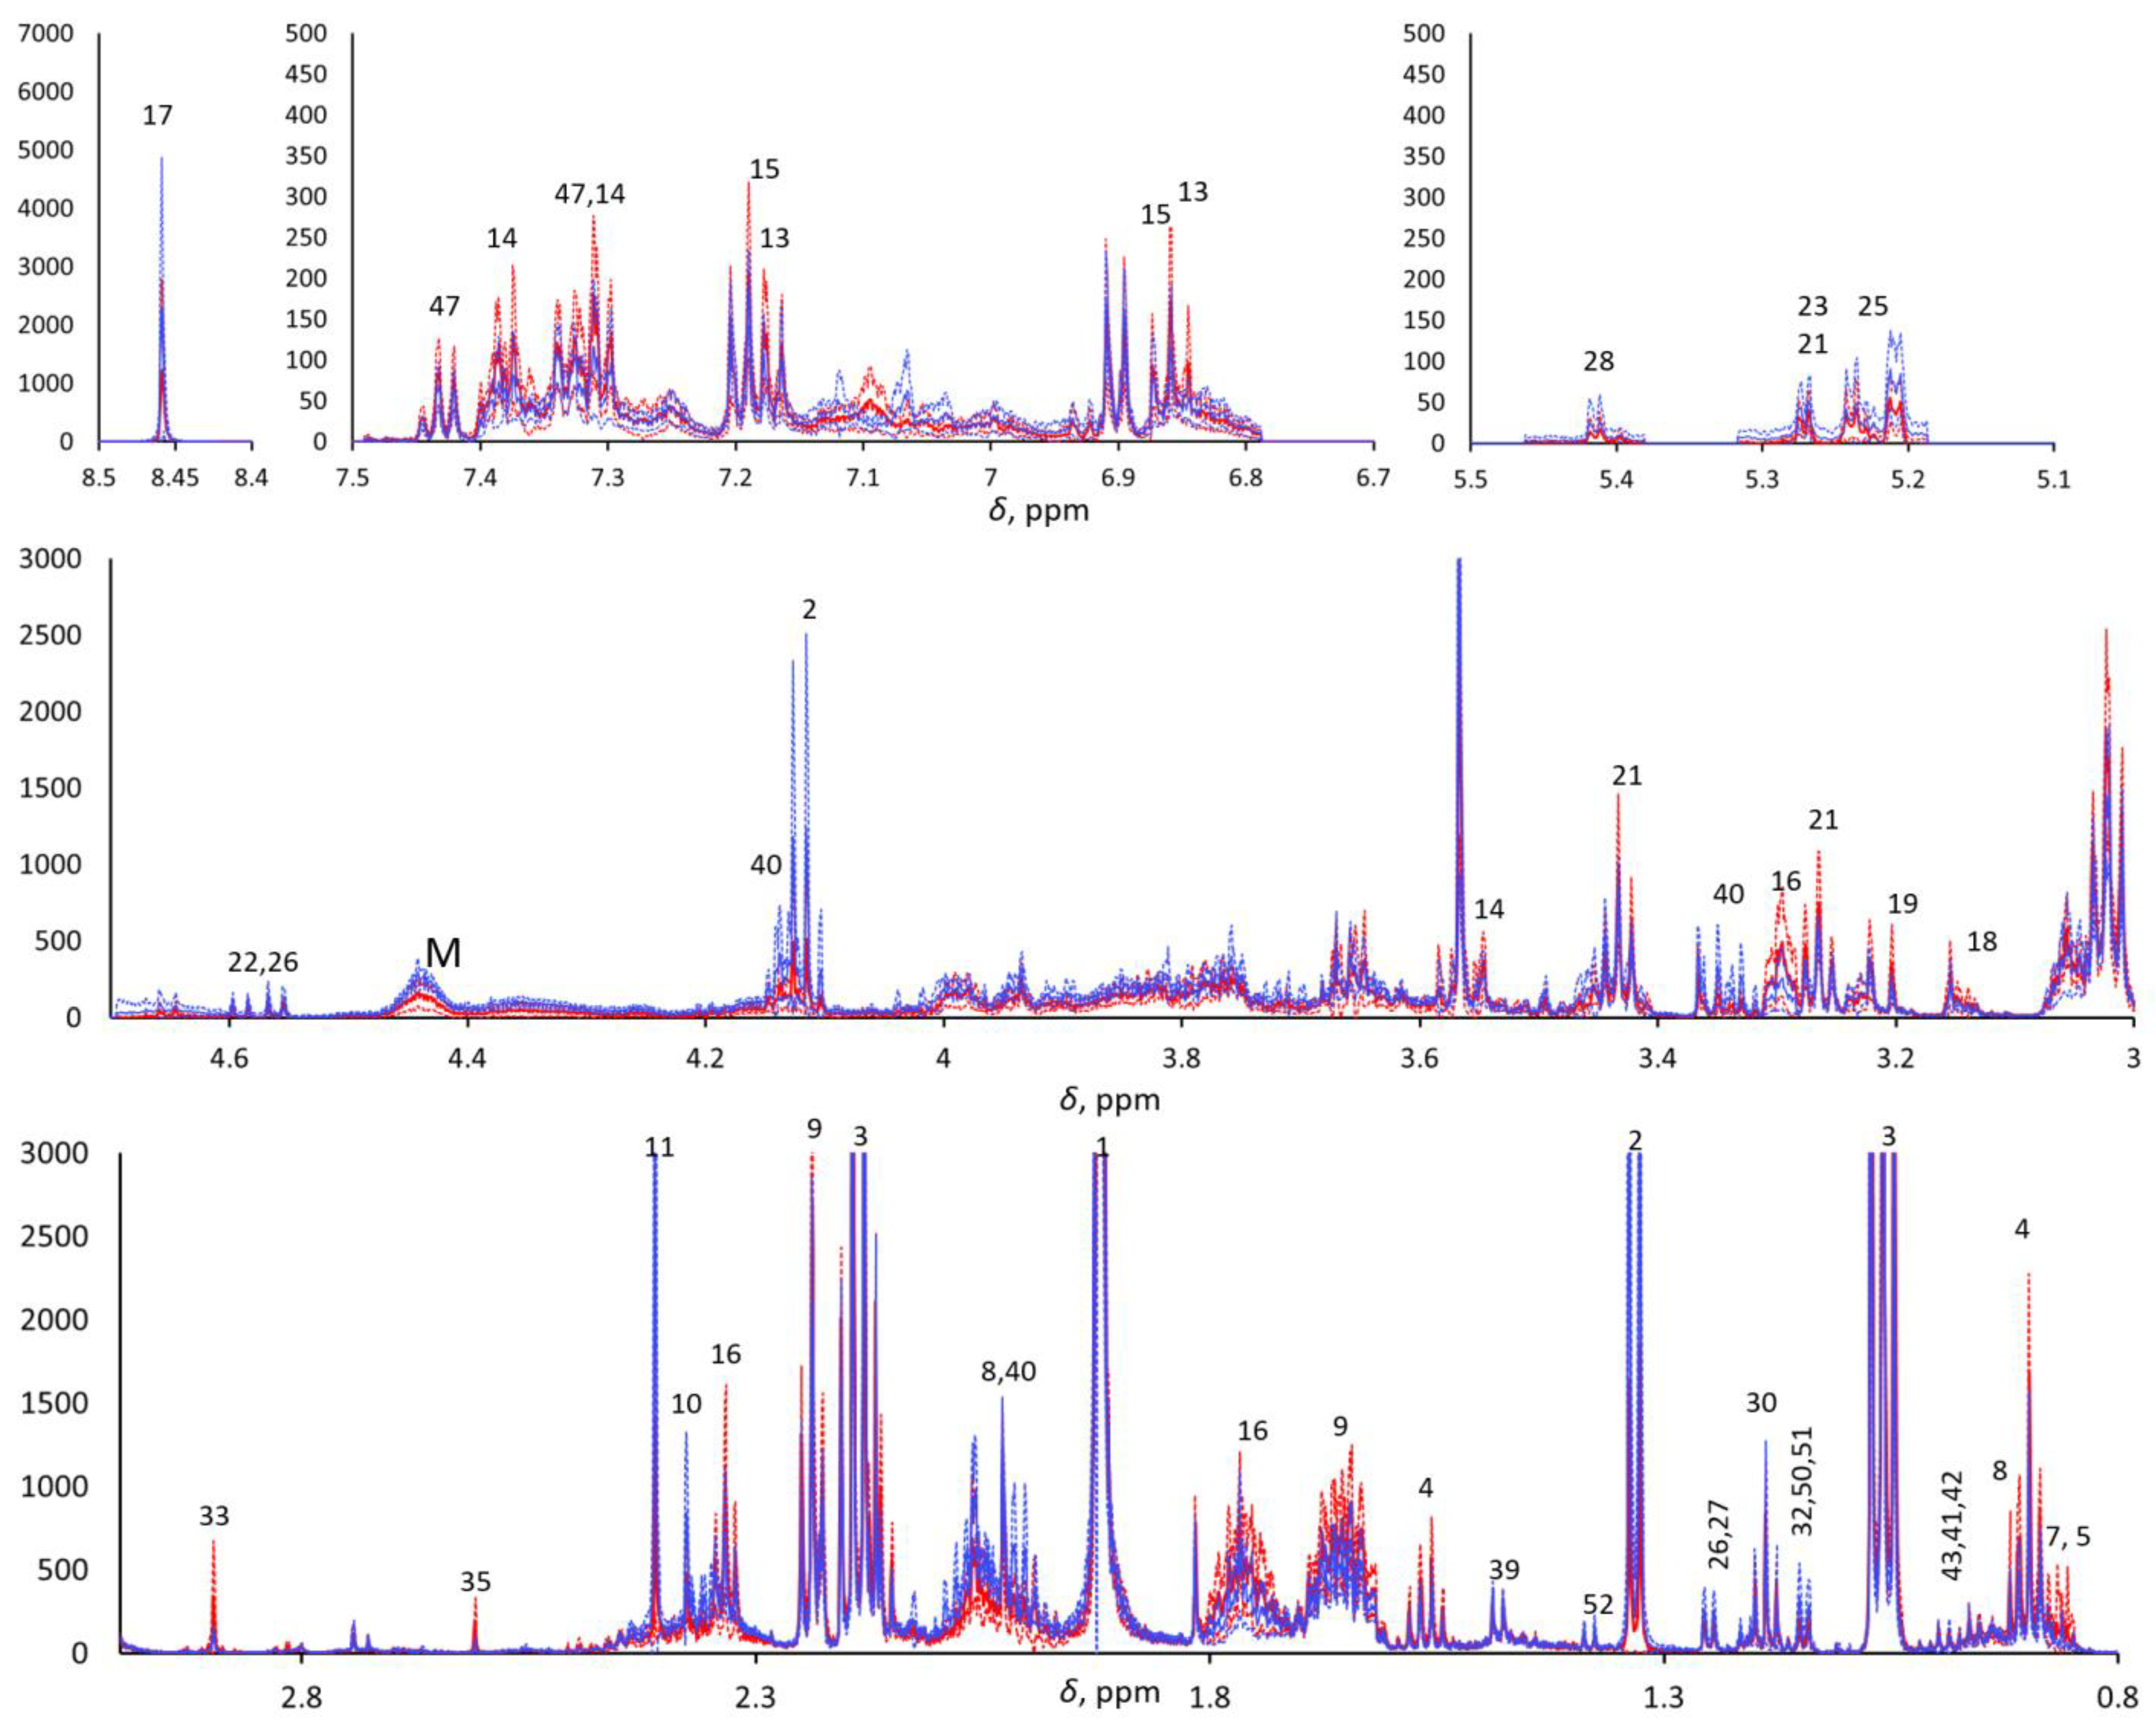
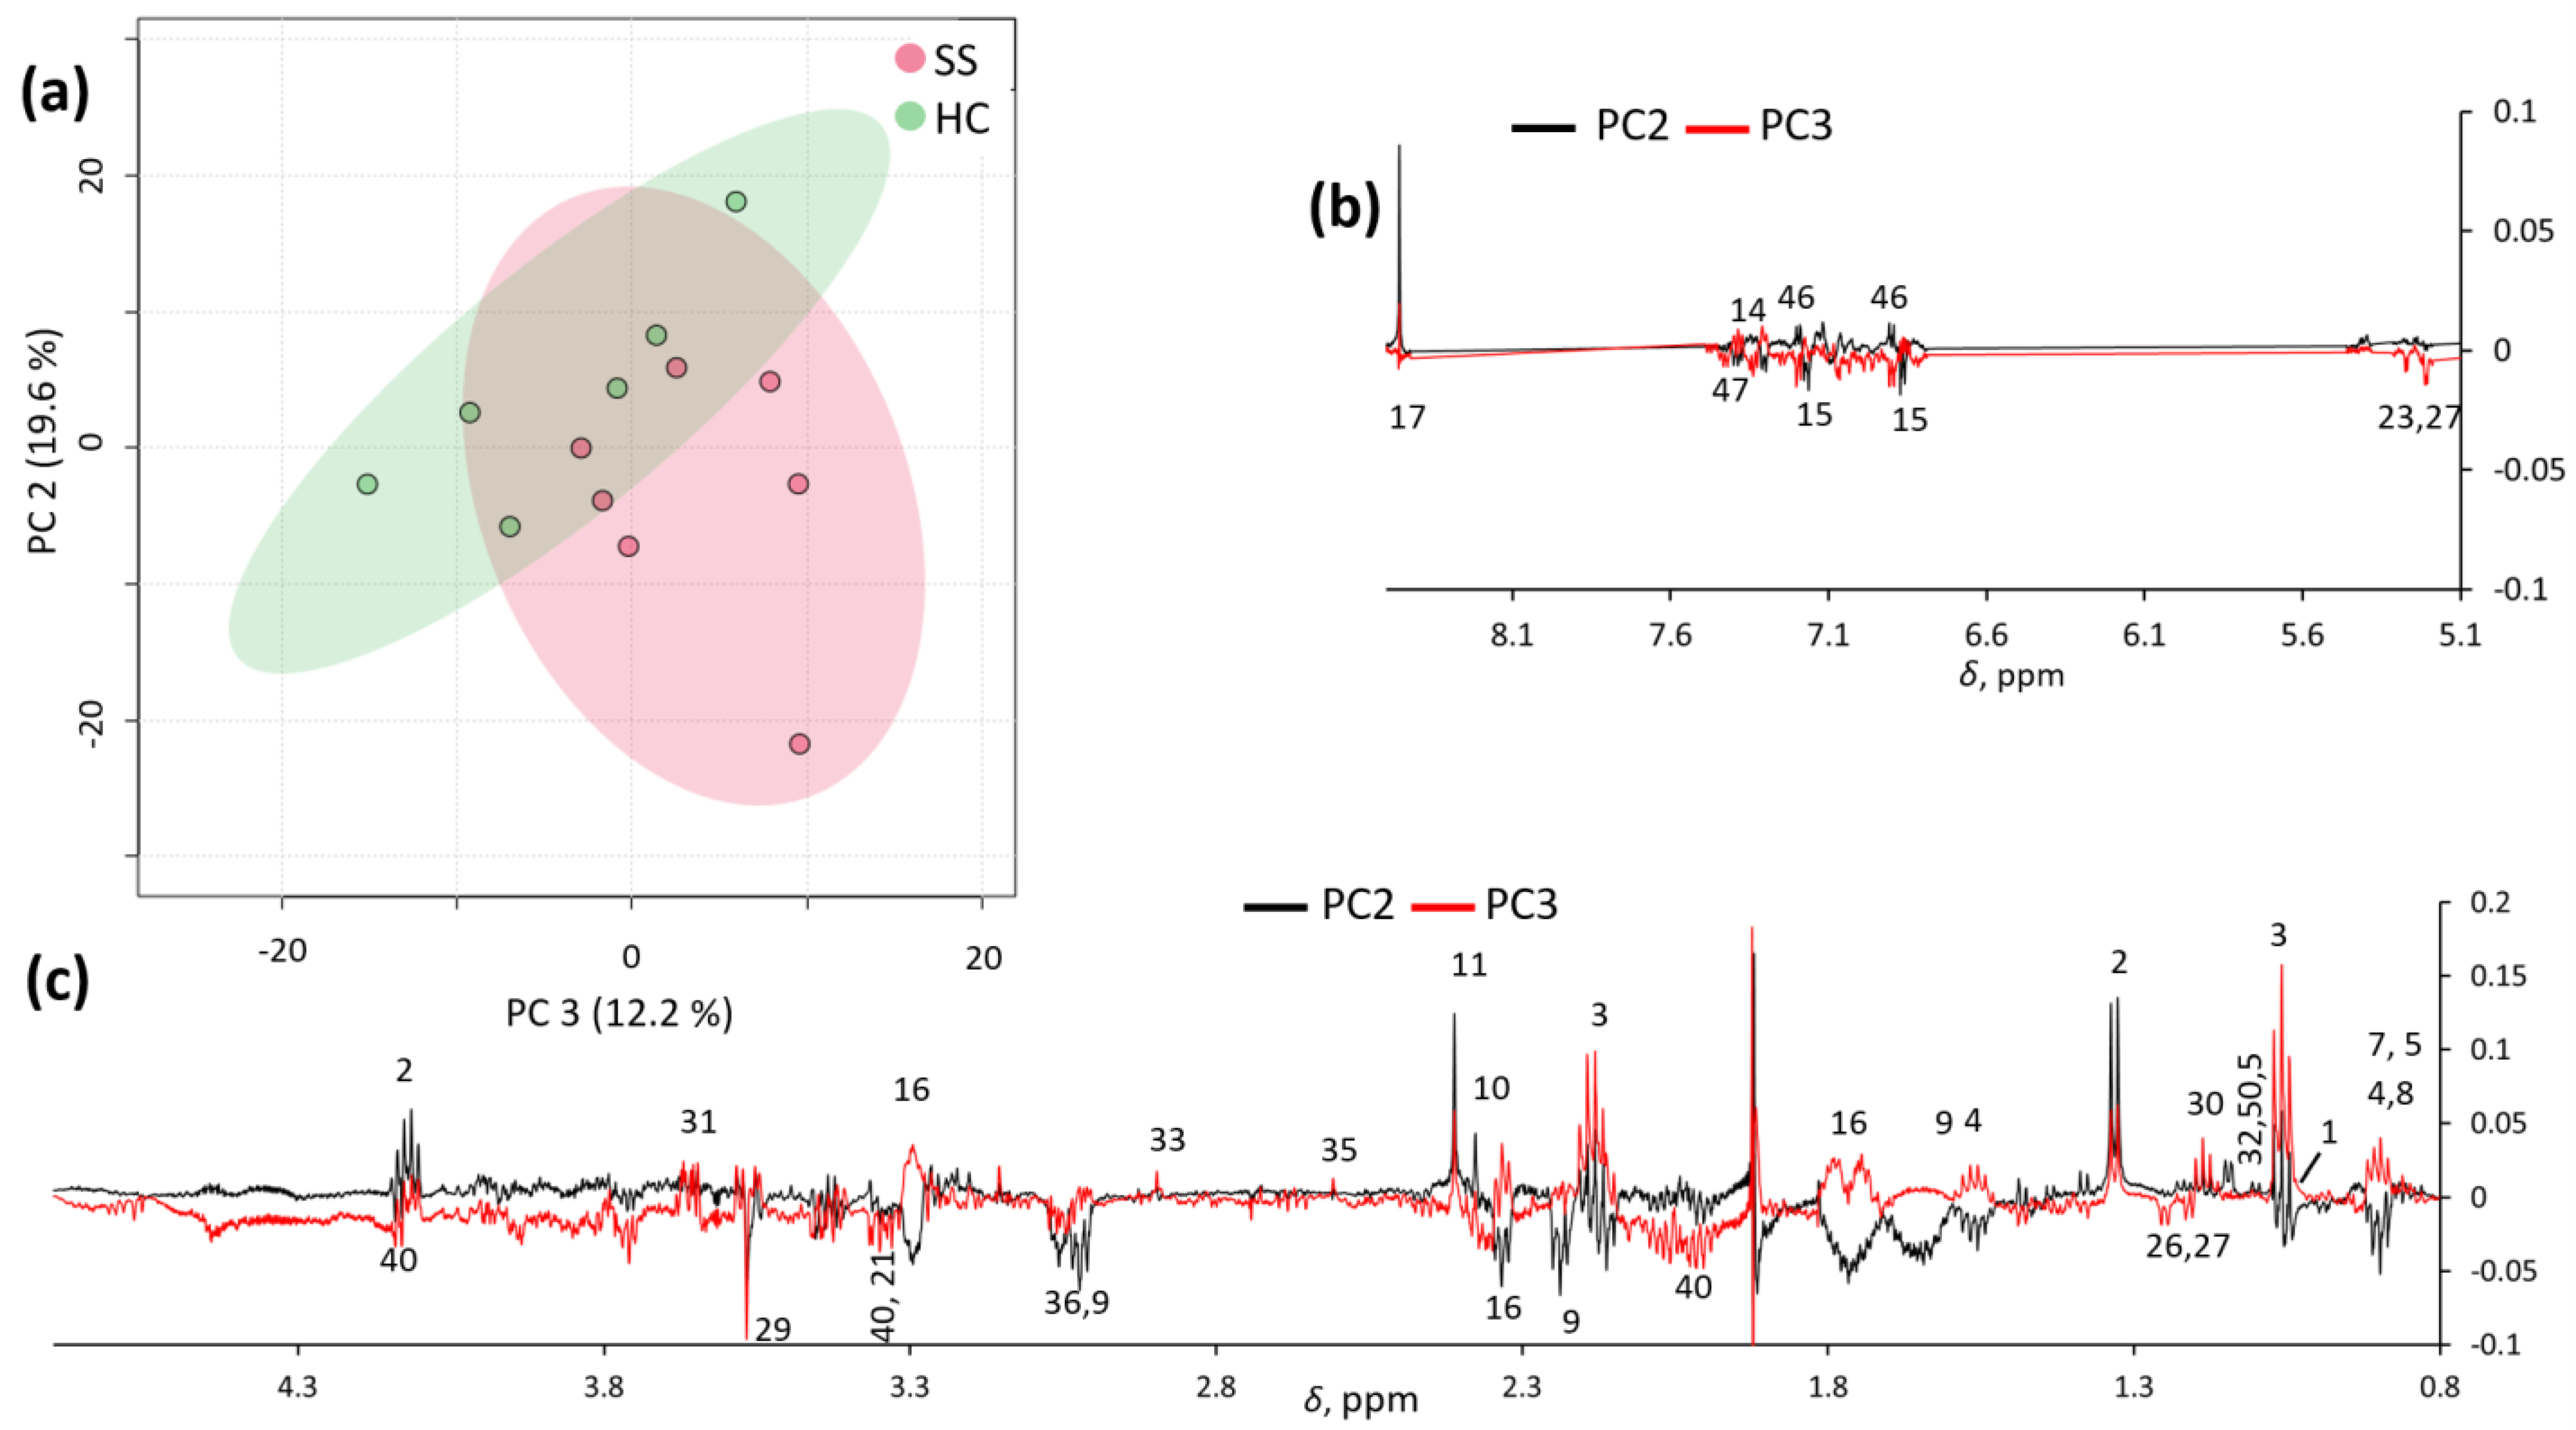
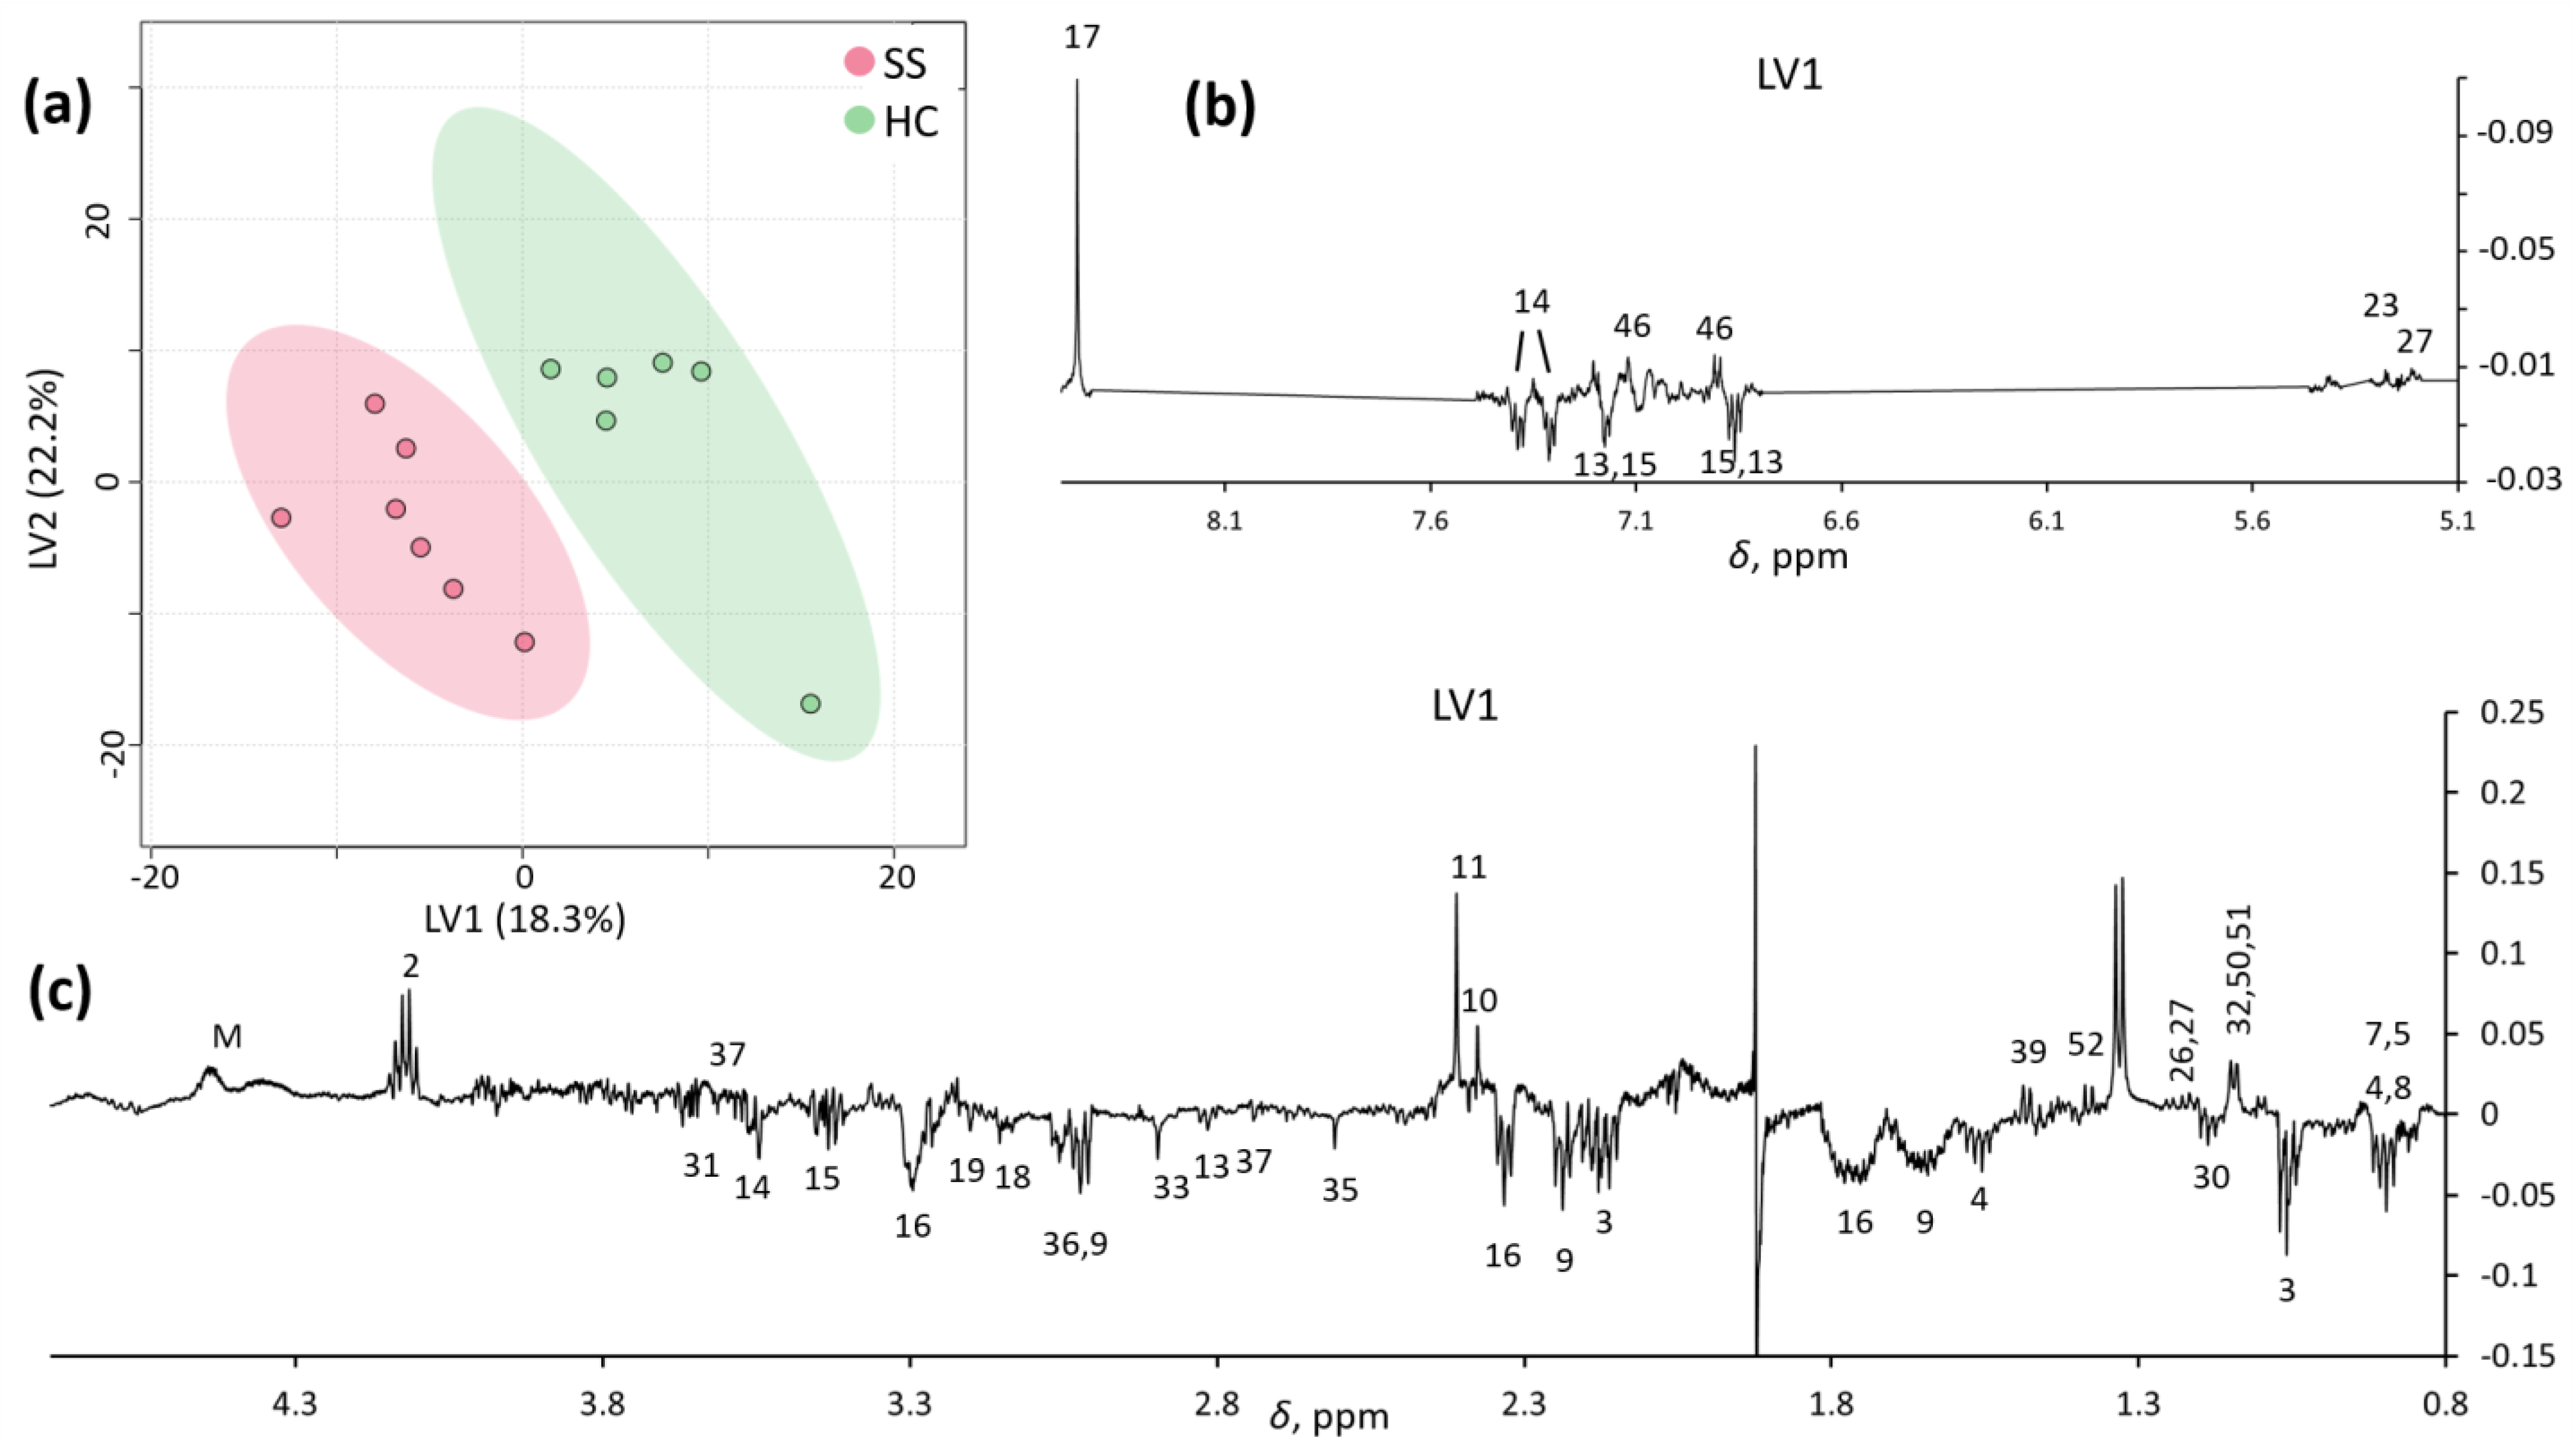
Multivariate statistical analysis was conducted on binned and normalized spectra (7706 final spectral points; see Section 2.4) to analyze the spectral profiles between 0.8 and 8.5 ppm, after Pareto scaling, using the MetaboAnalyst 5.0 program, a free web-based metabolomics data analysis software [28]. Both principal component analysis (PCA) and partial least-squares discriminant analysis (PLS-DA) were performed for class discrimination.
Deconvoluted areas of selected peaks from 1H CPMG HR-MAS NMR spectra were obtained with an automated controlled fitting routine implemented in MNova (Mestrelab; Metaboanalyst 4.0, XiaLab McGill). The paired two-sample Student’s t-test was applied to determine the mean difference between two sets. A p-value < 0.05 was considered statistically significant. Fold-change analysis was carried out on deconvoluted signals.

3. Results

Metabolomic and Statistical Analysis

The metabolomic analysis focused on 360 ms total echo 1D 1H NMR CPMG spectra. Metabolites detected with CPMG NMR spectra were assigned through 2D NMR spectra (COSY, TOCSY, and HSQC), and approximately 50 metabolites were detected and assigned (see Supplementary Table S1). 1H CPMG NMR spectra evidenced relevant variations in overall metabolite concentration among the saliva samples within each class, and both PCA and PLS-DA did not show any significant trend when applied to the row data with and without Pareto scaling. To overcome this problem, we compared the spectra after normalization with their total area, excluding the residual water signal. Visual comparison of the average pSS and HC 1H CPMG NMR spectra of the two classes (Figure 1) highlighted the metabolites that were more abundant in pSS samples (e.g., 4-hydroxyphenylacetic acid, phenylacetic acid, δ-valerolactam, taurine, choline, ethanolamine, trimethylamine, methylamine, 5-aminopentanoic acid, butyric acid, and other small organic acids) and in HC samples (e.g., formic acid, monosaccharides, macromolecules, proline, and lactic acid), although the t-test confirmed statistically significant differences (p < 0.05) only for methylamine (higher in SS), proline (higher in HCs), and residual signals from macromolecules between 4.2 and 4.5 ppm (higher in HCs). All other differences between the two classes can be considered only as trends.
Unsupervised exploratory PCA was also conducted on the spectra, and partial clustering was observed, especially in the PC2/PC3 score plot (Figure 2a). These two principal components explained 19.6% and 12.2% of the total variance, respectively. Inspection of the PC2 and PC3 loadings (Figure 2b) confirmed that pSS samples were characterized by a number of metabolites (as reported in Supplementary Table S1), which potentially allow for their discrimination from HC samples.
PLS-DA analysis improved the separation between SS and HCs in the first two latent variables, LV1 and LV2 (Figure 3a). The LV1 loading profile (Figure 3b,c) confirmed a pool of metabolites distinctly describing each group, most of which were the same as those obtained by PCA (Table 2).
Finally, a total of 30 metabolite signals, selected according to their low overlap with the neighboring signals, were deconvoluted from the 1D 1H-NMR CPMG NMR spectra and analyzed by PCA, PLS-DA, t-test, and fold-change analyses (Table 3). PCA and PLS-DA did not indicate any improvement with respect to the spectral analysis. Only methylamine was found to significantly differ (p < 0.05) between the two groups by the t-test, both when considering absolute signal areas (in analogy to the approach of Mikkonen et al.) and signal areas normalized with respect to the corresponding total spectral area (parallel to what we performed on spectra). The fold-change analysis was more straightforward and pointed to the subset of metabolites already evidenced by PCA and PLS-DA.

4. Discussion

Metabolomics has been successfully proposed to facilitate the characterization of pSS saliva compared with healthy controls (HCs); however, the limited number of published studies has led to a lack of evidence regarding the reliability of metabolomics as a diagnostic tool.
Different analytical approaches have been proposed, such as nuclear magnetic resonance (NMR) and mass spectrometry (MS). The wide application of MS technology is a consequence of its high sensitivity, which permits qualitative exploration of the salivary metabolome, even when collecting a limited number of samples. The sensitivity of MS allows for the detection of many metabolites (e.g., from 300+ to 1000+ if GC-MS or LC-MS is performed), the platform costs are cheap, and it is ideal for targeted metabolomics. However, the quantitative description of selected variables requires an additional platform.
Similar data acquisition can be obtained by NMR, which is less sensitive than MS, but the obtained data are simultaneously qualitative and quantitative. NMR data are more reproducible than MS data, the acquisition execution is faster, minimal sample preparation is required, and tissue or matrix extraction does not need to be performed. Therefore, the average cost per sample is cheaper for NMR than for MS.
Through untargeted 1H-NMR, Mikkonen et al. identified 24 metabolites in stimulated whole saliva, with significant variations of specific molecules between analysis groups. The concentration of choline and taurine was significantly higher (p < 0.001) in the pSS patients compared with that of the healthy controls. Moreover, alanine and glycine were significantly higher (p = 0.004, p = 0.007, respectively) in concentration in the pSS group. Butyrate (p = 0.034), phenylalanine (p = 0.026), and proline (p = 0.032) were only slightly higher in pSS saliva samples than in those of the controls. Notably, a strong relationship between the salivary flow change and two metabolites concentration emerged; amino-acids choline and taurine concentrations showed a significantly increase in cases with reduced salivation (p = 0.0001 and p = 0.0006 respectively) [19].
Herrala et al. detected 24 variables in salivary samples analyzed by NMR. A further investigation was conducted on 21 selected metabolites at different time points, making both an intra- and inter-individual comparison; based on previous results, the most significantly differing metabolites (pSS vs. HCs), such as choline, taurine, alanine, and glycine, were chosen for in-depth analysis. All the variables were able to distinguish the two groups almost at any time point [18].
Kageyama et al. analyzed the metabolite profiles of whole saliva from 14 pSS patients with GC-MS. Of the 88 metabolites identified, 41 were significantly decreased in pSS patients compared with HCs, most likely reflecting salivary gland damage; in particular, glycine, tyrosine, uric acid, and fucose contributed to the loss of biodiversity in the pSS versus HCs salivary samples [16].
Li Z. et al. performed UPLC-HRMS to identify 38 metabolites, mostly amino acids, with potential diagnostic value. Their results showed that phenylalanine, tyrosine, tryptophan, and proline pathways are upregulated in pSS patients [17].
Metabolomic analysis of our 1H CPMG NMR spectra indicated that the pSS group salivary metabolome was characterized by higher relative amounts of amines (methylamines, putrescine, and sarcosine), organic acids (mainly belonging to propanoic, butanoic, pentanoic, phenyl acetic, and phenylpropanoic series), and 5-aminopentanoic acid and its lactam (δ-valerolactam). The HC group, in contrast, was characterized by higher relative amounts of lactic, succinic, pyruvic, and formic acids, as well as amino acids.
Our results show a reduction in fucose and amino acids (e.g., glycine and tyrosine) in the saliva of pSS cases. These data are coherent with those of Kageyama et al., determined by GC-MS [16]. However, glycine concentration seems to have a countertrend when compared with NMR results of Mikkonen et al. and Herrala et al., which both report significantly increasing salivary concentration in pSS compared with HCs [18,19].
Our NMR results show that butyrate was higher in pSS patients than in HCs, but proline was higher in HCs than in pSS patients; thus, we partially agree with results of Mikkonen et al. that found butyrate was slightly elevated in the pSS population vs. HC, as well as the amino acid proline [19].
The higher concentration of proline in HC saliva is likely representative of normal salivary physiology, as reported by Meleti et al.; salivary mucins—a heterogeneous group of glycoproteins synthesized and secreted by the submandibular, sublingual, and minor salivary glands—contribute to the salivary concentration of proline. This amino acid was found to be one of the most concentrated in unstimulated whole saliva of healthy subjects [11]. Especially, the proline-rich proteins (PRPs) are a huge family of salivary proteins produced by major glands, representing nearly 70% of the total protein in human saliva [29]. Proline accounts for about 25–40% of the amino acid content of PRPs [30], which are encoded by six genes [31].
Methylamine is a monoalkylamine that occurs endogenously from amine catabolism. Its tissue levels are altered under some pathological conditions, including diabetes and inflammatory bowel diseases [32]. The statistically significant concentration of methylamine in the salivary samples of the pSS group (p < 0.05) can be linked to bacterial metabolism. It can be speculated that alteration of the salivary qualitative composition affects its buffer potential and the capability of the fluid to interact with microbial populations.
The serological status of pSS patients was positive for anti-SSA/Ro in five cases out of seven (SJ02, SJ03, SJ05, SJ06, and SJ07). Both SJ01 and SJ04 tested negative for anti-SSA/Ro but positive for RF (SJ01) and ANA (SJ04). In addition, these cases were diagnosed with pSS according to symptoms, clinical testing, and histopathology. Despite the reported symptoms of xerostomia in six out of seven pSS patients, the salivary flow rate test was positive for hyposalivation in only two cases [9]. In such patients, one with gland hypofunction did not report xerostomia as a symptom. A possible explanation for this finding may reside in the test interpretation itself. Even if ACR/EULAR guidelines set the test limit to <0.1 mL/min and this value is considered for disease management and therapy administration [33], recently published reviews have suggested an adjustment of the threshold for hyposalivation, modifying the cutoff to <0.2 mL/min to better fit the population over 60 years of age, thus increasing the sensitivity and specificity of the pSS diagnosis [34,35].
The main limitation of this preliminary study was the small sample size, allowing for limited statistical interpretation. A wider population will be required to observe better separation of groups in the PCA analysis. Nevertheless, only PLS-DA can provide good insight. Moreover, in this preliminary phase, no clustering was obtained when deconvolution was attempted. Another pitfall of this study was the assessment of oral hygienical status prior to salivary collection. Considering the oral cavity is an “open” environment, whole saliva composition is affected by the presence of bacteria [36]. It is worth mentioning that we found a change in the concentration of three metabolites of bacterial origin (acetate, propionate, and trimethylamine) in pSS compared with HC saliva. We interpreted the presence of these metabolites as an indication of microbial contamination due to plaque, as has been reported by Aimetti et al. [37,38] and Chen et al. [39] Furthermore, emerging results have indicated that acetate, propionate, trimethylamine, and butyrate are increased in the NMR salivary metabolome of chronic periodontitis patients [37], as well as under severe gingivitis conditions [40].
Notwithstanding such limitations, the presented preliminary data are promising.
We were able to distinguish the pSS group from the control group, and these results confirmed that 1H NMR spectroscopy-based salivary metabolomics is appropriate for screening and monitoring pSS. Stronger evidence and further experiments are required to consolidate the diagnostic and prognostic potential of salivary metabolomics with respect to Sjögren’s syndrome.

Supplementary Materials

The following supporting information can be downloaded at: https://www.mdpi.com/article/10.3390/metabo13030348/s1, Table S1: 1H NMR chemical shift assignments of the metabolites detected in saliva.

Author Contributions

Conceptualization, G.S. (Giacomo Setti), V.R. and C.M.; data curation, A.M. and G.S. (Gilda Sandri); formal analysis, A.M. and A.G.; investigation, V.R., L.P., G.B., E.T. and G.S. (Gilda Sandri); methodology, G.S. (Giacomo Setti), V.R. and G.B.; writing—original draft, G.S. (Giacomo Setti), V.R. and A.M.; writing—review & editing, G.S. (Giacomo Setti), V.R., A.M., U.C., L.G., C.M., M.M., G.S. (Gilda Sandri) and P.B. All authors have read and agreed to the published version of the manuscript.

Funding

This research received no external funding.

Institutional Review Board Statement

This study was conducted in accordance with the Declaration of Helsinki and approved by Ethics Committee Area Vasta Nord (AVEN), Section of Modena, 1183/2018/SPER/AOUMO.

Informed Consent Statement

Informed consent was obtained from all subjects involved in the study.

Data Availability Statement

No new data were generated.

Conflicts of Interest

The authors declare no conflict of interest.

References

  1. Chevet, B.; Chiche, L.Y.; Devauchelle-Pensec, V.; Cornec, D.Y.K. How rare is primary Sjogren’s syndrome? Jt. Bone Spine 2023, 90, 105480. [Google Scholar] [CrossRef]
  2. Ebert, E.C. Gastrointestinal and hepatic manifestations of Sjogren syndrome. J. Clin. Gastroenterol. 2012, 46, 25–30. [Google Scholar] [CrossRef] [PubMed]
  3. Konttinen, Y.T.; Kasna-Ronkainen, L. Sjögren’s syndrome: Viewpoint on pathogenesis. Scand. J. Rheumatol. 2002, 31, 15–27. [Google Scholar] [CrossRef]
  4. Parisis, D.; Chivasso, C.; Perret, J.; Soyfoo, M.S.; Delporte, C. Current State of Knowledge on Primary Sjogren’s Syndrome, an Autoimmune Exocrinopathy. J. Clin. Med. 2020, 9, 2299. [Google Scholar] [CrossRef] [PubMed]
  5. Haldorsen, K.; Moen, K.; Jacobsen, H.; Jonsson, R.; Brun, J.G. Exocrine function in primary Sjogren syndrome: Natural course and prognostic factors. Ann. Rheum. Dis. 2008, 67, 949–954. [Google Scholar] [CrossRef] [PubMed]
  6. Singh, A.G.; Singh, S.; Matteson, E.L. Rate, risk factors and causes of mortality in patients with Sjogren’s syndrome: A systematic review and meta-analysis of cohort studies. Rheumatology 2016, 55, 450–460. [Google Scholar] [CrossRef]
  7. Ramirez Sepulveda, J.I.; Kvarnstrom, M.; Eriksson, P.; Mandl, T.; Norheim, K.B.; Johnsen, S.J.; Hammenfors, D.; Jonsson, M.V.; Skarstein, K.; Brun, J.G.; et al. Long-term follow-up in primary Sjogren’s syndrome reveals differences in clinical presentation between female and male patients. Biol. Sex Differ. 2017, 8, 25. [Google Scholar] [CrossRef]
  8. Jonsson, R.; Brokstad, K.A.; Jonsson, M.V.; Delaleu, N.; Skarstein, K. Current concepts on Sjogren’s syndrome—Classification criteria and biomarkers. Eur. J. Oral Sci. 2018, 126 (Suppl. 1), 37–48. [Google Scholar] [CrossRef]
  9. Shiboski, C.H.; Shiboski, S.C.; Seror, R.; Criswell, L.A.; Labetoulle, M.; Lietman, T.M.; Rasmussen, A.; Scofield, H.; Vitali, C.; Bowman, S.J.; et al. 2016 American College of Rheumatology/European League Against Rheumatism classification criteria for primary Sjogren’s syndrome: A consensus and data-driven methodology involving three international patient cohorts. Ann. Rheum. Dis. 2017, 76, 9–16. [Google Scholar] [CrossRef]
  10. de Almeida Pdel, V.; Gregio, A.M.; Machado, M.A.; de Lima, A.A.; Azevedo, L.R. Saliva composition and functions: A comprehensive review. J. Contemp. Dent. Pract. 2008, 9, 72–80. [Google Scholar] [PubMed]
  11. Meleti, M.; Quartieri, E.; Antonelli, R.; Pezzi, M.E.; Ghezzi, B.; Viani, M.V.; Setti, G.; Casali, E.; Ferrari, E.; Ciociola, T.; et al. Metabolic Profiles of Whole, Parotid and Submandibular/Sublingual Saliva. Metabolites 2020, 10, 318. [Google Scholar] [CrossRef]
  12. Setti, G.; Pezzi, M.E.; Viani, M.V.; Pertinhez, T.A.; Cassi, D.; Magnoni, C.; Bellini, P.; Musolino, A.; Vescovi, P.; Meleti, M. Salivary MicroRNA for Diagnosis of Cancer and Systemic Diseases: A Systematic Review. Int. J. Mol. Sci. 2020, 21, 907. [Google Scholar] [CrossRef]
  13. Meleti, M.; Cassi, D.; Vescovi, P.; Setti, G.; Pertinhez, T.A.; Pezzi, M.E. Salivary biomarkers for diagnosis of systemic diseases and malignant tumors. A systematic review. Med. Oral Patol. Oral Cir. Bucal 2020, 25, e299–e310. [Google Scholar] [CrossRef] [PubMed]
  14. Baldini, C.; Giusti, L.; Ciregia, F.; Da Valle, Y.; Giacomelli, C.; Donadio, E.; Sernissi, F.; Bazzichi, L.; Giannaccini, G.; Bombardieri, S.; et al. Proteomic analysis of saliva: A unique tool to distinguish primary Sjogren’s syndrome from secondary Sjogren’s syndrome and other sicca syndromes. Arthritis Res. Ther. 2011, 13, R194. [Google Scholar] [CrossRef]
  15. Hu, S.; Wang, J.; Meijer, J.; Ieong, S.; Xie, Y.; Yu, T.; Zhou, H.; Henry, S.; Vissink, A.; Pijpe, J.; et al. Salivary proteomic and genomic biomarkers for primary Sjogren’s syndrome. Arthritis Rheum. 2007, 56, 3588–3600. [Google Scholar] [CrossRef] [PubMed]
  16. Kageyama, G.; Saegusa, J.; Irino, Y.; Tanaka, S.; Tsuda, K.; Takahashi, S.; Sendo, S.; Morinobu, A. Metabolomics analysis of saliva from patients with primary Sjogren’s syndrome. Clin. Exp. Immunol. 2015, 182, 149–153. [Google Scholar] [CrossRef] [PubMed]
  17. Li, Z.; Mu, Y.; Guo, C.; You, X.; Liu, X.; Li, Q.; Sun, W. Analysis of the saliva metabolic signature in patients with primary Sjogren’s syndrome. PLoS ONE 2022, 17, e0269275. [Google Scholar] [CrossRef] [PubMed]
  18. Herrala, M.; Mikkonen, J.J.W.; Pesonen, P.; Lappalainen, R.; Tjaderhane, L.; Niemela, R.K.; Seitsalo, H.; Salo, T.; Myllymaa, S.; Kullaa, A.M. Variability of salivary metabolite levels in patients with Sjogren’s syndrome. J. Oral Sci. 2020, 63, 22–26. [Google Scholar] [CrossRef]
  19. Mikkonen, J.J.W. Metabolic Profiling of Saliva in Patients with Primary Sjögren’s syndrome. Metabolomics 2012, 3, 128. [Google Scholar] [CrossRef]
  20. Dame, Z.T.; Aziat, F.; Mandal, R.; Krishnamurthy, R.; Bouatra, S.; Borzouie, S.; Guo, A.C.; Sajed, T.; Deng, L.; Lin, H.; et al. The human saliva metabolome. Metabolomics 2015, 11, 1864–1883. [Google Scholar] [CrossRef]
  21. Emwas, A.H.; Roy, R.; McKay, R.T.; Tenori, L.; Saccenti, E.; Gowda, G.A.N.; Raftery, D.; Alahmari, F.; Jaremko, L.; Jaremko, M.; et al. NMR Spectroscopy for Metabolomics Research. Metabolites 2019, 9, 123. [Google Scholar] [CrossRef]
  22. Schenetti, L.; Mucci, A.; Parenti, F.; Cagnoli, R.; Righi, V.; Tosi, M.R.; Tugnoli, V. HR-MAS NMR spectroscopy in the characterization of human tissues: Application to healthy gastric mucosa. Concepts Magn. Reson. Part A 2006, 28A, 430–443. [Google Scholar] [CrossRef]
  23. Daniels, T.E.; Cox, D.; Shiboski, C.H.; Schiodt, M.; Wu, A.; Lanfranchi, H.; Umehara, H.; Zhao, Y.; Challacombe, S.; Lam, M.Y.; et al. Associations between salivary gland histopathologic diagnoses and phenotypic features of Sjogren’s syndrome among 1726 registry participants. Arthritis Rheum. 2011, 63, 2021–2030. [Google Scholar] [CrossRef] [PubMed]
  24. Scully, C. Chapter 8—Dry mouth (xerostomia and hyposalivation). In Oral and Maxillofacial Medicine, 3rd ed.; Scully, C., Ed.; Churchill Livingstone: London, UK, 2013; pp. 91–97. [Google Scholar]
  25. Navazesh, M. Methods for collecting saliva. Ann. N. Y. Acad. Sci. 1993, 694, 72–77. [Google Scholar] [CrossRef]
  26. Gardner, A.; Parkes, H.G.; Carpenter, G.H.; So, P.W. Developing and Standardizing a Protocol for Quantitative Proton Nuclear Magnetic Resonance ((1)H NMR) Spectroscopy of Saliva. J. Proteome Res. 2018, 17, 1521–1531. [Google Scholar] [CrossRef] [PubMed]
  27. Righi, V.; Reggiani, C.; Tarentini, E.; Mucci, A.; Paganelli, A.; Cesinaro, A.M.; Mataca, E.; Kaleci, S.; Ferrari, B.; Meleti, M.; et al. Metabolomic Analysis of Actinic Keratosis and SCC Suggests a Grade-Independent Model of Squamous Cancerization. Cancers 2021, 13, 5560. [Google Scholar] [CrossRef]
  28. Chong, J.; Soufan, O.; Li, C.; Caraus, I.; Li, S.; Bourque, G.; Wishart, D.S.; Xia, J. MetaboAnalyst 4.0: Towards more transparent and integrative metabolomics analysis. Nucleic Acids. Res. 2018, 46, W486–W494. [Google Scholar] [CrossRef]
  29. Hajishengallis, G.; Russell, M.W. Chapter 15—Innate Humoral Defense Factors. In Mucosal Immunology, 4th ed.; Mestecky, J., Strober, W., Russell, M.W., Kelsall, B.L., Cheroutre, H., Lambrecht, B.N., Eds.; Academic Press: Boston, FL, USA, 2015; pp. 251–270. [Google Scholar]
  30. Bennick, A. Salivary proline-rich proteins. Mol. Cell. Biochem. 1982, 45, 83–99. [Google Scholar] [CrossRef]
  31. Azen, E.A.; Maeda, N. Molecular genetics of human salivary proteins and their polymorphisms. Adv. Hum. Genet. 1988, 17, 141–199. [Google Scholar] [CrossRef]
  32. Marchesi, J.R.; Holmes, E.; Khan, F.; Kochhar, S.; Scanlan, P.; Shanahan, F.; Wilson, I.D.; Wang, Y. Rapid and noninvasive metabonomic characterization of inflammatory bowel disease. J. Proteome Res. 2007, 6, 546–551. [Google Scholar] [CrossRef]
  33. Ramos-Casals, M.; Brito-Zeron, P.; Bombardieri, S.; Bootsma, H.; De Vita, S.; Dorner, T.; Fisher, B.A.; Gottenberg, J.E.; Hernandez-Molina, G.; Kocher, A.; et al. EULAR recommendations for the management of Sjogren’s syndrome with topical and systemic therapies. Ann. Rheum. Dis. 2020, 79, 3–18. [Google Scholar] [CrossRef]
  34. Lacombe, V.; Lacout, C.; Lozac’h, P.; Ghali, A.; Gury, A.; Lavigne, C.; Urbanski, G. Unstimulated whole saliva flow for diagnosis of primary Sjogren’s syndrome: Time to revisit the threshold? Arthritis Res. Ther. 2020, 22, 38. [Google Scholar] [CrossRef]
  35. Martinez-Ceballos, M.A.; Aguilera, N.; Garzon-Gonzalez, K.C.; Cajamarca-Baron, J.; Alzate-Granados, J.P.; Rojas-Villarraga, A. Unstimulated whole salivary flow in Sjogren’s Syndrome: Systematic literature review and meta-analysis. Adv. Rheumatol. 2021, 61, 8. [Google Scholar] [CrossRef] [PubMed]
  36. Lindon, J.C.; Nicholson, J.K.; Holmes, E.; Everett, J.R. Metabonomics: Metabolic processes studied by NMR spectroscopy of biofluids. Concepts Magn. Reson. 2000, 12, 289–320. [Google Scholar] [CrossRef]
  37. Aimetti, M.; Cacciatore, S.; Graziano, A.; Tenori, L. Metabonomic analysis of saliva reveals generalized chronic periodontitis signature. Metabolomics 2011, 8, 465–474. [Google Scholar] [CrossRef]
  38. Citterio, F.; Romano, F.; Meoni, G.; Iaderosa, G.; Grossi, S.; Sobrero, A.; Dego, F.; Corana, M.; Berta, G.N.; Tenori, L.; et al. Changes in the Salivary Metabolic Profile of Generalized Periodontitis Patients after Non-surgical Periodontal Therapy: A Metabolomic Analysis Using Nuclear Magnetic Resonance Spectroscopy. J. Clin. Med. 2020, 9, 3977. [Google Scholar] [CrossRef] [PubMed]
  39. Chen, Z.; Feng, S.; Pow, E.H.; Lam, O.L.; Mai, S.; Wang, H. Organic anion composition of human whole saliva as determined by ion chromatography. Clin. Chim. Acta. 2015, 438, 231–235. [Google Scholar] [CrossRef] [PubMed]
  40. Klukowska, M.; Goyal, C.R.; Khambe, D.; Cannon, M.; Miner, M.; Gurich, N.; Circello, B.; Huggins, T.; Barker, M.L.; Furnish, C.; et al. Response of chronic gingivitis to hygiene therapy and experimental gingivitis. Clinical, microbiological and metabonomic changes. Am. J. Dent. 2015, 28, 273–284. [Google Scholar]
Figure 1. Five enlarged regions of the mean pSS (continuous red line) and mean HC (continuous blue line). 1H CPMG NMR spectra (±standard deviations, dotted lined; red and blue for pSS and HCs, respectively). M indicates macromolecules.
Metabolites 13 00348 g001
Figure 2. PC2/PC3 score plot (a) and loading profiles (b,c) obtained by PCA on spectra.
Metabolites 13 00348 g002
Figure 3. LV1/LV2 score plot (a) and loading profiles (b,c) obtained by PLS-DA on spectra.
Metabolites 13 00348 g003
Table 1. Histological, serological, and clinical characterization of enrolled patients.
PatientHistological Assessment before StandardizationFocus Score Following Slides Review [23]AntibodiesUnstimulated SFR Test for
Hyposalivation
Schirmer TestReported Symptoms
SJ011 focus1, severeanti-SSA−
anti-SSB−
ANA−
RF+
negativenegativexerophthalmia, xerostomia
SJ02grade 13, severeanti-SSA+
anti-SSB−
ANA−
RF−
negativenegativexerophthalmia, xerostomia
SJ03focus score 1+5, severeanti-SSA+
anti-SSB−
ANA−
RF−
positivepositivexerophthalmia, xerostomia
SJ047 clusters, grade 2+5, severeanti-SSA−
anti-SSB−
ANA+
RF−
negativenegativexerophthalmia, xerostomia
SJ05focus score > 1, grade 45, severeanti-SSA+
anti-SSB−
ANA−
RF−
negativenegativexerophthalmia, xerostomia
SJ06grade 11, severeanti-SSA+
anti-SSB−
ANA+
RF−
negativenegativexerophthalmia,
xerostomia
SJ071 focus1, severeanti-SSA+
anti-SSB+
ANA−
RF−
positivepositiveNR
ANA, antinuclear antibodies; RF, rheumatoid factor; NR, not reported.
Table 2. Most significant metabolites in each group (red, pSS; green, HCs) obtained by PCA and PLS-DA from 1H-NMR CPMG NMR spectra.
PCAPLS-DA
Sjögren’s SyndromeHealthy ControlsSjögren’s SyndromeHealthy Controls
2-methylbutanoic acidlactic acid2-methylbutanoic acidlactic acid
4-methylpentanoic acidsuccinic acid4-methylpentanoic acidsuccinic acid
3-methylbutanoic acidpyruvic acid3-methylbutanoic acidpyruvic acid
2-methylpropionicacidformic acid2-methylpropionicacidformic acid
butanoic acidpropylene glycol or unknown 50/51butanoic acidpropylene glycol or unknown 50/51
propanoic acidfucosepropanoic acidfucose
ethanolgalactoseethanolgalactose
glycerolprolineglyceroltyrosine
5-aminopentanoic cglycine5-aminopentanoic calanine
δ-valerolactamtaurineδ-valerolactamunknown 52
ethanolaminephenylalaninecholine
methylamines ethanolamine
putrescine methylamines
phenylacetic acid putrescine
4-hydroxyphenylacetic acid sarcosine
phenylacetic acid
4-hydroxyphenylacetic acid
phloretic acid
Table 3. Results of t-test (p value) and fold-change (FC SS/HC) analyses of deconvoluted signals of SS and HC samples. Metabolites highlighted in red were higher in pSS, those in green were higher in HCs.
MetaboliteDeconvoluted Signal (ppm)p-Value *FC *p-Value $FC $
2-methylbutanoic acid0.860.122.90.072.3
4-methylpentanoic acid0.880.232.00.312.0
butanoic acid0.900.292.20.101.5
3-methylbutanoic acid0.910.212.50.092.0
1.15 ppm1.150.240.50.050.5
ethanol1.190.141.50.431.3
fucose1.250.590.90.260.7
lactic acid1.330.420.40.390.5
alanine1.480.710.90.280.8
acetic acid1.920.661.20.261.1
propanoic acid2.190.881.10.561.1
5-aminopentanoic acid2.240.371.90.231.3
δ-valerolactam2.330.383.20.241.8
pyruvic acid2.380.340.50.330.7
succinic acid2.410.380.30.350.5
methylamine2.610.012.30.052.3
dimethylamine2.730.901.01.001.0
sarcosine2.740.961.00.981.0
trimethylamine2.900.083.00.132.7
ethanolamine3.150.730.90.581.2
unknown 533.160.352.00.411.4
taurine3.260.351.40.151.3
proline3.340.560.70.070.5
phenylacetic acid3.540.422.40.351.6
glycine3.560.721.30.670.8
phloretic acid6.850.144.00.073.1
4-hydroxyphenylacetic acid6.870.651.40.851.1
tyrosine6.900.670.80.640.9
phenylalanine7.420.641.20.381.3
formate8.460.570.60.470.6
* Absolute areas of the signals. $ Areas of the signals normalized with respect to the total spectral areas.
Disclaimer/Publisher’s Note: The statements, opinions and data contained in all publications are solely those of the individual author(s) and contributor(s) and not of MDPI and/or the editor(s). MDPI and/or the editor(s) disclaim responsibility for any injury to people or property resulting from any ideas, methods, instructions or products referred to in the content.

