
Cycloguanil and Analogues Potently Target DHFR in Cancer Cells to Elicit Anti-Cancer Activity
 , , , , and
Abstract
:1. Introduction
2. Materials and Methods
2.1. Cell Culture
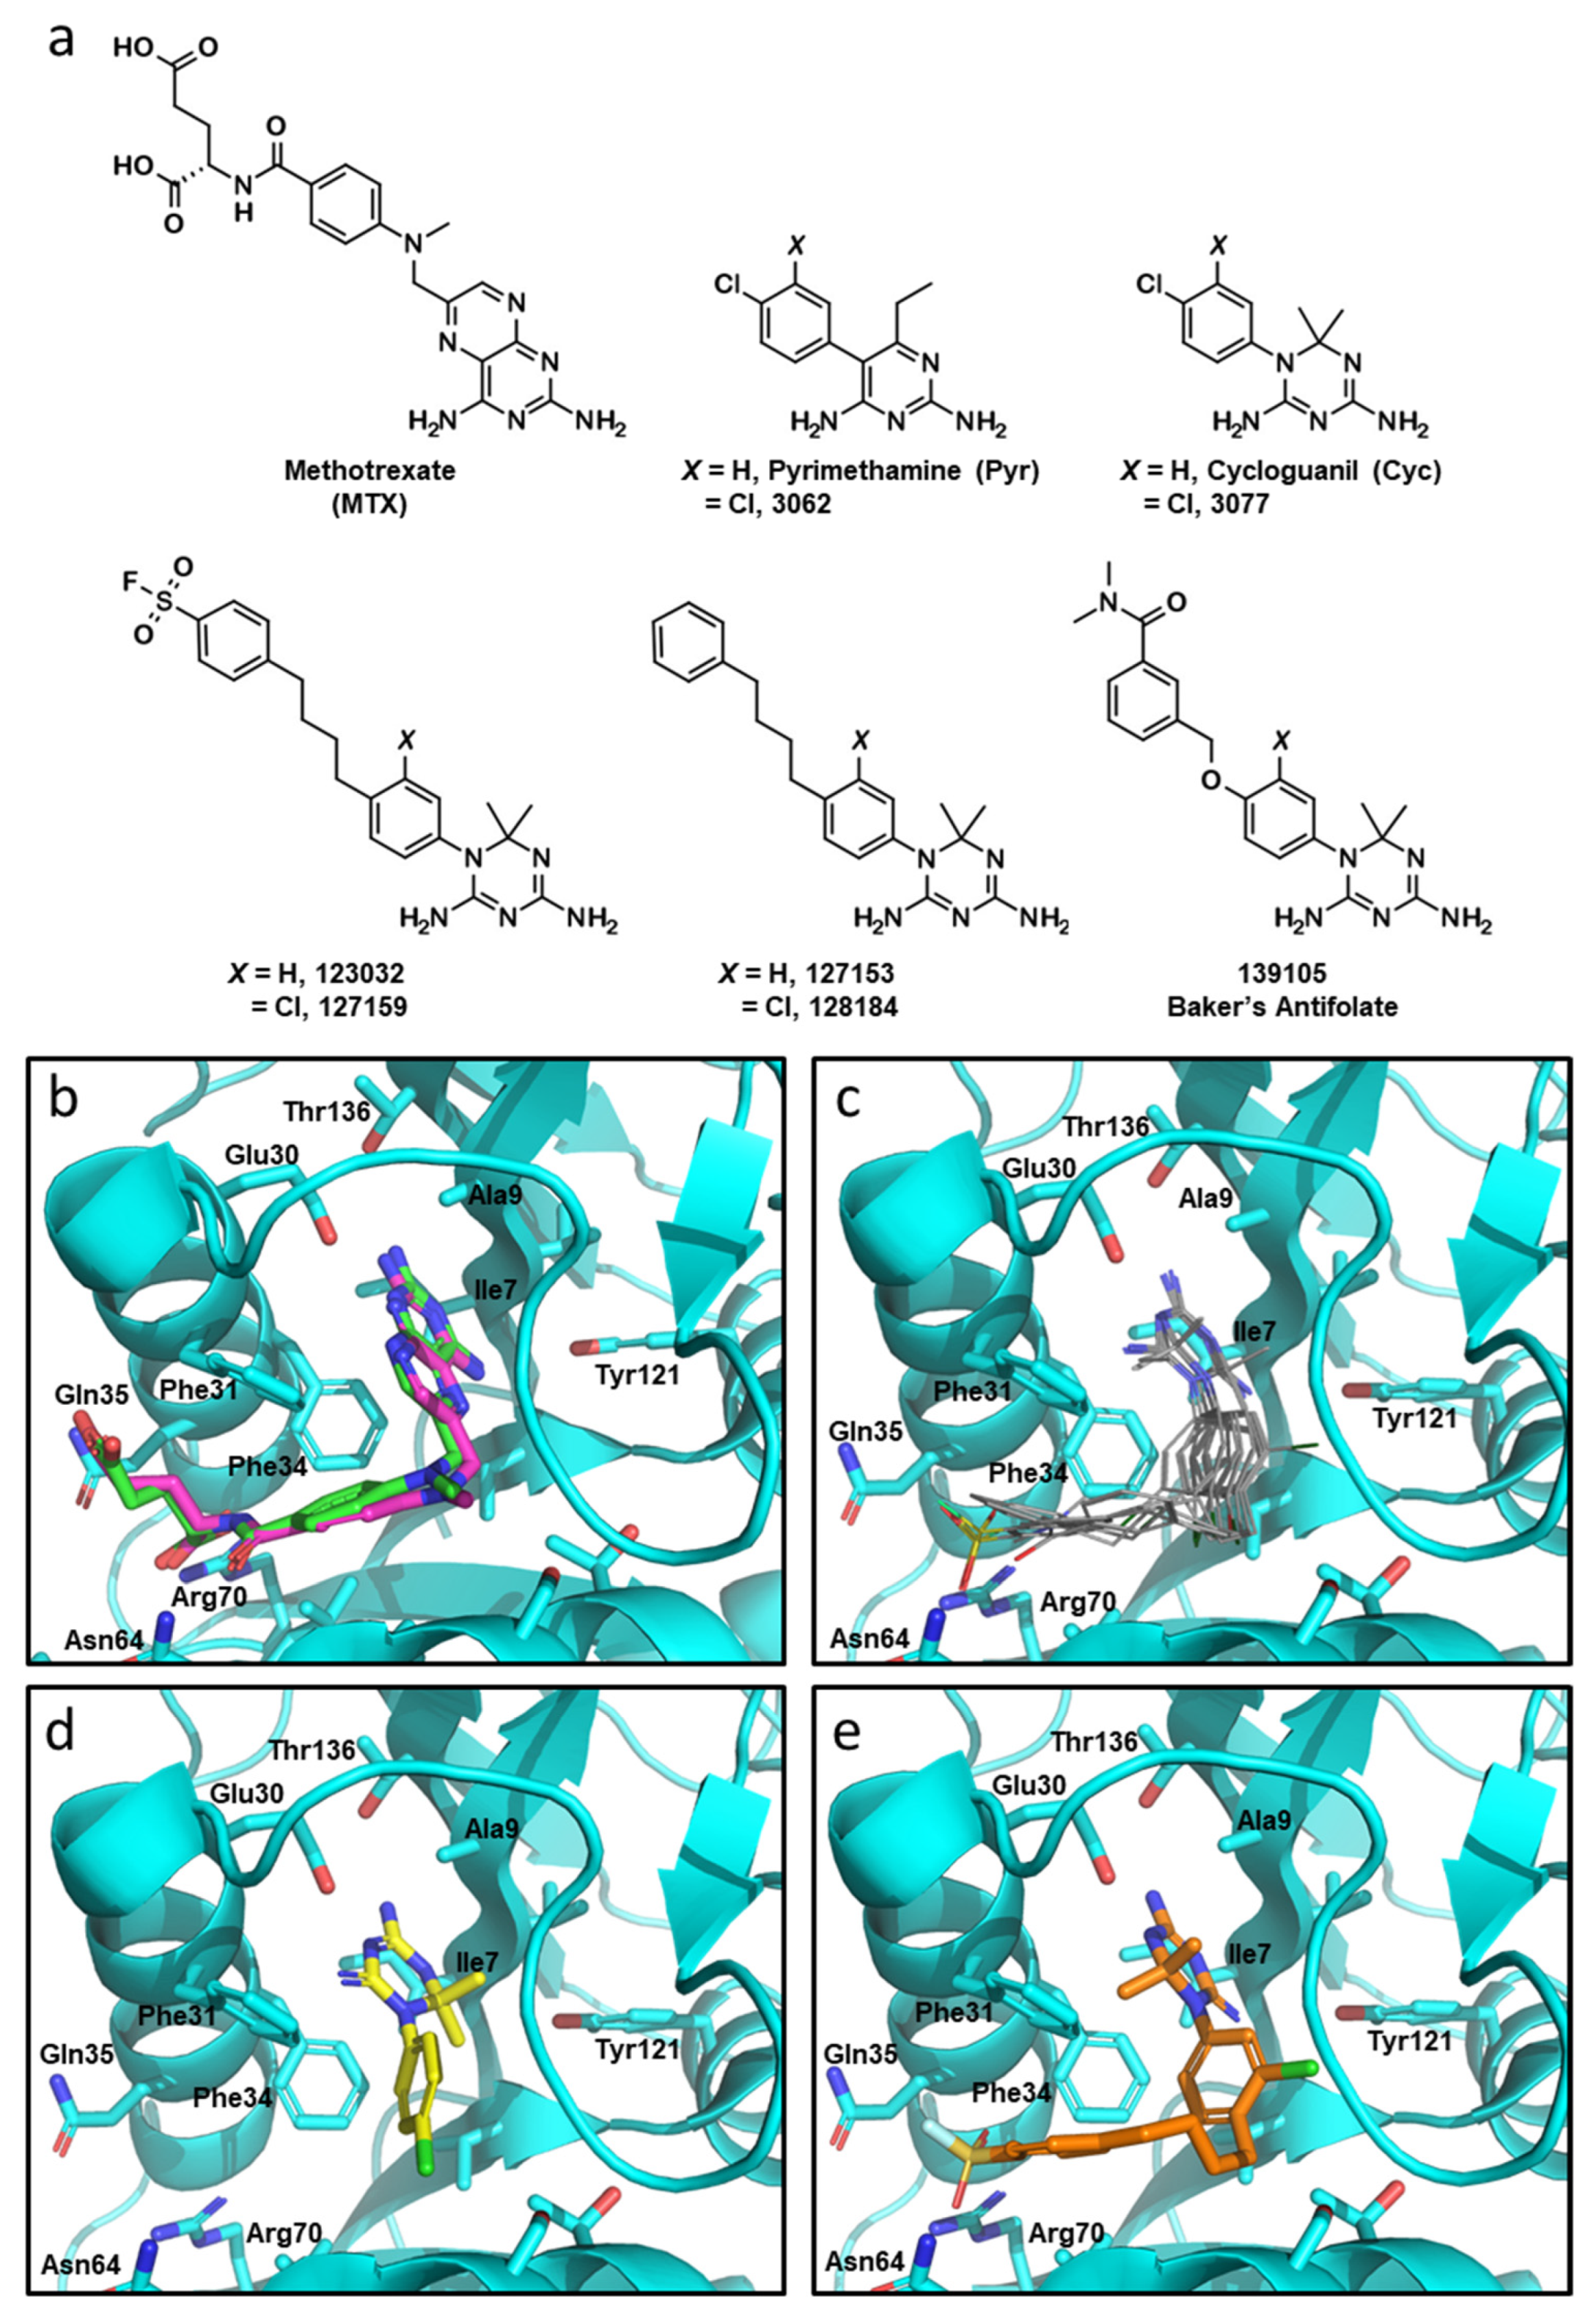
2.2. Compounds
2.3. Docking
2.4. Expression and Purification of Human DHFR
2.5. DHFR Enzymatic Inhibition Assay
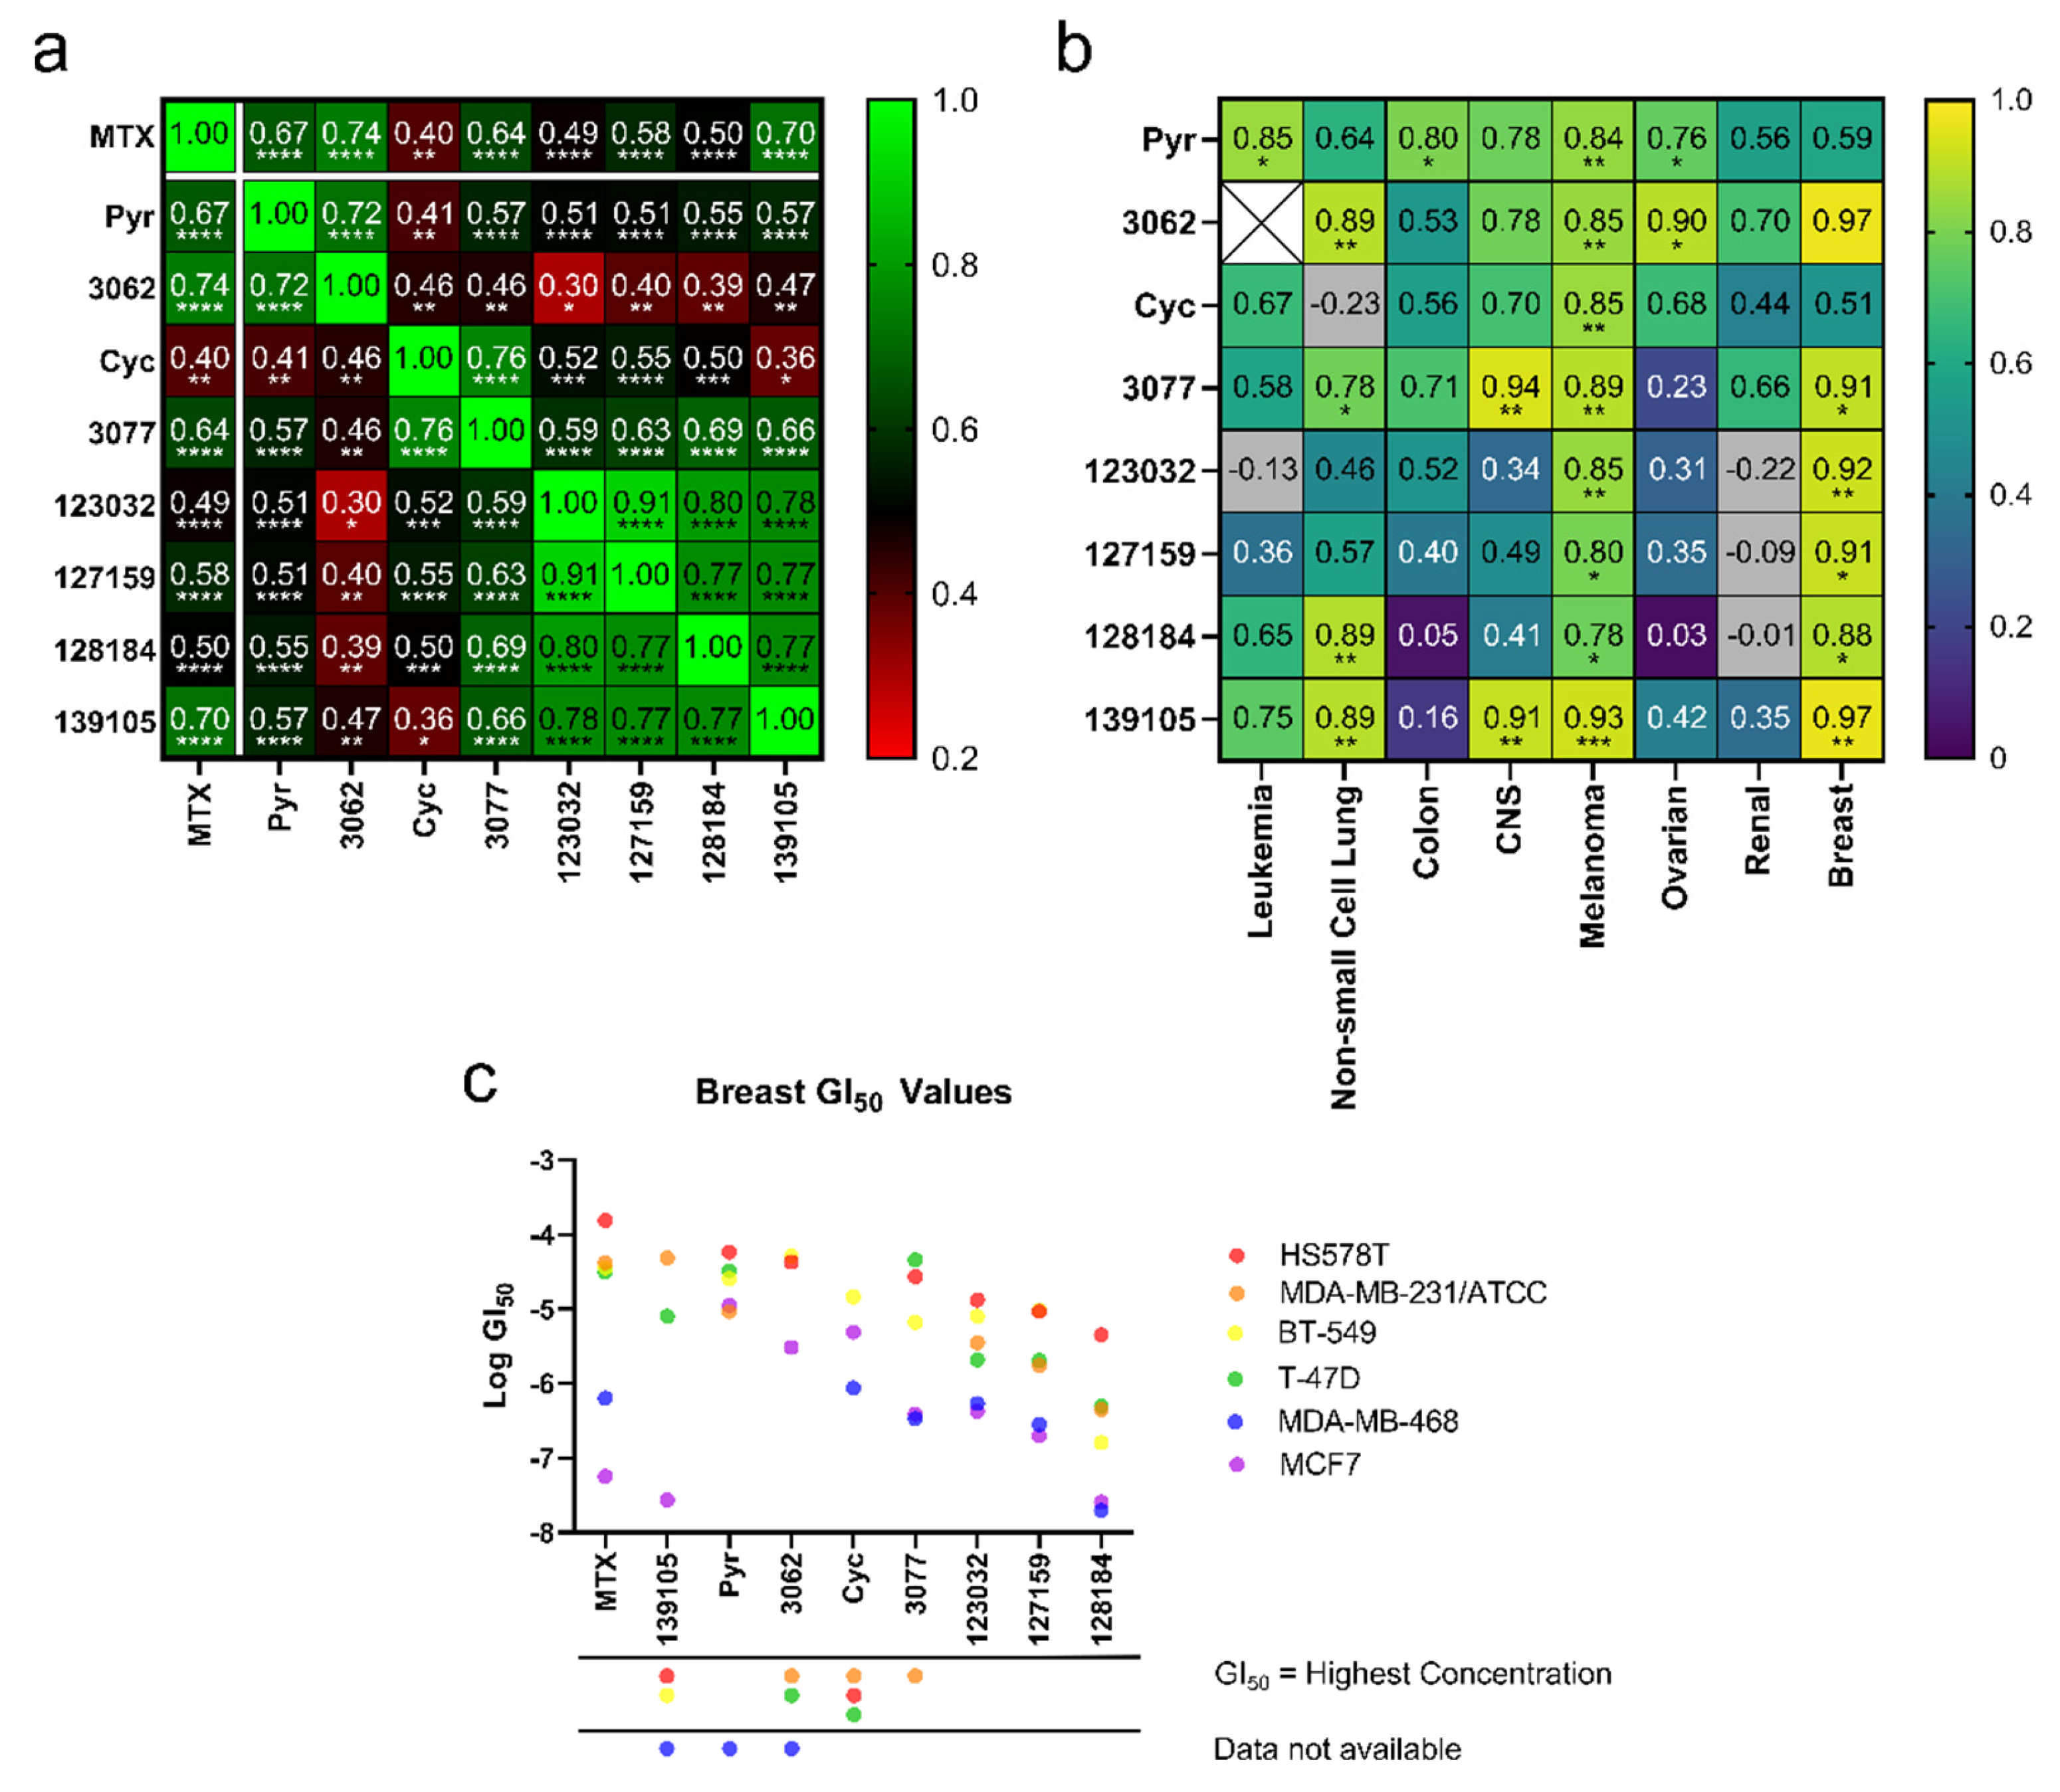
2.6. NCI-60 Sensitivity Correlation Analyses
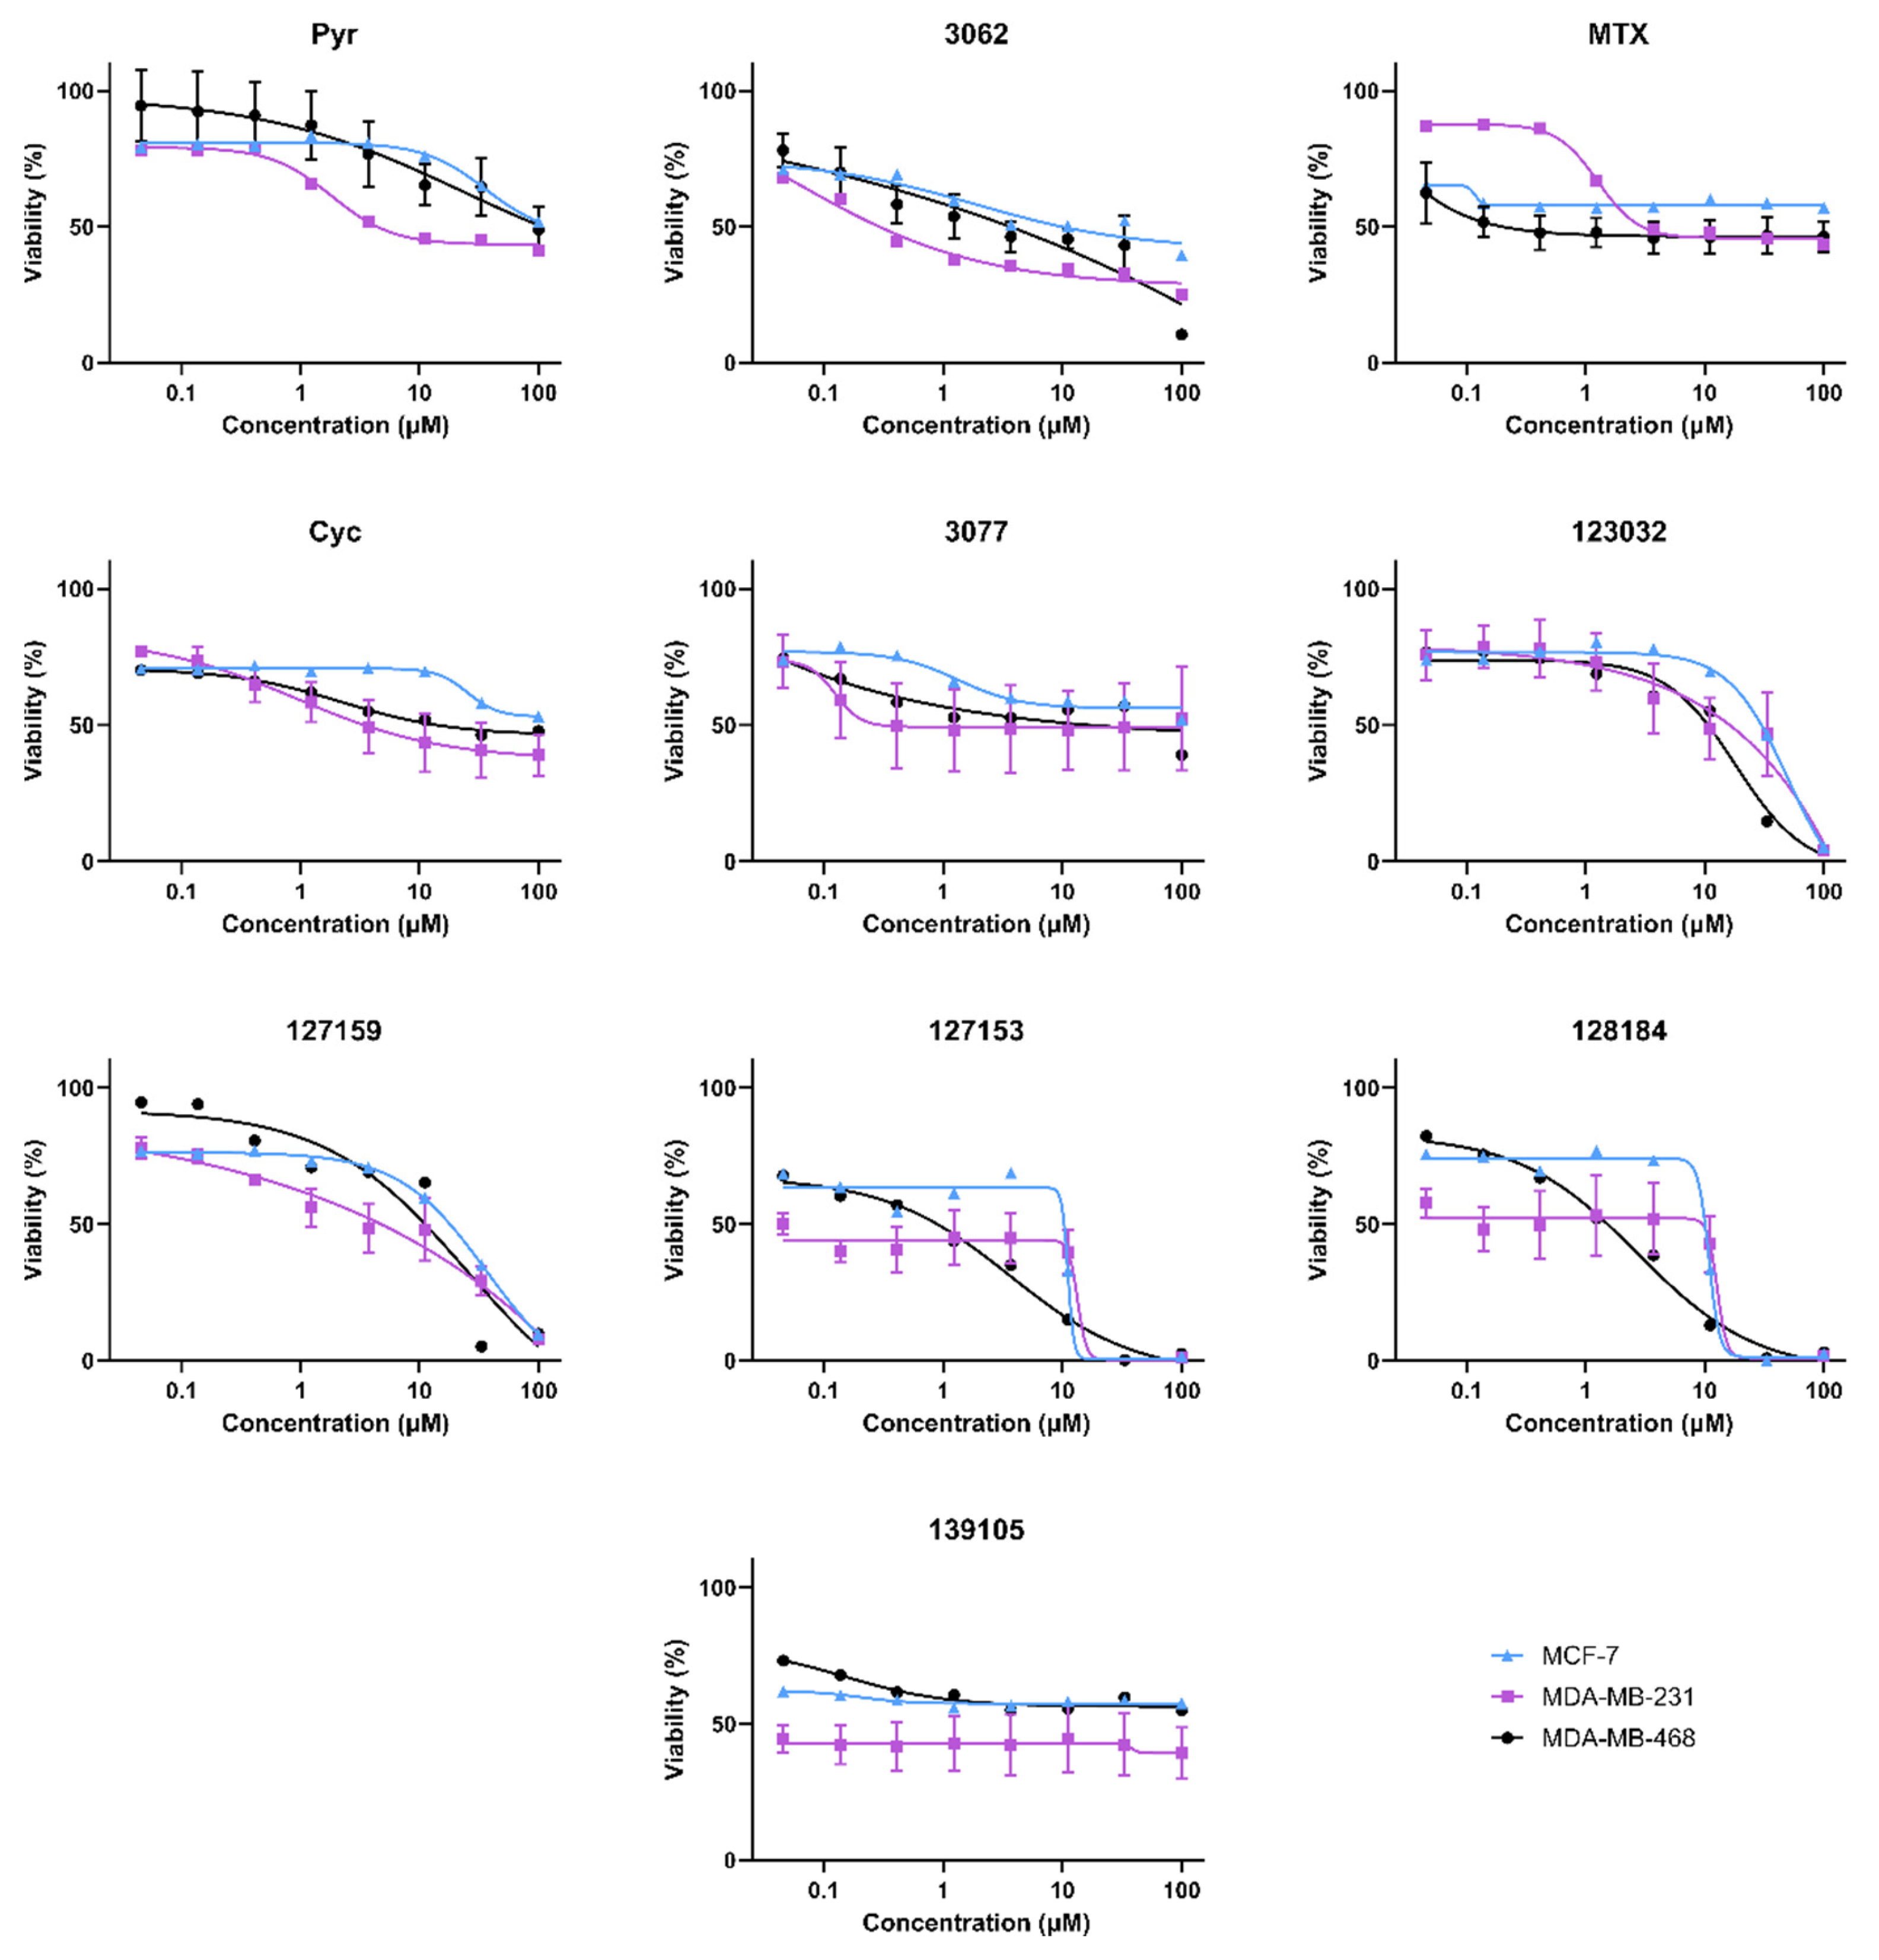
2.7. Viability Assays
2.8. Wound Healing Assay
2.9. Lysate Cellular Thermal Shift Assay (CETSA)
2.10. DHFR Accumulation Assay
2.11. Western Blot
2.12. Liquid Chromatography/Mass Spectrometry (LC/MS)-Based Metabolite Profiling
2.12.1. Sample Preparation for LC/MS Analysis of Polar Metabolites from MDA-MB-231 Celles
2.12.2. Chromatographic Conditions for LC/MS
2.12.3. Orbitrap Conditions for Targeted Analysis of Polar Metabolites
2.12.4. Data Analysis and Quantitation
2.13. STAT3 Luciferase Reporter Assay
3. Results
3.1. Cyclogunail-Like Triazine Compounds Potently Inhibiti Human DHFR In Vitro
3.2. Cyclogunail-Like Triazene Compounds Elicit Anti-Cancer Activity in Breast Cancer Cells
3.3. Cycloguanil Analogues Inhibit Breast Cancer Cell Viability
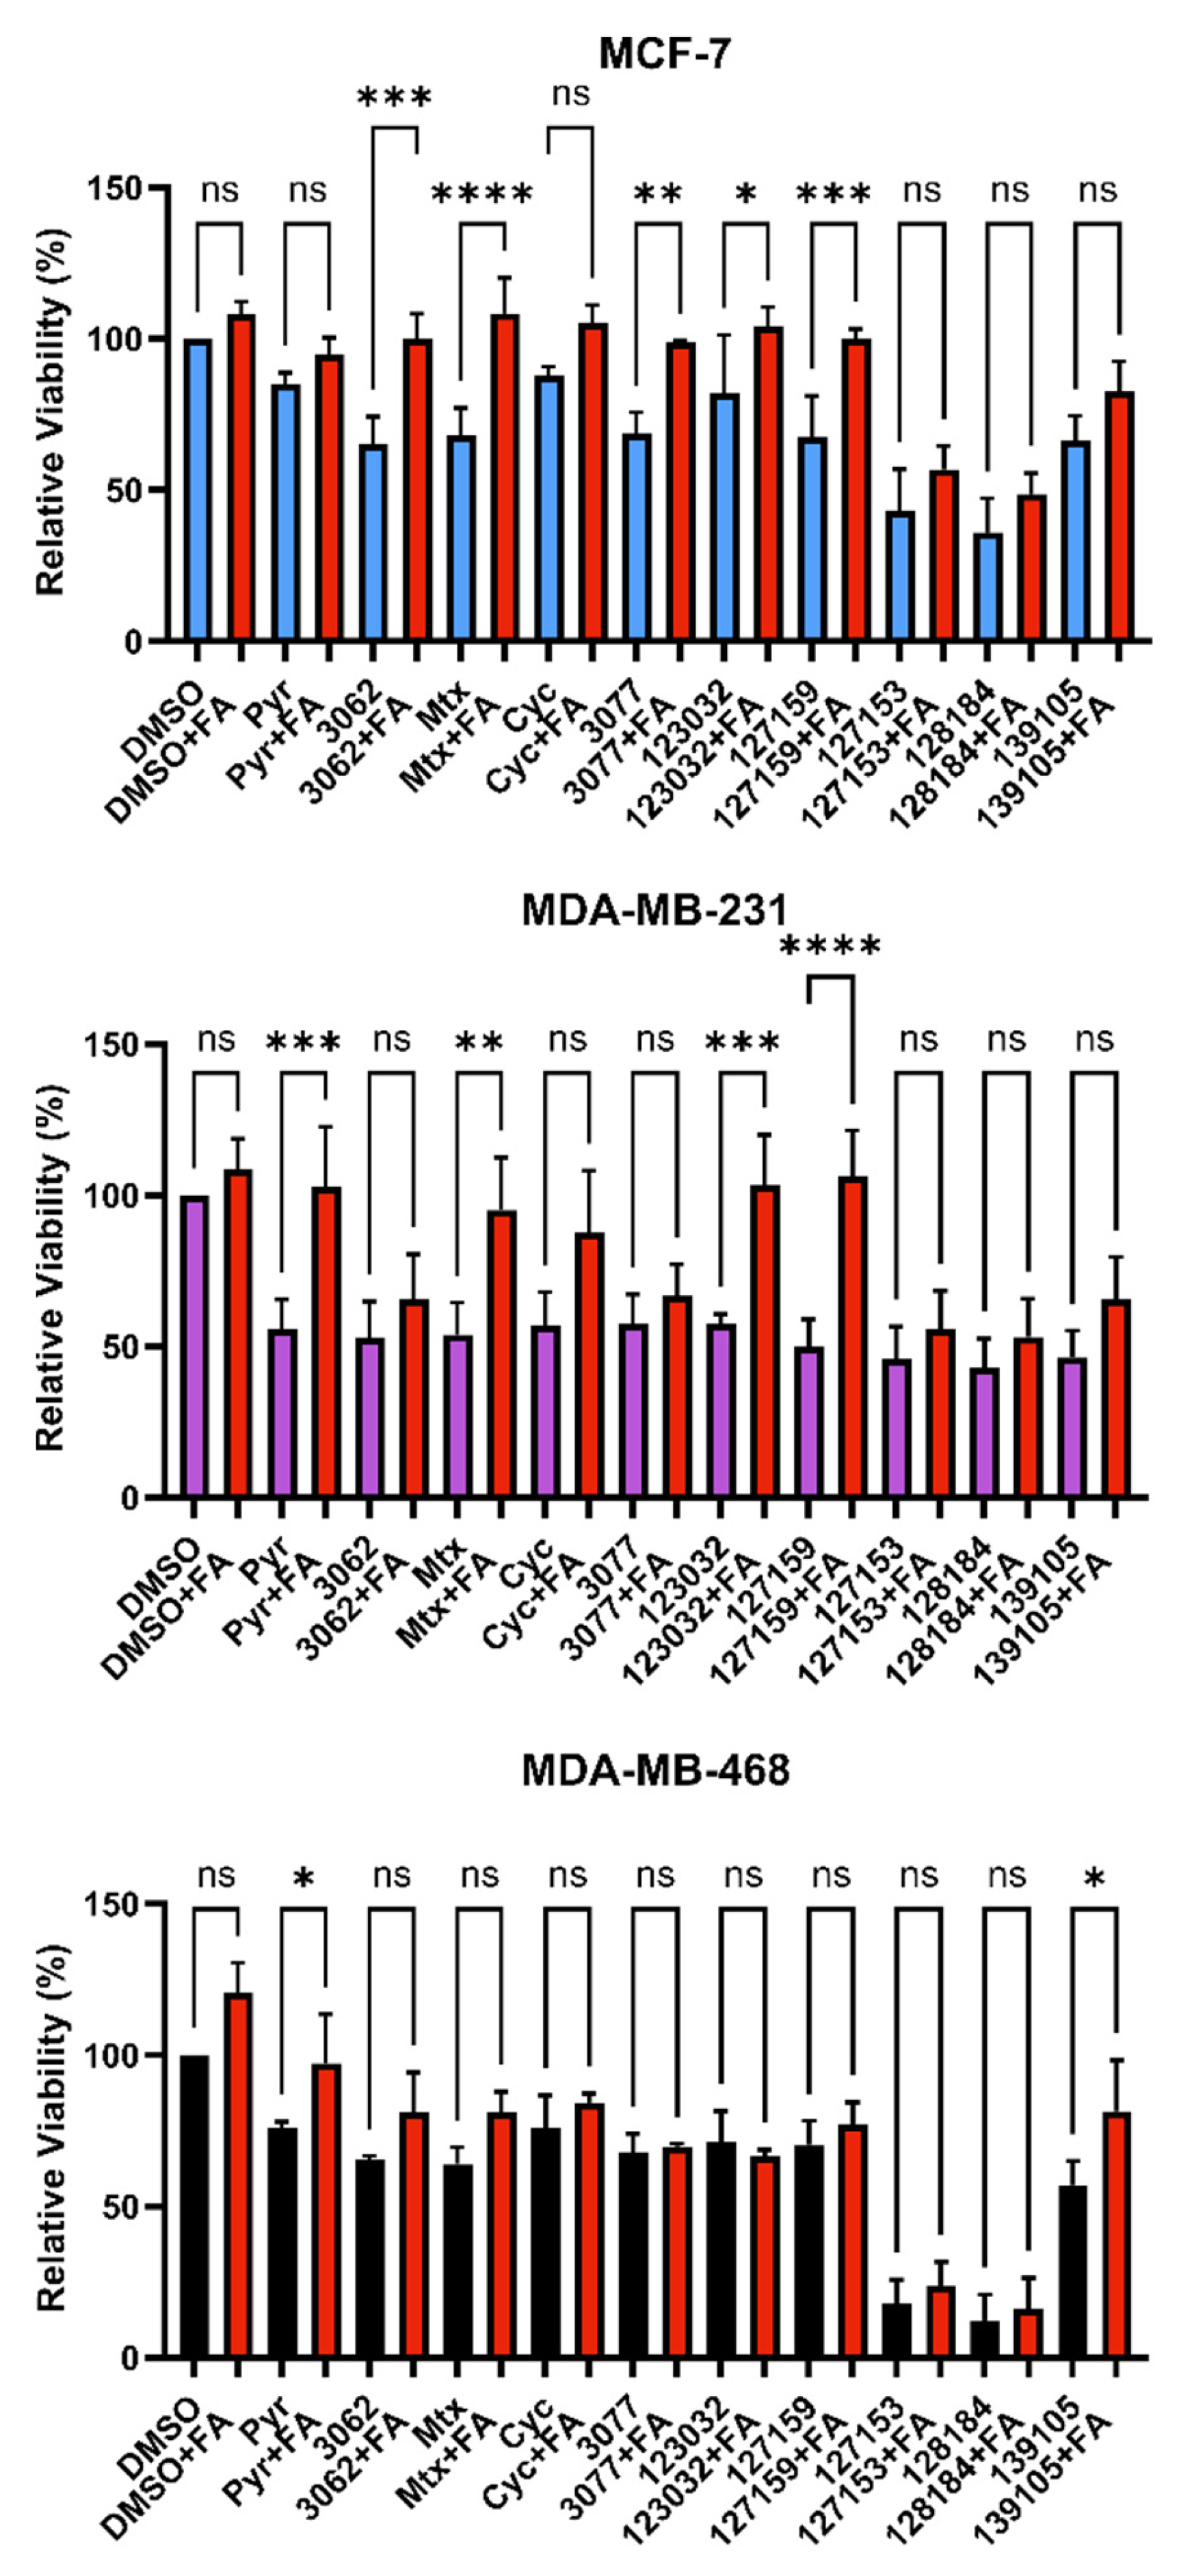
3.4. Folinic Acid Rescues DHFR Inhibitory Activity
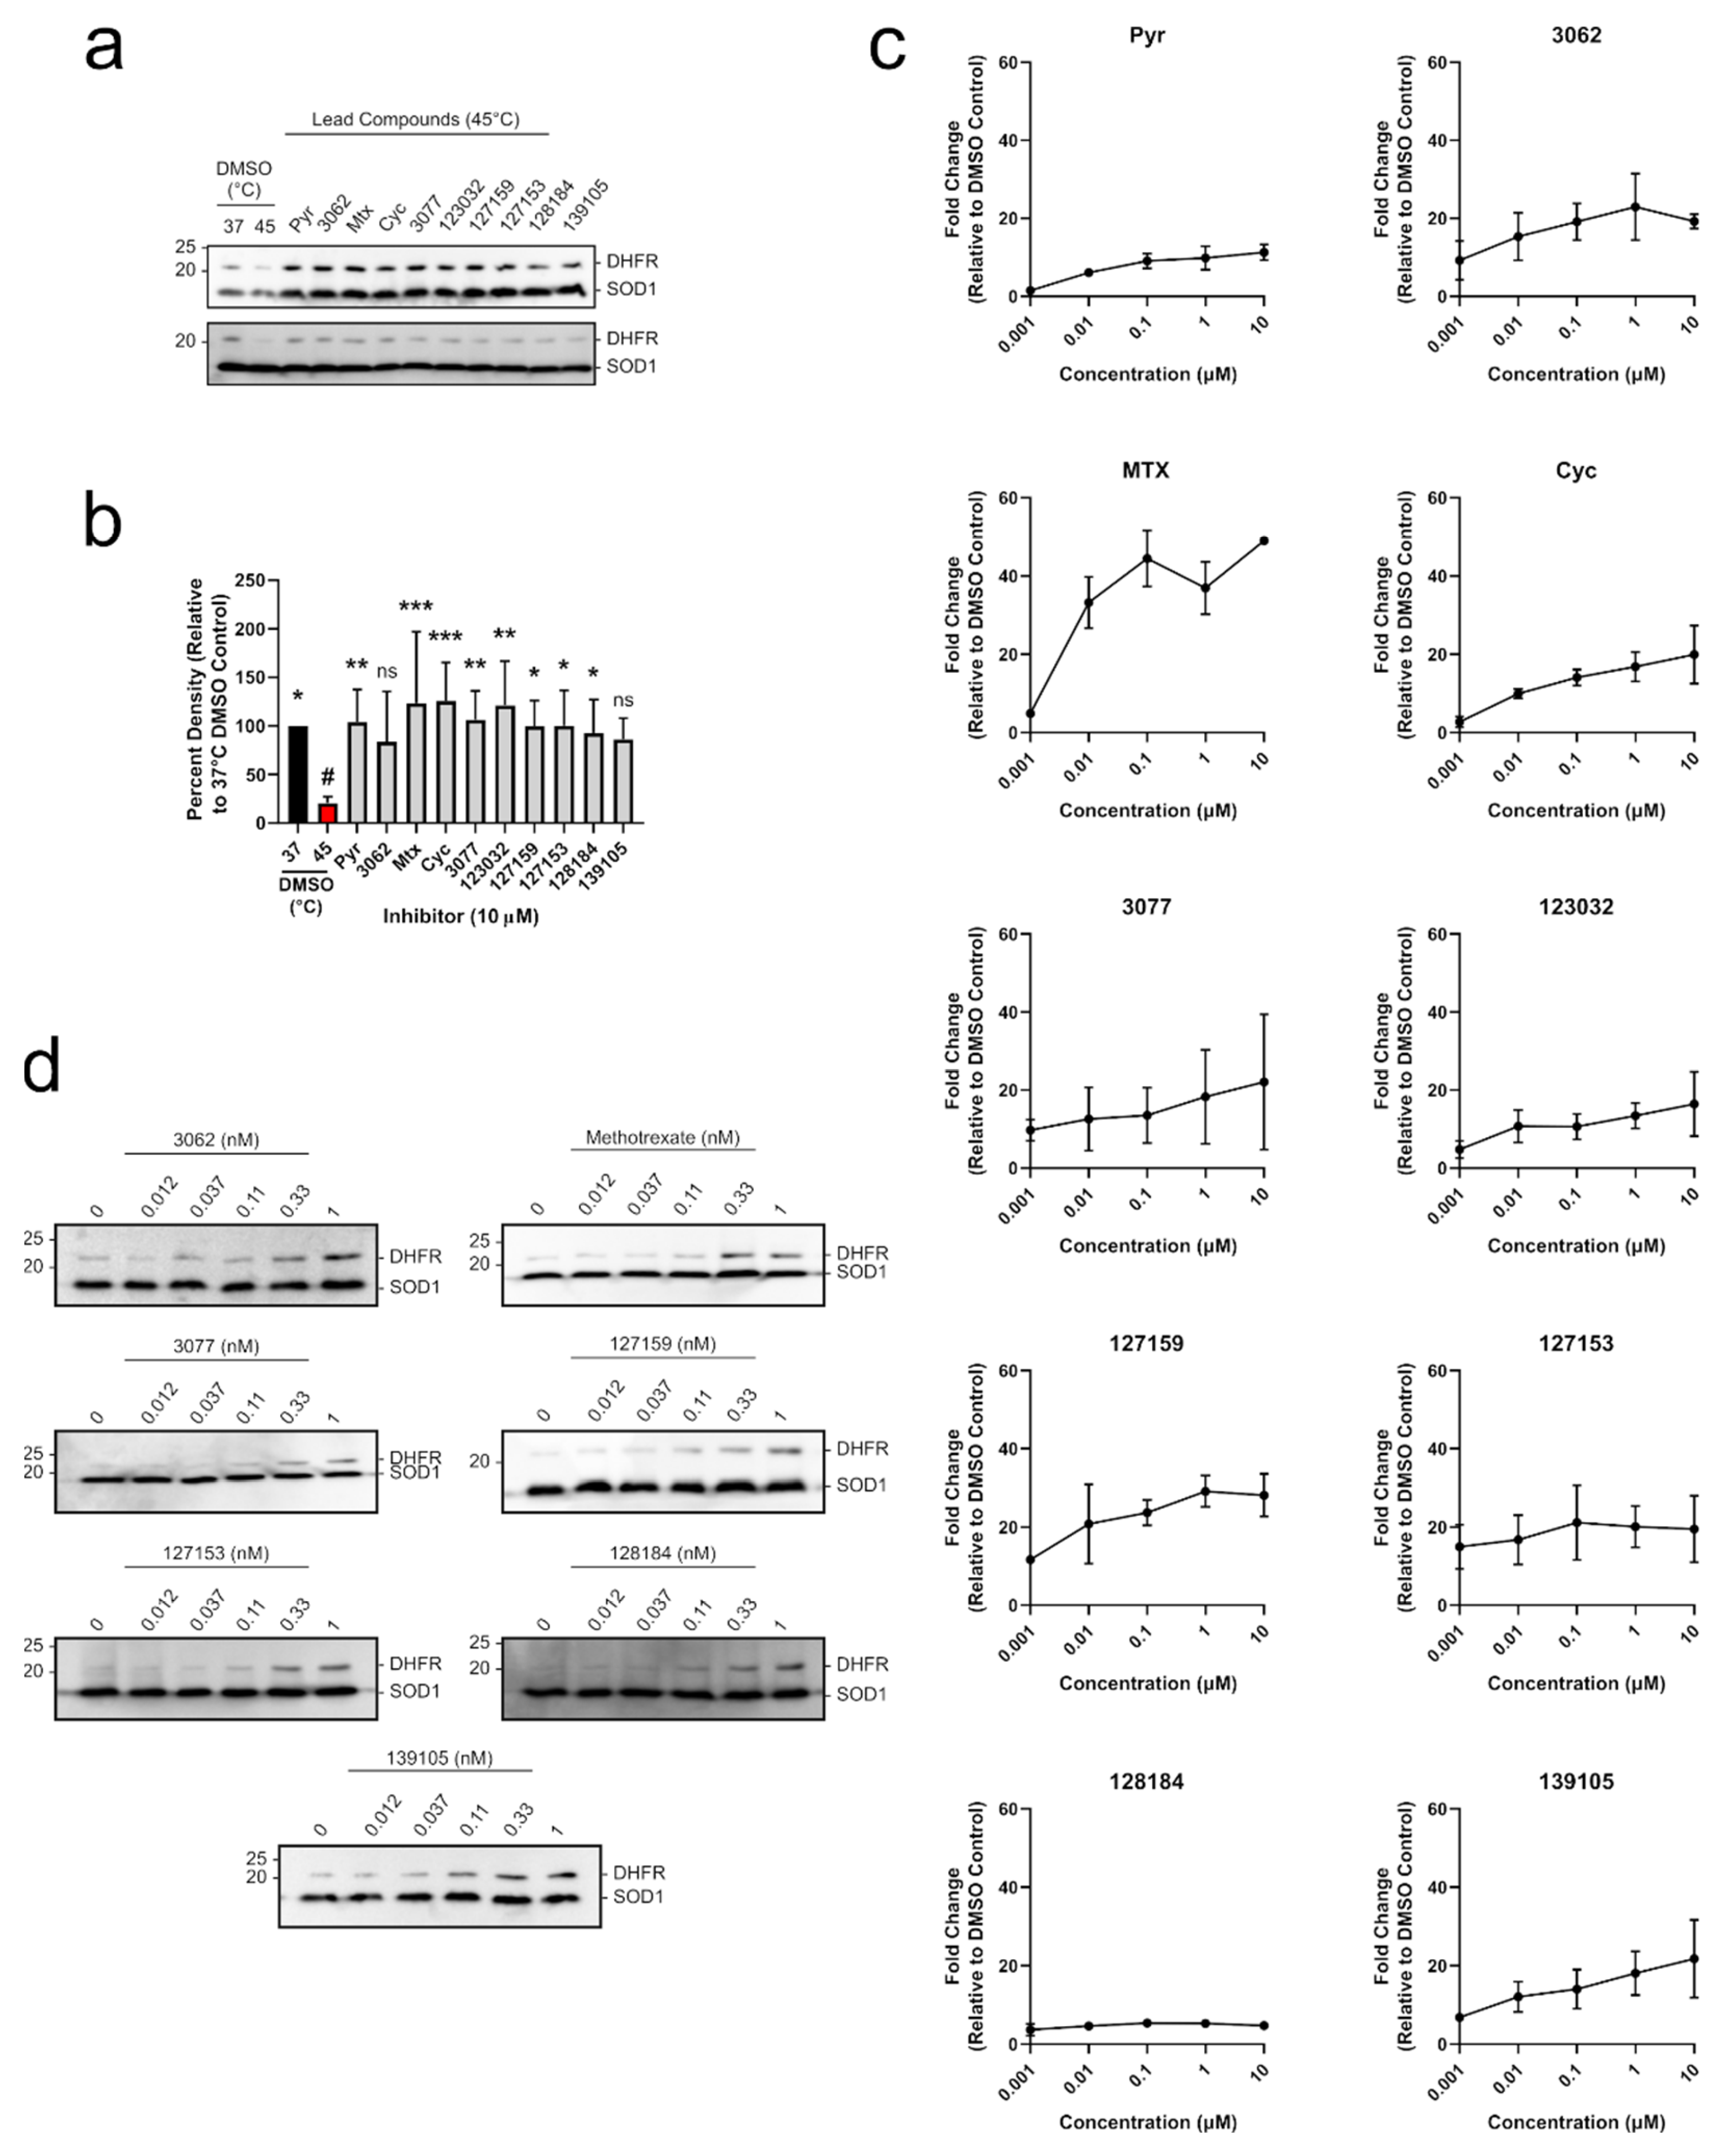
3.5. Cycloguanil Derivatives Potently Engage DHFR in Cells and Cell Lysates
3.6. Inhibitors Fail to Impair Wound Healing nor bind Thymidine Phosphorylase in MDA-MB-231 Breast Cancer Cells
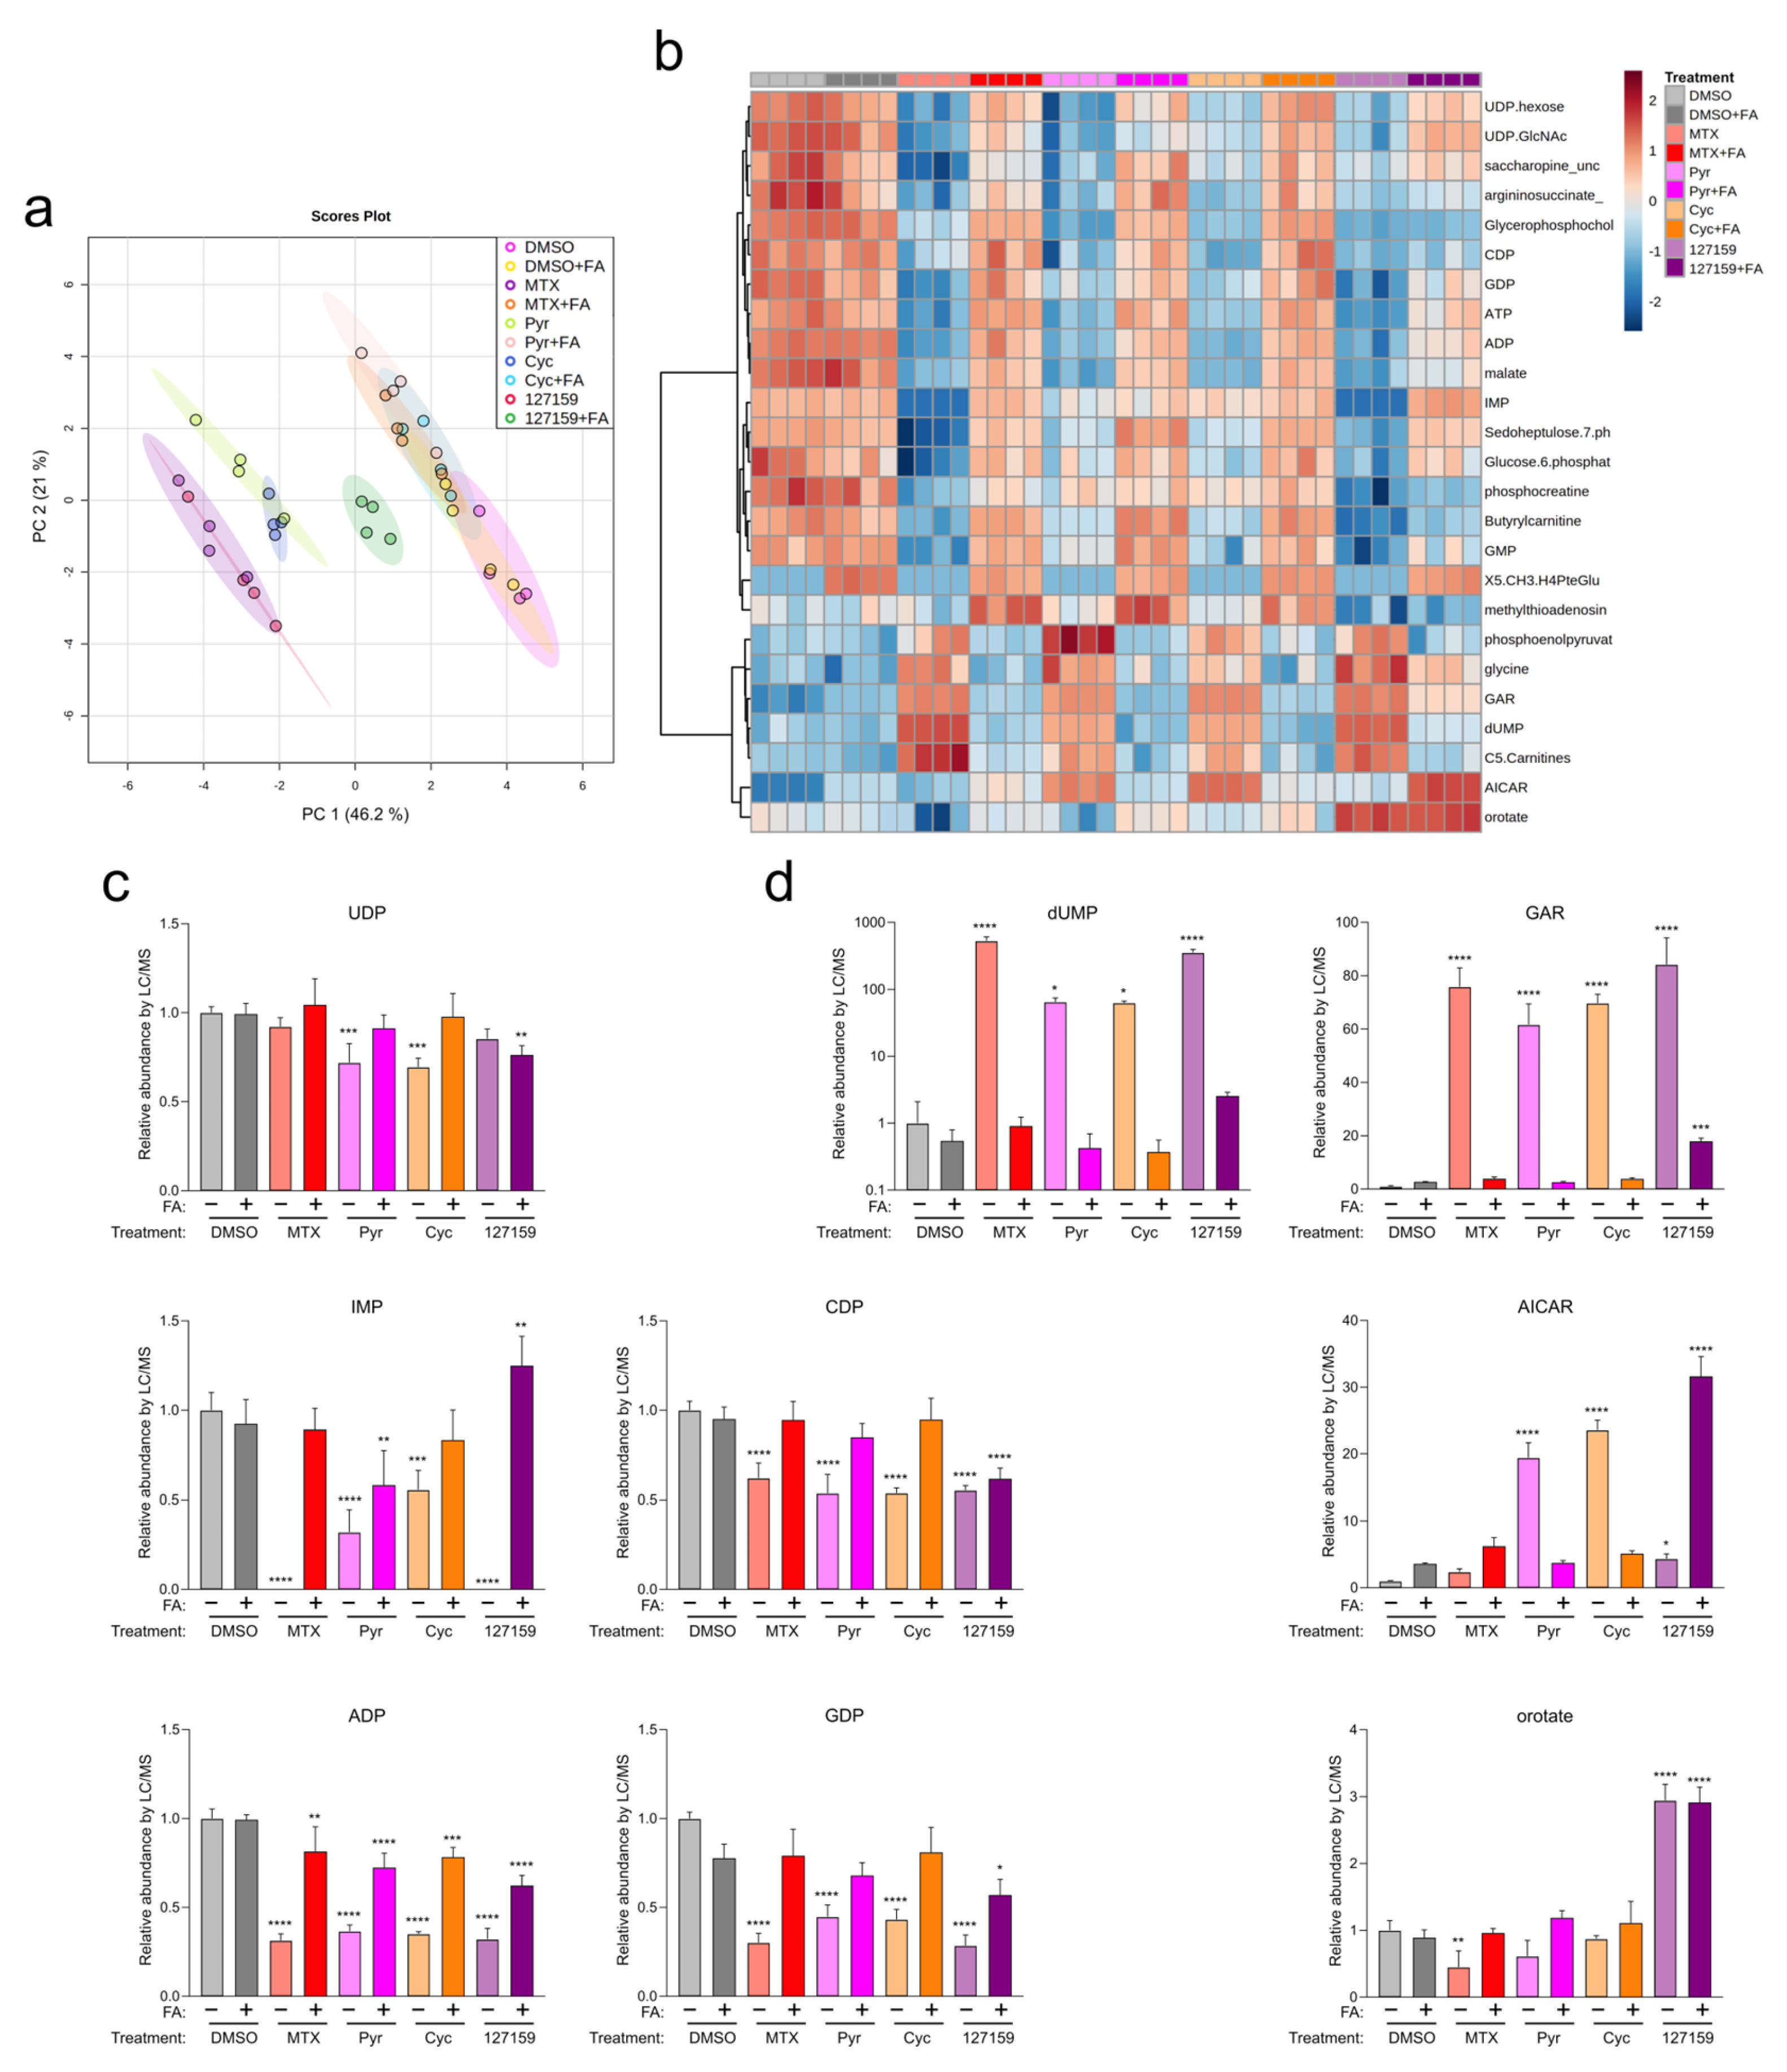
3.7. Cycloguanil and 127159 Inhibit Cellular Folate Metabolism
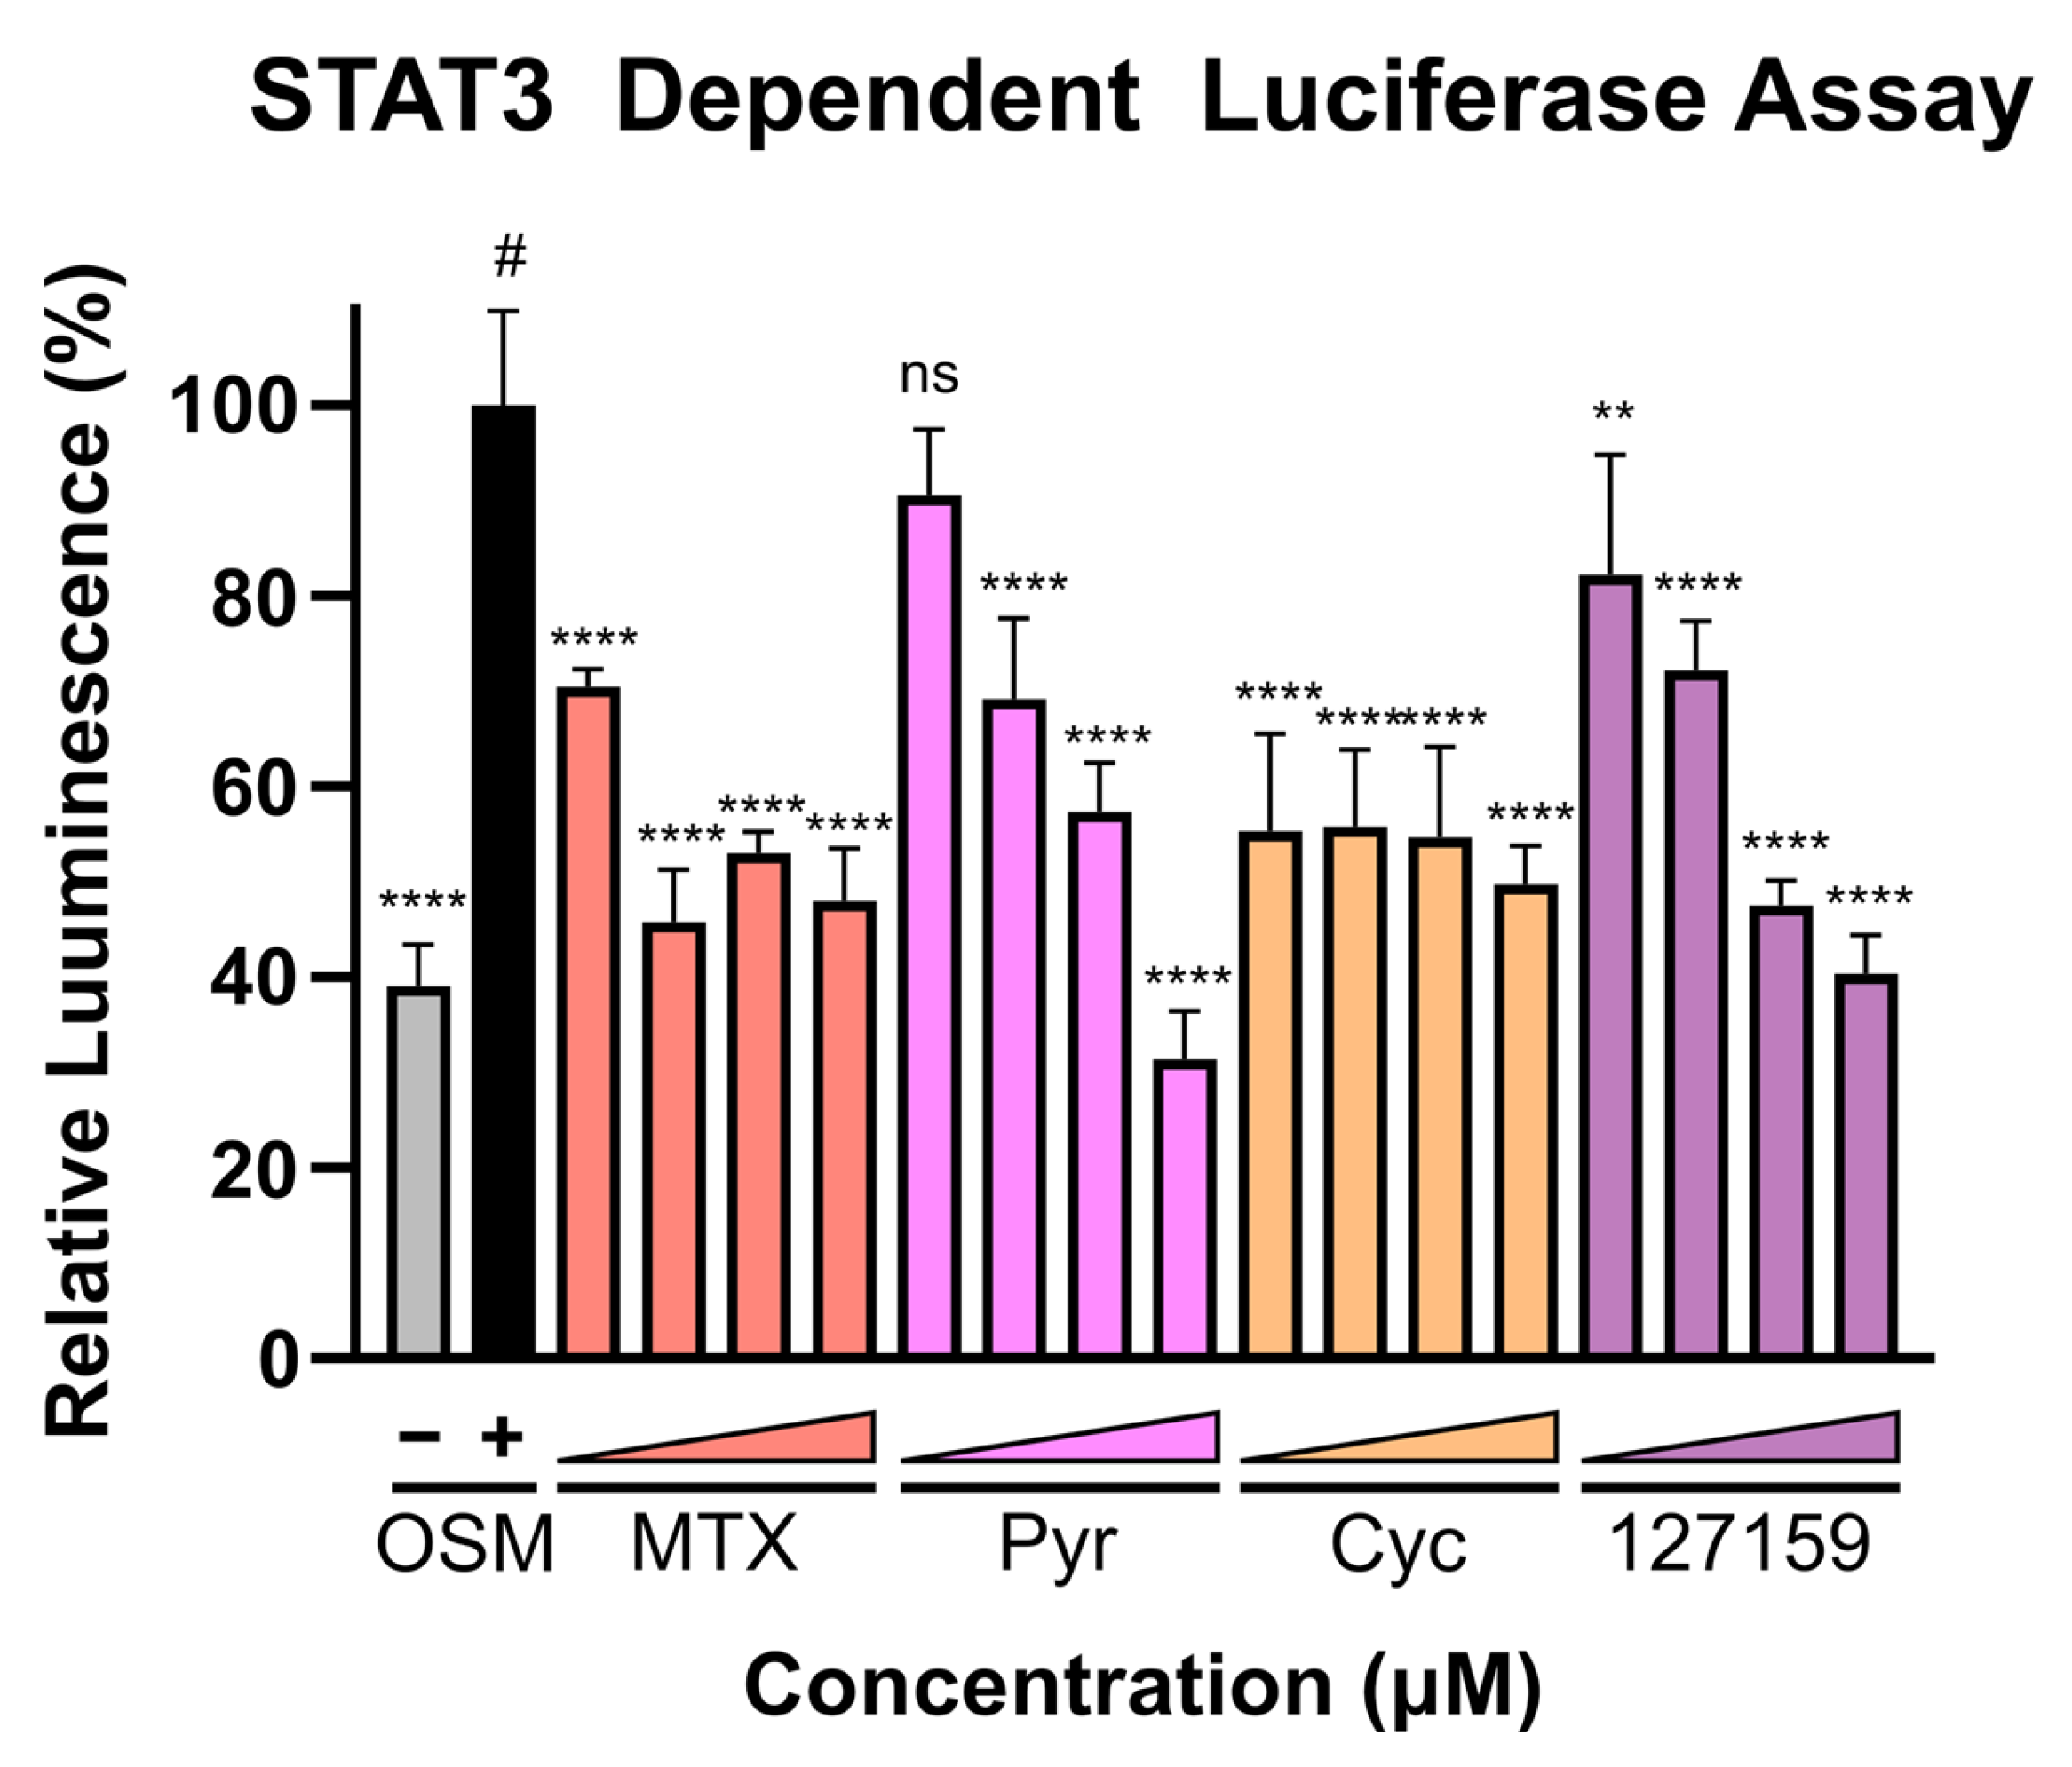
3.8. Cycloguanil Analogues Inhibit STAT3 Transcriptional Activity
4. Discussion
5. Conclusions
Supplementary Materials
Author Contributions
Funding
Institutional Review Board Statement
Informed Consent Statement
Data Availability Statement
Acknowledgments
Conflicts of Interest
References
- Jolivet, J.; Cowan, K.H.; Curt, G.A.; Clendeninn, N.J.; Chabner, B.A. The Pharmacology and Clinical Use of Methotrexate. N. Engl. J. Med. 1983, 309, 1094–1104. [Google Scholar] [CrossRef]
- Oefner, C.; D’Arcy, A.; Winkler, F.K. Crystal Structure of Human Dihydrofolate Reductase Complexed with Folate. Eur. J. Biochem. 1988, 174, 377–385. [Google Scholar] [CrossRef] [PubMed]
- Almqvist, H.; Axelsson, H.; Jafari, R.; Dan, C.; Mateus, A.; Haraldsson, M.; Larsson, A.; Molina, D.M.; Artursson, P.; Lundbäck, T.; et al. CETSA Screening Identifies Known and Novel Thymidylate Synthase Inhibitors and Slow Intracellular Activation of 5-Fluorouracil. Nat. Commun. 2016, 7, 1–11. [Google Scholar] [CrossRef] [PubMed] [Green Version]
- Heppler, L.N.; Attarha, S.; Persaud, R.; Brown, J.I.; Wang, P.; Petrova, B.; Tošić, I.; Burton, F.B.; Flamand, Y.; Walker, S.R.; et al. The Antimicrobial Drug Pyrimethamine Inhibits STAT3 Transcriptional Activity by Targeting the Enzyme Dihydrofolate Reductase. J. Biol. Chem. 2022, 298, 101531. [Google Scholar] [CrossRef]
- Brown, J.R.; Walker, S.R.; Heppler, L.N.; Tyekucheva, S.; Nelson, E.A.; Klitgaard, J.; Nicolais, M.; Kroll, Y.; Xiang, M.; Yeh, J.E.; et al. Targeting Constitutively Active STAT3 in Chronic Lymphocytic Leukemia: A Clinical Trial of the STAT3 Inhibitor Pyrimethamine with Pharmacodynamic Analyses. Am. J. Hematol. 2021, 96, E95–E98. [Google Scholar] [CrossRef]
- Khan, M.W.; Saadalla, A.; Ewida, A.H.; Al-katranji, K.; Al-saoudi, G.; Giaccone, Z.T.; Gounari, F.; Zhang, M.; David, A.; Khazaie, K. The STAT3 Inhibitor Pyrimethamine Displays Anti-Cancer and Immune Stimulatory Effects in Murine Models of Breast Cancer Mohammad. Cancer Immunol. Immunother. 2018, 67, 13–23. [Google Scholar] [CrossRef]
- Sanchez, T.W.; Ronzetti, M.H.; Owens, A.E.; Antony, M.; Voss, T.; Wallgren, E.; Talley, D.; Balakrishnan, K.; Leyes Porello, S.E.; Rai, G.; et al. Real-Time Cellular Thermal Shift Assay to Monitor Target Engagement. ACS Chem. Biol. 2022, 17, 2471–2482. [Google Scholar] [CrossRef]
- Molina, D.M.; Jafari, R.; Ignatushchenko, M.; Seki, T.; Larsson, E.A.; Dan, C.; Sreekumar, L.; Cao, Y.; Nordlund, P. Monitoring Drug Target Engagement in Cells and Tissues Using the Cellular Thermal Shift Assay. Science 2013, 341, 84–88. [Google Scholar] [CrossRef]
- Gaetani, M.; Sabatier, P.; Saei, A.A.; Beusch, C.M.; Yang, Z.; Lundström, S.L.; Zubarev, R.A. Proteome Integral Solubility Alteration: A High-Throughput Proteomics Assay for Target Deconvolution. J. Proteome Res. 2019, 18, 4027–4037. [Google Scholar] [CrossRef]
- Huber, M.K.V.; Olek, K.M.; Müller, A.C.; Soon Heng Tan, C.; Bennett, K.L.; Colinge, J.; Superti-Furga, G. Proteome-Wide Small Molecule and Metabolite Interaction Mapping. Nat. Methods 2015, 12, 1055–1057. [Google Scholar] [CrossRef]
- Zhang, X.; Ruan, C.; Zhu, H.; Li, K.; Zhang, W.; Wang, K.; Hu, L.; Ye, M. A Simplified Thermal Proteome Profiling Approach to Screen Protein Targets of a Ligand. Proteomics 2020, 20, 1900372. [Google Scholar] [CrossRef] [PubMed]
- Scholar, E. Proguanil. In xPharm: The Comprehensive Pharmacology Reference; Elsevier Inc.: Amsterdam, the Netherlands, 2008; pp. 1–4. [Google Scholar]
- Baker, B.R.; Vermeulen, N.M.J. Irreversible Enzyme Inhibitors. CLXXVII. Active-Site-Directed Irreversible Inhibitors of Dihydrofolate Reductase Derived from 4,6-Diamino-1,2-Dihydro-2,2-Dimethyl-1-(Phenylalkylphenyl)-s-Triazines. II. J. Med. Chem. 1970, 13, 1154–1160. [Google Scholar] [CrossRef] [PubMed]
- Baker, B.R.; Vermeulen, N.M.; Ashton, W.T.; Ryan, A.J. Irreversible Enzyme Inhibitors. CLXXIII. Cure of Walker 256 Ascites by Reversible and Irreversible Inhibitors of Dihydrofolic Reductase Derived from 1-(Substituted-Phenyl)-4,6-Diamino-1,2-Dihydro-2,2-Dimethyl-s-Triazine. J. Med. Chem. 1970, 13, 1130–1140. [Google Scholar] [CrossRef] [PubMed]
- Baker, B.R. Irreversible Enzyme Inhibitors. CXVII. Hydrophobic Bonding to Dihydrofolic Reductase. XI. Comparison of the Enzyme from Walker 256, Rat Liver, and L1210 Mouse Leukemia. J. Med. Chem. 1968, 11, 483–486. [Google Scholar] [CrossRef] [PubMed]
- National Institute of Health, National Cancer Institute, Division of Cancer Treatment & Diagnosis. Developmental Therapeutics Program. Available online: https://dtp.cancer.gov/ (accessed on 16 March 2021).
- Schrödinger Release 2021-3: Maestro; Schrödinger, LLC: New York, NY, USA, 2021.
- Bell, E.W.; Zhang, Y. DockRMSD: An Open-Source Tool for Atom Mapping and RMSD Calculation of Symmetric Molecules through Graph Isomorphism. J. Cheminform. 2019, 11, 40. [Google Scholar] [CrossRef] [Green Version]
- National Institute of Health, National Cancer Institute, Division of Cancer Treatment & Diagnosis. NCI-60 Human Tumor Cell Lines Screen. Available online: https://dtp.cancer.gov/public_compare/ (accessed on 28 October 2022).
- O’Brien, J.; Wilson, I.; Orton, T.; Pognan, F. Investigation of the Alamar Blue (Resazurin) Fluorescent Dye for the Assessment of Mammalian Cell Cytotoxicity. Eur. J. Biochem. 2000, 267, 5421–5426. [Google Scholar] [CrossRef]
- Rasband, W.S. ImageJ; U.S. National Institute of Health: Bethesda, MD, USA, 2018. [Google Scholar]
- Page, B.D.G.; Valerie, N.C.K.; Wright, R.H.G.; Wallner, O.; Isaksson, R.; Carter, M.; Rudd, S.G.; Loseva, O.; Jemth, A.; Almlöf, I.; et al. Targeted NUDT5 Inhibitors Block Hormone Signaling in Breast Cancer Cells. Nat. Commun. 2018, 9, 250. [Google Scholar] [CrossRef] [Green Version]
- Xia, J.; Sinelnikov, I.V.; Han, B.; Wishart, D.S. MetaboAnalyst 3.0-Making Metabolomics More Meaningful. Nucleic Acids Res. 2015, 43, W251–W257. [Google Scholar] [CrossRef] [Green Version]
- Nelson, E.A.; Walker, S.R.; Kepich, A.; Gashin, L.B.; Hideshima, T.; Ikeda, H.; Chauhan, D.; Anderson, K.C.; Frank, D.A. Nifuroxazide Inhibits Survival of Multiple Myeloma Cells by Directly Inhibiting STAT3. Blood 2008, 112, 5095–5102. [Google Scholar] [CrossRef] [Green Version]
- Cody, V.; Luft, J.R.; Pangborn, W. Understanding the Role of Leu22 Variants in Methotrexate Resistance: Comparison of Wild-Type and Leu22Arg Variant Mouse and Human Dihydrofolate Reductase Ternary Crystal Complexes with Methotrexate and NADPH. Acta Crystallogr. Sect. D Biol. Crystallogr. 2005, 61, 147–155. [Google Scholar] [CrossRef]
- Loo, T.L.; Benjamin, R.S.; Lu, K.; Benvenuto, J.A.; Hall, S.W.; Mckelvey, E.M. Metabolism and Disposition of Baker’s Antifolate (NSC-139105), Ftorafur (NSC-148958), and Dichlorallyl Lawsone (NSC-126771) in Man. Drug Metab. Rev. 1978, 8, 137–150. [Google Scholar] [CrossRef] [PubMed]
- Stewart, D.J.; Leavens, M.; Lu, K.; Wang, Y.M.; Benjamin, R.S.; Ho, D.H.; Yong, H. Central Nervous System Pharmacology of Baker’s Antifolate (NSC139105) in Man. J. Neurooncol. 1984, 2, 187–193. [Google Scholar] [CrossRef] [PubMed]
- Rodriguez, V.; Gottlieb, J.; Burgess, M.A.; Livingston, R.; Wheeler, W.; Spitzer, G.; Bodey, G.P.; Blumenschein, G.R.; Freireich, E.J. Phase i Studies with Baker’s Antifol (BAF) (NSC139105). Cancer 1976, 38, 690–694. [Google Scholar] [CrossRef]
- Widemann, B.C.; Adamson, P.C. Understanding and Managing Methotrexate Nephrotoxicity. Oncologist 2006, 11, 694–703. [Google Scholar] [CrossRef] [PubMed] [Green Version]
- Jafari, R.; Almqvist, H.; Axelsson, H.; Ignatushchenko, M.; Lundbäck, T.; Nordlund, P.; Molina, D.M. The Cellular Thermal Shift Assay for Evaluating Drug Target Interactions in Cells. Nat. Protoc. 2014, 9, 2100–2122. [Google Scholar] [CrossRef]
- Ercikan-Abali, E.A.; Banerjee, D.; Waltham, M.C.; Skacel, N.; Scotto, K.W.; Bertino, J.R. Dihydrofolate Reductase Protein Inhibits Its Own Translation by Binding to Dihydrofolate Reductase MRNA Sequences within the Coding Region. Biochemistry 1997, 36, 12317–12322. [Google Scholar] [CrossRef]
- Bertino, J.R.; Donohue, D.R.; Gabrio, B.W.; Silber, R.; Alenty, A.; Meyer, M.; Huennekens, F.M. Increased Level of Dihydrofolic Reductase in Leucocytes of Patients Treated with Amethopterin. Nature 1962, 193, 140–142. [Google Scholar] [CrossRef]
- Skacel, N.; Menon, L.G.; Mishra, P.J.; Peters, R.; Banerjee, D.; Bertino, J.R.; Abali, E.E. Identification of Amino Acids Required for the Functional Up-Regulation of Human Dihydrofolate Reductase Protein in Response to Antifolate Treatment. J. Biol. Chem. 2005, 280, 22721–22731. [Google Scholar] [CrossRef] [Green Version]
- Liu, H.; Qin, Y.; Zhai, D.; Zhang, Q.; Gu, J.; Tang, Y.; Yang, J.; Li, K.; Yang, L.; Chen, S.; et al. Antimalarial Drug Pyrimethamine Plays a Dual Role in Antitumor Proliferation and Metastasis through Targeting DHFR and TP. Mol. Cancer Ther. 2019, 18, 541–555. [Google Scholar] [CrossRef] [Green Version]
- Pellegrini, S.; John, J.; Shearer, M.; Kerr, I.M.; Stark, G.R. Use of a Selectable Marker Regulated by Alpha Interferon to Obtain Mutations in the Signaling Pathway. Mol. Cell. Biol. 1989, 9, 4605–4612. [Google Scholar] [CrossRef]
- Baker, B.R.; Ashton, W.T. Irreversible Enzyme Inhibitors. CLXXVI. Active-Site-Directed Irreversible Inhibitors of Dihydrofolate Reductase Derived from 4,6-Diamino-1,2-Dihydro-2,2-Dimethyl-1-Phenyl-s-Triazene by Ether Bridging to a Terminal Sulfonyl Fluoride. J. Med. Chem. 1970, 13, 1149–1154. [Google Scholar] [CrossRef] [PubMed]
- Baker, B.R.; Ashton, W.T. Irreversible Enzyme Inhibitors. CLXXVIII. Active-Site-Directed Irreversible Inhibitors of Dihydrofolate Reductase Derived from 1-(4-Benzyloxy-3-Chlorophenyl)-4,6-Diamino-1,2-Dihydro-2,2-Dimethyl-s-Triazine with a Terminal Sulfonyl Fluoride. J. Med. Chem. 1970, 13, 1161–1165. [Google Scholar] [CrossRef] [PubMed]
- Kiweler, N.; Delbrouck, C.; Pozdeev, V.I.; Neises, L.; Soriano-Baguet, L.; Eiden, K.; Xian, F.; Benzarti, M.; Haase, L.; Koncina, E.; et al. Mitochondria Preserve an Autarkic One-Carbon Cycle to Confer Growth-Independent Cancer Cell Migration and Metastasis. Nat. Commun. 2022, 13, 2699. [Google Scholar] [CrossRef]
- Soflaee, M.H.; Kesavan, R.; Sahu, U.; Tasdogan, A.; Villa, E.; Djabari, Z.; Cai, F.; Tran, D.H.; Vu, H.S.; Ali, E.S.; et al. Purine Nucleotide Depletion Prompts Cell Migration by Stimulating the Serine Synthesis Pathway. Nat. Commun. 2022, 13, 2698. [Google Scholar] [CrossRef]


| Compound | XPG Score (kcal/mol) | IC50 (μM) |
|---|---|---|
| MTX | −12.630 | 0.117 ± 0.006 a |
| Pyr | −8.217 | 16.9 ± 7.9 |
| 3062 | −8.774 | 8.6 ± 2.7 |
| Cyc | −7.718 | 10.8 ± 3.5 |
| 3077 | −8.653 | 1.26 ± 0.66 |
| 123032 | −10.067 | 1.17 ± 0.46 |
| 127159 | −10.257 | 0.75 ± 0.32 |
| 127153 | −9.338 | 0.93 ± 0.24 |
| 128184 | −10.193 | 0.72 ± 0.24 |
| 139105 | −10.165 | 2.11 ± 0.53 |
Disclaimer/Publisher’s Note: The statements, opinions and data contained in all publications are solely those of the individual author(s) and contributor(s) and not of MDPI and/or the editor(s). MDPI and/or the editor(s) disclaim responsibility for any injury to people or property resulting from any ideas, methods, instructions or products referred to in the content. |
© 2023 by the authors. Licensee MDPI, Basel, Switzerland. This article is an open access article distributed under the terms and conditions of the Creative Commons Attribution (CC BY) license (https://creativecommons.org/licenses/by/4.0/).
Share and Cite
Brown, J.I.; Wang, P.; Wong, A.Y.L.; Petrova, B.; Persaud, R.; Soukhtehzari, S.; Lopez McDonald, M.; Hanke, D.; Christensen, J.; Iliev, P.; et al. Cycloguanil and Analogues Potently Target DHFR in Cancer Cells to Elicit Anti-Cancer Activity. Metabolites 2023, 13, 151. https://doi.org/10.3390/metabo13020151
Brown JI, Wang P, Wong AYL, Petrova B, Persaud R, Soukhtehzari S, Lopez McDonald M, Hanke D, Christensen J, Iliev P, et al. Cycloguanil and Analogues Potently Target DHFR in Cancer Cells to Elicit Anti-Cancer Activity. Metabolites. 2023; 13(2):151. https://doi.org/10.3390/metabo13020151
Chicago/Turabian StyleBrown, Jennifer I., Peng Wang, Alan Y. L. Wong, Boryana Petrova, Rosanne Persaud, Sepideh Soukhtehzari, Melanie Lopez McDonald, Danielle Hanke, Josephine Christensen, Petar Iliev, and et al. 2023. "Cycloguanil and Analogues Potently Target DHFR in Cancer Cells to Elicit Anti-Cancer Activity" Metabolites 13, no. 2: 151. https://doi.org/10.3390/metabo13020151