
The Association between Blood Lipids and Systemic Lupus Erythematosus: A Two-Sample Mendelian Randomization Research
 ,
,
Abstract
:1. Introduction
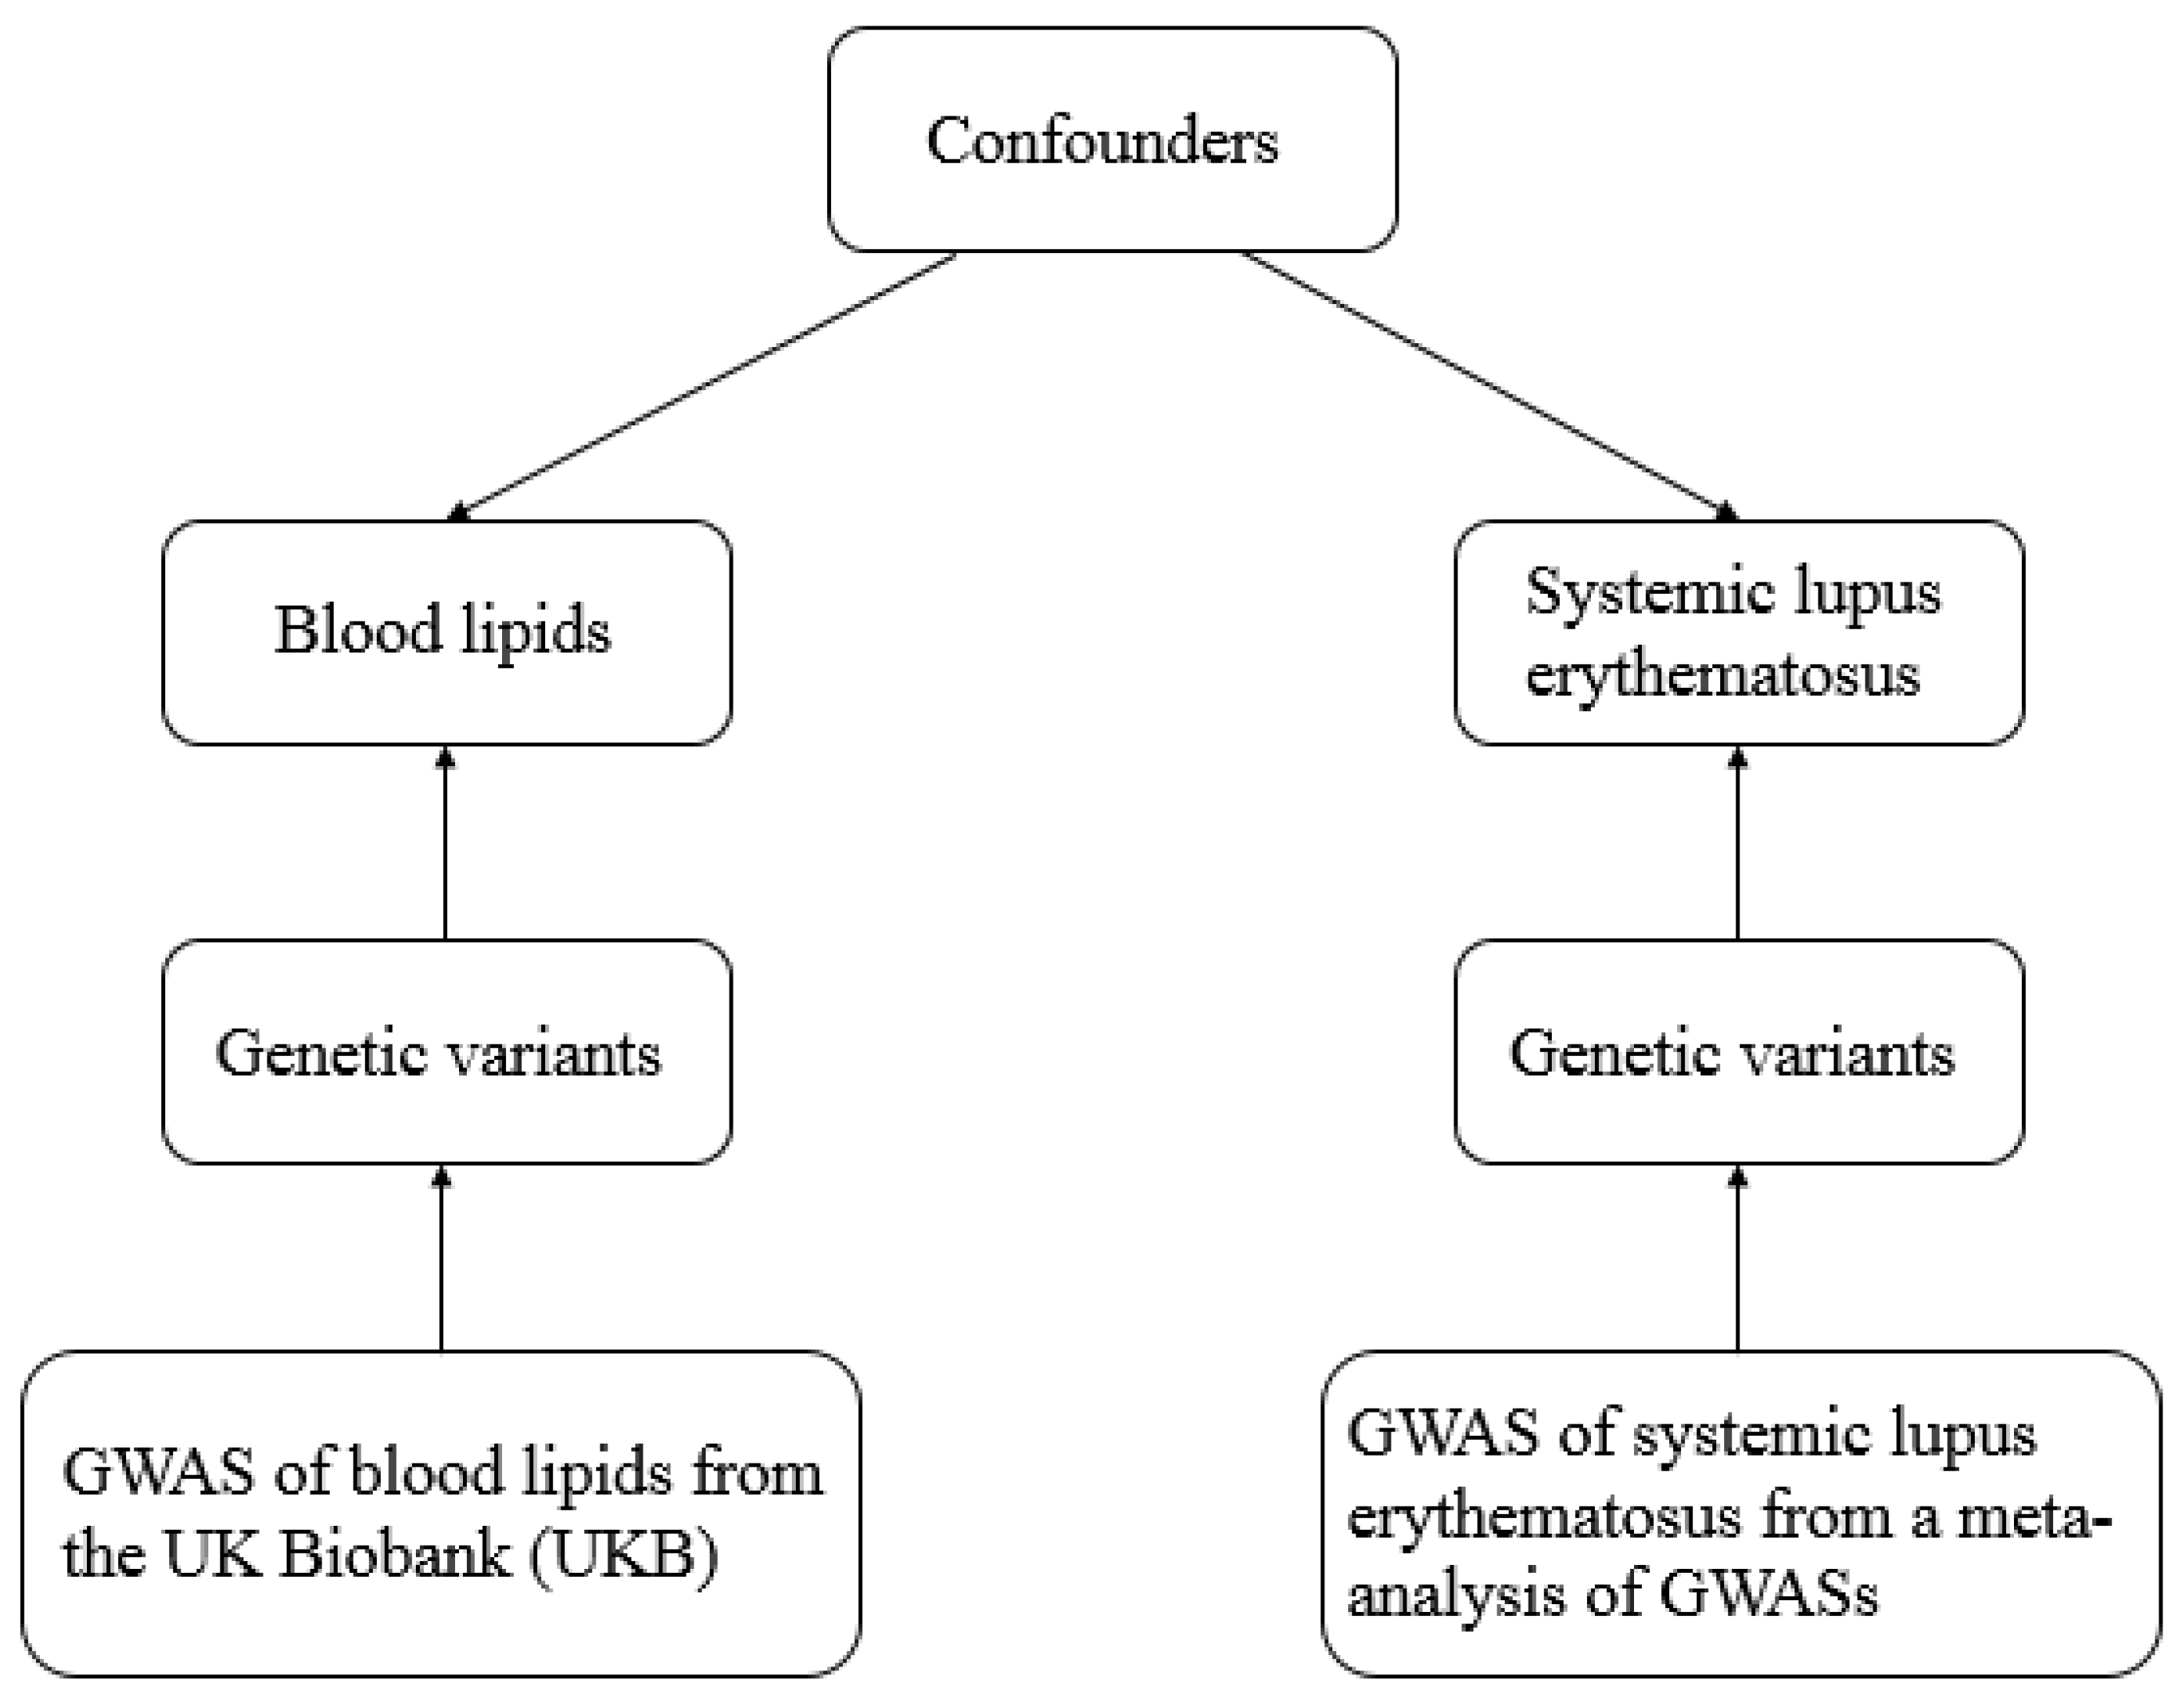
2. Methods
2.1. Data Resources and Study Design
- (a)
- (b)
- The selected genetic variant should be related to the outcome risk only through exposure, not via confounders. Herein, the horizontal pleiotropy pathway between the genetic variant and outcome was identified with MR-Egger regression [17].
- (c)
- The genetic variant should be independent of confounders.
2.2. Selection of Instrumental Genetic Variables
2.3. Statistical Analysis
3. Results
3.1. Genetic Instrumental Variants Selection
3.2. Two-Sample and Multivariable Mendelian Randomization of Blood Lipids and the Risk of SLE
3.3. Two-Sample Mendelian Randomization of SLE and the Risk of Blood Lipids
4. Discussion
5. Conclusions
Supplementary Materials
Author Contributions
Funding
Institutional Review Board Statement
Informed Consent Statement
Data Availability Statement
Conflicts of Interest
References
- Fava, A.; Petri, M. Systemic lupus erythematosus: Diagnosis and clinical management. J. Autoimmun. 2019, 96, 1–13. [Google Scholar] [CrossRef] [PubMed]
- Pons-Estel, G.J.; Alarcón, G.S.; Scofield, L.; Reinlib, L.; Cooper, G.S. Understanding the Epidemiology and Progression of Systemic Lupus Erythematosus. Semin. Arthritis Rheum. 2010, 39, 257–268. [Google Scholar] [CrossRef] [Green Version]
- Dörner, T.; Furie, R. Novel paradigms in systemic lupus erythematosus. Lancet 2019, 393, 2344–2358. [Google Scholar] [CrossRef]
- Kiriakidou, M.; Ching, C. Systemic Lupus Erythematosus. Ann. Intern. Med. 2020, 172, ITC81–ITC96. [Google Scholar] [CrossRef] [PubMed]
- Borba, E.F.; Carvalho, J.F.; Bonfá, E. Mechanisms of dyslipoproteinemias in systemic lupus erythematosus. Clin. Dev. Immunol. 2006, 13, 203–208. [Google Scholar] [CrossRef] [PubMed] [Green Version]
- de Carvalho, J.F.; Bonfá, E.; Borba, E.F. Systemic lupus erythematosus and “lupus dyslipoproteinemia”. Autoimmun. Rev. 2008, 7, 246–250. [Google Scholar] [CrossRef]
- Burgess, S.; Small, D.; Thompson, S. A review of instrumental variable estimators for Mendelian randomization. Stat. Methods Med. Res. 2017, 26, 2333–2355. [Google Scholar] [CrossRef] [Green Version]
- Davies, N.; Holmes, M.; Davey Smith, G. Reading Mendelian randomisation studies: A guide, glossary, and checklist for clinicians. BMJ 2018, 362, k601. [Google Scholar] [CrossRef] [Green Version]
- Sheehan, A.N.; Didelez, V.; Burton, P.R.; Tobin, M.D. Mendelian Randomisation and Causal Inference in Observational Epidemiology. PLoS Med. 2008, 5, e177. [Google Scholar] [CrossRef] [Green Version]
- Lawlor, D. Commentary: Two-sample Mendelian randomization: Opportunities and challenges. Int. J. Epidemiol. 2016, 45, 908–915. [Google Scholar] [CrossRef]
- Pierce, B.; Burgess, S. Efficient design for Mendelian randomization studies: Subsample and 2-sample instrumental variable estimators. Am. J. Epidemiol. 2013, 178, 1177–1184. [Google Scholar] [CrossRef] [PubMed] [Green Version]
- Richardson, T.G.; Sanderson, E.; Palmer, T.M.; Ala-Korpela, M.; Ference, B.A.; Smith, G.D.; Holmes, M.V. Evaluating the relationship between circulating lipoprotein lipids and apolipoproteins with risk of coronary heart disease: A multivariable Mendelian randomisation analysis. PLoS Med. 2020, 17, e1003062. [Google Scholar] [CrossRef] [PubMed] [Green Version]
- Collins, R. What makes UK Biobank special? Lancet 2012, 379, 1173–1174. [Google Scholar] [CrossRef] [PubMed]
- Bentham, J.; Morris, D.; Graham, D.S.C.; Pinder, C.; Tombleson, P.; Behrens, T.W.; Martin, J.; Fairfax, B.P.; Knight, J.; Chen, L.; et al. Genetic association analyses implicate aberrant regulation of innate and adaptive immunity genes in the pathogenesis of systemic lupus erythematosus. Nat. Genet. 2015, 47, 1457–1464. [Google Scholar] [CrossRef] [PubMed]
- Lawlor, D.A.; Harbord, R.M.; Sterne, J.A.C.; Timpson, N.; Smith, G.D. Mendelian randomization: Using genes as instruments for making causal inferences in epidemiology. Stat. Med. 2008, 27, 1133–1163. [Google Scholar] [CrossRef] [PubMed]
- Hemani, G.; Zheng, J.; Elsworth, B.; Wade, K.H.; Haberland, V.; Baird, D.; Laurin, C.; Burgess, S.; Bowden, J.; Langdon, R.; et al. The MR-Base platform supports systematic causal inference across the human phenome. eLife 2018, 7, e34408. [Google Scholar] [CrossRef] [PubMed]
- Bowden, J.; Davey Smith, G.; Burgess, S. Mendelian randomization with invalid instruments: Effect estimation and bias detection through Egger regression. Int J. Epidemiol. 2015, 44, 512–525. [Google Scholar] [CrossRef] [Green Version]
- Park, S.; Lee, S.; Kim, Y.; Lee, Y.; Kang, M.W.; Kim, K.; Kim, Y.C.; Han, S.S.; Lee, H.; Lee, J.P.; et al. Atrial fibrillation and kidney function: A bidirectional Mendelian randomization study. Eur. Heart J. 2021, 42, 2816–2823. [Google Scholar] [CrossRef]
- Staley, J.R.; Blackshaw, J.; Kamat, M.A.; Ellis, S.; Surendran, P.; Sun, B.B.; Paul, D.S.; Freitag, D.; Burgess, S.; Danesh, J.; et al. PhenoScanner: A database of human genotype-phenotype associations. Bioinformatics 2016, 32, 3207–3209. [Google Scholar] [CrossRef] [Green Version]
- Burgess, S.; Butterworth, A.; Thompson, S. Mendelian randomization analysis with multiple genetic variants using summarized data. Genet. Epidemiol. 2013, 37, 658–665. [Google Scholar] [CrossRef]
- Bowden, J.; Smith, G.D.; Haycock, P.C.; Burgess, S. Consistent Estimation in Mendelian Randomization with Some Invalid Instruments Using a Weighted Median Estimator. Genet. Epidemiol. 2016, 40, 304–314. [Google Scholar] [CrossRef] [PubMed] [Green Version]
- Hartwig, F.P.; Davey Smith, G.; Bowden, J. Robust inference in summary data Mendelian randomization via the zero modal pleiotropy assumption. Int. J. Epidemiol. 2017, 46, 1985–1998. [Google Scholar] [CrossRef] [PubMed] [Green Version]
- Bowden, J.; Del Greco, M.F.; Minelli, C.; Davey Smith, G.; Sheehan, N.; Thompson, J. A framework for the investigation of pleiotropy in two-sample summary data Mendelian randomization. Stat. Med. 2017, 36, 1783–1802. [Google Scholar] [CrossRef] [PubMed] [Green Version]
- Verbanck, M.; Chen, C.-Y.; Neale, B.; Do, R. Publisher Correction: Detection of widespread horizontal pleiotropy in causal relationships inferred from Mendelian randomization between complex traits and diseases. Nat. Genet. 2018, 50, 1196. [Google Scholar] [CrossRef] [PubMed]
- Srivastava, R.; Yu, S.; Parks, B.W.; Black, L.L.; Kabarowski, J.H. Autoimmune-mediated reduction of high-density lipoprotein-cholesterol and paraoxonase 1 activity in systemic lupus erythematosus-prone gld mice. Arthritis Care Res. 2010, 63, 201–211. [Google Scholar] [CrossRef] [Green Version]
- Zabalawi, M.; Bhat, S.; Loughlin, T.; Thomas, M.J.; Alexander, E.; Cline, M.; Bullock, B.; Willingham, M.; Sorci-Thomas, M.G. Induction of fatal inflammation in LDL receptor and ApoA-I double-knockout mice fed dietary fat and cholesterol. Am. J. Pathol. 2003, 163, 1201–1213. [Google Scholar] [CrossRef] [Green Version]
- Wilhelm, A.J.; Zabalawi, M.; Grayson, J.M.; Weant, A.E.; Major, A.S.; Owen, J.; Bharadwaj, M.; Walzem, R.; Chan, L.; Oka, K.; et al. Apolipoprotein A-I and Its Role in Lymphocyte Cholesterol Homeostasis and Autoimmunity. Arter. Thromb. Vasc. Biol. 2009, 29, 843–849. [Google Scholar] [CrossRef] [Green Version]
- Bulatov, E.; Khaiboullina, S.; dos Reis, H.J.; Palotás, A.; Venkataraman, K.; Vijayalakshmi, M.; Rizvanov, A. Ubiquitin-Proteasome System: Promising Therapeutic Targets in Autoimmune and Neurodegenerative Diseases. Bionanoscience 2016, 6, 341–344. [Google Scholar] [CrossRef]
- Sánchez-Pérez, H.; Quevedo-Abeledo, J.C.; De Armas-Rillo, L.; Rua-Figueroa, Í.; Tejera-Segura, B.; Armas-González, E.; Machado, J.D.; García-Dopico, A.J.; Jimenez-Sosa, A.; Rodríguez-Lozano, C.; et al. Impaired HDL cholesterol efflux capacity in systemic lupus erythematosus patients is related to subclinical carotid atherosclerosis. Rheumatology 2020, 59, 2847–2856. [Google Scholar] [CrossRef]
- Sarı, R.A.; Polat, M.F.; Taysi, S.; Bakan, E.; Çapoğlu, I. Serum Lipoprotein(a) Level and its Clinical Significance in Patients with Systemic Lupus Erythematosus. Clin. Rheumatol. 2002, 21, 520–524. [Google Scholar] [CrossRef]
- Szabó, M.Z.; Szodoray, P.; Kiss, E. Dyslipidemia in systemic lupus erythematosus. Immunol. Res. 2017, 65, 543–550. [Google Scholar] [CrossRef] [PubMed]
- Ginsberg, H.N. Lipoprotein physiology. Endocrinol. Metab. Clin. N. Am. 1998, 27, 503–519. [Google Scholar] [CrossRef] [PubMed]
- Ebrahim, S.; Davey Smith, G. Mendelian randomization: Can genetic epidemiology help redress the failures of observational epidemiology? Hum. Genet. 2008, 123, 15–33. [Google Scholar] [CrossRef] [PubMed]


| Exposures and Methods | SNPs | Beta | OR (95%CI) | p Value for Association | p Value for Cochran Q Test | p Value for MR-Egger Intercept |
|---|---|---|---|---|---|---|
| LDL cholesterol | ||||||
| IVW(re) | 100 | 0.124 | 1.131 (0.838, 1.528) | 0.420 | <0.05 | |
| IVW(fe) | 100 | 0.124 | 1.131 (0.906, 1.414) | 0.277 | ||
| MR-Egger | 100 | 0.326 | 1.385 (0.870, 2.204) | 0.172 | 0.266 | |
| Weighted median | 100 | 0.281 | 1.325 (0.933, 1.882) | 0.116 | ||
| Maximum likelihood | 100 | 0.125 | 1.133 (0.906, 1.418) | 0.273 | ||
| MR.RAPS | 100 | 0.027 | 1.027 (0.809, 1.305) | 0.825 | ||
| HDL cholesterol | ||||||
| IVW(re) | 233 | 0.089 | 1.093 (0.884, 1.352) | 0.412 | <0.05 | |
| IVW(fe) | 233 | 0.089 | 1.093 (0.931, 1.284) | 0.277 | ||
| MR-Egger | 233 | 0.175 | 1.191 (0.860, 1.650) | 0.294 | 0.497 | |
| Weighted median | 233 | 0.094 | 1.099 (0.820, 1.471) | 0.528 | ||
| Maximum likelihood | 233 | 0.090 | 1.095 (0.931, 1.287) | 0.274 | ||
| MR.RAPS | 233 | 0.084 | 1.088 (0.889, 1.331) | 0.412 | ||
| Triglycerides | ||||||
| IVW(re) | 188 | −0.103 | 0.903 (0.716, 1.137) | 0.384 | <0.05 | |
| IVW(fe) | 188 | −0.269 | 0.764 (0.634, 0.920) | 0.562 | ||
| MR-Egger | 188 | −0.006 | 0.994 (0.682, 1.448) | 0.974 | 0.525 | |
| Weighted median | 188 | −0.263 | 0.769 (0.547, 1.082) | 0.131 | ||
| Maximum likelihood | 188 | 0.269 | 0.764 (0.633, 0.923) | 0.424 | ||
| MR.RAPS | 188 | −0.098 | 0.907 (0.724, 1.136) | 0.394 | ||
| Apolipoprotein A-I | ||||||
| IVW(re) | 172 | −0.157 | 0.854 (0.680, 1.074) | 0.177 | <0.05 | |
| IVW(fe) | 172 | −0.157 | 0.854 (0.709, 1.030) | 0.099 | ||
| MR-Egger | 172 | 0.036 | 1.036 (0.714, 1.505) | 0.851 | 0.202 | |
| Weighted median | 172 | 0.001 | 1.001 (0.737, 1.359) | 0.997 | ||
| Maximum likelihood | 172 | −0.159 | 0.853 (0.707, 1.030) | 0.099 | ||
| MR.RAPS | 172 | −0.089 | 0.915 (0.737, 1.135) | 0.419 | ||
| Apolipoprotein B | ||||||
| IVW(re) | 117 | −0.069 | 0.933 (0.719, 1.211) | 0.605 | <0.05 | |
| IVW(fe) | 117 | −0.069 | 0.933 (0.778, 1.120) | 0.460 | ||
| MR-Egger | 117 | 0.064 | 1.066 (0.746, 1.522) | 0.727 | 0.288 | |
| Weighted median | 117 | −0.025 | 0.975 (0.715, 1.329) | 0.872 | ||
| Maximum likelihood | 117 | −0.684 | 0.934(0.777, 1.122) | 0.465 | ||
| MR.RAPS | 117 | −0.101 | 0.904 (0.750, 1.089) | 0.290 |
| Outcomes and Methods | SNPs | Beta | OR (95%CI) | p Value for Association | p Value for Cochran Q Test | p Value for MR-Egger Intercept |
|---|---|---|---|---|---|---|
| LDL cholesterol | ||||||
| IVW(re) | 33 | −0.002 | 0.998 (0.994, 1.001) | 0.166 | <0.05 | |
| IVW(fe) | 33 | −0.002 | 0.998 (0.995, 1.000) | 0.953 | ||
| MR-Egger | 33 | 0.002 | 1.002 (0.995, 1.010) | 0.526 | 0.164 | |
| Weighted median | 33 | −0.001 | 0.999 (0.995, 1.003) | 0.634 | ||
| Maximum likelihood | 33 | −0.002 | 0.998 (0.994, 1.001) | 0.974 | ||
| MR.RAPS | 33 | −0.003 | 0.997 (0.993, 1.001) | 0.077 | ||
| HDL cholesterol | ||||||
| IVW(re) | 29 | −0.007 | 0.993 (0.988, 0.997) | 0.002 | <0.05 | |
| IVW(fe) | 29 | −0.007 | 0.993 (0.990, 0.996) | 0.001 | ||
| MR-Egger | 29 | −0.004 | 0.996 (0.986, 1.006) | 0.471 | 0.466 | |
| Weighted median | 29 | −0.004 | 0.996 (0.991, 1.000) | 0.060 | ||
| Maximum likelihood | 29 | −0.007 | 0.993 (0.990, 0.996) | 0.001 | ||
| MR.RAPS | 29 | −0.006 | 0.994 (0.988, 1.000) | 0.054 | ||
| Triglycerides | ||||||
| IVW(re) | 31 | −0.004 | 0.996 (0.993, 0.999) | 0.010 | 0.122 | |
| IVW(fe) | 31 | −0.004 | 0.996 (0.993, 0.999) | 0.003 | ||
| MR-Egger | 31 | −0.003 | 0.997 (0.991, 1.004) | 0.472 | 0.658 | |
| Weighted median | 31 | −0.002 | 0.998 (0.994, 1.002) | 0.285 | ||
| Maximum likelihood | 31 | −0.004 | 0.996 (0.993, 0.999) | 0.003 | ||
| MR.RAPS | 31 | −0.004 | 0.996 (0.902, 0.909) | 0.010 | ||
| Apolipoprotein A-I | ||||||
| IVW(re) | 25 | −0.005 | 0.995 (0.990, 0.999) | 0.026 | <0.05 | |
| IVW(fe) | 25 | −0.005 | 0.995 (0.992, 0.998) | 0.001 | ||
| MR-Egger | 25 | −0.005 | 0.995 (0.983, 1.006) | 0.373 | 0.988 | |
| Weighted median | 25 | −0.005 | 0.995 (0.990, 1.000) | 0.075 | ||
| Maximum likelihood | 25 | −0.005 | 0.995 (0.991, 0.998) | 0.001 | ||
| MR.RAPS | 25 | −0.005 | 0.995 (0.989, 1.000) | 0.082 | ||
| Apolipoprotein B | ||||||
| IVW(re) | 33 | −0.002 | 0.998 (0.994, 1.001) | 0.229 | <0.05 | |
| IVW(fe) | 33 | −0.002 | 0.998 (0.995, 1.001) | 0.111 | ||
| MR-Egger | 33 | 0.004 | 1.004 (0.996, 1.012) | 0.341 | 0.098 | |
| Weighted median | 33 | −0.003 | 0.997 (0.993, 1.002) | 0.265 | ||
| Maximum likelihood | 33 | −0.002 | 0.998 (0.995, 1.001) | 0.115 | ||
| MR.RAPS | 33 | −0.003 | 0.997 (0.993, 1.001) | 0.050 |
Disclaimer/Publisher’s Note: The statements, opinions and data contained in all publications are solely those of the individual author(s) and contributor(s) and not of MDPI and/or the editor(s). MDPI and/or the editor(s) disclaim responsibility for any injury to people or property resulting from any ideas, methods, instructions or products referred to in the content. |
© 2022 by the authors. Licensee MDPI, Basel, Switzerland. This article is an open access article distributed under the terms and conditions of the Creative Commons Attribution (CC BY) license (https://creativecommons.org/licenses/by/4.0/).
Share and Cite
Ding, Y.; Fan, S.; Tang, Y.; He, M.; Ren, M.; Shi, Y.; Tao, X.; Lu, W. The Association between Blood Lipids and Systemic Lupus Erythematosus: A Two-Sample Mendelian Randomization Research. Metabolites 2023, 13, 27. https://doi.org/10.3390/metabo13010027
Ding Y, Fan S, Tang Y, He M, Ren M, Shi Y, Tao X, Lu W. The Association between Blood Lipids and Systemic Lupus Erythematosus: A Two-Sample Mendelian Randomization Research. Metabolites. 2023; 13(1):27. https://doi.org/10.3390/metabo13010027
Chicago/Turabian StyleDing, Yang, Shasha Fan, Yi Tang, Mengjiao He, Mingyang Ren, Yunjuan Shi, Xiaohua Tao, and Wei Lu. 2023. "The Association between Blood Lipids and Systemic Lupus Erythematosus: A Two-Sample Mendelian Randomization Research" Metabolites 13, no. 1: 27. https://doi.org/10.3390/metabo13010027