Article

Chromatomass-Spectrometric Method for the Quantitative Determination of Amino- and Carboxylic Acids in Biological Samples

by
Anna L. Kaysheva
1,
Arthur T. Kopylov
1,
Alexander A. Stepanov
1,
Kristina A. Malsagova
1,
Alexander A. Izotov
1,
Yevgeniya I. Shurubor
2 and
Boris F. Krasnikov
2,*
1
Biobanking Group, Branch of Institute of Biomedical Chemistry Scientific and Education Center, 123098 Moscow, Russia
2
Centre for Strategic Planning of FMBA of Russia, 119121 Moscow, Russia
*
Author to whom correspondence should be addressed.
Metabolites 2023, 13(1), 16; https://doi.org/10.3390/metabo13010016
Submission received: 14 November 2022 / Revised: 14 December 2022 / Accepted: 19 December 2022 / Published: 22 December 2022

Abstract

:
A highly sensitive method for the qualitative and quantitative determination of amino- and carboxylic acids, as well as a number of urea and methionine cycle metabolites in the studied solutions, is presented. Derivatives (esterification) were obtained for amino acids by their reaction in a solution of 3 N of hydrochloric acid in n-butanol for 15 min at 65 °C and for carboxylic acids by their reaction with phenol in ethyl acetate with 3 N of hydrochloric acid for 20 min at 65 °C. Experimental work on the determination of individual metabolites was carried out using the HPLC-MS/MS method and included the creation of a library of spectra of the analyzed compounds and their quantitative determination. Multiplex methods have been developed for the quantitative analysis of the desired metabolites in a wide range of concentrations of 3–4 orders of magnitude. The approach to the analysis of metabolites was developed based on the method of the dynamic monitoring of multiple reactions of the formation of fragments for a mass analyzer with a triple quadrupole (QQQ). The effective chromatographic separation of endogenous metabolites was carried out within 13 min. The calibration curves of the analyzed compounds were stable throughout the concentration range and had the potential to fit below empirical levels. The developed methods and obtained experimental data are of interest for a wide range of biomedical studies, as well as for monitoring the content of endogenous metabolites in biological samples under various pathological conditions. The sensitivity limit of the methods for amino acids was about 4.8 nM and about 0.5 μM for carboxylic acids. Up to 19 amino- and up to 12 carboxy acids and about 10 related metabolites can be tested in a single sample.

1. Introduction

The analysis of amino acids and acetylcarnitines based on tandem mass spectrometry (MS/MS) is one of the most common methods for diagnosing and monitoring the metabolic disorders of amino-, organic-, and fatty acids [1,2]. In research and laboratory practice, MS/MS analysis methods are widely used [3,4]. Using these methods, it is possible to determine the quantitative composition of about 50 diagnostic metabolites in a single biological sample [5]. Based on this amount of data obtained, more than 30 metabolic disorders can be identified [6]. A significant part of these disorders is included in a single diagnostic group that is recommended by the American College of Medical Genetics for ongoing monitoring [6].
Some of these diseases are associated with inborn errors in the metabolism of amino- and organic acids (isovaleric acidemia [MIM 243500], methylmalonic acidemia, propionic acidemia [MIM 606054], type I glutaric acidemia [MIM 231670]), others are associated with lifelong acquired disorders of the metabolic pathways that are responsible for the regulation of amino- and organic acids in qualitative and quantitative compositions (phenylketonuria [MIM 261600], type I tyrosinemia [MIM 276700], alkaptonuria [MIM 203500], 3-methylglutaconic aciduria type I [MIM 250950], maple syrup urine disease [MIM 248600]). For example, abnormal levels of organic acids in the urine can be due to various causes associated with disorders in the urea cycle (e.g., increased levels of orotic acid), fatty acid oxidation (short-chain acyl-CoA dehydrogenase deficiency [MIM 201470], medium-chain acyl-CoA dehydrogenase deficiency [MIM 201450], multiple acyl-CoA dehydrogenase deficiencies [MIM 231680]), energy metabolism (pyruvate dehydrogenase deficiency, fumarase deficiency [MIM 606812], SUCLA2 deficiency [MIM 603921]), purine and pyrimidine metabolism (uridine monophosphate synthetase-1 deficiency [MIM 61389], dihydropyrimidine dehydrogenase deficiency [MIM 274270]), neurotransmission (aromatic L-amino acid decarboxylase deficiency [MIM 608643]), and other etiologies (ethylmalonic encephalopathy [pMIM 602473], Canavan disease [MIM 271900], glutathione synthetase deficiency, glyceroline synthetase deficiency [MIM 266130], type I [MIM 259900] and type II [MIM 260000] primary hyperoxaluria) [7,8,9].
Thus, the clinical indications for the determination of organic acids can be of a different nature and include their monitoring both in the neonatal and at a later age. This is important, for example, for the timely detection of a number of acute diseases (accompanied by hyperammonemia, hypoglycemia, or ketolactacidosis), neurological disorders (such as convulsions, ataxia, hypotension, lethargy, coma, developmental delay, or unexplained mental retardation), as well as a number of other diseases, including, but not limited to unexplained metabolic acidosis, unusual odor, macrocephaly, liver failure, and others [10,11]. Some of these symptoms, including lethargy and acidosis, may, however, be due to exogenous intoxication. In this regard, organic acid analysis can help diagnose conditions caused by ethylene glycol poisoning, ibuprofen overdose, or gamma-hydroxybutyric acid intoxication as opposed to succinic acid or semialdehyde dehydrogenase deficiency [12].
When choosing a method or technique for solving a given problem, usually their characteristics, such as speed, availability, and efficiency, are of decisive importance. The development of a fast and efficient method for the quantitative determination of amino acids in complex biological matrices remains an important scientific and practical task. In clinical diagnostics, various methods for analyzing amino acids are known, but according to most researchers, their main disadvantages are the duration of the analysis (up to 2 h) and high cost [13]. Quite a lot of effort from various scientific and technical groups has been expended on the development of highly efficient and/or high-performance methods for the analysis of amino acids [14,15,16].
In general, amino acid quantitation methods include a range of analytical approaches based on the use of high-performance liquid chromatography (HPLC) in combination with some form of optical detection (UV, fluorescence) and/or MS/MS [17]. For example, one of the most convenient methods for determining amino acids based on HPLC with a fluorescence detector and pre-column derivatization using OPA is the method proposed by Wu and Meininger [18]. Although this method is convenient and highly reproducible, it also has disadvantages. The disadvantages include a rather long analysis time for one sample (about 1 h), a limited number of detectable amino acids, and, in addition, during the operation of the analytical column, the coelution of individual amino acids is periodically observed, which makes it difficult to further quantify them.
For the determination of carboxylic acids based on HPLC-UV, we used an inexpensive, direct, and fast method developed by us earlier [19]. The disadvantages of this method include its high specificity in relation to the analytical column used, as well as the fact that the detection of metabolites is carried out at a wavelength of 210 nm, which, although not often, still requires increased attention when analyzing the results due to the possible coelution of close metabolites.
Based on the foregoing, it seems that MS is perhaps almost the only method that makes it possible to unambiguously identify metabolites of interest. MS usually plays a key role in the analysis of amino acids since it permits not only the distinguishing of analytes by their mass-to-charge ratio (m/z) but also uses multiple reaction monitoring (MRM), which significantly increases the selectivity and sensitivity of the analysis. An analysis of the most promising approaches for the quantitative multiplex detection of amino acids in biological samples is presented in Table 1.
In terms of organic acid detection, HPLC/MS provides more accurate and unambiguous identification of individual metabolites than is possible with platforms such as HPLC with a refractive detector (HPLC/refractometer), HPLC/UV, or HPLC with an electrochemical detector (HPLC/ED). Separately, the important role of MS in the identification of a number of metabolites in complex biological matrices, which can potentially contain interfering compounds, can be noted.
Here, several works should be singled out, which describe the main methodological approaches and stages of verification for methods of the analysis of organic acids in biological samples using MS [25,26]. For example, one can note the use of HPLC with reversed phase and UV detection for the analysis of aliphatic and phenolic acids, as well as aldehydes under the conditions of their extraction with methyl tert-butyl ether [27]. Subsequently, this method was modified for the use of UV and MS with a triple quadrupole, which markedly increased the specificity of the analysis [24]. The approach was used to measure aliphatic and phenolic acids, decomposition products of ammonia fibers, as well as their subsequent analysis. Formic and acetic acids were determined using a single quadrupole MS [25].
One of the popular HPLC options is the use of stationary phase chromatography based on a polystyrene-divinylbenzene polymer matrix (BioRad Aminex® HPX-87H, Phenomenex Rezex™-RFQ, Hercules, CA, USA) [28,29]. This type of carrier provides the good separation of simple sugars (glucose, xylose), many organic acids, alcohols (ethanol, n-butanol), as well as sugar degradation products (5-hydroxymethylfurfural, furfural). In this case, only acidified water is used as the mobile phase since the polymer matrix is highly stable over a wide pH range. However, one of the disadvantages of this type of chromatographic column is its high cost. For the analysis of organic acids by MS, the commonly used sulfuric acid is replaced by volatile formic acid or acetic acid [30,31]. Nevertheless, the appearance of some difficulties associated with the possible formation of adduct ionization products and by-products of the esterification reaction cannot be ruled out here.
Usually, organic acids are isolated from biological samples (urine, blood plasma) using organic solvents, and their presence and amount in the sample are determined using GC or HPLC-MS. More than 500 organic acids can be detected in urine [32]. To identify the state of a genetically determined disease of organic aciduria, both qualitative and quantitative methods of analysis are suitable, with careful monitoring and correct evaluation of the data obtained. For example, in classical organic aciduria, diagnostic biomarkers often have elevated concentrations in the sample, so the diagnosis of the disease is possible without quantitative analysis [12]. An analysis of the most promising approaches for the quantitative multiplex detection of carboxylic acids in biological samples is presented in Table 2.
It is important to note that in some diseases, biomarker levels may be close to the normal values observed in clinically healthy patients [39,40]. Therefore, it is imperative to conduct a thorough study of the chromatograms for the presence of clinically significant compounds, including those that are present in small quantities or are hidden due to coelution with other compounds.
The use of a program that monitors compliance with laboratory requirements for the analysis of organic compounds in clinical diagnostics contributes to the timely detection of undiagnosed diseases. Often this is due to the difficulty of detecting compounds that are important for the detection of pathognomonic symptoms but are present in the sample at low concentrations [41]. The quantitative analysis of the main biomarkers of a particular disease can also be useful for the therapeutic monitoring of previously diagnosed patients [32,42,43,44,45].
However, unfortunately, modern methods for the quantitative determination of amino acids (Table 1) and carboxylic acids (Table 2) are mostly based on the use of expensive isotope-labeled target metabolite standards and/or expensive chromatographic columns for isolating target metabolites, which, according to a number of specialists, is one of the limiting factors for the development and wider implementation of this methodology in practice [1,2,3,4].
The present work is devoted to the creation of a fast multiplex (HPLC-MS/MS) method for efficient chromatographic separation and the subsequent detection of amino- and carboxylic acids without the use of expensive isotopically labeled standards and costly chromatographic columns for the preliminary isolation of metabolites. The novelty of our work lies in the creation of multiplex methods that are characterized by the high sensitivity and accuracy of analysis while maintaining high speed, which provides high performance at very moderate costs for analysis.
The calibration curves obtained for the analyzed compounds are characterized by high stability over the entire range of concentrations and can potentially be approximated in the region of concentrations below the empirical ones. Analytical indicators, such as the detection limit, of the methods proposed in the work are improved compared to similar studies while maintaining the speed of the method (13.5 and 12 min for amino acids and carboxylic acids, respectively).

2. Materials and Methods

2.1. Reagents

Water, HPLC grade (ITW Reagents PanReac®, cat. no. 361074.1612, AppliChem GmbH, Darmstadt, Germany), acetonitrile, HPLC grade (Carlo Erba Reagents S.A.S, cat. no. 412329000, Emmendingen, Germany), formic acid (Sigma-Aldrich, cat. no. 33015, St. Louis, MO, USA), trifluoroacetic acid (Acros Organics, cat. no. P39720010, Thermo Fisher Scientific, Waltham, MA, USA), heptafluorobutyric acid (Acros Organics, cat. no. 172801000, Thermo Fisher Scientific, Waltham, MA, USA), ammonium acetate (Fluka, cat. no. 73432, Buchs, Switzerland), methanol (J.T. Baker, cat. no. 8402, Radnor, PA, USA), amino and keto acid standards (Sigma Aldrich, cat. no. A9906, St. Louis, MO, USA), human coagulation factor VIII (Sigma Aldrich, cat. no. H0920000-3EA, St. Louis, MO, USA).

2.2. Analytical Equipment

For the analysis of the metabolites, we used a high-resolution quadrupole TOF MS (Agilent, Paolo Alto, CA, USA, model G6550 iFunnel, 2013) and a low-resolution triple quadrupole MS (Agilent, Paolo Alto, CA, USA, model G6490A, 2014).

2.3. Standards

The list of standards with main identifiers is presented in Supplementary Materials, Table S1.

2.4. Esterification of Amino Acids

To carry out the esterification process, the arbitrary weights of each amino acid were taken into separate test tubes. Molecular weight, mass, and final concentrations of amino acids are presented in the Supplementary Materials, Table S2. A fixed volume (0.5 mL) of a 0.1 M HCl solution was added to the prepared amino acid samples. Then, in the resulting solution, the final concentration was calculated for each amino acid.
An equimolar mixture of amino acids with a final partial molar concentration of each amino acid equal to 1 mmol/L was prepared in a final volume of 1 mL of the surrogate matrix (1% solution of human coagulation factor VIII). To do this, the corresponding volumes of each amino acid solution were mixed by bringing the resulting volume with a 0.1 M HCl solution to 1 mL.
After the addition of all the amino acids, the final volume of the equimolar mixture was 845.41 µL. The indicated volume was adjusted to 1 mL by adding 154.59 of a 0.1 M HCl solution. The resultant solution contained an equimolar concentration of each amino acid.
For the effective MC detection of metabolites, free amino acids were derivatized (esterified) in accordance with the recommendations [46,47] with a solution of 3M HCl in n-butanol. For this, 500 μL of an equimolar solution of free amino acids was taken and dried under a vacuum at a temperature of 30 °C for 60 min. The dry residue of the mixture was reconstituted in 300 μL of a solution of 3 M HCl in n-butanol. A solution (1 mL) of 3 M HCl in n-butanol was prepared from 11 M HCl by mixing 257.70 µL of 11 M HCl and 742.30 µL of n-butanol (based on the density of the 11 M HCl solution equal to ρ = 1.179 g/cm3). The reaction mixture was incubated at 65 °C for 15 min with constant stirring at 1200 rpm. The excess n-butanol from the reaction mixture was removed by evaporation under a vacuum at a temperature of 30 °C for 40 min in V-AL mode. The resultant dry residue of esterified amino acids was reduced in 0.5 mL of a solution of 0.1% formic acid, 20% acetonitrile, and 0.02% heptaphorbutyric acid to the calculated concentrations of each esterified amino acid in the working solution of 1 mM/L.

2.5. Esterification of Carboxylic Acids

To analyze organic carboxylic acids, they were initially transformed into phenolate derivatives. This made it possible to carry out MS detection under the conditions of chromatographic separation on a C18 column of the stationary phase and with positive ionization. To carry out the process of esterification of carboxylic acids, an arbitrary sample of each acid was weighed and dissolved in a fixed volume (0.5 mL) of an aqueous solution of 0.05% formic acid (Supplementary Materials, Table S3). To compile an equimolar mixture of carboxylic acids in a volume of 1 mL, the molar concentration of the resulting solution and the required volume was calculated.
The resulting volumes of carboxylic acids were combined. The total volume of the mixture of carboxylic acids was 398 µL of the surrogate matrix (1% solution of human coagulation factor VIII). To obtain 1 mL of an equimolar solution of acids, 602 μL of an aqueous solution of 0.05% formic acid was added. The derivatives were obtained by reacting phenol in ethyl acetate with 3 M HCl at 65 °C for 20 min. The organic phase was then dried under a vacuum and resuspended in 0.1 M HCl; the total volume was adjusted to 1 mL.

2.6. Biological Samples

The study used biological samples of the primary human cell culture of normal lung epithelial cells (HLF) at 6 cell growth time points: 0 h, 24 h, 48 h, 72 h, 1, and 2 weeks. Cells were disrupted by sonication in two volumes of water. Thereafter, five volumes of methanol were added. The resulting suspension was evaporated under 30 °C, the dried pellet was resuspended in 0.1 M HCl, and the total volume was adjusted to 1 mL. The cell lines for the study described in the paper were provided by the National Medical Research Center of Oncology of the Ministry of Health of Russia. The work on the creation of primary cell lines from the tissues of patients was approved by the Local Ethics Committee of the National Medical Research Center of Oncology of the Ministry of Health of Russia, Protocol No. 6/1, dated 10 February 2020. All patients signed informed consent.

2.7. Conditions for Chromatographic Separation and Triple Quadrupole Mass Spectrometric Signal Detection

During the entire analysis, the samples were stored in an automated injector sampler at a temperature of 4 °C. The sampling rate was 80 μL/min, and the injection rate was 120 μL/min. The limit of the maximum operating pressure of the pump was 600 bar, flow rates, 0.3 mL/min, and flow acceleration with a gradient up to 100 μL/min. The mobile phases used for the chromatographic separation of the metabolites were as follows: mobile phase (A), 0.1% formic acid, 0.02% heptafluorobutyric acid aqueous solution; mobile phase (B), 0.1% formic acid, 0.02% heptafluorobutyric acid, 90% acetonitrile, 10% methanol. The method for the elution of amino acids from the stationary phase is presented in Table 3.
The total analysis time, including the time to equilibrate the chromatographic column, was 13.5 min. During the analysis, a flow rate was applied at 0.3 mL/min. During periodic washings of the chromatographic column, a gradient method was used to feed the mobile phase with a high content of acetonitrile and methanol (phase B). This approach made it possible not only to increase the washing rate of the chromatographic column but also to partially compensate for the consumption of the washing liquid.
When developing a method for detecting amino- and carboxylic acids in a biological matrix, a Jet Stream was used as an ionization source. The measurements were carried out under positive ionization conditions. The flow rate of the drying gas (nitrogen) was 14 L/min at 300 °C. The flow rate of the focusing gas (nitrogen) was 11 L/min at 280 °C. The voltage on the capillary was 3600 V, and the focusing voltage was 750 V. The potential of the fragmentor corresponded to 380 V, and the amplitude of the potential on the octapole was 750 V × (p/p). The threshold noise level for the frontal scan was 40 u (N), and the threshold noise level for the tandem scan was 45 u. The scanning range of the mass-charge quantities varied from 70 to 700 m/z. The isolation of protonated ions was carried out using a quadrupole mass filter with an isolation window width of 0.7 Th (±0.35 Th). The scanning speed in frontal mode was 2.14 spectra per second, the scanning speed in tandem mode was 4.97 spectra per second, and the total time of one complete scan cycle was 250 s.

2.8. Conditions for Chromatographic Separation and Quadrupole Time-of-Flight Mass Spectrometric Signal Detection

The analysis of the total metabolome fraction was conducted on a high-resolution quadrupole time-of-flight mass spectrometer Xevo G2-XS (Waters, Elstree, UK) equipped with a Z-spray electrostatic ionization source and operated in a positive ionization mode at a 2.8 kV capillary voltage and 17 V cone voltage offset to 23 V. The desolvation gas flow rate was adjusted to 600 L/h at a temperature of 375 °C, and the cone gas flow was 50 L/h at a temperature of 150 °C. A precursor ions survey was conducted in a sensitivity analyzer mode within the range of 50–700 m/z within 140 ms of the full duty cycle. Fragment ions were obtained after decomposition in the CID mode at collision energy ramping within 20–47 eV, using argon as a collision gas. The acquisition was supported with an active online calibration by the lock-mass at m/z = 556.27 (Leu-Enkephalin at 50 pg/µL) and at m/z = 309.11 (Warfarin at 250 pg/µL), which were both injected at a flow rate of 5 µL/min and acquired every 30 s with an isolation tolerance of 3 mDa.
The samples were separated using an Acquity H-Class UPLC system (Waters, Elstree, UK) and loaded in a volume of 5 µL onto an Acquity™ UPLC BEH C18 (2.1 × 50 mm, 1.7 µm particle size; Waters, Elstree, UK) column with the pre-installed in-line 0.2 µm filter at a flow rate of 0.3 mL/min. The column was heated at 50 °C. Samples were separated in a gradient of mobile phase A (water) and mobile phase B (acetonitrile), both supplied with 0.1% formic acid using the following gradient scheme: 0–2.5 min 3% of B, then raising the B to 17% at 4 min, before, raising the B to 60% at 5.7 min and rapid increasing of B to 97% at 6 min. The washing B was kept in the isocratic mode until 7.5 min at 0.45 mL/min flow rate, following a smooth decrease to the initial condition at 8.2 min and equilibration for the next 1.3 min at 0.3 mL/min.

3. Results

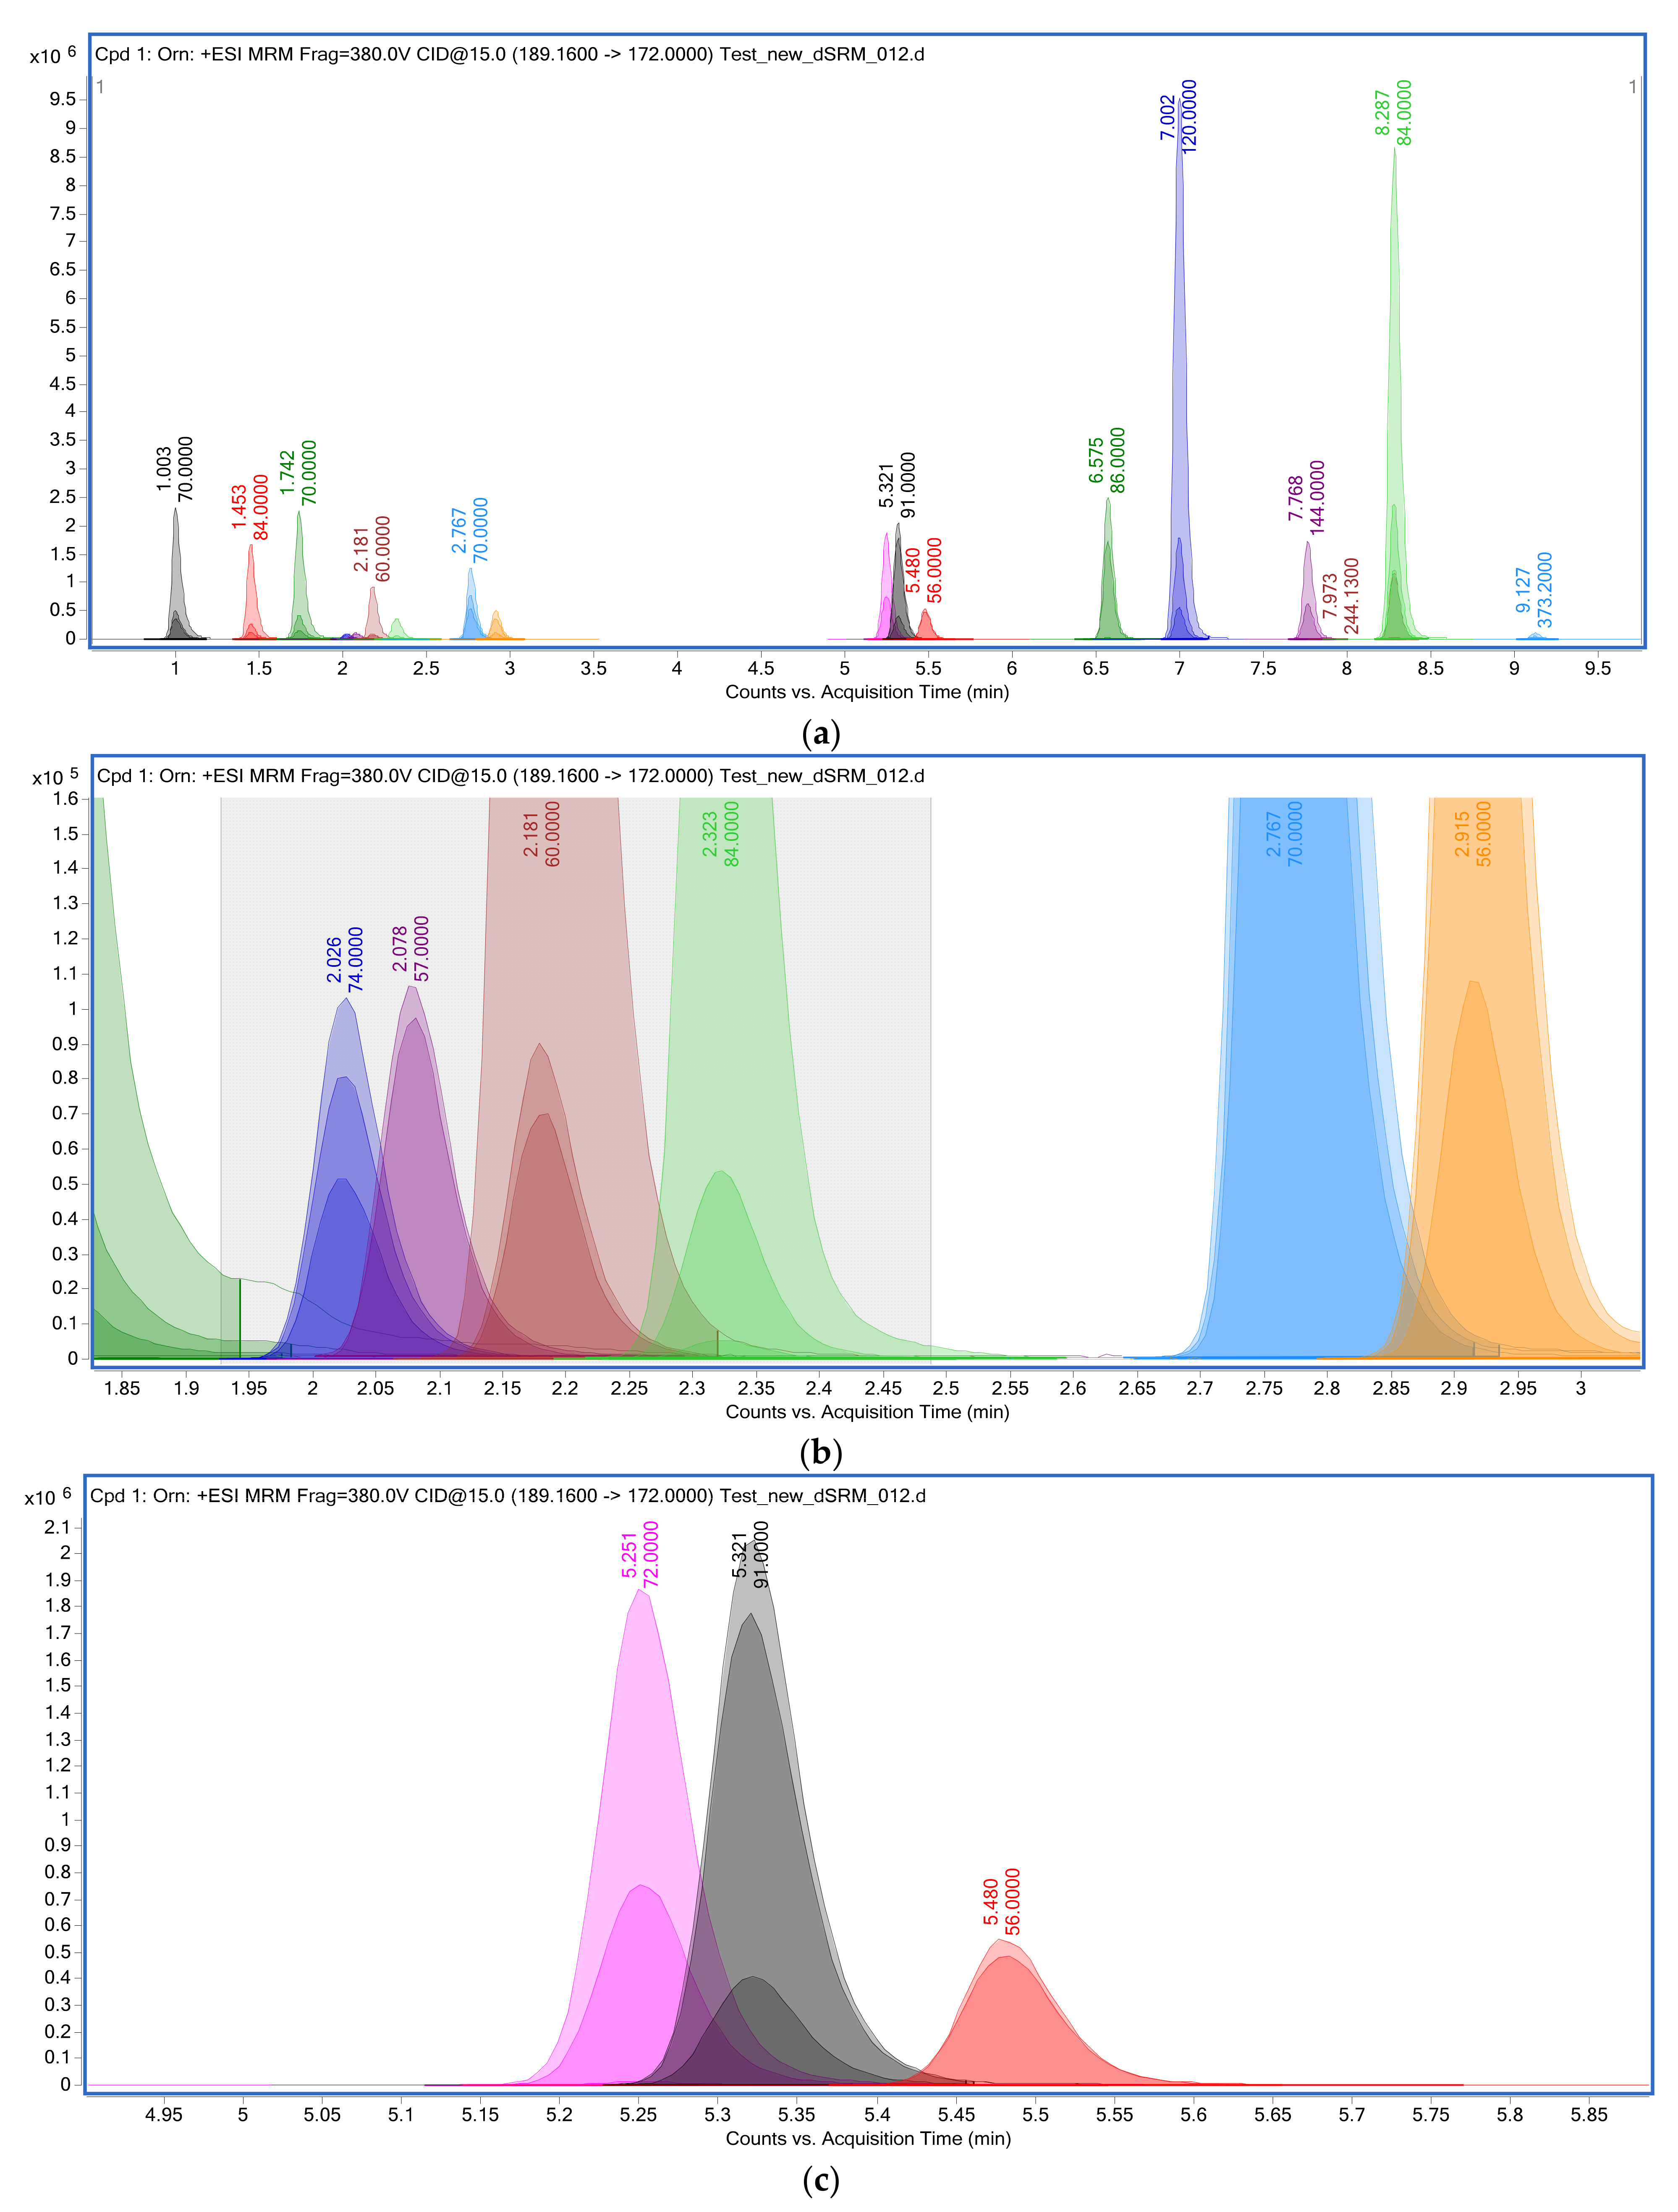
3.1. HPLC-MS/MS Measurements of Amino Acids and Their Derivatized Forms

In the developed procedure for determining amino acids on the HPLC-MS/MS platform, the esterified forms of metabolites were detected as monoisotopic ions with the ionic formula [M+H]+. The time of one complete scanning cycle was 0.325 s at a rate of 6.153 scans per second and took place in the frontal (MS1) scanning mode of mass-charge quantities in the range m/z 50–600 (Figure 1). The main chromatographic and MS characteristics of the protonated ions of esterified amino acids are presented in Table 4. Monoisotopic masses of amino acids are expressed in units of m/z and are corrected for the alkoxy group.
The limit of inter-experimental accuracy for the retention time in repeated assays (n = 5) ranged from 0.08% (minimum value, tyrosine) to 0.93% (maximum value, asparagine), which corresponds to the standards of retention time accuracy within ±1%. The linear range of the chromatographic peak areas in the equimolar mixture of esterified amino acids was 1,328,245 charges × sec. The average value of the full width of the chromatographic peak at half the maximum height was 5.82 ± 1.34 s.
The stability of the mixture of derivatized amino acids was evaluated. A solution with an equimolar concentration of 3 µmol/L contained in a temperature-controlled chamber of an autosampler at a constant temperature of 6 °C was tested. Peak areas were determined in five repetitions at 24, 72, and 96 h, respectively. A comparison of the obtained data was carried out with respect to the values of the areas of the peaks obtained in the analysis of the conditionally initial reference point of sample storage (T = 0) (Table 5).
According to the presented data, most of the amino acids, throughout the entire storage time, were highly stable. The maximum degradation was observed for methionine—34%, alanine—24%, tryptophan, and threonine—both by 17%. At the same time, in the case of alanine, losses of 13% were observed already after 24 h of storage. In the case of methionine and tryptophan, storage losses were most likely due to amino acid oxidation over time.
Table 6 shows the retention time on the column of the detected amino acids with a tolerance window of ± 0.3 min (18 s).
Despite the close retention time of some amino acids on the column, which differed by less than 0.1 min, almost all of them were successfully resolved. Thus, due to the resolution of the ion current in Table 6, the data obtained can be used for the quantitative analysis and construction of calibration curves.
Table 7 presents the characteristics of the calibration curves for the individual amino acids. Calibration curves were plotted by the equal current linear correlation using a weighting factor of 1/x or 1/x2. Moreover, for some amino acids, all seven concentration levels of calibration by 21 points were used. Calibration curves were constructed as a correlation between the relative signal response of the quantifier peak area of the measured amino acid and the expected amino acid concentration relative to the internal standard under the conditions of the presented calibration level.
An exception was made only for glutamic acid, where the calibration curve was built using five calibration levels and 15 points. The two upper concentration levels of 5 and 2.5 µmol/L were excluded from consideration since they reached the logarithmic saturation phase of the calibration curve and, thus, were the upper detection limit for the considered amino acid in Table 7.
The obtained calibration curves permit the quantitative analysis of amino acids to concentration levels of 0.4–1.0 ng/mL. At the same time, the lower limit of detection was not reached by any of the analyzed amino acids. The sensitivity of the quantitative method used made it possible to approximate the results at least in an order of magnitude below the achieved concentration limit from the calibration curve.

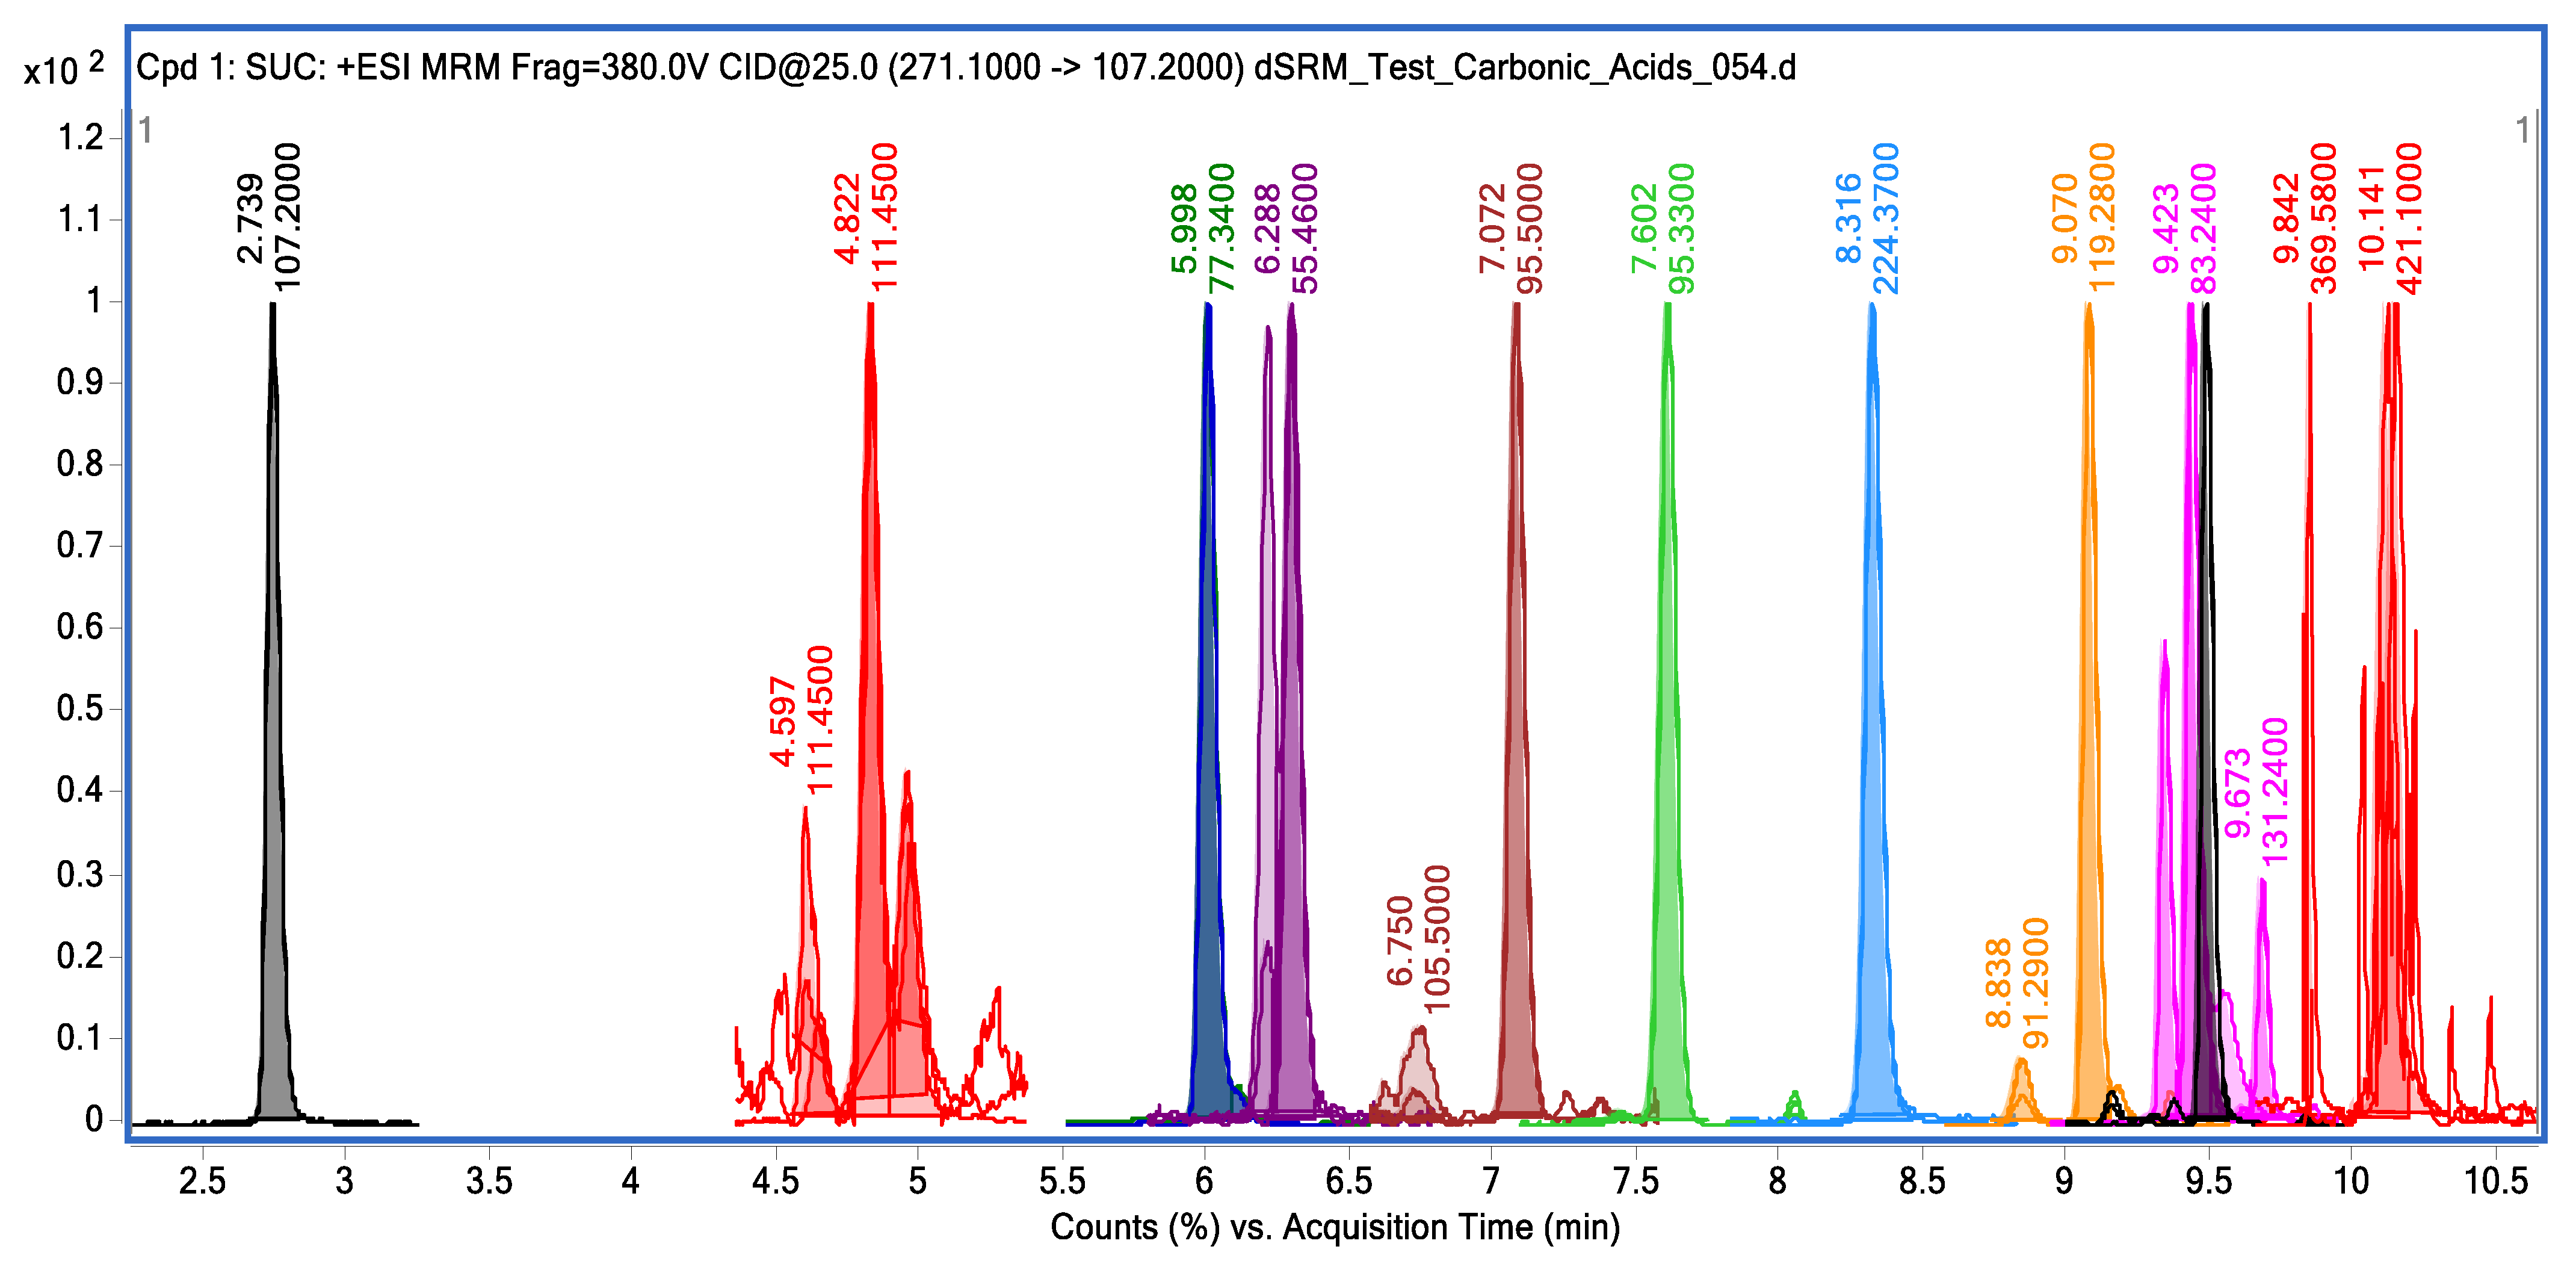
3.2. HPLC-MS/MS Measurements of Carboxylic Acids and Their Derivatized Forms

Table 8 presents the main chromatographic characteristics of the detected carboxylic acid derivatives with specific values of retention time on the column, relative retention time normalized to lactic acid, asymmetry factor, and peak width at half maximum height expressed in seconds. The m/z values that were empirically recorded for the analyzed carboxylic acids are also indicated. For citrate and isocitrate, m/z is indicated, corresponding to the substitution of one and three bases, respectively.
It follows from the data presented in Table 8 that all carboxylic acids, including isomers, were successfully separated by chromatography. The average value of the width of the chromatographic peak at half its maximum height was ω0.5 = 3.35 ± 0.49 s, which fully corresponds to and even exceeds the chromatographic resolution of the column, which was determined earlier when testing on a standard sample.

3.3. Development of Multi-Parameter Methods for Quantitative HPLC-MS/MS Monitoring of Multiple Reactions Analysis of Carboxylic Acids in Solution

For each of the carboxylic acids, the spectra of monoisotopic mass, decomposition by primary fragment ions with the ranking of activation energy, and adducts of target metabolites were obtained, if applicable to the conditions of the chromatographic separation. Figure 2 shows the chromatogram of carboxylic acid derivatives.
Table 9 shows the main characteristics of the calibration curves for each of the considered carboxylic acids. All calibration curves were fitted to a linear regression function within four orders of magnitude. The correlation coefficient for all the carboxylic acids presented varied within the linear range of the calibration curve from r2 = 0.9554, which was the minimum value for taurine over seven calibration levels, to r2 = 0.99 for the vast majority of the analyzed carboxylic acids.
Calibration curves are plotted over four orders of magnitude spanning seven calibration levels. Technical repetitions within the same calibration level were averaged if the standard deviation in the peak area of the quantifier ion did not exceed ± 10%. For succinic, lactic, malic acids, and taurine, calibration curves were drawn over six concentration points, excluding the upper end of the calibration curve.
From the data indicated in Table 9, it follows that there was no need to use a weight factor to construct the calibration curves for the studied carboxylic acids. The exceptions were isocitric acid and taurine, where for a more satisfactory correlation, a weighting factor 1/x was used; the correlation coefficients without using the factor 1/x were r2 = 0.9137 for isocitric acid and r2 = 0.8879 for taurine.

3.4. HPLC-MS Analysis of Metabolites in Cell Culture Samples

To assess the precision of the developed method when measuring the metabolites in a biological matrix, we conducted an analysis of the primary HLF and calculated the coefficients of variability (CV, %) for each metabolite in each cell sample (Table 10). A total of 42 metabolites were identified in HLF at six cell growth time points: 0 h, 24 h, 48 h, 72 h, 1, and 2 weeks (252 values). The measurements for each of the metabolites present in the table were carried out in two technical repetitions. The calculation of the CV values for two technical repetitions was carried out as described previously [48].
The CV of individual metabolites in the measurements ranged from 0 to 9.3%. The mean CV variability of all the measurements for six-cell growth points ranged from 2.7 to 3.4%. At the same time, the proportion of metabolites with a variability of 0–5% was 70–90%, and the proportion of metabolites with a variability of 5–10% was a smaller part (10–30%). It should be noted that the data on technical repetitions demonstrate an excellent result in terms of the accuracy of the presented analysis, where most of the measurements (up to 90%) had a variability below 5%. According to Gegner et al., CV ranges from 0 to 10% are considered excellent, 11–20% are considered good, 21–30% are considered acceptable, and >30% are not acceptable [49]. Other authors, regarding data on the accuracy of measurements of amino acids in biological samples, mentioned that the precision of similar measurements was in the range of 15% [50].
Thus, our results indicate a fairly high accuracy of the method developed by us and correspond to the concentration range of the same metabolites measured by the previously developed methods.

4. Discussion

The analysis of the content of free amino acids is associated with a number of difficulties. Due to the zwitterionic properties of amino acids and the rather wide range of the relative hydrophobicity of metabolites, it is extremely difficult to separate them using standard reverse phase chromatography. In many cases, it is necessary to use ion pair chromatography, the derivatization of free amino acids, esterification with butyl alcohol, or a combination of these two approaches [23,51]. The ion-pair chromatography of free non-derivatized amino acids or the reverse-phase chromatography of esterified amino acids does not provide a satisfactory separation or retention of polar amino acids in the stationary phase. In addition, such chromatography does not sufficiently separate amino acids from other organic compounds in the biological sample, resulting in the significant ion suppression of the signal. The esterification of carboxyl groups facilitates the process of protonation since, in this case, only the amino group remains, which is capable of ionization at given activation energies [51]. At the same time, chromatographic separation becomes more efficient due to a decrease in the hydrophilicity of the analyte due to the presence of a butyl ester group and the interaction of a negative ion-pair component in the mobile chromatographic phase with a positive charged free amino group of amino acids. In the case of keto acids or diketones, derivatization is carried out along the path of forming Schiff bases or hydrazone derivatives, after which esterification is carried out, in particular, with butanol in an acid medium.
This article presents the results of a quantitative analysis of derivatized forms of amino and carboxylic acids using chromato-mass spectrometry. We have adapted derivatization methods and created HPLC–MS/MS libraries of spectra for the compounds of amino acids and carboxylic acids on Q-TOF time-of-flight quadrupole MS, which are now available to interested researchers. Through the method of the dynamic monitoring of multiple reactions of the formation of dSRM fragments, a quantitative analysis of metabolites of interest in the range of 3–4 orders of concentration was carried out on a mass analyzer with a triple quadrupole QQQ. The main comparative characteristics of the methods for the detection of amino and carboxylic acids are shown in Table 11.
The permissible deviation of the concentration measurement accuracy for all the concentration points did not exceed σ = ±10% (limits from 90% to 110% in terms of the reproducibility of the chromatographic peak area, as a value reflecting the concentration of the measured analysis).
Analytical values were calculated according to the Protocols for the Determination of Limits of detection and Limit of Quantitation, Approved Guideline. CLSI document EP17. Wayne, PA USA: CLSI; 2004 [52].
Thus, lowering the signal detection limits and approximating the calibration curves below the achieved limits is inappropriate since the achieved sensitivity of the detection and quantification method is significantly lower than the actual physiological concentrations of free amino acids in biological samples. This feature of the method may be in demand, for example, for the analysis of biological samples in cases of critical limitation in the amount of tissue, for example, a biopsy. On the other hand, when analyzing foodstuffs, drinks, etc., it is desirable to identify compounds that may potentially have the ability to accumulate in organs and tissues. For example, ketoglutaramate in the lactam form is not metabolized and, for the most part, is not excreted from the body. The accumulation of this metabolite is observed in some cases of neuropathology and other diseases [53,54].
For both the carboxylic acids and amino acids considered in this work, the lowest detection limit was not reached. At the same time, the expediency of such an approach is not obvious since the physiological levels of the analyzed carboxylic acids are within the approximated calibration curves. To refine the quantitative data, it would be reasonable to approximate the concentrations of the calibration points within the presented range, with a dilution of 1:2.
For the analyzed acids, the value of the signal-to-noise ratio SNR at the lower level of the calibration curve significantly exceeded the SNR > 5 limits set in the “Signal Identification Criteria”. The minimum signal-to-noise level was recorded for lactate. At the bottom of the calibration curve, corresponding to 0.046 mg/L (0.5 μM) lactate, SNR = 279.84 is the average of the three technical repetitions, calculated as the root mean square within ±0.3 min from the apex of the chromatographic peak.
A significant excess of the actual level of signal-to-noise over the maximum allowable values at the lower points of the calibration curve indirectly testify in favor of the calibration approximation potential by 2–3 orders of a magnitude lower than the achieved signal detection limits.

5. Limitations

The proposed method may require the additional purification of the sample during its pre-treatment before analysis in order to minimize or completely eliminate the possible interference or cross-reactivity with compounds possessing similar properties. On the one hand, similar to other label-free methods, this approach is slightly less accurate than methods that use internal standards with stable isotopes, but the calculated concentrations of amino acids and carboxylic acids fall within the expected concentration range. On the other hand, incomplete derivatization, or incomplete recovery after derivatization, especially for carboxylic acids, can lead to a possible overrepresentation of isobaric compounds. Thus, these reactions require optimization and control to maintain the specificity and the formation of by-products.

6. Conclusions

This study presents HPLC-MS/MS methods for the qualitative and quantitative analysis of the levels of endogenous metabolites, amino acids, and carboxylic acids, as well as individual metabolites of the urea and methionine cycles. The presented method of analysis, which is characterized by high accuracy, was developed to determine the physiological levels of important metabolites in the studied solutions. Together with QQQ multiparametric detection methods, libraries for the spectra of analyzed compounds obtained on a Q-TOF time-of-flight quadrupole mass spectrometer are presented. The method of quantitative analysis includes the concentration of the analyzed metabolites in the range of 3-4 orders. The effective chromatographic resolution of endogenous metabolites occurs in a short, ~13 min interval. The calibration curves of the analyzed compounds are highly stable over the entire concentration range and have the potential to be approximated to concentration ranges below the empirical ones.

Supplementary Materials

The following supporting information can be downloaded at: https://www.mdpi.com/article/10.3390/metabo13010016/s1, Table S1: List of standards. Table S2. Equimolar solutions of amino acids *. Table S3. Equimolar solution (1 mmol/L) of carboxylic acids. Table S4. Quantitative HPLC-MS/MS measurements of amino- and carboxylic acids in duplicates obtained from samples of primary human lung fibroblasts (HLF) cell culture. Unit of measurement, μM, or 10–6 M. N/D—non-detectable.

Author Contributions

Conceptualization, A.L.K., A.T.K. and Y.I.S.; methodology, A.T.K.; software, A.A.S.; validation, formal analysis, and data curation, K.A.M., A.A.I. and A.A.S.; writing—original draft preparation, A.L.K. and Y.I.S.; writing—review and editing, A.L.K., A.T.K., Y.I.S. and B.F.K.; supervision, project administration, and funding acquisition, B.F.K. All authors have read and agreed to the published version of the manuscript.

Funding

This research was funded by FMBA RF., grant number 388-00154-22-00.

Institutional Review Board Statement

The study was conducted in accordance with the Declaration of Helsinki, and was approved by the Local Ethics Committee of the National Medical Research Center of Oncology of the Ministry of Health of Russia, Protocol No. 6/1, dated 10 February 2020.

Informed Consent Statement

Not applicable.

Data Availability Statement

The data presented in this study are available in article and Supplementary Material.

Conflicts of Interest

The authors declare no conflict of interest.

References

  1. Chace, D.H.; Lim, T.; Hansen, C.R.; Adam, B.W.; Hannon, W.H. Quantification of Malonylcarnitine in Dried Blood Spots by Use of MS/MS Varies by Stable Isotope Internal Standard Composition. Clin. Chim. Acta Int. J. Clin. Chem. 2009, 402, 14–18. [Google Scholar] [CrossRef] [PubMed]
  2. Chace, D.H. Mass Spectrometry in Newborn and Metabolic Screening: Historical Perspective and Future Directions. J. Mass Spectrom. JMS 2009, 44, 163–170. [Google Scholar] [CrossRef] [PubMed]
  3. Chace, D.H.; Millington, D.S.; Terada, N.; Kahler, S.G.; Roe, C.R.; Hofman, L.F. Rapid Diagnosis of Phenylketonuria by Quantitative Analysis for Phenylalanine and Tyrosine in Neonatal Blood Spots by Tandem Mass Spectrometry. Clin. Chem. 1993, 39, 66–71. [Google Scholar] [CrossRef]
  4. Chace, D.H.; Hillman, S.L.; Van Hove, J.L.; Naylor, E.W. Rapid Diagnosis of MCAD Deficiency: Quantitative Analysis of Octanoylcarnitine and Other Acylcarnitines in Newborn Blood Spots by Tandem Mass Spectrometry. Clin. Chem. 1997, 43, 2106–2113. [Google Scholar] [CrossRef] [PubMed]
  5. Chace, D.H.; Pons, R.; Chiriboga, C.A.; McMahon, D.J.; Tein, I.; Naylor, E.W.; De Vivo, D.C. Neonatal Blood Carnitine Concentrations: Normative Data by Electrospray Tandem Mass Spectometry. Pediatr. Res. 2003, 53, 823–829. [Google Scholar] [CrossRef] [PubMed] [Green Version]
  6. American College of Medical Genetics Newborn Screening Expert Group. Newborn Screening: Toward a Uniform Screening Panel and System—Executive Summary. Pediatrics 2006, 117 Pt 2, S296–S307. [Google Scholar] [CrossRef] [Green Version]
  7. Chalmers, R.A.; Lawson, A.M. Organic Acids in Man: Analytical Chemistry, Biochemistry, and Diagnosis of the Organic Acidurias; Chapman and Hall: London, UK; New York, NY, USA, 1982. [Google Scholar]
  8. Lehotay, D.C.; Clarke, J.T. Organic Acidurias and Related Abnormalities. Crit. Rev. Clin. Lab. Sci. 1995, 32, 377–429. [Google Scholar] [CrossRef]
  9. APHL. Guidance for Laboratory Biomonitoring Programs; APHL: Silver Spring, MD, USA; p. 103.
  10. Blau, N.; Duran, M.; Blaskovics, M.E.; Gibson, K.M. (Eds.) Physician’s Guide to the Laboratory Diagnosis of Metabolic Diseases; Springer: Berlin/Heidelberg, Germany, 2003. [Google Scholar]
  11. Søvik, O. Inborn Errors of Amino Acid and Fatty Acid Metabolism with Hypoglycemia as a Major Clinical Manifestation. Acta Paediatr. Scand. 1989, 78, 161–170. [Google Scholar] [CrossRef]
  12. Gallagher, R.C.; Pollard, L.; Scott, A.I.; Huguenin, S.; Goodman, S.; Sun, Q. Laboratory Analysis of Organic Acids, 2018 Update: A Technical Standard of the American College of Medical Genetics and Genomics (ACMG). Genet. Med. 2018, 20, 683–691. [Google Scholar] [CrossRef]
  13. Iwase, H.; Ozawa, S.; Ikuta, M.; Ono, I. Determination of Amino Acids in Human Plasma by Liquid Chromatography with Postcolumn Ninhydrin Derivatization Using a Hydroxyapatite Cartridge for Precolumn Deproteination. J. Chromatogr. B Biomed. Appl. 1995, 663, 15–24. [Google Scholar] [CrossRef]
  14. Armstrong, M.; Jonscher, K.; Reisdorph, N.A. Analysis of 25 Underivatized Amino Acids in Human Plasma Using Ion-Pairing Reversed-Phase Liquid Chromatography/Time-of-Flight Mass Spectrometry. Rapid Commun. Mass Spectrom. RCM 2007, 21, 2717–2726. [Google Scholar] [CrossRef] [PubMed]
  15. Dietzen, D.J.; Weindel, A.L.; Carayannopoulos, M.O.; Landt, M.; Normansell, E.T.; Reimschisel, T.E.; Smith, C.H. Rapid Comprehensive Amino Acid Analysis by Liquid Chromatography/Tandem Mass Spectrometry: Comparison to Cation Exchange with Post-Column Ninhydrin Detection. Rapid Commun. Mass Spectrom. RCM 2008, 22, 3481–3488. [Google Scholar] [CrossRef] [PubMed]
  16. Casetta, B.; Tagliacozzi, D.; Shushan, B.; Federici, G. Development of a Method for Rapid Quantitation of Amino Acids by Liquid Chromatography-Tandem Mass Spectrometry (LC-MSMS) in Plasma. Clin. Chem. Lab. Med. 2000, 38, 391–401. [Google Scholar] [CrossRef] [PubMed]
  17. Kaspar, H.; Dettmer, K.; Gronwald, W.; Oefner, P.J. Advances in Amino Acid Analysis. Anal. Bioanal. Chem. 2009, 393, 445–452. [Google Scholar] [CrossRef] [PubMed]
  18. Wu, G.; Meininger, C.J. Analysis of Citrulline, Arginine, and Methylarginines Using High-Performance Liquid Chromatography. Methods Enzymol. 2008, 440, 177–189. [Google Scholar] [CrossRef]
  19. Shurubor, Y.I.; Cooper, A.J.L.; Isakova, E.P.; Deryabina, Y.I.; Beal, M.F.; Krasnikov, B.F. Simultaneous Determination of Tricarboxylic Acid Cycle Metabolites by High-Performance Liquid Chromatography with Ultraviolet Detection. Anal. Biochem. 2016, 503, 8–10. [Google Scholar] [CrossRef]
  20. Le, A.; Ng, A.; Kwan, T.; Cusmano-Ozog, K.; Cowan, T.M. A Rapid, Sensitive Method for Quantitative Analysis of Underivatized Amino Acids by Liquid Chromatography–Tandem Mass Spectrometry (LC–MS/MS). J. Chromatogr. B 2014, 944, 166–174. [Google Scholar] [CrossRef]
  21. Kambhampati, S.; Li, J.; Evans, B.S.; Allen, D.K. Accurate and Efficient Amino Acid Analysis for Protein Quantification Using Hydrophilic Interaction Chromatography Coupled Tandem Mass Spectrometry. Plant Methods 2019, 15, 46. [Google Scholar] [CrossRef] [Green Version]
  22. Liu, Z.; Tu, M.-J.; Zhang, C.; Jilek, J.L.; Zhang, Q.-Y.; Yu, A.-M. A Reliable LC-MS/MS Method for the Quantification of Natural Amino Acids in Mouse Plasma: Method Validation and Application to a Study on Amino Acid Dynamics during Hepatocellular Carcinoma Progression. J. Chromatogr. B Analyt. Technol. Biomed. Life. Sci. 2019, 1124, 72–81. [Google Scholar] [CrossRef]
  23. Phipps, W.S.; Crossley, E.; Boriack, R.; Jones, P.M.; Patel, K. Quantitative Amino Acid Analysis by Liquid Chromatography-tandem Mass Spectrometry Using Low Cost Derivatization and an Automated Liquid Handler. JIMD Rep. 2019, 51, 62–69. [Google Scholar] [CrossRef]
  24. Song, C.; Zhang, S.; Ji, Z.; Li, Y.; You, J. Accurate Determination of Amino Acids in Serum Samples by Liquid Chromatography–Tandem Mass Spectrometry Using a Stable Isotope Labeling Strategy. J. Chromatogr. Sci. 2015, 53, 1536–1541. [Google Scholar] [CrossRef] [PubMed] [Green Version]
  25. Davies, S.M.; Linforth, R.S.; Wilkinson, S.J.; Smart, K.A.; Cook, D.J. Rapid Analysis of Formic Acid, Acetic Acid, and Furfural in Pretreated Wheat Straw Hydrolysates and Ethanol in a Bioethanol Fermentation Using Atmospheric Pressure Chemical Ionisation Mass Spectrometry. Biotechnol. Biofuels 2011, 4, 28. [Google Scholar] [CrossRef] [PubMed] [Green Version]
  26. Sharma, L.N.; Becker, C.; Chambliss, C.K. Analytical Characterization of Fermentation Inhibitors in Biomass Pretreatment Samples Using Liquid Chromatography, UV-Visible Spectroscopy, and Tandem Mass Spectrometry. Methods Mol. Biol. Clifton NJ 2009, 581, 125–143. [Google Scholar] [CrossRef]
  27. Kerem, Z.; Bravdo, B.-A.; Shoseyov, O.; Tugendhaft, Y. Rapid Liquid Chromatography-Ultraviolet Determination of Organic Acids and Phenolic Compounds in Red Wine and Must. J. Chromatogr. A 2004, 1052, 211–215. [Google Scholar] [CrossRef] [PubMed]
  28. Scarlata, C.J.; Hyman, D.A. Development and Validation of a Fast High Pressure Liquid Chromatography Method for the Analysis of Lignocellulosic Biomass Hydrolysis and Fermentation Products. J. Chromatogr. A 2010, 1217, 2082–2087. [Google Scholar] [CrossRef]
  29. Sluiter, A.; Hames, B.; Ruiz, R.; Scarlata, C.; Sluiter, J.; Templeton, D.; Crocker, D. Determination of Structural Carbohydrates and Lignin in Biomass. 2012. Available online: http://www.nrel.gov/biomass/analytical_procedures.html (accessed on 13 September 2022).
  30. Chen, Z.; Kim, K.-R.; Owens, G.; Naidu, R. Determination of Carboxylic Acids from Plant Root Exudates by Ion Exclusion Chromatography with ESI-MS. Chromatographia 2008, 67, 113–117. [Google Scholar] [CrossRef]
  31. Gamoh, K.; Saitoh, H.; Wada, H. Improved Liquid Chromatography/Mass Spectrometric Analysis of Low Molecular Weight Carboxylic Acids by Ion Exclusion Separation with Electrospray Ionization. Rapid Commun. Mass Spectrom. RCM 2003, 17, 685–689. [Google Scholar] [CrossRef]
  32. Flores, P.; Hellín, P.; Fenoll, J. Determination of Organic Acids in Fruits and Vegetables by Liquid Chromatography with Tandem-Mass Spectrometr. Food Chem. 2012, 132, 1049–1054. [Google Scholar] [CrossRef]
  33. Olson, K.C.; Chen, G.; Lynch, C.J. Quantification of Branched-Chain Keto Acids in Tissue by Ultra Fast Liquid Chromatography–Mass Spectrometry. Anal. Biochem. 2013, 439, 116–122. [Google Scholar] [CrossRef] [Green Version]
  34. Michopoulos, F.; Whalley, N.; Theodoridis, G.; Wilson, I.D.; Dunkley, T.P.J.; Critchlow, S.E. Targeted Profiling of Polar Intracellular Metabolites Using Ion-Pair-High Performance Liquid Chromatography and -Ultra High Performance Liquid Chromatography Coupled to Tandem Mass Spectrometry: Applications to Serum, Urine and Tissue Extracts. J. Chromatogr. A 2014, 1349, 60–68. [Google Scholar] [CrossRef]
  35. Guo, L.; Worth, A.J.; Mesaros, C.; Snyder, N.W.; Glickson, J.D.; Blair, I.A. Diisopropylethylamine/Hexafluoroisopropanol-Mediated Ion-Pairing UHPLC-MS for Phosphate and Carboxylate Metabolite Analysis: Utility for Studying Cellular Metabolism. Rapid Commun. Mass Spectrom. RCM 2016, 30, 1835–1845. [Google Scholar] [CrossRef] [PubMed] [Green Version]
  36. Nemkov, T.; Sun, K.; Reisz, J.A.; Yoshida, T.; Dunham, A.; Wen, E.Y.; Wen, A.Q.; Roach, R.C.; Hansen, K.C.; Xia, Y.; et al. Metabolism of Citrate and Other Carboxylic Acids in Erythrocytes As a Function of Oxygen Saturation and Refrigerated Storage. Front. Med. 2017, 4, 175. [Google Scholar] [CrossRef] [PubMed]
  37. Buescher, J.M.; Moco, S.; Sauer, U.; Zamboni, N. Ultrahigh Performance Liquid Chromatography-Tandem Mass Spectrometry Method for Fast and Robust Quantification of Anionic and Aromatic Metabolites. Anal. Chem. 2010, 82, 4403–4412. [Google Scholar] [CrossRef] [PubMed]
  38. Development of a New LC-MS/MS Method for the Quantification of Keto Acids. Available online: https://www.jstage.jst.go.jp/article/jpchrom/35/3/35_2014.017/_article (accessed on 13 September 2022).
  39. Dietzen, D.J.; Rinaldo, P.; Whitley, R.J.; Rhead, W.J.; Hannon, W.H.; Garg, U.C.; Lo, S.F.; Bennett, M.J. National Academy of Clinical Biochemistry Laboratory Medicine Practice Guidelines: Follow-up Testing for Metabolic Disease Identified by Expanded Newborn Screening Using Tandem Mass Spectrometry; Executive Summary. Clin. Chem. 2009, 55, 1615–1626. [Google Scholar] [CrossRef] [PubMed] [Green Version]
  40. Peters, V.; Garbade, S.F.; Langhans, C.D.; Hoffmann, G.F.; Pollitt, R.J.; Downing, M.; Bonham, J.R. Qualitative Urinary Organic Acid Analysis: Methodological Approaches and Performance. J. Inherit. Metab. Dis. 2008, 31, 690–696. [Google Scholar] [CrossRef]
  41. Hoffmann, G.; Aramaki, S.; Blum-Hoffmann, E.; Nyhan, W.; Sweetman, L.; Hoffmann, G.; Aramaki, S.; Blum-Hoffmann, E.; Nyhan, W.L.; Sweetman, L. Quantitative Analysis for Organic Acids in Biological Samples: Batch Isolation Followed by Gas Chromatographic-Mass Spectrometric Analysis. Clin Chem 35: 587-595. Clin. Chem. 1989, 35, 587–595. [Google Scholar] [CrossRef]
  42. Chen, S.-F.; Mowery, R.A.; Castleberry, V.A.; van Walsum, G.P.; Chambliss, C.K. High-Performance Liquid Chromatography Method for Simultaneous Determination of Aliphatic Acid, Aromatic Acid and Neutral Degradation Products in Biomass Pretreatment Hydrolysates. J. Chromatogr. A 2006, 1104, 54–61. [Google Scholar] [CrossRef]
  43. Du, B.; Sharma, L.N.; Becker, C.; Chen, S.-F.; Mowery, R.A.; van Walsum, G.P.; Chambliss, C.K. Effect of Varying Feedstock-Pretreatment Chemistry Combinations on the Formation and Accumulation of Potentially Inhibitory Degradation Products in Biomass Hydrolysates. Biotechnol. Bioeng. 2010, 107, 430–440. [Google Scholar] [CrossRef]
  44. Goodman, S.I.; Markey, S.P. Diagnosis of Organic Acidemias by Gas Chromatography--Mass Spectrometry. Lab. Res. Methods Biol. Med. 1981, 6, 1–158. [Google Scholar]
  45. Peters, V.; Bonham, J.R.; Hoffmann, G.F.; Scott, C.; Langhans, C.-D. Qualitative Urinary Organic Acid Analysis: 10 Years of Quality Assurance. J. Inherit. Metab. Dis. 2016, 39, 683–687. [Google Scholar] [CrossRef]
  46. Turgeon, C.; Magera, M.J.; Allard, P.; Tortorelli, S.; Gavrilov, D.; Oglesbee, D.; Raymond, K.; Rinaldo, P.; Matern, D. Combined Newborn Screening for Succinylacetone, Amino Acids, and Acylcarnitines in Dried Blood Spots. Clin. Chem. 2008, 54, 657–664. [Google Scholar] [CrossRef] [PubMed]
  47. Rashed, M.S.; Ozand, P.T.; Bucknall, M.P.; Little, D. Diagnosis of Inborn Errors of Metabolism from Blood Spots by Acylcarnitines and Amino Acids Profiling Using Automated Electrospray Tandem Mass Spectrometry. Pediatr. Res. 1995, 38, 324–331. [Google Scholar] [CrossRef] [PubMed] [Green Version]
  48. Shurubor, Y.I.; Matson, W.R.; Willett, W.C.; Hankinson, S.E.; Kristal, B.S. Biological Variability Dominates and Influences Analytical Variance in HPLC-ECD Studies of the Human Plasma Metabolome. BMC Clin. Pathol. 2007, 7, 9. [Google Scholar] [CrossRef] [PubMed] [Green Version]
  49. Gegner, H.M.; Mechtel, N.; Heidenreich, E.; Wirth, A.; Cortizo, F.G.; Bennewitz, K.; Fleming, T.; Andresen, C.; Freichel, M.; Teleman, A.A.; et al. Deep Metabolic Profiling Assessment of Tissue Extraction Protocols for Three Model Organisms. Front. Chem. 2022, 10, 869732. [Google Scholar] [CrossRef] [PubMed]
  50. Chilakala, S.; Mehtab, V.; Tallapally, M.; Vemula, M.; Shaikh, A.S.; Chenna, S.; Upadhyayula, V. SEC-MS/MS Determination of Amino Acids from Mango Fruits and Application of the Method for Studying Amino Acid Perturbations Due to Post Harvest Ripening. LWT 2021, 138, 110680. [Google Scholar] [CrossRef]
  51. Piraud, M.; Vianey-Saban, C.; Petritis, K.; Elfakir, C.; Steghens, J.-P.; Bouchu, D. Ion-Pairing Reversed-Phase Liquid Chromatography/Electrospray Ionization Mass Spectrometric Analysis of 76 Underivatized Amino Acids of Biological Interest: A New Tool for the Diagnosis of Inherited Disorders of Amino Acid Metabolism. Rapid Commun. Mass Spectrom. 2005, 19, 1587–1602. [Google Scholar] [CrossRef] [PubMed]
  52. Browne, R.; Whitcomb, B. Procedures for Determination of Detection Limits: Application to High-Performance Liquid Chromatography Analysis of Fat-Soluble Vitamins in Human Serum. Epidemiology 2010. [Google Scholar] [CrossRef]
  53. Cooper, A.J.L.; Kuhara, T. α-Ketoglutaramate: An Overlooked Metabolite of Glutamine and a Biomarker for Hepatic Encephalopathy and Inborn Errors of the Urea Cycle. Metab. Brain Dis. 2014, 29, 991–1006. [Google Scholar] [CrossRef] [Green Version]
  54. Kuhara, T.; Akiyama, T.; Ohse, M.; Koike, T.; Shibasaki, J.; Imai, K.; Cooper, A.L. Identification of New Biomarkers of Pyridoxine-Dependent Epilepsy by GC/MS-Based Urine Metabolomics. Anal. Biochem. 2020, 604, 113739. [Google Scholar] [CrossRef]
Figure 1. Chromatogram of esterified amino acids by isolated XIC/EIC ion current under detection conditions by monitoring multiple reactions of the formation of SRM fragment ions. Top panel (a) shows a general view of the chromatogram in the metabolite separation interval from 0 to 9.5 min. Middle panel (b) shows an enlarged gradient region from 1.9 to 2.5 min, corresponding to column retention times of asparagine RT = 2.026 min, glycine RT = 2.078 min, serine RT = 2.181 min, and glutamine RT = 2.323 min. The lower panel (c) shows an enlarged section of the gradient interval from 4.95 to 5.8 min, corresponding to the retention time on the column of valine RT = 5.251 min, tyrosine RT = 5.321 min, and methionine RT = 5.480 min.
Metabolites 13 00016 g001
Figure 2. Chromatographic separation of derivatives of carboxylic acids. The specific retention times for each of the carboxylic acid derivatives on the column are shown in Table 8. The peak of lactic acid, in relation to which the retention time on the column was normalized, is indicated in the figure in red, with a retention time of 4.822 min.
Metabolites 13 00016 g002
Table 1. Comparative analysis of HPCL-MS/MS approaches for quantitative detection of amino acids in biological samples.
No.Number of CompoundsType of Sample *MethodAnalysis, MinMethod FeaturesLLOD (μM)LLOQ (μM)Ref.
133PlasmaLC-QQQ **150.01-2.50.01–10[20]
220Protein components of plantLC-QLIT ***813C/15N-labeled standard0.1–110.12–35[21]
328Serum, plasma, urine, cerebral spinal fluid, and dried blood spot2D-LC-MS/MS15PGC-LC ****≤0.1[20]
420Mouse plasmaLC-QQQ1313C/15N-labeled standard0.1–3[22]
526Plasma, urine, cerebral spinal fluidLC-QQQ11ATRAQ *****2.5–10[23]
66SerumLC-QQQ110.001–0.00250.003–0.007[24]
Type of sample *—what type of biomaterial is the approach intended for; QQQ **—triple quad mass spectrometer; QLIT ***—quadrupole-linear ion trap; PGC-LC ****—porous graphitized carbon-liquid chromatography; ATRAQ *****—kit for amino acid analysis of physiological fluids with amine-reactive isotope-coded tags.
Table 2. Comparative analysis of HPCL-MS/MS approaches for quantitative detection of carboxylic acids in blood samples.
No.Number of CompoundsType of Sample *MethodAnalysis, MinMethod FeaturesLLOD (μM)LLOQ (μM)Ref.
13Mouse tissueLC-QTOF **613C-labeled standard0.005[33]
230Cell culture media, cell extracts, tissue extracts, blood, urineLC-QQQ ***21HILIC ****<5[34]
359Human melanoma cellsLC-QQQ2013C/15N-labeled standard[35]
47Human red blood cellLC-Orbitrap>1013C-labeled standard[36]
510 (total 138 metabolites)YeastLC-QQQ360.001–3.7[37]
610Rat plasmaLC-QQQ21.50.01–0.250.01–0.1[38]
Type of sample *—what type of biomaterial is the approach intended for; QTOF **—quadrupole time-of-flight; QQQ ***—triple quad mass spectrometer; HILIC ****—hydrophilic interaction chromatography.
Table 3. Scheme of the elution of amino acids from a chromatographic column Zorbax RRHD Eclipse Plus C18.
Time, Min% A% BFlow Rate, µL/Min
00.09820.30
01.79820.30
02.285120.30
06.073270.30
07.855450.30
09.055450.30
11.02980.30
12.52980.30
12.730700.30
13.09820.30
13.59820.30
Table 4. Chromatographic characteristics of derivatized amino acids obtained using time-of-flight quadrupole MS.
AAChromatographic Characteristics *m/z
RT, MinFWHM, sAsA, cnts × s
Orn1.0034.611.13666771222
Ala1.0913.121.08189398146
Lys1.5484.121.061195030146
Arg1.8466.150.871109451260
Gly2.1287.391.891515129212
Asn2.1385.470.91286435162
Ser2.2996.390.75832514174
Gln2.4683.121.081054774132
Cit2.7477.190.83894130188
Thr3.0276.241.191604746206
Val5.4168.730.911391872246
Tyr5.5215.911.09972054203
Met5.6376.391.23366957231
Ile6.4996.380.917682444188
Leu6.6118.060.84276501176
Phe6.9965.151.011180098172
Asp7.8844.891.211168386189
Trp8.2784.220.88410052238
Glu8.3525.691.69695427203
* Amino acids are presented in ascending order of retention time (RT). The value of the mass charge state (m/z) is given for a monoprotonated ion (all amino acids). The peak width is given to half the maximum height of the chromatographic peak (FWHM). The area is equal to the product of the peak width (As) and the number of elementary unit charges per sec (A).
Table 5. Degradation of derivatized amino acids in solution when stored at 6 °C for 24, 72, and 96 h. Data obtained using time-of-flight quadrupole MS *.
AAT = 24 hT = 72 hT = 96 hDegradation, %
Ala0.870.810.7624
Lys1.0210.991
Arg1.060.970.946
Asn10.940.919
Gly10.980.955
Ser1.030.990.982
Gln0.970.960.937
Thr0.940.890.8317
Val0.990.980.955
Tyr0.950.920.910
Met0.90.740.6634
Leu1.010.920.946
Phe1.091.0210
Asp0.970.940.8812
Trp0.920.880.8317
Glu0.970.920.910
His0.930.920.946
Pro1.10.970.973
* The areas are normalized to the initial storage conditions of the working solution. Amino acids are presented in ascending order of retention time.
Table 6. Chromatographic mobility of esterified amino acids obtained using triple quadrupole MS. Amino acids are presented in ascending order of retention time.
AAParent Ion, m/zRetention Time, MinChromatographic Peak HeightPeak Width at Half Maximum, MinChromatographic Peak Area
Orn189.161.0032,328,7610.0609,761,179
Ala146.101.0892,134,8940.0678,632,169
Lys203.171.4531,660,0290.0576,460,292
Arg231.181.7422,262,7810.0619,666,924
Asn189.122.026103,2350.058408,153
Gly1322.078105,5930.061427,161
Ser162.112.181925,4780.0593,700,371
Gln203.142.323369,8000.0651,619,872
Cit232.162.7671,250,9330.0595,037,170
Thr176.132.915512,8540.0602,088,165
Val174.155.2511,864,3560.0617,702,974
Tyr238.145.3212,051,9760.0628,525,253
Met206.125.480546,4990.0652,375,335
Leu188.166.5752,486,6170.06410,641,134
Phe222.147.0029,538,2210.07446,234,568
Asp246.177.7681,722,7000.0647,551,718
Trp261.168.2851,146,9790.0705,360,110
Glu260.188.2878,682,0200.07241,459,023
Bet393.219.127107,1090.066464,904
Table 7. Characteristics of the calibration curves of the analyzed amino acids obtained using triple quadrupole MS. Calibration curves were built by equal correlation within seven concentration levels, in three technical repetitions for each of the levels for glutamic acid, five concentration levels were used, except for two upper limit levels. Amino acids are presented in ascending order of retention time.
AAk

Slope Tangent
b
Vertical Offset
r2
Correlation Coefficient
w
Weight Factor
p
Number of Points
L
Number of Concentration Levels
Orn0.0116690.0028590.9975-217
Ala0.0871330.0256490.9931-217
Lys0.2642270.0544830.99871/x217
Arg0.3016520.5899950.98761/x217
Asn0.0184440.0023250.9994-217
Gly0.0363220.0136240.97311/x2217
Ser0.2125490.1512020.9989-217
Gln0.2611270.1352190.9985-217
Cit0.0244550.0421020.99651/x217
Thr0.1026440.0597080.99431/x217
Val0.3735630.2775020.98301/x217
Tyr0.2918990.2609010.98831/x217
Met0.0930680.0737790.99181/x217
Leu0.4574840.7686800.95131/x217
Phe0.9631746.4739940.86251/x2217
Asp0.3587170.3122860.97961/x217
Trp0.0000450.0004400.9687-217
Glu2.3991920.9211440.97341/x2155
Table 8. Chromatographic characteristics of carboxylic acids detected as a result of triple quadrupole MS analysis. Carboxylic acids are presented in ascending order of retention time (RT).
Carboxylic AcidChromatographic Characteristics *m/z
RT, MinFWHM, sAsA, cnts × s
Succinic acid2.72.940.8855,540165.05
Lactic acid4.84.081.1114,045225.05
Pyruvic acid6.03.420.931,152,626202.05
Oxaloacetic acid6.33.720.9431,212285.1
Isocitric acid7.13.601.1232,330421.15
Taurine7.63.781.08228,750271.1
Citric acid8.33.721.07277,775269.05
α-Ketomethylbutyric acid9.12.880.971,226,6593179.05
α-Ketomethythiolbutyric acid9.42.581.09473,609193.28
Malic acid9.52.581.01278,520167.05
Fumaric acid10.13.421.11126,475165.05
* The value of the mass charge state (m/z) is given for a monoprotonated ion (all carboxylic acids). The peak width is given to half the maximum height of the chromatographic peak (FWHM). The area is equal to the product of the peak width (As) and the number of elementary unit charges per sec (A).
Table 9. Characteristics of the calibration curves for the analyzed carboxylic acids obtained using triple quadrupole MS. Carboxylic acids are presented in ascending order of retention time.
Carboxylic Acidk
Slope Tangent
b
Vertical Offset
r2
Correlation Coefficient
w
Weight Factor
p
Number of Points
L
Number of Concentration Levels
Succinic acid302.981654.20.9915-186
Lactic acid73.3121298.80.9667-186
Pyruvic acid693.445815.80.9964-217
Oxaloacetic acid156.492739.60.9866-217
Isocitric acid145.06181600.96021/x217
Taurine124.7233.6360.95541/x186
Citric acid165.171424.20.9990-217
α-Ketobutyric acid217.541266.10.9987-217
α-Ketomethylbutyric acid640.31160270.9781-217
α-Ketomethythiolbutyric acid265.231639.40.9976-217
Malic acid155.421391.50.9820-186
Fumaric acid561.544880.00.9959-217
Table 10. Quantitative measurements of amino- and carboxylic acids obtained using time-of-flight quadrupole MS from samples of primary human lung fibroblast cell cultures in two technical replications. Unit of measurement, μM, or 10–6 M, N/D—non-detectable. Amino acids and carboxylic acids are presented in ascending order of retention time. (For complete data, see Supplementary Materials, Table S4).
Primary Human Lung Fibroblast Cell Cultures
Metabolite0 h24 h48 h72 h1 Week2 Weeks
Mean ± SDCV,%Mean ± SDCV,%Mean ± SDCV,%Mean ± SDCV,%Mean ± SDCV,%Mean ± SDCV,%
Amino acids
Ornithine1.19 ± 0.000.2410.49 ± 0.373.553.74 ± 0.020.591.29 ± 0.021.272.04 ± 0.083.847.44 ± 0.273.58
Alanine2.10 ± 0.031.452.79 ± 0.103.451.25 ± 0.000.173.69 ± 0.041.021.36 ± 0.021.451.25 ± 0.021.64
Lysine12.24 ± 0.524.2715.18 ± 0.090.5814.11 ± 0.000.0317.47 ± 1.488.4413.72 ± 0.805.836.25 ± 0.050.80
Arginine19.25 ± 0.201.0523.52 ± 0.050.2020.34 ± 0.060.2916.84 ± 0.060.3817.07 ± 0.432.5420.97 ± 0.492.35
Asparagine18.67 ± 0.231.2223.75 ± 2.289.5920.21 ± 0.693.4316.76 ± 0.472.7916.83 ± 1.277.5219.06 ± 0.251.31
Glycine11.13 ± 0.030.2412.88 ± 0.685.275.45 ± 0.132.397.65 ± 0.283.645.13 ± 0.091.681.13 ± 0.075.90
Serine9.64 ± 0.757.8110.62 ± 0.494.669.16 ± 0.171.846.72 ± 0.253.765.97 ± 0.020.365.25 ± 0.397.47
Glutamine54.14 ± 2.314.2750.12 ± 2.234.4557.38 ± 4.006.9844.28 ± 1.894.2849.33 ± 3.707.4949.34 ± 3.958.01
Citrulline0.03 ± 0.006.530.06 ± 0.018.840.05 ± 0.006.870.02 ± 0.003.010.05 ± 0.008.160.10 ± 0.018.49
Threonine11.58 ± 1.089.3213.51 ± 0.906.6313.86 ± 0.564.0513.28 ± 0.151.1514.27 ± 0.332.3414.87 ± 0.080.56
Valine1.45 ± 0.032.151.72 ± 0.042.221.71 ± 0.021.201.59 ± 0.032.181.56 ± 0.032.171.47 ± 0.063.84
Tyrosine3.24 ± 0.092.823.77 ± 0.205.374.11 ± 0.081.984.71 ± 0.040.804.64 ± 0.010.154.41 ± 0.276.04
Methionine (sulfoxide)1.39 ± 0.032.041.22 ± 0.032.270.91 ± 0.022.491.00 ± 0.010.785.93 ± 0.345.703.84 ± 0.030.88
Selenomethionine0.71 ± 0.022.182.49 ± 0.062.503.03 ± 0.144.485.62 ± 0.101.776.37 ± 0.000.023.99 ± 0.133.14
Leucine10.02 ± 0.343.3710.31 ± 0.656.3310.28 ± 0.181.7810.10 ± 0.020.248.99 ± 0.606.728.26 ± 0.404.88
Isoleucine10.21 ± 0.080.7511.20 ± 0.615.4410.86 ± 0.645.8610.09 ± 0.000.029.80 ± 0.535.468.74 ± 0.283.15
Phenylalanine2.13 ± 0.198.992.48 ± 0.093.622.44 ± 0.052.062.70 ± 0.145.152.71 ± 0.155.702.60 ± 0.103.84
Aspartate7.79 ± 0.658.328.00 ± 0.253.175.83 ± 0.142.415.45 ± 0.366.604.49 ± 0.368.045.39 ± 0.163.03
Tryptophane0.60 ± 0.000.820.59 ± 0.011.810.73 ± 0.022.150.62 ± 0.034.460.73 ± 0.068.460.75 ± 0.044.92
Glutamate5.46 ± 0.244.3911.50 ± 0.201.769.63 ± 0.192.008.93 ± 0.050.528.72 ± 0.455.198.73 ± 0.192.15
Betaine1.46 ± 0.042.861.67 ± 0.105.961.66 ± 0.053.191.49 ± 0.117.221.51 ± 0.042.821.37 ± 0.086.02
Cysteine (sulfonate)4.91 ± 0.285.633.86 ± 0.195.005.01 ± 0.112.183.57 ± 0.030.893.12 ± 0.154.723.27 ± 0.268.02
Glutathione (oxidized)0.07 ± 0.001.080.59 ± 0.035.370.66 ± 0.011.830.98 ± 0.033.520.22 ± 0.000.980.65 ± 0.022.51
Proline5.65 ± 0.010.166.79 ± 0.314.505.58 ± 0.305.408.75 ± 0.616.946.30 ± 0.091.417.97 ± 0.141.70
Histidine (2-oxo-)1.93 ± 0.073.882.61 ± 0.165.982.38 ± 0.072.962.54 ± 0.103.802.00 ± 0.042.181.47 ± 0.074.43
Carboxylic acids
Succinic acid0.46 ± 0.012.620.79 ± 0.011.080.18 ± 0.002.820.14 ± 0.003.141.62 ± 0.031.620.25 ± 0.002.00
Lactic acid20.02 ± 0.371.877.92 ± 0.212.685.83 ± 0.061.086.47 ± 0.081.2718.45 ± 0.593.228.43 ± 0.283.36
Pyruvic acid1.09 ± 0.021.430.16 ± 0.015.240.18 ± 0.001.620.05 ± 0.001.402.13 ± 0.010.370.17 ± 0.000.42
Oxaloacetic acid1.84 ± 0.010.581.68 ± 0.031.810.41 ± 0.000.000.07 ± 0.003.143.07 ± 0.062.000.20 ± 0.000.00
Isocitric acid0.003 ± 0.000.000.01 ± 0.000.000.001 ± 0.000.000.001 ± 0.000.000.11 ± 0.001.250.001 ± 0.000.00
Taurine0.02 ± 0.002.890.03 ± 0.000.000.09 ± 0.004.880.07 ± 0.000.000.07 ± 0.002.080.12 ± 0.003.03
Citric acid0.02 ± 0.000.00N/DN/DN/DN/D0.001 ± 0.000.000.39 ± 0.000.73N/DN/D
α-Ketobutyric acid0.45 ± 0.000.630.31 ± 0.000.230.33 ± 0.011.930.36 ± 0.011.950.75 ± 0.011.330.57 ± 0.000.37
α-Ketomethylbutyric acid0.34 ± 0.024.560.21 ± 0.016.060.15 ± 0.002.290.04 ± 0.001.840.71 ± 0.011.700.05 ± 0.004.29
α-Ketomethylselenobutyric acidN/DN/D0.06 ± 0.003.450.18 ± 0.014.430.28 ± 0.013.300.07 ± 0.003.870.19 ± 0.014.19
α-Ketoglutaramic acid0.18 ± 0.002.770.03 ± 0.002.110.42 ± 0.024.712.53 ± 0.155.920.01 ± 0.000.001.74 ± 0.042.12
α-Ketoglutaric acid0.001 ± 0.000.000.00 ± 0.000.000.03 ± 0.004.880.002 ± 0.000.000.001 ± 0.000.000.001 ± 0.000.00
Malic acid0.21 ± 0.013.020.40 ± 0.000.880.02 ± 0.003.630.01 ± 0.000.002.08 ± 0.083.940.01 ± 0.000.00
Fumaric acid1.93 ± 0.021.100.58 ± 0.011.330.13 ± 0.000.000.10 ± 0.003.631.50 ± 0.000.280.53 ± 0.011.74
cis-Aconitic acid0.004 ± 0.000.000.03 ± 0.002.320.03 ± 0.000.000.08 ± 0.000.940.02 ± 0.000.000.07 ± 0.001.99
CoA4.11 ± 0.030.694.55 ± 0.010.224.83 ± 0.020.483.54 ± 0.154.244.46 ± 0.051.174.59 ± 0.020.35
acetyl-CoA0.04 ± 0.001.750.78 ± 0.011.910.90 ± 0.000.321.06 ± 0.010.800.83 ± 0.033.251.68 ± 0.074.09
Average CV, %0.45 ± 0.000.630.31 ± 0.000.230.33 ± 0.011.930.36 ± 0.011.950.75 ± 0.011.330.57 ± 0.000.37
CV, ≥10% 0 0 0 0 0 0
CV, 5–10% 15 29 10 14 26 17
CV, 0–5% 85 71 90 86 74 83
Table 11. The main characteristics of the detection of signals of amino and carboxylic acids by the developed chromato-mass-spectrometric methods, based on the use of a mass analyzer with a triple quadrupole.
ParametersAmino AcidsCarboxylic Acids
Peak asymmetry1.096 ± 0.2771.028 ± 0.065
Peak width at half height, s5.601 ± 1.5263.338 ± 0.513
Retention time deviation, %L01 * 0.08 µM99.28 ± 3.19108.81 ± 2.50
L04 0.63 µM103.22 ± 4.07101.42 ± 3.12
L07 5.00 µM97.58 ± 2.6598.16 ± 2.19
Minimum SNR for L014437279.84
Detection limit **<4.8 nM<0.5 μM
Estimated detection limit **0.17 nM7 nM
Analysis time, minutes13.512
* L01, L04, L07—calibration levels total seven points; ** calculations made for alanine and lactate.
Disclaimer/Publisher’s Note: The statements, opinions and data contained in all publications are solely those of the individual author(s) and contributor(s) and not of MDPI and/or the editor(s). MDPI and/or the editor(s) disclaim responsibility for any injury to people or property resulting from any ideas, methods, instructions or products referred to in the content.

