


Investigation of Chemical Composition and Biological Activities of Ajuga pyramidalis—Isolation of Iridoids and Phenylethanoid Glycosides
 , , , ,
Abstract
:
1. Introduction
2. Materials and Methods
2.1. General Experimental Procedures
2.2. Plant Collection and Preparation
2.3. Extraction Methodologies
2.4. Lipid Fraction Quantifications
2.5. Free Amino Acids Quantification
2.6. Chromatographic Conditions
2.6.1. HPLC Method for Free Amino Acids Quantification
2.6.2. HPLC Method for Carbohydrates Quantification
2.6.3. GC Method for Lipids Quantification
2.6.4. HPLC Method for Organic Acids Quantification
2.6.5. HPLC Method for Iridoids, Phenolic and Terpenic Derivatives Quantification and for Inter- and Intra-Species Studies
2.7. Derivatization of Harpagoside and Cristallographic Experiments
2.7.1. Derivatization of Harpagoside
2.7.2. Cristallographic Experiments
2.8. Biological Activities
2.8.1. Cells
2.8.2. Tyrosinase Activity Assay
2.8.3. Viability Assay
2.8.4. IL-8 Secretion Assay
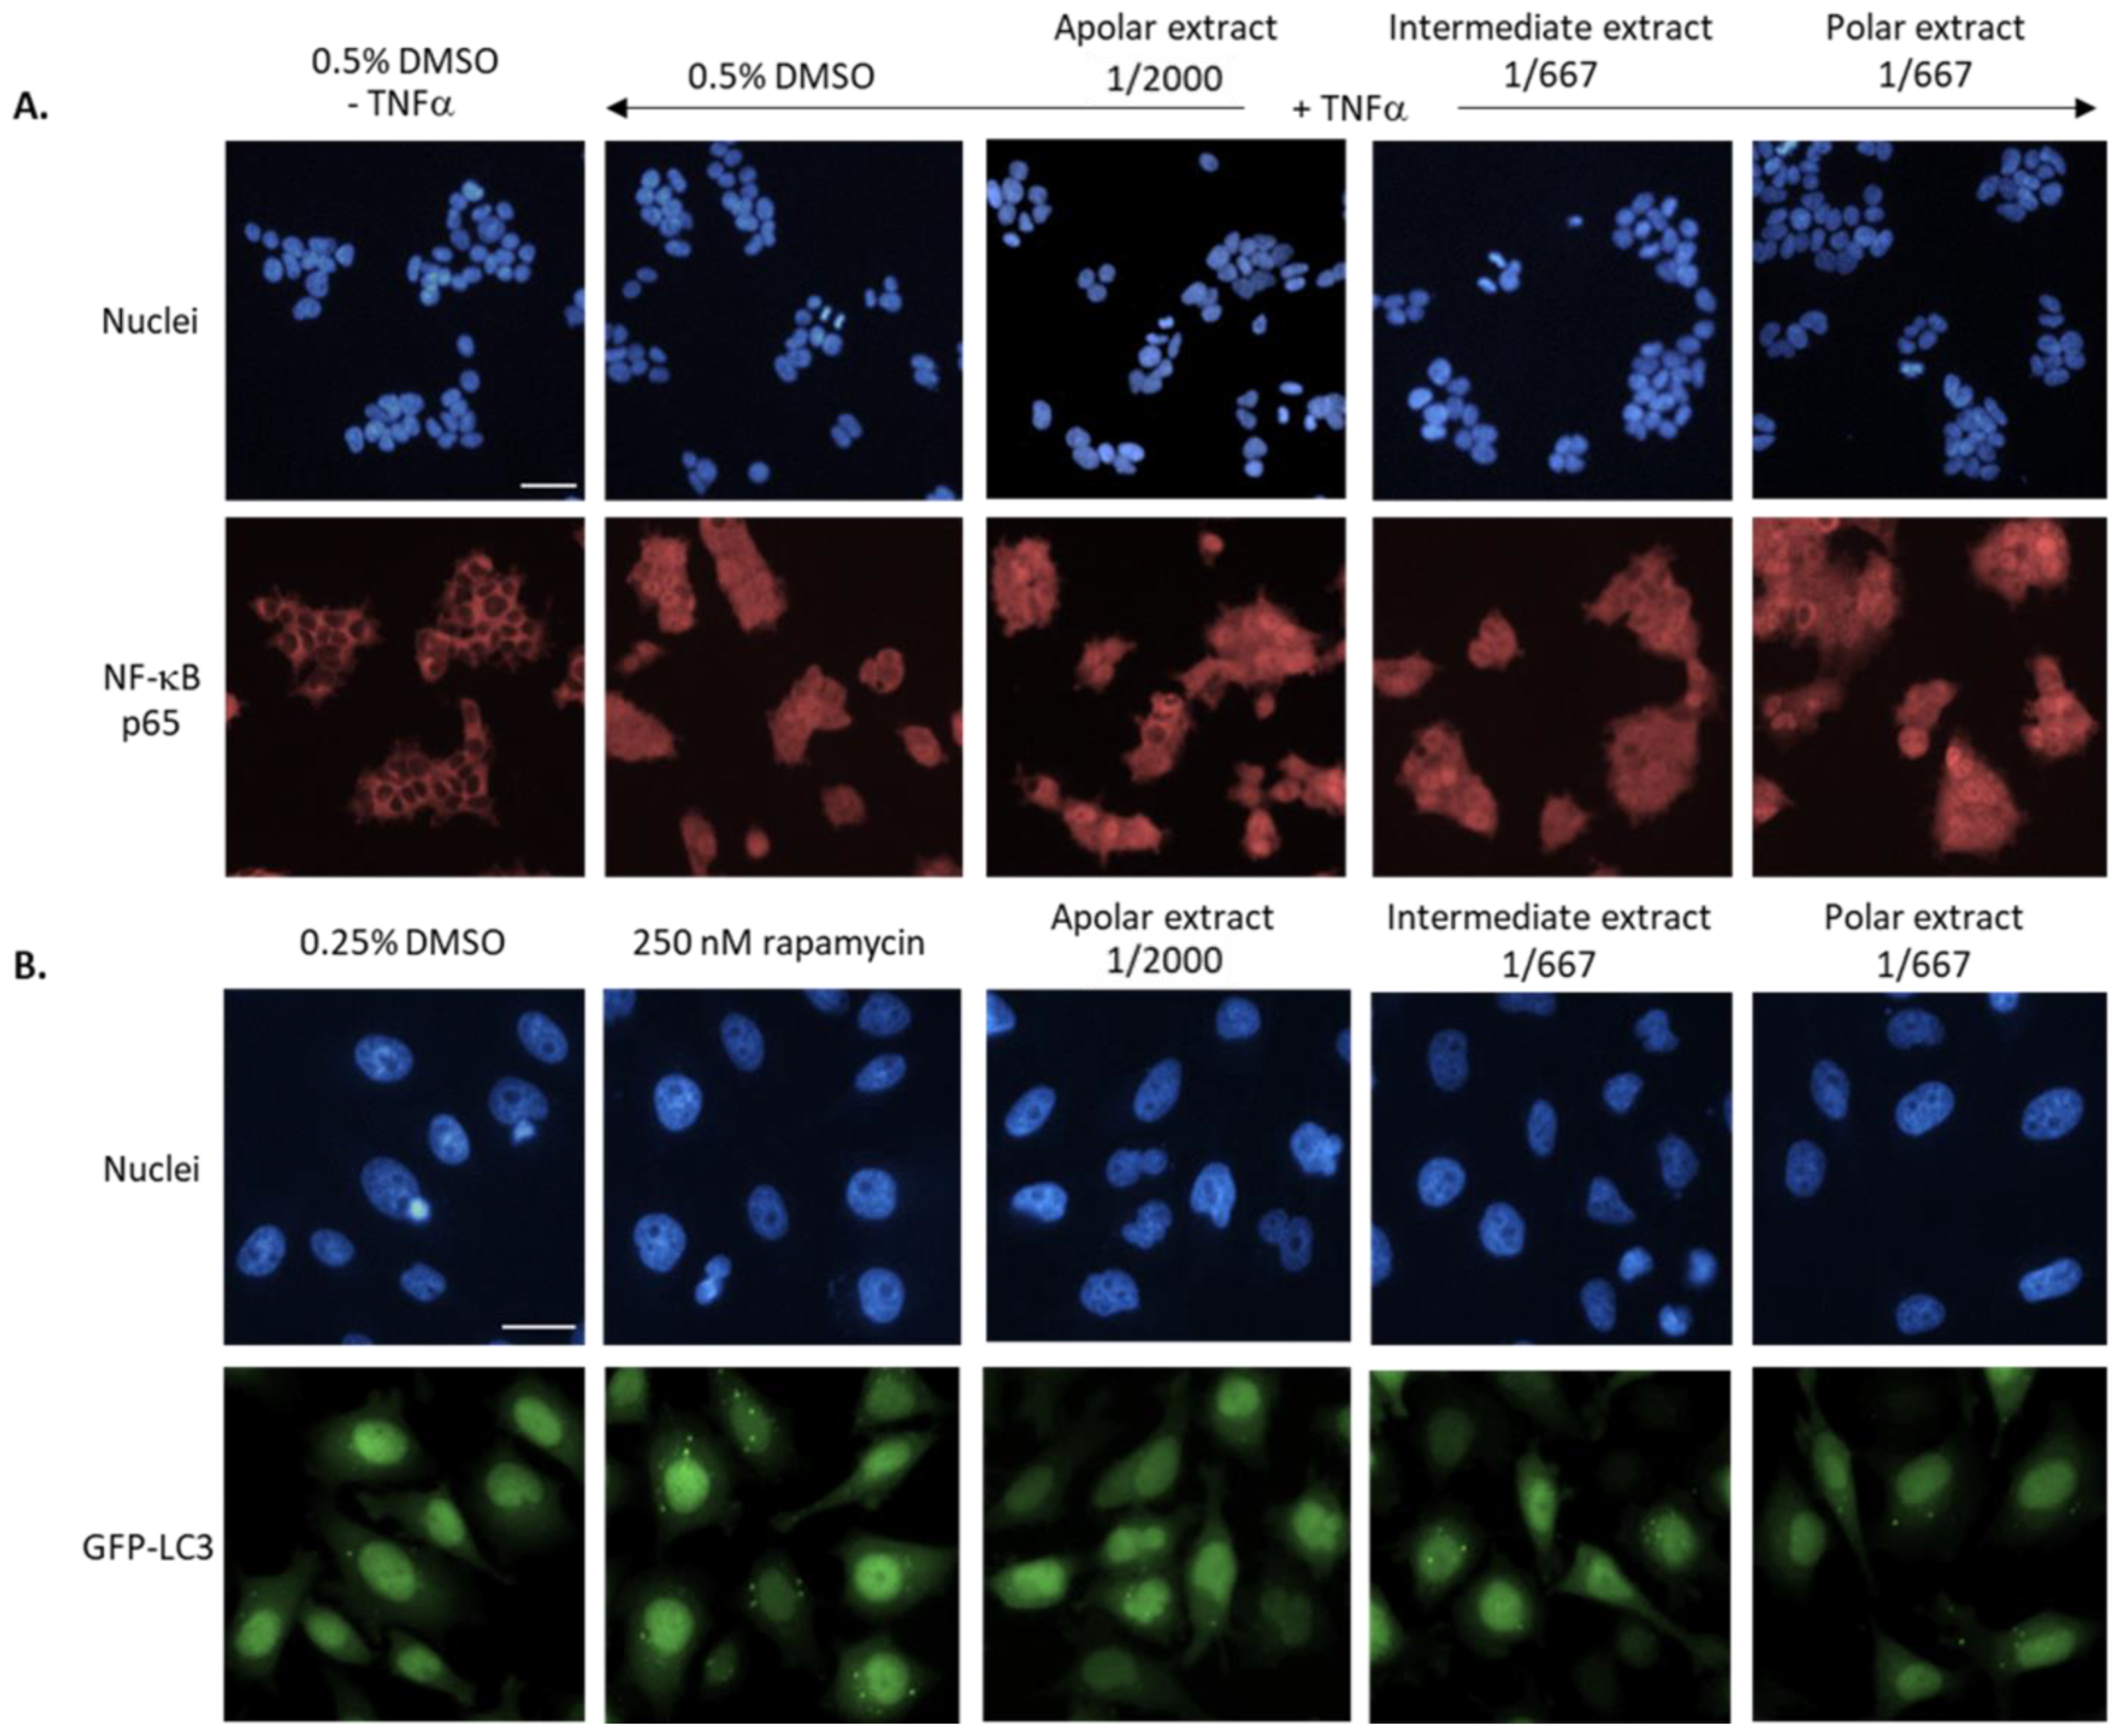
2.8.5. NF-κB Nuclear Translocation Quantification
2.8.6. Autophagy Quantification
3. Results and Discussion
3.1. Quantitative Chemical Composition of A. pyramidalis
3.1.1. Preparation of the Extracts, Preliminary Studies and Primary Metabolites Quantification
3.1.2. Secondary Metabolite Studies
3.1.3. Global Composition of A. pyramidalis
3.2. Isolation, Purification and Structural Characterization of Iridoids and Polyphenol Derivatives
3.3. Biological Studies
3.3.1. Biological Evaluation of the Three Extracts
3.3.2. Epidermal Renewal Evaluation
3.4. Complementary Exploration: Intra- and Inter-Species Studies
3.4.1. Intra-Species Studies
3.4.2. Inter-Species Study
4. Conclusions
Supplementary Materials
Author Contributions
Funding
Institutional Review Board Statement
Informed Consent Statement
Data Availability Statement
Acknowledgments
Conflicts of Interest
References
- Li, P.; Qi, Z.-C.; Liu, L.-X.; Ohi-Toma, T.; Lee, J.; Hsieh, T.-H.; Fu, C.-X.; Cameron, K.M.; Qiu, Y.-X. Molecular phylogenetics and biogeography of the mint tribe Elsholtzieae (Nepetoideae, Lamiaceae), with an emphasis on its diversification in East Asia. Sci. Rep. 2017, 7, 2057. [Google Scholar] [CrossRef] [PubMed] [Green Version]
- Kozłowska, M.; Laudy, A.E.; Przybył, J.; Ziarno, M.; Majewska, E. Chemical composition and antibacterial activity of some medicinal plants from lamiaceae family. Acta Pol. Pharm. 2015, 72, 757–767. [Google Scholar] [PubMed]
- Li, B.; Cantino, P.D.; Olmstead, R.G.; Bramley, G.L.C.; Xiang, C.-L.; Ma, Z.-H.; Tan, Y.-H.; Zhang, D.-X. A large-scale chloroplast phylogeny of the Lamiaceae sheds new light on its subfamilial classification. Sci. Rep. 2016, 6, 34343. [Google Scholar] [CrossRef] [Green Version]
- Li, B.; Olmstead, R.G. Two new subfamilies in Lamiaceae. Phytotaxa 2017, 313, 222. [Google Scholar] [CrossRef]
- Xiang, C.-L.; Zhao, F.; Cantino, P.D.; Drew, B.T.; Li, B.; Liu, E.-D.; Soltis, D.E.; Soltis, P.S.; Peng, H. Molecular systematics of Caryopteris (Lamiaceae) and its allies with reference to the molecular phylogeny of subfamily Ajugoideae. Taxon 2018, 67, 376–394. [Google Scholar] [CrossRef]
- Köse, Y.B.; Mutlu, M.B.; Küçük, S. Phylogenetic Relationships of Some Ajuga L. Taxa Based on the Ribosomal DNA Internal Transcribed Spacer Region. Rom. Biotechnol. Lett. 2018, 23, 13249–13254. [Google Scholar]
- Luan, F.; Han, K.; Li, M.; Zhang, T.; Liu, D.; Yu, L.; Lv, H. Ethnomedicinal Uses, Phytochemistry, Pharmacology, and Toxicology of Species from the Genus Ajuga L.: A Systematic Review. Am. J. Chin. Med. 2019, 47, 959–1003. [Google Scholar] [CrossRef]
- Qing, X.; Yan, H.-M.; Ni, Z.-Y.; Vavricka, C.J.; Zhang, M.-L.; Shi, Q.-W.; Gu, Y.-C.; Kiyota, H. Chemical and pharmacological research on the plants from genus Ajuga. Heterocycl. Commun. 2017, 23, 245–268. [Google Scholar] [CrossRef] [Green Version]
- Tafesse, T.B.; Hymete, A.; Mekonnen, Y.; Tadesse, M. Antidiabetic activity and phytochemical screening of extracts of the leaves of Ajuga remota Benth on alloxan-induced diabetic mice. BMC Complement. Altern. Med. 2017, 17, 243. [Google Scholar] [CrossRef] [Green Version]
- Bouyahya, A.; El Omari, N.; Elmenyiy, N.; Guaouguaou, F.E.; Balahbib, A.; El-Shazly, M.; Chamkhi, I. Ethnomedicinal use, phytochemistry, pharmacology, and toxicology of Ajuga iva (L.) schreb. J. Ethnopharmacol. 2020, 258, 112875. [Google Scholar] [CrossRef]
- Yousaf, T.; Rafique, S.; Wahid, F.; Rehman, S.; Nazir, A.; Rafique, J.; Aslam, K.; Shabir, G.; Shah, S.M. Phytochemical profiling and antiviral activity of Ajuga bracteosa, Ajuga parviflora, Berberis lycium and Citrus lemon against Hepatitis C Virus. Microb. Pathog. 2018, 118, 154–158. [Google Scholar] [CrossRef] [PubMed]
- Krippel, Y.; Thommes, P. Ajuga pyramidalis L. (Lamiaceae) au Luxembourg: Répartition, menaces, conservation. Bull. Soc. Nat. Luxemb. 2015, 117, 17–25. [Google Scholar]
- Nagarkoti, K.; Kanyal, J.; Prakash, O.; Kumar, R.; Rawat, D.S.; Pant, A.K. Ajuga L.: A Systematic Review on Chemical Composition, Phytopharmacological and Biological Potential. CBC 2021, 17, e010621189843. [Google Scholar] [CrossRef]
- Boneva, I.M.; Malakov, P.Y.; Papanov, G.Y. Ajugapyrin A, a neo-clerodane diterpene from Ajuga pyramidalis. Phytochemistry 1998, 47, 303–305. [Google Scholar] [CrossRef]
- Hostettmann, K.; Hostettmann-Kaldas, M.; Sticher, O. Application of droplet counter-current chromatography to the isolation of natural products. J. Chromatogr. A 1979, 186, 529–534. [Google Scholar] [CrossRef]
- Bozov, P.I.; Penchev, P.N.; Coll, J. Neo -Clerodane Diterpenoids from Scutellaria galericulata. Nat. Prod. Commun. 2014, 9, 1934578X1400900. [Google Scholar] [CrossRef] [Green Version]
- Frezza, C.; Venditti, A.; Serafini, M.; Bianco, A. Phytochemistry, Chemotaxonomy, Ethnopharmacology, and Nutraceutics of Lamiaceae. In Studies in Natural Products Chemistry; Elsevier: Amsterdam, The Netherlands, 2019; Volume 62, pp. 125–178. [Google Scholar] [CrossRef]
- Gori, A.; Boucherle, B.; Rey, A.; Rome, M.; Fuzzati, N.; Peuchmaur, M. Development of an innovative maceration technique to optimize extraction and phase partition of natural products. Fitoterapia 2021, 148, 104798. [Google Scholar] [CrossRef]
- Fürst, P.; Pollack, L.; Graser, T.A.; Godel, H.; Stehle, P. Appraisal of four pre-column derivatization methods for the high-performance liquid chromatographic determination of free amino acids in biological materials. J. Chromatogr. A 1990, 499, 557–569. [Google Scholar] [CrossRef]
- Cooper, J.D.H.; Turnell, D.C.; Green, B.; Demarais, D.; Rasquin, P. The Analysis of Primary and Secondary Free Amino Acids in Biological Fluids: A Completely Automated Process Using On-Line Membrane Sample Preparation, Pre-Column Derivatisation with O-Phthalaldehyde, 9-Fluorenyl Methyl Chloroformate and High Performance Liquid Chromatographic Separations. In Sample Preparation for Biomedical and Environmental Analysis; Stevenson, D., Wilson, I.D., Eds.; Springer: Boston, MA, USA, 1994; pp. 87–115. [Google Scholar] [CrossRef]
- Agilent. Amino Acid Analysis. Available online: https://www.agilent.com/en-us/library/brochures?N=131&Ntt=Analysis%20of%20Amino%20Acids%20by%20HPLC&redirect=0 (accessed on 13 December 2022).
- Wesolowska, O.; Paprocka, M.; Kozlak, J.; Motohashi, N.; Dus, D.; Michalak, K. Human sarcoma cell lines MES-SA and MES-SA/Dx5 as a model for multidrug resistance modulators screening. Anticancer Res. 2005, 25, 383–389. [Google Scholar]
- Lin, Y.-C.; Boone, M.; Meuris, L.; Lemmens, I.; Van Roy, N.; Soete, A.; Reumers, J.; Moisse, M.; Plaisance, S.; Drmanac, R.; et al. Genome dynamics of the human embryonic kidney 293 lineage in response to cell biology manipulations. Nat. Commun. 2014, 5, 4767. [Google Scholar] [CrossRef] [Green Version]
- Joubert, P.-E.; Meiffren, G.; Grégoire, I.P.; Pontini, G.; Richetta, C.; Flacher, M.; Azocar, O.; Vidalain, P.-O.; Vidal, M.; Lotteau, V.; et al. Autophagy Induction by the Pathogen Receptor CD46. Cell Host Microbe 2009, 6, 354–366. [Google Scholar] [CrossRef]
- Zhang, J.-H.; Chung, T.D.Y.; Oldenburg, K.R. A Simple Statistical Parameter for Use in Evaluation and Validation of High Throughput Screening Assays. SLAS Discov. 1999, 4, 67–73. [Google Scholar] [CrossRef] [PubMed]
- Jacomin, A.C.; Bescond, A.; Soleilhac, E.; Gallet, B.; Schoehn, G.; Fauvarque, M.O.; Taillebourg, E. The Deubiquitinating Enzyme UBPY Is Required for Lysosomal Biogenesis and Productive Autophagy in Drosophila. PLoS ONE 2015, 10, e0143078. [Google Scholar] [CrossRef] [PubMed] [Green Version]
- Kjeldahl, J. Neue Methode zur Bestimmung des Stickstoffs in organischen Körpern. (New method for the determination of nitrogen in organic substances). Z. Für Anal. Chem. 1883, 22, 366–383. [Google Scholar] [CrossRef] [Green Version]
- Bradstreet, R.B. Kjeldahl Method for Organic Nitrogen. Anal. Chem. 1954, 26, 185–187. [Google Scholar] [CrossRef]
- Banerjee, J.; Das, A.; Sinha, M.; Saha, S. Biological Efficacy of Medicinal Plant Extracts in Preventing Oxidative Damage. Oxidative Med. Cell. Longev. 2018, 2018, 1–2. [Google Scholar] [CrossRef] [PubMed]
- Faccio, G. Plant Complexity and Cosmetic Innovation. iScience 2020, 23, 101358. [Google Scholar] [CrossRef] [PubMed]
- Patra, J.K.; Das, G.; Lee, S.; Kang, S.-S.; Shin, H.-S. Selected commercial plants: A review of extraction and isolation of bioactive compounds and their pharmacological market value. Trends Food Sci. Technol. 2018, 82, 89–109. [Google Scholar] [CrossRef]
- Ribeiro, A.; Estanqueiro, M.; Oliveira, M.; Lobo, J.S. Main Benefits and Applicability of Plant Extracts in Skin Care Products. Cosmetics 2015, 2, 48–65. [Google Scholar] [CrossRef] [Green Version]
- Parvez, S.; Kang, M.; Chung, H.-S.; Bae, H. Naturally occurring tyrosinase inhibitors: Mechanism and applications in skin health, cosmetics and agriculture industries. Phytother. Res. 2007, 21, 805–816. [Google Scholar] [CrossRef]
- Taniguchi, K.; Karin, M. NF-κB, inflammation, immunity and cancer: Coming of age. Nat. Rev. Immunol. 2018, 18, 309–324. [Google Scholar] [CrossRef] [PubMed]
- Murrow, L.; Debnath, J. Autophagy as a Stress-Response and Quality-Control Mechanism: Implications for Cell Injury and Human Disease. Annu. Rev. Pathol. Mech. Dis. 2013, 8, 105–137. [Google Scholar] [CrossRef] [PubMed] [Green Version]
- Kroemer, G.; Mariño, G.; Levine, B. Autophagy and the Integrated Stress Response. Mol. Cell 2010, 40, 280–293. [Google Scholar] [CrossRef] [PubMed]


| Extract | Ashes (%) 1 | Free Amino Acids (%) | Nitrogen Compounds (%) | Carbohydrates (%) | Lipid Fraction (%) |
|---|---|---|---|---|---|
| Apolar | 1.5 ± 0.1 | 0.04 ± 0.01 | n.d. 2 | 4.0 | 93.4 ± 0.9 |
| Intermediate | 2.1 ± 0.2 | 0.80 ± 0.07 | 0.48 | 57.6 ± 0.2 | 0.40 ± 0.06 |
| Polar | 9.4 ± 0.4 | 2.1 ± 0.2 | 0.71 | 57.4 ± 0.1 | 0.03 ± 0.02 3 |
| Comp. No | Name | Apolar Extract 1 (%) | Intermediate Extract (%) | Polar Extract (%) |
|---|---|---|---|---|
| 1a | Rhamnose | 2.2 | 24.1 ± 0.7 | 7.8 ± 0.2 |
| 2a | Arabinose | 0.0 | 0.8 ± 0.1 | 0.0 ± 0.0 |
| 3a | Fructose | 0.0 | 10.6 ± 0.1 | 15.3 ± 0.2 |
| 4a | Glucose | 0.6 | 7.7 ± 0.2 | 22.0 ± 0.4 |
| 5a | Sucrose | 1.2 | 14.3 ± 0.3 | 12.4 ± 0.4 |
| Comp. No | Name | Tr (min) | Retention Index | FID in Extract (%) |
|---|---|---|---|---|
| of the Detected Derivatives | ||||
| 1b | Palmitic acid | 47.40 | 1916 | 10.7 |
| 2b | Linoleic acid | 54.61 | 2085 | 8.0 |
| 3b | Linolenic acid | 54.83 | 2090 | 17.0 |
| 4b | Oleic acid | 54.95 | 2093 | 3.1 |
| 5b | Phytol | 55.77 | 2112 | 4.5 |
| 6b | Stearic acid | 56.14 | 2120 | 1.7 |
| 7b | Arachidic acid | 63.08 | 2340 | 0.7 |
| 8b | Pentacosane | 66.10 | 2509 | 0.6 |
| 9b | Behenic acid | 66.32 | 2535 | 0.7 |
| 10b | Heptacosane | 68.26 | 2709 | 2.5 |
| 11b | Squalene | 69.45 | 2833 | 0.8 |
| 12b | Nonacosan | 70.13 | 2906 | 7.4 |
| 13b | Untriacontane | 72.11 | 3104 | 5.7 |
| 14b | Tocopherol | 72.76 | 3165 | 3.1 |
| 15b | Tritriacontane | 74.46 | 3301 | 4.3 |
| 16b | Iso calysterol | 75.03 | 3309 | 3.4 |
| 17b | Stigmasterol | 75.78 | 3351 | 10.9 |
| 18b | Tetratriacontane | 77.51 | 3401 | 1.5 |
| 19b | Alpha-amyrin | 77.95 | 3476 | 1.7 |
| Comp. No | Name | Polar Extract 1 (%) |
|---|---|---|
| 1c | Gluconic acid | 2.30 ± 0.02 |
| 2c | Glucuronic acid | 1.70 ± 0.03 |
| 3c | Malic acid | 3.7 ± 0.1 |
| 4c | cis-Aconitic acid | 1.30 ± 0.08 |
| Comp. No | Name (Molecular Formula) | Tr (min) | MW (g.mol−1) | [M–H]– or [M + H]+ | Fragment Ions (m/z) | % in Extract 1 |
|---|---|---|---|---|---|---|
| 1d | Harpagide (C15H24O10) | 2.68 | 364.1374 | 363.1300 | 201.0759 [M–C6H10O5]–; 165.0549 [M–C6H10O5–2H2O]– | 2.7 ± 0.2 |
| 2d | 6,8-O-Di-acetylharpagide (C19H28O12) | 4.41 | 448.1585 | 447.1516 | 387.1291 [M–HOCOCH3]–; 327.1066 [M–2HOCOCH3]–; 165.0428 [M–2HOCOCH3–C6H10O5]– | <100 ppm |
| 3d | Aucubin (C15H22O9) | 4.74 | 346.1279 | 345.1207 | 165.0551 [M–C6H12O6]– | <100 ppm |
| 4d | 8-O-Acetylharpagide (C17H26O11) | 4.81 | 406.1482 | 405.1412 | 345.1187 [M– HOCOCH3]–; 165.0549 [M–HOCOCH3–C6H12O6]– | 13.6 ± 0.4 |
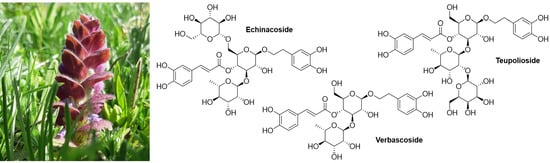
| 1e | Echinacoside (C35H46O20) | 5.62 | 786.2606 | 785.2565 | 623.2334 [M–C9H7O3]–; 461.1754 [M–C9H7O3–C6H10O5]–; 315.1143 [M–C9H7O3–C6H10O5–C6H10O4]–; 153.0557 [M–C9H7O3–C6H10O5–C6H10O4–C6H10O5]– | 4.2 ± 0.1 |
| 2e | Verbascoside (C29H36O15) | 5.78 | 624.2051 | 623.1975 | 461.1719 [M–C9H7O3]–; 315.1121 [M–C9H7O3–C6H10O4]–; 153.0559 [M–C9H7O3–C6H10O4–C6H10O5]– | 6.3 ± 0.2 |
| 3e | Teupolioside (C35H46O20) | 6.04 | 786.2597 | 785.2525 | 623.2162 [M–C9H7O3]–; 461.1612 [M–C9H7O3–C6H10O5]–; 315.1131 [M–C9H7O3–C6H10O5–C6H10O4]–; 153.0566 [M–C9H7O3–C6H10O5–C6H10O4–C6H10O6]– | 7.30 ± 0.02 |
| 4e | Unidentified (C29H36O15) | 6.16 | 624.2062 | 623.1989 | 461.1674 [M–C9H7O3]–; 315.1071 [M–C9H7O3–C6H10O4]–; 153.0554 [M–C9H7O3–C6H10O4–C6H10O5]– | 2.7 ± 0.2 |
| 5e | Unidentified (C29H36O15) | 6.28 | 624.2035 | 623.1961 | 461.1516 [M–C9H7O3]–; 315.1045 [M–C9H7O3–C6H10O4]–; 153.0535 [M–C9H7O3–C6H10O4–C6H10O5]– | 2.7 ± 0.2 |
| 1f | Unidentified (C27H38O9) | 6.64 | 506.2870 | 507.2940 | 488.2783; 303.1927; 175.1109; 91.0549 | n.d. |
| 2f | Unidentified (C29H44O9) | 6.66 | 536.2986 | 537.3045 | 401.2310; 301.1700; 281.1515; 175.1171; 109.0663 | n.d. |
| Tyrosinase Enzymatic Inhibition, % | Cytotoxicity on Non-Cancerous and Cancerous Cells, % | |||||||||||
|---|---|---|---|---|---|---|---|---|---|---|---|---|
| Cell Lines | HEK293T | MES-SA | MES-SA DX5 | |||||||||
| Dilution Factor | 200 | 667 | 2000 | 200 | 667 | 2000 | 200 | 667 | 2000 | 200 | 667 | 2000 |
| Apolar extract | −9.2 | –6.2 | −9.6 | 94.8 | 39.1 | −6.7 | 73.5 | 0.3 | −8.7 | 77.5 | 36.0 | 6.7 |
| Intermediate extract | −3.4 | −10.6 | −7.2 | 33.9 | 1.8 | −15.3 | 54.2 | 14.8 | −6.7 | 53.9 | 7.8 | 1.4 |
| Polar extract | −11.8 | −7.1 | −0.7 | 21.8 | −20.6 | −16.3 | 65.1 | 23.8 | −9.6 | 45.3 | 16.0 | 9.5 |
| IL8 Induction, % | NF-κB Nuclear Translocation Activity, % (Relative to DMSO + TNFα) | |||||
|---|---|---|---|---|---|---|
| Cell Lines | HEK293T | HEK293T | ||||
| Dilution Factor | 200 | 667 | 2000 | 667 | 2000 | 6667 |
| Apolar extract | 7.3 | 147.2 | 108.6 | |||
| Intermediate extract | −7.6 | −9.1 | 114.2 | 127.7 | 103.9 | |
| Polar extract | −18.7 | −12.3 | −19.5 | 107.6 | 127.7 | 99.1 |
Disclaimer/Publisher’s Note: The statements, opinions and data contained in all publications are solely those of the individual author(s) and contributor(s) and not of MDPI and/or the editor(s). MDPI and/or the editor(s) disclaim responsibility for any injury to people or property resulting from any ideas, methods, instructions or products referred to in the content. |
© 2023 by the authors. Licensee MDPI, Basel, Switzerland. This article is an open access article distributed under the terms and conditions of the Creative Commons Attribution (CC BY) license (https://creativecommons.org/licenses/by/4.0/).
Share and Cite
Gori, A.; Boucherle, B.; Rey, A.; Rome, M.; Barette, C.; Soleilhac, E.; Philouze, C.; Fauvarque, M.-O.; Fuzzati, N.; Peuchmaur, M. Investigation of Chemical Composition and Biological Activities of Ajuga pyramidalis—Isolation of Iridoids and Phenylethanoid Glycosides. Metabolites 2023, 13, 128. https://doi.org/10.3390/metabo13010128
Gori A, Boucherle B, Rey A, Rome M, Barette C, Soleilhac E, Philouze C, Fauvarque M-O, Fuzzati N, Peuchmaur M. Investigation of Chemical Composition and Biological Activities of Ajuga pyramidalis—Isolation of Iridoids and Phenylethanoid Glycosides. Metabolites. 2023; 13(1):128. https://doi.org/10.3390/metabo13010128
Chicago/Turabian StyleGori, Anthonin, Benjamin Boucherle, Aurélien Rey, Maxime Rome, Caroline Barette, Emmanuelle Soleilhac, Christian Philouze, Marie-Odile Fauvarque, Nicola Fuzzati, and Marine Peuchmaur. 2023. "Investigation of Chemical Composition and Biological Activities of Ajuga pyramidalis—Isolation of Iridoids and Phenylethanoid Glycosides" Metabolites 13, no. 1: 128. https://doi.org/10.3390/metabo13010128