
Metabolomics and Biomarkers in Retinal and Choroidal Vascular Diseases

Abstract
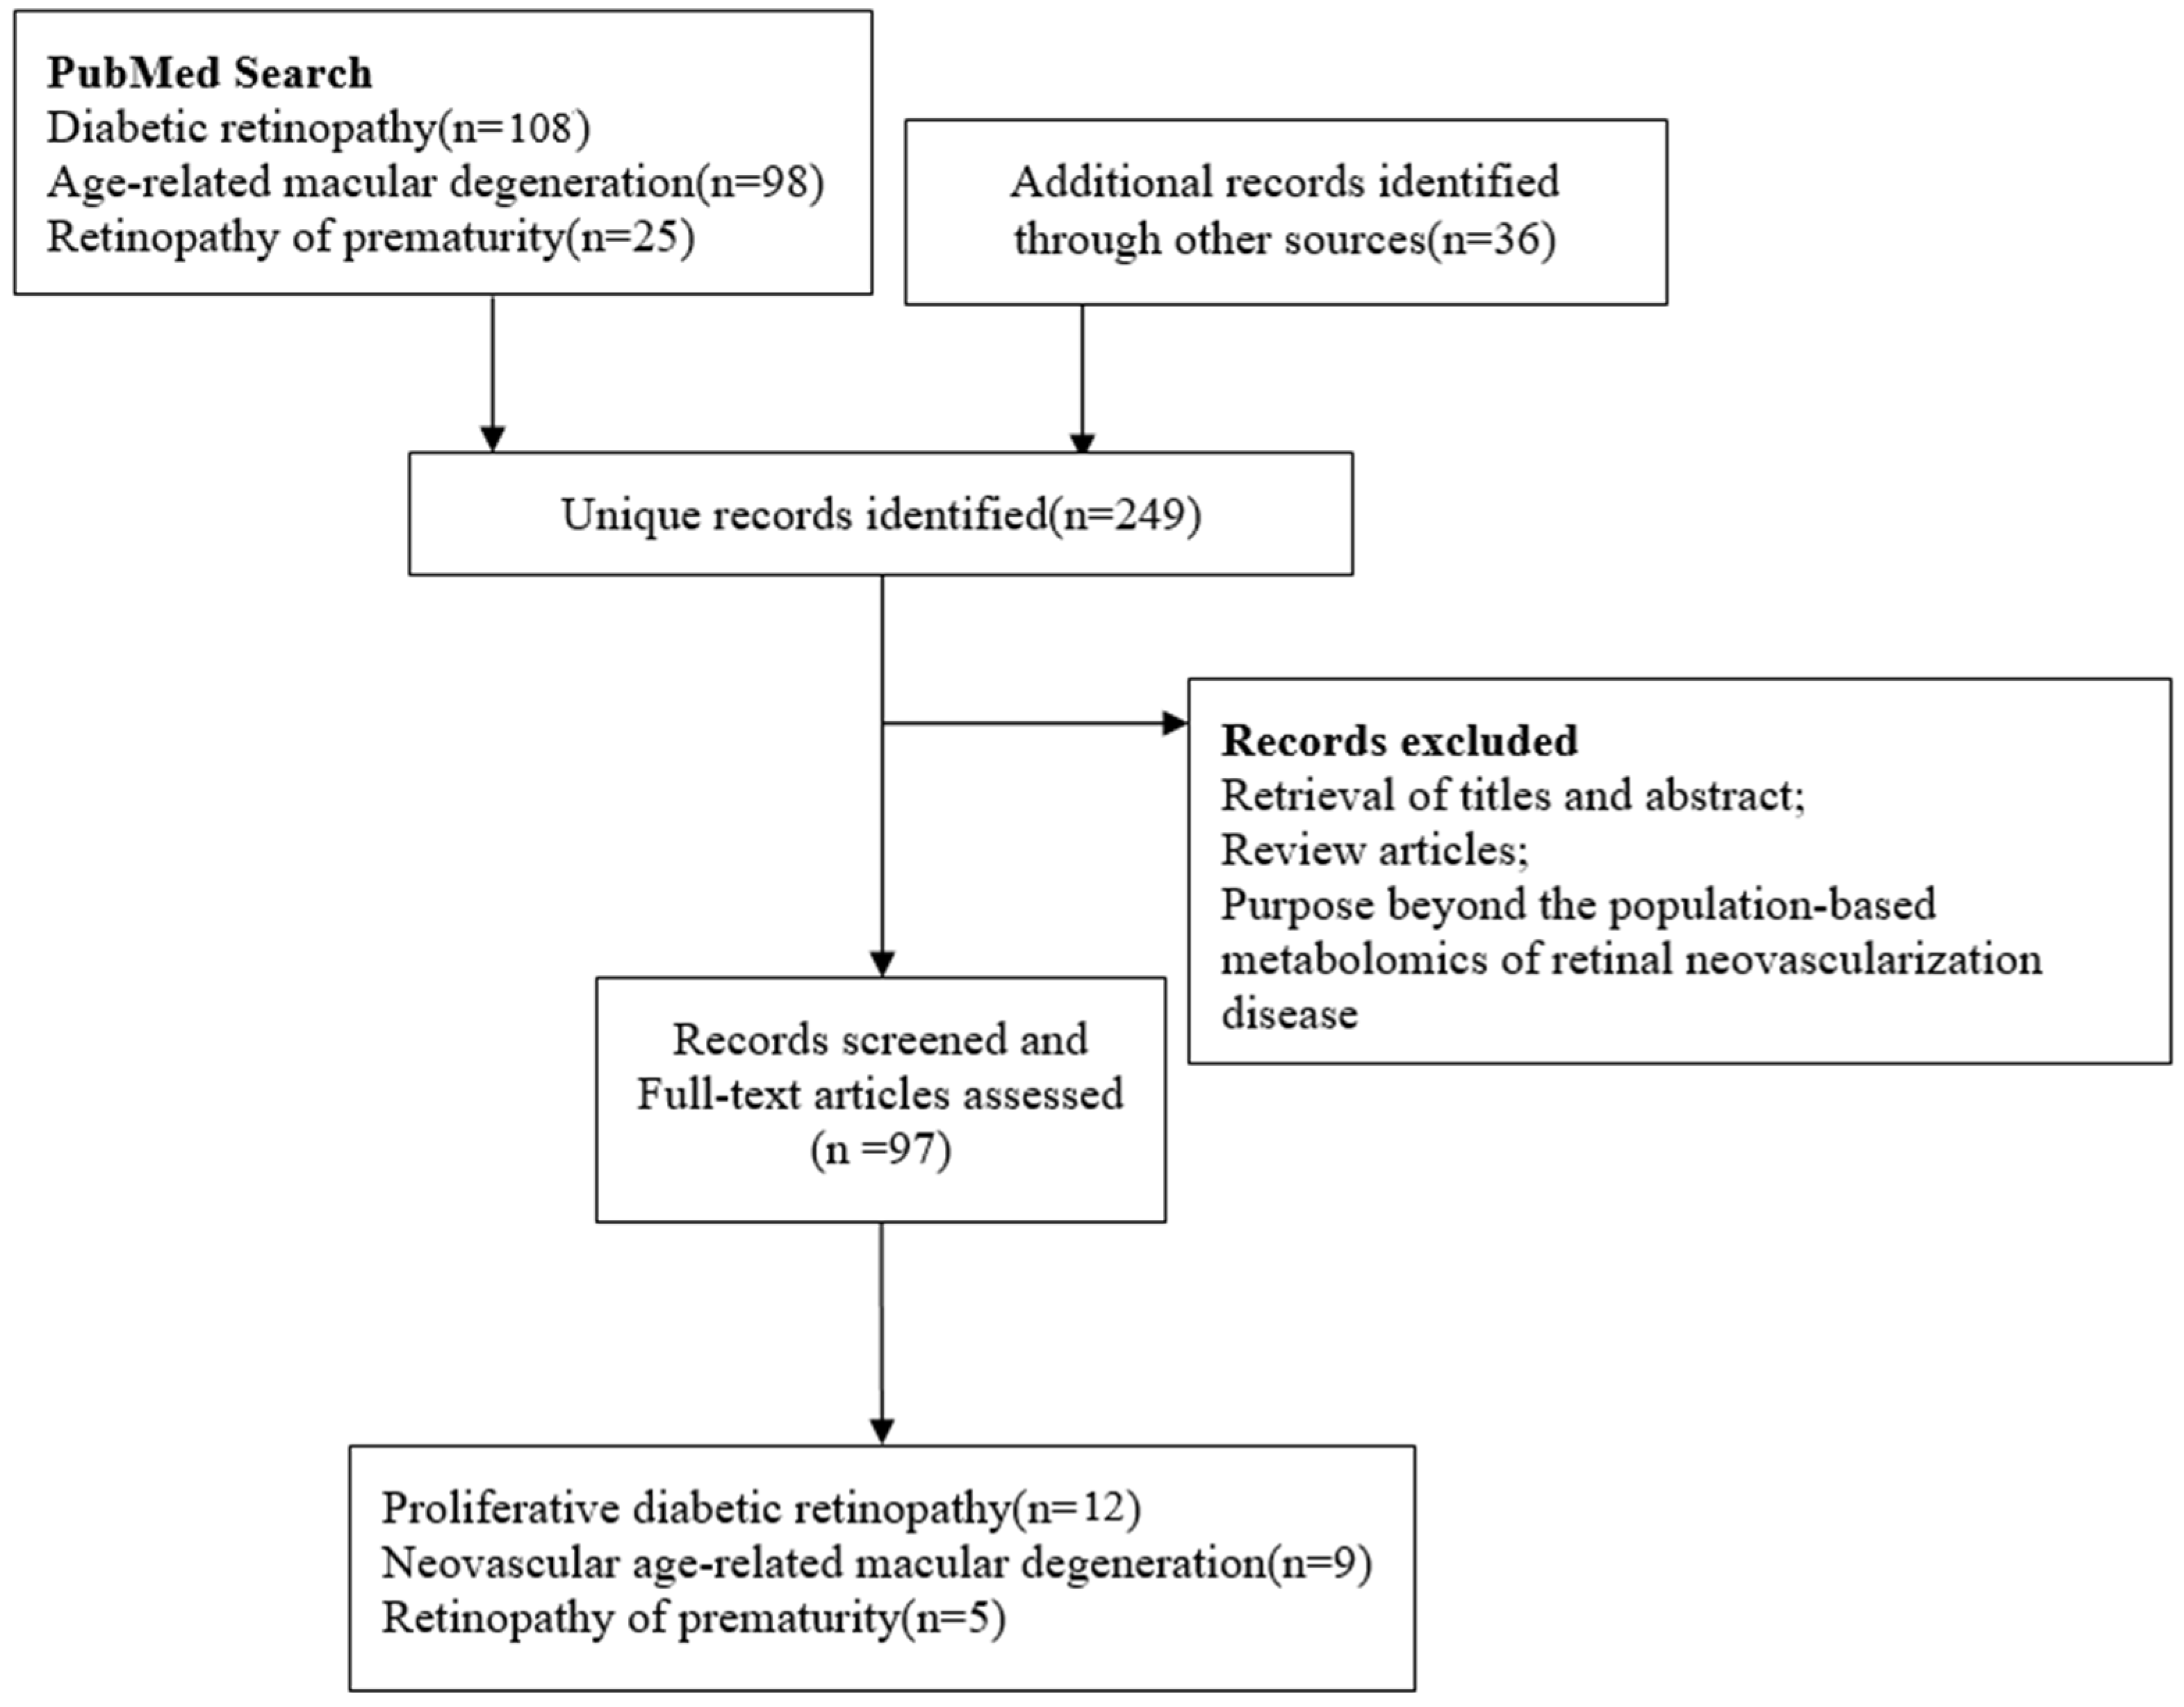
:1. Introduction
2. Application of Metabolomics in Retinal and Choroidal Neovascularization Studies
2.1. Metabolomics to Identify Metabolic Changes in Retinal and Choroidal Neovascular Disease
2.2. Biomarker Interpretation and Optimal Selection
3. Metabolomics for the Interpretation and Treatment of Retinal and Choroidal Neovascularization
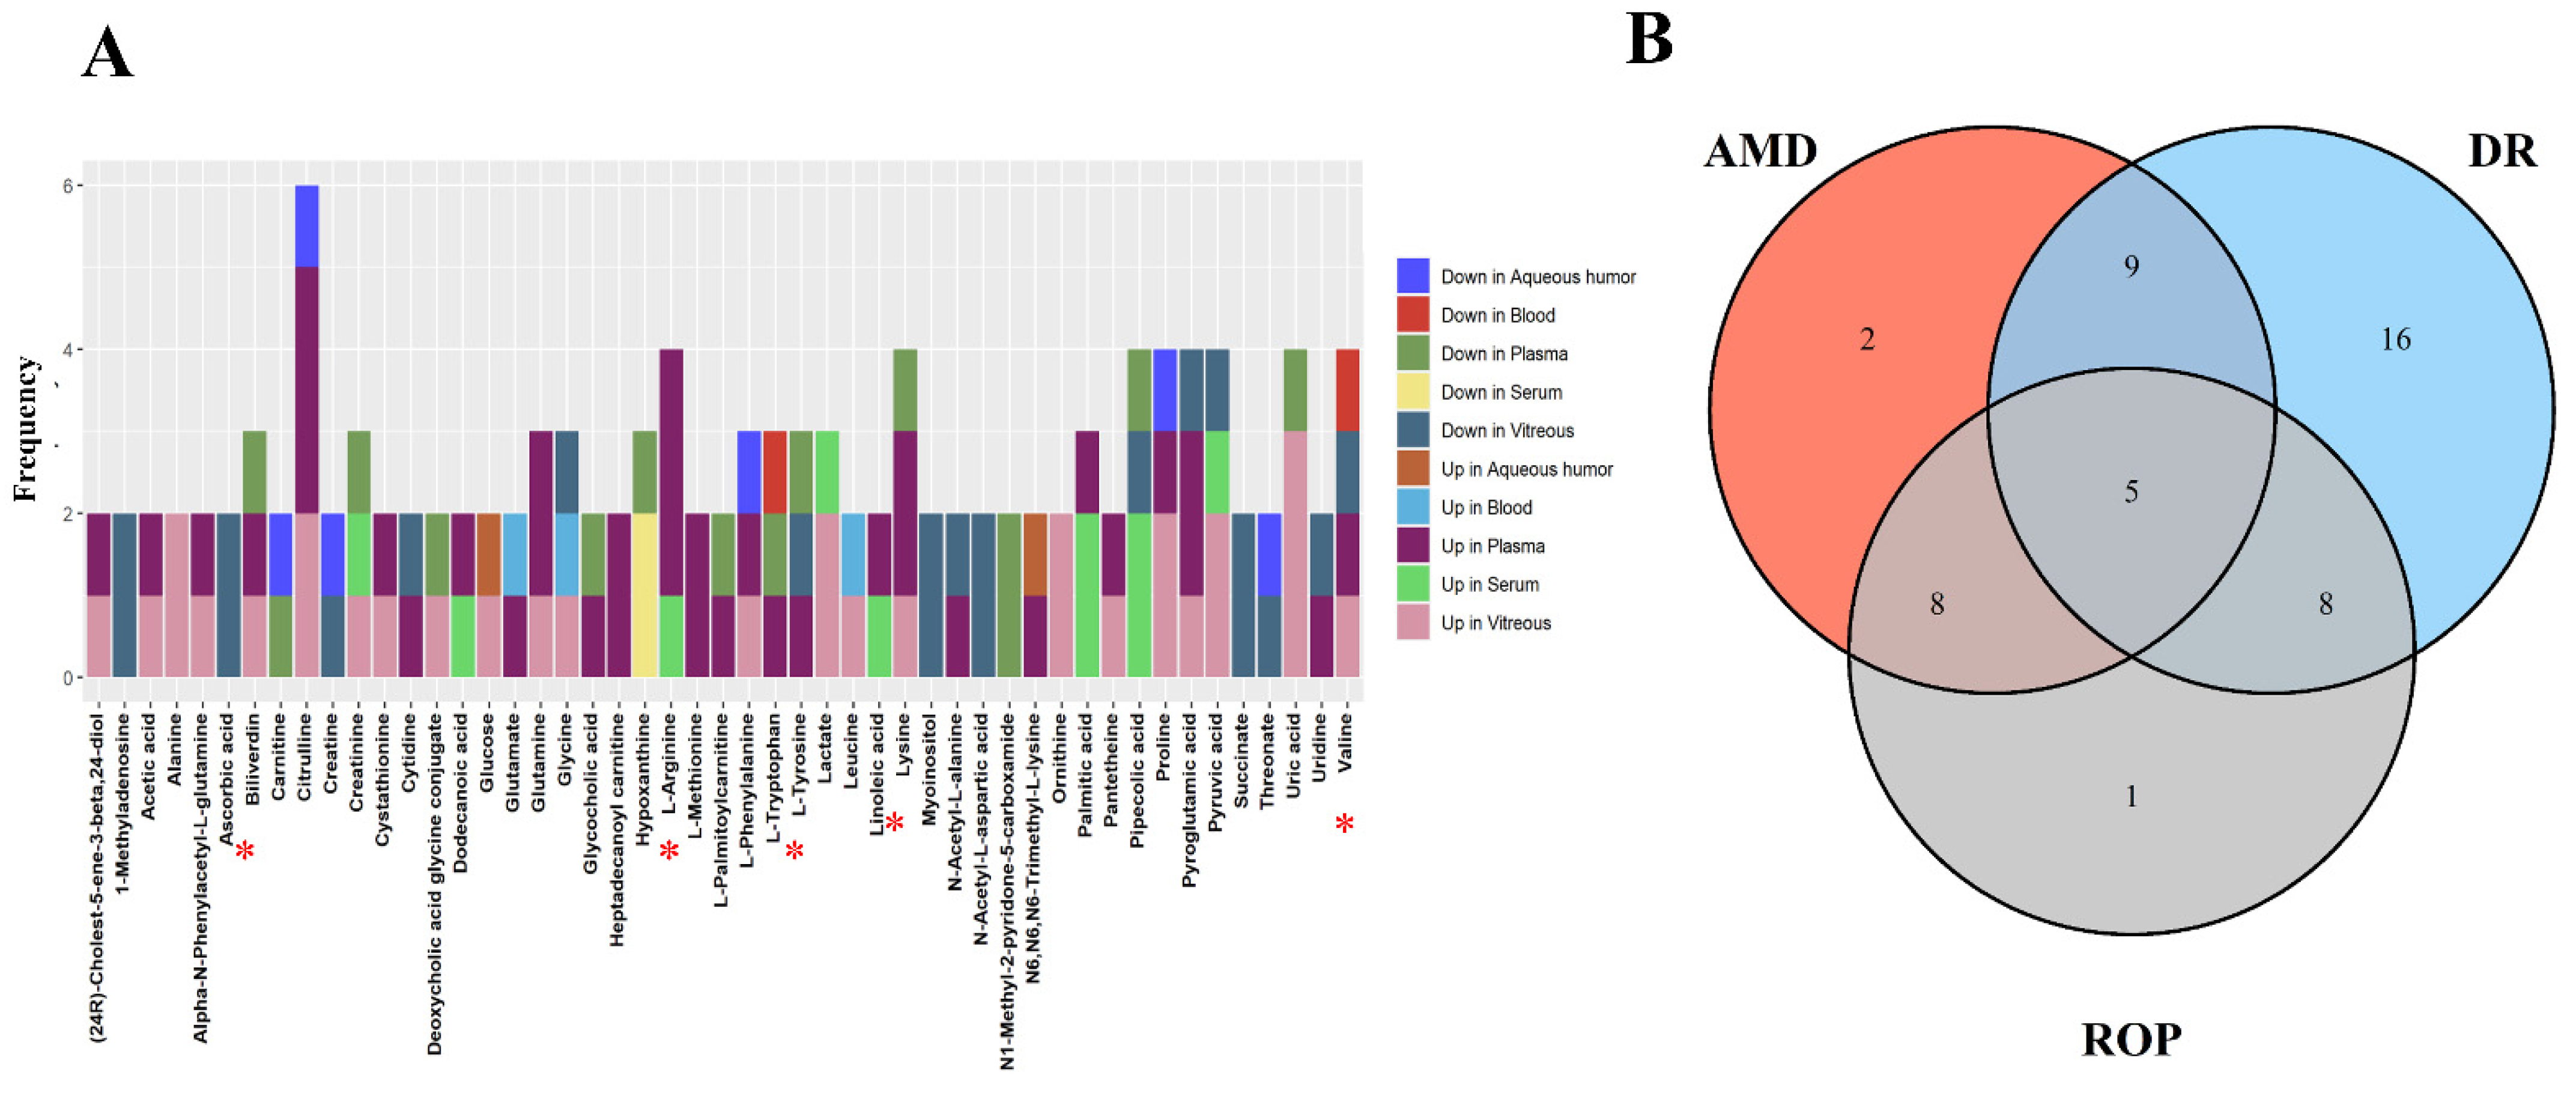
3.1. Amino Acid Metabolism and Neovascularization
3.2. Abnormalities in Neovascular Metabolism and Potential Therapeutic Opportunities
4. Conclusions
Author Contributions
Funding
Conflicts of Interest
References
- Hirschi, K.; Goodell, M. Common origins of blood and blood vessels in adults? Differentiation 2001, 68, 186–192. [Google Scholar] [CrossRef] [PubMed]
- Afzal, A.; Shaw, L.C.; Ljubimov, A.V.; Ljubimov, A.V.; Boulton, M.E.; Segal, M.S.; Grant, M.B. Retinal and choroidal microangiopathies: Therapeutic opportunities. Microvasc. Res. 2007, 74, 131–144. [Google Scholar] [CrossRef] [PubMed]
- Carmeliet, P.; Jain, R.K. Angiogenesis in cancer and other diseases. Nature 2000, 407, 249–257. [Google Scholar] [CrossRef]
- Yan, W.; Peng, Y.R.; van Zyl, T.; Regev, A.; Shekhar, K.; Juric, D.; Sanes, J.R. Cell Atlas of The Human Fovea and Peripheral Retina. Sci. Rep. 2020, 10, 9802. [Google Scholar] [CrossRef] [PubMed]
- Al-Latayfeh, M.; Silva, P.S.; Sun, J.K.; Aiello, L.P. Antiangiogenic therapy for ischemic retinopathies. Cold Spring Harb. Perspect. Med. 2012, 2, a006411. [Google Scholar] [CrossRef]
- Chheda, L.V.; Ferketich, A.K.; Carroll, C.P.; Moyer, P.D.; Kurz, D.E.; Kurz, P.A. Smoking as a risk factor for choroidal neovascularization secondary to presumed ocular histoplasmosis syndrome. Ophthalmology 2012, 119, 333–338. [Google Scholar] [CrossRef]
- Yanai, R.; Chen, S.; Uchi, S.H.; Nanri, T.; Connor, K.M.; Kimura, K. Attenuation of choroidal neovascularization by dietary intake of ω-3 long-chain polyunsaturated fatty acids and lutein in mice. PloS ONE 2018, 13, e0196037. [Google Scholar] [CrossRef]
- Tan, J.S.; Wang, J.J.; Flood, V.; Rochtchina, E.; Smith, W.; Mitchell, P. Dietary antioxidants and the long-term incidence of age-related macular degeneration: The Blue Mountains Eye Study. Ophthalmology 2008, 115, 334–341. [Google Scholar] [CrossRef]
- Xu, X.D.; Li, K.R.; Li, X.M.; Yao, J.; Qin, J.; Yan, B. Long non-coding RNAs: New players in ocular neovascularization. Mol. Biol. Rep. 2014, 41, 4493–4505. [Google Scholar] [CrossRef]
- Khan, S.R.; Manialawy, Y.; Wheeler, M.B.; Cox, B.J. Unbiased data analytic strategies to improve biomarker discovery in precision medicine. Drug Discov. Today 2019, 24, 1735–1748. [Google Scholar] [CrossRef]
- Yazdani, M.; Elgstøen, K.B.P.; Rootwelt, H.; Shahdadfar, A.; Utheim, Ø.A.; Utheim, T.P. Tear Metabolomics in Dry Eye Disease: A Review. Int. J. Mol. Sci. 2019, 20, 3755. [Google Scholar] [CrossRef] [PubMed]
- Holt-Lunstad, J. Loneliness and Social Isolation as Risk Factors: The Power of Social Connection in Prevention. Am. J. Lifestyle Med. 2021, 15, 567–573. [Google Scholar] [CrossRef] [PubMed]
- Chen, L.; Gao, Y.; Wang, L.Z.; Cheung, N.; Tan, G.S.W.; Cheung, G.C.M.; Beuerman, R.W.; Wong, T.Y.; Chan, E.C.Y.; Zhou, L. Recent advances in the applications of metabolomics in eye research. Anal. Chim. Acta 2018, 1037, 28–40. [Google Scholar] [CrossRef] [PubMed]
- Cunha-Vaz, J. The blood-ocular barriers. Surv. Ophthalmol. 1979, 23, 279–296. [Google Scholar] [CrossRef]
- Saint-Geniez, M.; D’Amore, P.A. Development and pathology of the hyaloid, choroidal and retinal vasculature. Int. J. Dev. Biol. 2004, 48, 1045–1058. [Google Scholar] [CrossRef]
- Hou, X.W.; Wang, Y.; Pan, C.W. Metabolomics in Age-Related Macular Degeneration: A Systematic Review. Investig. Ophthalmol. Vis. Sci. 2020, 61, 13. [Google Scholar] [CrossRef]
- Campochiaro, P.A. Molecular pathogenesis of retinal and choroidal vascular diseases. Prog. Retin. Eye Res. 2015, 49, 67–81. [Google Scholar] [CrossRef]
- Nilsson, A.K.; Andersson, M.X.; Sjöbom, U.; Hellgren, G.; Lundgren, P.; Pivodic, A.; Smith, L.E.H.; Hellström, A. Sphingolipidomics of serum in extremely preterm infants: Association between low sphingosine-1-phosphate levels and severe retinopathy of prematurity. Biochim. Biophys. Acta Mol. Cell Biol. Lipids 2021, 1866, 158939. [Google Scholar] [CrossRef]
- Ye, P.; Zhang, X.; Xu, Y.; Xu, J.; Song, X.; Yao, K. Alterations of the Gut Microbiome and Metabolome in Patients With Proliferative Diabetic Retinopathy. Front. Microbiol. 2021, 12, 667632. [Google Scholar] [CrossRef]
- Li, M.; Zhang, X.; Liao, N.; Ye, B.; Peng, Y.; Ji, Y.; Wen, F. Analysis of the Serum Lipid Profile in Polypoidal Choroidal Vasculopathy. Sci. Rep. 2016, 6, 38342. [Google Scholar] [CrossRef] [Green Version]
- Wang, H.; Fang, J.; Chen, F.; Sun, Q.; Xu, X.; Lin, S.H.; Liu, K. Metabolomic profile of diabetic retinopathy: A GC-TOFMS-based approach using vitreous and aqueous humor. Acta Diabetol. 2020, 57, 41–51. [Google Scholar] [CrossRef] [PubMed]
- Han, G.; Wei, P.; He, M.; Teng, H.; Chu, Y. Metabolomic Profiling of the Aqueous Humor in Patients with Wet Age-Related Macular Degeneration Using UHPLC-MS/MS. J. Proteome Res. 2020, 19, 2358–2366. [Google Scholar] [CrossRef] [PubMed]
- Wang, H.; Li, S.; Wang, C.; Wang, Y.; Fang, J.; Liu, K. Plasma and Vitreous Metabolomics Profiling of Proliferative Diabetic Retinopathy. Investig. Ophthalmol. Vis. Sci. 2022, 63, 17. [Google Scholar] [CrossRef] [PubMed]
- Zhou, Y.; Xu, Y.; Zhang, X.; Huang, Q.; Tan, W.; Yang, Y.; He, X.; Yoshida, S.; Zhao, P.; Li, Y. Plasma levels of amino acids and derivatives in retinopathy of prematurity. Int. J. Med. Sci. 2021, 18, 3581–3587. [Google Scholar] [CrossRef]
- Zhou, Y.; Xu, Y.; Zhang, X.; Zhao, P.; Gong, X.; He, M.; Cao, J.; Jiang, B.; Yoshida, S.; Li, Y. Plasma metabolites in treatment-requiring retinopathy of prematurity: Potential biomarkers identified by metabolomics. Exp. Eye Res. 2020, 199, 108198. [Google Scholar] [CrossRef]
- Zhu, X.R.; Yang, F.Y.; Lu, J.; Zhang, H.R.; Sun, R.; Zhou, J.B.; Yang, J.K. Plasma metabolomic profiling of proliferative diabetic retinopathy. Nutr. Metab. 2019, 16, 37. [Google Scholar] [CrossRef]
- Luo, D.; Deng, T.; Yuan, W.; Deng, H.; Jin, M. Plasma metabolomic study in Chinese patients with wet age-related macular degeneration. BMC Ophthalmol. 2017, 17, 165. [Google Scholar] [CrossRef]
- Liu, K.; Fang, J.; Jin, J.; Zhu, S.; Xu, X.; Xu, Y.; Ye, B.; Lin, S.H.; Xu, X. Serum Metabolomics Reveals Personalized Metabolic Patterns for Macular Neovascular Disease Patient Stratification. J. Proteome Res. 2020, 19, 699–707. [Google Scholar] [CrossRef]
- Deng, Y.; Shuai, P.; Wang, H.; Zhang, S.; Li, J.; Du, M.; Huang, P.; Qu, C.; Huang, L. Untargeted metabolomics for uncovering plasma biological markers of wet age-related macular degeneration. Aging 2021, 13, 13968–14000. [Google Scholar] [CrossRef]
- Yang, Y.; Wu, Z.; Li, S.; Yang, M.; Xiao, X.; Lian, C.; Wen, W.; He, H.; Zeng, J.; Wang, J.; et al. Targeted Blood Metabolomic Study on Retinopathy of Prematurity. Investig. Ophthalmol. Vis. Sci. 2020, 61, 12. [Google Scholar] [CrossRef] [Green Version]
- Haines, N.R.; Manoharan, N.; Olson, J.L.; D’Alessandro, A.; Reisz, J.A. Metabolomics Analysis of Human Vitreous in Diabetic Retinopathy and Rhegmatogenous Retinal Detachment. J. Proteome Res. 2018, 17, 2421–2427. [Google Scholar] [CrossRef]
- Mitchell, S.L.; Uppal, K.; Williamson, S.M.; Liu, K.; Burgess, L.G.; Tran, V.; Umfress, A.C.; Jarrell, K.L.; Cooke Bailey, J.N.; Agarwal, A.; et al. The Carnitine Shuttle Pathway is Altered in Patients With Neovascular Age-Related Macular Degeneration. Investig. Ophthalmol. Vis. Sci. 2018, 59, 4978–4985. [Google Scholar] [CrossRef]
- Sumarriva, K.; Uppal, K.; Ma, C.; Herren, D.J.; Wang, Y.; Chocron, I.M.; Warden, C.; Mitchell, S.L.; Burgess, L.G.; Goodale, M.P.; et al. Arginine and Carnitine Metabolites Are Altered in Diabetic Retinopathy. Investig. Ophthalmol. Vis. Sci. 2019, 60, 3119–3126. [Google Scholar] [CrossRef] [PubMed]
- Lin, A.L.; Roman, R.J.; Regan, K.A.; Bolch, C.A.; Chen, C.J.; Iyer, S.S.R. Eicosanoid Profiles in the Vitreous Humor of Patients with Proliferative Diabetic Retinopathy. Int. J. Mol. Sci. 2020, 21, 7451. [Google Scholar] [CrossRef] [PubMed]
- Paris, L.P.; Johnson, C.H.; Aguilar, E.; Usui, Y.; Cho, K.; Hoang, L.T.; Feitelberg, D.; Benton, H.P.; Westenskow, P.D.; Kurihara, T.; et al. Global metabolomics reveals metabolic dysregulation in ischemic retinopathy. Metab. Off. J. Metab. Soc. 2016, 12, 15. [Google Scholar] [CrossRef]
- Tomita, Y.; Cagnone, G.; Fu, Z.; Cakir, B.; Kotoda, Y.; Asakage, M.; Wakabayashi, Y.; Hellström, A.; Joyal, J.S.; Talukdar, S.; et al. Vitreous metabolomics profiling of proliferative diabetic retinopathy. Diabetologia 2021, 64, 70–82. [Google Scholar] [CrossRef]
- Barba, I.; Garcia-Ramírez, M.; Hernández, C.; Alonso, M.A.; Masmiquel, L.; García-Dorado, D.; Simó, R. Metabolic fingerprints of proliferative diabetic retinopathy: An 1H-NMR-based metabonomic approach using vitreous humor. Investig. Ophthalmol. Vis. Sci. 2010, 51, 4416–4421. [Google Scholar] [CrossRef]
- Chao de la Barca, J.M.; Rondet-Courbis, B.; Ferré, M.; Muller, J.; Buisset, A.; Leruez, S.; Plubeau, G.; Macé, T.; Moureauzeau, L.; Chupin, S.; et al. A Plasma Metabolomic Profiling of Exudative Age-Related Macular Degeneration Showing Carnosine and Mitochondrial Deficiencies. J. Clin. Med. 2020, 9, 631. [Google Scholar] [CrossRef]
- Lambert, V.; Hansen, S.; Schoumacher, M.; Lecomte, J.; Leenders, J.; Hubert, P.; Herfs, M.; Blacher, S.; Carnet, O.; Yip, C.; et al. Pyruvate dehydrogenase kinase/lactate axis: A therapeutic target for neovascular age-related macular degeneration identified by metabolomics. J. Mol. Med. 2020, 98, 1737–1751. [Google Scholar] [CrossRef]
- Osborn, M.P.; Park, Y.; Parks, M.B.; Burgess, L.G.; Uppal, K.; Lee, K.; Jones, D.P.; Brantley, M.A., Jr. Metabolome-wide association study of neovascular age-related macular degeneration. PloS ONE 2013, 8, e72737. [Google Scholar] [CrossRef] [Green Version]
- Ozcan, Y.; Huseyin, G.; Sonmez, K. Evaluation of Plasma Amino Acid Levels in Preterm Infants and Their Potential Correlation with Retinopathy of Prematurity. J. Ophthalmol. 2020, 2020, 8026547. [Google Scholar] [CrossRef] [PubMed]
- Yun, J.H.; Kim, J.M.; Jeon, H.J.; Oh, T.; Choi, H.J.; Kim, B.J. Metabolomics profiles associated with diabetic retinopathy in type 2 diabetes patients. PloS ONE 2020, 15, e0241365. [Google Scholar] [CrossRef] [PubMed]
- Abhary, S.; Kasmeridis, N.; Burdon, K.P.; Kuot, A.; Whiting, M.J.; Yew, W.P.; Petrovsky, N.; Craig, J.E. Diabetic retinopathy is associated with elevated serum asymmetric and symmetric dimethylarginines. Diabetes Care 2009, 32, 2084–2086. [Google Scholar] [CrossRef] [PubMed]
- Lee, L.C.; Liong, C.Y.; Jemain, A.A. Partial least squares-discriminant analysis (PLS-DA) for classification of high-dimensional (HD) data: A review of contemporary practice strategies and knowledge gaps. Analyst 2018, 143, 3526–3539. [Google Scholar] [CrossRef] [PubMed]
- Einav, S.; O’Connor, M. p-values and significance: The null hypothesis that they are not related is correct. J. Crit. Care 2019, 54, 159–162. [Google Scholar] [CrossRef] [PubMed]
- Sun, Y.V.; Hu, Y.J. Integrative Analysis of Multi-omics Data for Discovery and Functional Studies of Complex Human Diseases. Adv. Genet. 2016, 93, 147–190. [Google Scholar] [CrossRef]
- Wan-Ibrahim, W.I.; Singh, V.A.; Hashim, O.H.; Abdul-Rahman, P.S. Biomarkers for Bone Tumors: Discovery from Genomics and Proteomics Studies and Their Challenges. Mol. Med. 2016, 21, 861–872. [Google Scholar] [CrossRef]
- Vavricka, C.J.; Hasunuma, T.; Kondo, A. Dynamic Metabolomics for Engineering Biology: Accelerating Learning Cycles for Bioproduction. Trends Biotechnol. 2020, 38, 68–82. [Google Scholar] [CrossRef]
- Palli, R.; Palshikar, M.G.; Thakar, J. Executable pathway analysis using ensemble discrete-state modeling for large-scale data. PLoS Comput. Biol. 2019, 15, e1007317. [Google Scholar] [CrossRef]
- Pang, Z.; Chong, J.; Zhou, G.; de Lima Morais, D.A.; Chang, L.; Barrette, M.; Gauthier, C.; Jacques, P.; Li, S.; Xia, J. MetaboAnalyst 5.0: Narrowing the gap between raw spectra and functional insights. Nucleic Acids Res. 2021, 49, W388–W396. [Google Scholar] [CrossRef]
- Sorigue, M.; Cañamero, E.; Sancho, J.M. Precision medicine in follicular lymphoma: Focus on predictive biomarkers. Hematol. Oncol. 2020, 38, 625–639. [Google Scholar] [CrossRef] [PubMed]
- Gevaert, O.; De Smet, F.; Timmerman, D.; Moreau, Y.; De Moor, B. Predicting the prognosis of breast cancer by integrating clinical and microarray data with Bayesian networks. Bioinformatics 2006, 22, e184–e190. [Google Scholar] [CrossRef]
- Treps, L.; Conradi, L.C.; Harjes, U.; Carmeliet, P. Manipulating Angiogenesis by Targeting Endothelial Metabolism: Hitting the Engine Rather than the Drivers-A New Perspective? Pharmacol. Rev. 2016, 68, 872–887. [Google Scholar] [CrossRef] [PubMed]
- Morris, S.M., Jr. Recent advances in arginine metabolism: Roles and regulation of the arginases. Br. J. Pharmacol. 2009, 157, 922–930. [Google Scholar] [CrossRef] [PubMed]
- Cantelmo, A.R.; Conradi, L.C.; Brajic, A.; Goveia, J.; Kalucka, J.; Pircher, A.; Chaturvedi, P.; Hol, J.; Thienpont, B.; Teuwen, L.A.; et al. Inhibition of the Glycolytic Activator PFKFB3 in Endothelium Induces Tumor Vessel Normalization, Impairs Metastasis, and Improves Chemotherapy. Cancer Cell 2016, 30, 968–985. [Google Scholar] [CrossRef]
- Lieth, E.; Barber, A.J.; Xu, B.; Dice, C.; Ratz, M.J.; Tanase, D.; Strother, J.M. Glial reactivity and impaired glutamate metabolism in short-term experimental diabetic retinopathy. Penn State Retina Research Group. Diabetes 1998, 47, 815–820. [Google Scholar] [CrossRef]
- Oh, H.S.; Oh, S.K.; Lee, J.S.; Wu, C.; Lee, S.J. Effects of l-arginine on growth hormone and insulin-like growth factor 1. Food Sci. Biotechnol. 2017, 26, 1749–1754. [Google Scholar] [CrossRef]
- Hellström, A.; Engström, E.; Hård, A.L.; Albertsson-Wikland, K.; Carlsson, B.; Niklasson, A.; Löfqvist, C.; Svensson, E.; Holm, S.; Ewald, U.; et al. Postnatal serum insulin-like growth factor I deficiency is associated with retinopathy of prematurity and other complications of premature birth. Pediatrics 2003, 112, 1016–1020. [Google Scholar] [CrossRef]
- Dulak, J.; Józkowicz, A.; Dembinska-Kiec, A.; Guevara, I.; Zdzienicka, A.; Zmudzinska-Grochot, D.; Florek, I.; Wójtowicz, A.; Szuba, A.; Cooke, J.P. Nitric oxide induces the synthesis of vascular endothelial growth factor by rat vascular smooth muscle cells. Arterioscler. Thromb. Vasc. Biol. 2000, 20, 659–666. [Google Scholar] [CrossRef]
- Thibeault, S.; Rautureau, Y.; Oubaha, M.; Faubert, D.; Wilkes, B.C.; Delisle, C.; Gratton, J.P. S-nitrosylation of beta-catenin by eNOS-derived NO promotes VEGF-induced endothelial cell permeability. Mol. Cell 2010, 39, 468–476. [Google Scholar] [CrossRef]
- Smith, T.L.; Oubaha, M.; Cagnone, G.; Boscher, C.; Kim, J.S.; El Bakkouri, Y.; Zhang, Y.; Chidiac, R.; Corriveau, J.; Delisle, C.; et al. eNOS controls angiogenic sprouting and retinal neovascularization through the regulation of endothelial cell polarity. Cell. Mol. Life Sci. CMLS 2021, 79, 37. [Google Scholar] [CrossRef] [PubMed]
- Palmer, R.M.; Ashton, D.S.; Moncada, S. Vascular endothelial cells synthesize nitric oxide from L-arginine. Nature 1988, 333, 664–666. [Google Scholar] [CrossRef] [PubMed]
- Horowitz, S.; Binion, D.G.; Nelson, V.M.; Kanaa, Y.; Javadi, P.; Lazarova, Z.; Andrekopoulos, C.; Kalyanaraman, B.; Otterson, M.F.; Rafiee, P. Increased arginase activity and endothelial dysfunction in human inflammatory bowel disease. Am. J. Physiol. Gastrointest. Liver Physiol. 2007, 292, G1323–G1336. [Google Scholar] [CrossRef] [PubMed]
- Leal, J.; Teixeira-Santos, L.; Pinho, D.; Afonso, J.; Carvalho, J.; de Lourdes Bastos, M.; Albino-Teixeira, A.; Fraga, S.; Sousa, T. L-proline supplementation improves nitric oxide bioavailability and counteracts the blood pressure rise induced by angiotensin II in rats. Nitric Oxide Biol. Chem. 2019, 82, 1–11. [Google Scholar] [CrossRef]
- Lenis, Y.Y.; Elmetwally, M.A.; Maldonado-Estrada, J.G.; Bazer, F.W. Physiological importance of polyamines. Zygote 2017, 25, 244–255. [Google Scholar] [CrossRef]
- Ola, M.S.; Alhomida, A.S.; LaNoue, K.F. Gabapentin Attenuates Oxidative Stress and Apoptosis in the Diabetic Rat Retina. Neurotox. Res. 2019, 36, 81–90. [Google Scholar] [CrossRef]
- Hung, C.M.; Garcia-Haro, L.; Sparks, C.A.; Guertin, D.A. mTOR-dependent cell survival mechanisms. Cold Spring Harb. Perspect. Biol. 2012, 4, a008771. [Google Scholar] [CrossRef]
- Wei, J.; Jiang, H.; Gao, H.; Wang, G. Blocking Mammalian Target of Rapamycin (mTOR) Attenuates HIF-1α Pathways Engaged-Vascular Endothelial Growth Factor (VEGF) in Diabetic Retinopathy. Cell. Physiol. Biochem. Int. J. Exp. Cell. Physiol. Biochem. Pharmacol. 2016, 40, 1570–1577. [Google Scholar] [CrossRef] [PubMed]
- Jacot, J.L.; Sherris, D. Potential Therapeutic Roles for Inhibition of the PI3K/Akt/mTOR Pathway in the Pathophysiology of Diabetic Retinopathy. J. Ophthalmol. 2011, 2011, 589813. [Google Scholar] [CrossRef]
- Colak, E.; Majkic-Singh, N.; Zoric, L.; Radosavljevic, A.; Kosanovic-Jakovic, N. The role of CRP and inflammation in the pathogenesis of age-related macular degeneration. Biochem. Med. 2012, 22, 39–48. [Google Scholar] [CrossRef]
- Liu, X.; Zhao, P.; Tang, S.; Lu, F.; Hu, J.; Lei, C.; Yang, X.; Lin, Y.; Ma, S.; Yang, J.; et al. Association study of complement factor H, C2, CFB, and C3 and age-related macular degeneration in a Han Chinese population. Retina 2010, 30, 1177–1184. [Google Scholar] [CrossRef] [PubMed]
- Lyzogubov, V.V.; Tytarenko, R.G.; Jha, P.; Liu, J.; Bora, N.S.; Bora, P.S. Role of ocular complement factor H in a murine model of choroidal neovascularization. Am. J. Pathol. 2010, 177, 1870–1880. [Google Scholar] [CrossRef] [PubMed]
- McHarg, S.; Clark, S.J.; Day, A.J.; Bishop, P.N. Age-related macular degeneration and the role of the complement system. Mol. Immunol. 2015, 67, 43–50. [Google Scholar] [CrossRef] [PubMed]
- Nakajima, T.; Nakajima, E.; Shearer, T.R.; Azuma, M. Concerted inhibition of HIF-1α and -2α expression markedly suppresses angiogenesis in cultured RPE cells. Mol. Cell. Biochem. 2013, 383, 113–122. [Google Scholar] [CrossRef]
- Ryan, H.E.; Lo, J.; Johnson, R.S. HIF-1 alpha is required for solid tumor formation and embryonic vascularization. EMBO J. 1998, 17, 3005–3015. [Google Scholar] [CrossRef]
- Bhattarai, D.; Xu, X.; Lee, K. Hypoxia-inducible factor-1 (HIF-1) inhibitors from the last decade (2007 to 2016): A "structure-activity relationship" perspective. Med. Res. Rev. 2018, 38, 1404–1442. [Google Scholar] [CrossRef]
- Dong, A.; Seidel, C.; Snell, D.; Ekawardhani, S.; Ahlskog, J.K.; Baumann, M.; Shen, J.; Iwase, T.; Tian, J.; Stevens, R.; et al. Antagonism of PDGF-BB suppresses subretinal neovascularization and enhances the effects of blocking VEGF-A. Angiogenesis 2014, 17, 553–562. [Google Scholar] [CrossRef]
- Jaffe, G.J.; Ciulla, T.A.; Ciardella, A.P.; Devin, F.; Dugel, P.U.; Eandi, C.M.; Masonson, H.; Monés, J.; Pearlman, J.A.; Quaranta-El Maftouhi, M.; et al. Dual Antagonism of PDGF and VEGF in Neovascular Age-Related Macular Degeneration: A Phase IIb, Multicenter, Randomized Controlled Trial. Ophthalmology 2017, 124, 224–234. [Google Scholar] [CrossRef]
- Datta, S.; Cano, M.; Ebrahimi, K.; Wang, L.; Handa, J.T. The impact of oxidative stress and inflammation on RPE degeneration in non-neovascular AMD. Prog. Retin. Eye Res. 2017, 60, 201–218. [Google Scholar] [CrossRef]
- Yam, M.; Engel, A.L.; Wang, Y.; Zhu, S.; Hauer, A.; Zhang, R.; Lohner, D.; Huang, J.; Dinterman, M.; Zhao, C.; et al. Proline mediates metabolic communication between retinal pigment epithelial cells and the retina. J. Biol. Chem. 2019, 294, 10278–10289. [Google Scholar] [CrossRef]
- Thurman, J.M.; Renner, B.; Kunchithapautham, K.; Ferreira, V.P.; Pangburn, M.K.; Ablonczy, Z.; Tomlinson, S.; Holers, V.M.; Rohrer, B. Oxidative stress renders retinal pigment epithelial cells susceptible to complement-mediated injury. J. Biol. Chem. 2009, 284, 16939–16947. [Google Scholar] [CrossRef] [PubMed]
- Xu, H.; Chen, M. Targeting the complement system for the management of retinal inflammatory and degenerative diseases. Eur. J. Pharmacol. 2016, 787, 94–104. [Google Scholar] [CrossRef] [PubMed]
- Nozaki, M.; Raisler, B.J.; Sakurai, E.; Sarma, J.V.; Barnum, S.R.; Lambris, J.D.; Chen, Y.; Zhang, K.; Ambati, B.K.; Baffi, J.Z.; et al. Drusen complement components C3a and C5a promote choroidal neovascularization. Proc. Natl. Acad. Sci. USA 2006, 103, 2328–2333. [Google Scholar] [CrossRef] [PubMed]
- Ambati, J.; Atkinson, J.P.; Gelfand, B.D. Immunology of age-related macular degeneration. Nat. Rev. Immunol. 2013, 13, 438–451. [Google Scholar] [CrossRef]
- Rohrer, B.; Long, Q.; Coughlin, B.; Renner, B.; Huang, Y.; Kunchithapautham, K.; Ferreira, V.P.; Pangburn, M.K.; Gilkeson, G.S.; Thurman, J.M.; et al. A targeted inhibitor of the complement alternative pathway reduces RPE injury and angiogenesis in models of age-related macular degeneration. Adv. Exp. Med. Biol. 2010, 703, 137–149. [Google Scholar] [CrossRef]
- Polet, F.; Feron, O. Endothelial cell metabolism and tumour angiogenesis: Glucose and glutamine as essential fuels and lactate as the driving force. J. Intern. Med. 2013, 273, 156–165. [Google Scholar] [CrossRef]
- Wert, K.J.; Velez, G.; Kanchustambham, V.L.; Shankar, V.; Evans, L.P.; Sengillo, J.D.; Zare, R.N.; Bassuk, A.G.; Tsang, S.H.; Mahajan, V.B. Metabolite therapy guided by liquid biopsy proteomics delays retinal neurodegeneration. EBioMedicine 2020, 52, 102636. [Google Scholar] [CrossRef]
- Kanow, M.A.; Giarmarco, M.M.; Jankowski, C.S.; Tsantilas, K.; Engel, A.L.; Du, J.; Linton, J.D.; Farnsworth, C.C.; Sloat, S.R.; Rountree, A.; et al. Biochemical adaptations of the retina and retinal pigment epithelium support a metabolic ecosystem in the vertebrate eye. eLife 2017, 6, e28899. [Google Scholar] [CrossRef]
- De Bock, K.; Georgiadou, M.; Schoors, S.; Kuchnio, A.; Wong, B.W.; Cantelmo, A.R.; Quaegebeur, A.; Ghesquière, B.; Cauwenberghs, S.; Eelen, G.; et al. Role of PFKFB3-driven glycolysis in vessel sprouting. Cell 2013, 154, 651–663. [Google Scholar] [CrossRef]
- Xu, Y.; An, X.; Guo, X.; Habtetsion, T.G.; Wang, Y.; Xu, X.; Kandala, S.; Li, Q.; Li, H.; Zhang, C.; et al. Endothelial PFKFB3 plays a critical role in angiogenesis. Arterioscler. Thromb. Vasc. Biol. 2014, 34, 1231–1239. [Google Scholar] [CrossRef] [Green Version]
- Liu, Z.; Yan, S.; Wang, J.; Xu, Y.; Wang, Y.; Zhang, S.; Xu, X.; Yang, Q.; Zeng, X.; Zhou, Y.; et al. Endothelial adenosine A2a receptor-mediated glycolysis is essential for pathological retinal angiogenesis. Nat. Commun. 2017, 8, 584. [Google Scholar] [CrossRef] [PubMed]
- Al-Shabrawey, M.; Mussell, R.; Kahook, K.; Tawfik, A.; Eladl, M.; Sarthy, V.; Nussbaum, J.; El-Marakby, A.; Park, S.Y.; Gurel, Z.; et al. Increased expression and activity of 12-lipoxygenase in oxygen-induced ischemic retinopathy and proliferative diabetic retinopathy: Implications in retinal neovascularization. Diabetes 2011, 60, 614–624. [Google Scholar] [CrossRef] [PubMed]
- Chen, L.; Ackerman, R.; Guo, A.M. 20-HETE in neovascularization. Prostaglandins Other Lipid Mediat. 2012, 98, 63–68. [Google Scholar] [CrossRef]
- Shao, Z.; Fu, Z.; Stahl, A.; Joyal, J.S.; Hatton, C.; Juan, A.; Hurst, C.; Evans, L.; Cui, Z.; Pei, D.; et al. Cytochrome P450 2C8 ω3-long-chain polyunsaturated fatty acid metabolites increase mouse retinal pathologic neovascularization—Brief report. Arterioscler. Thromb. Vasc. Biol. 2014, 34, 581–586. [Google Scholar] [CrossRef] [PubMed]
- SanGiovanni, J.P.; Chew, E.Y.; Clemons, T.E.; Davis, M.D.; Ferris, F.L., 3rd; Gensler, G.R.; Kurinij, N.; Lindblad, A.S.; Milton, R.C.; Seddon, J.M.; et al. The relationship of dietary lipid intake and age-related macular degeneration in a case-control study: AREDS Report No. 20. Arch. Ophthalmol. 2007, 125, 671–679. [Google Scholar] [CrossRef]
- Sapieha, P.; Chen, J.; Stahl, A.; Seaward, M.R.; Favazza, T.L.; Juan, A.M.; Hatton, C.J.; Joyal, J.S.; Krah, N.M.; Dennison, R.J.; et al. Omega-3 polyunsaturated fatty acids preserve retinal function in type 2 diabetic mice. Nutr. Diabetes 2012, 2, e36. [Google Scholar] [CrossRef]
- Connor, K.M.; SanGiovanni, J.P.; Lofqvist, C.; Aderman, C.M.; Chen, J.; Higuchi, A.; Hong, S.; Pravda, E.A.; Majchrzak, S.; Carper, D.; et al. Increased dietary intake of omega-3-polyunsaturated fatty acids reduces pathological retinal angiogenesis. Nat. Med. 2007, 13, 868–873. [Google Scholar] [CrossRef]
- Lains, I.; Mendez, K.M.; Gil, J.Q.; Miller, J.B.; Kelly, R.S.; Barreto, P.; Kim, I.K.; Vavvas, D.G.; Murta, J.N.; Liang, L.; et al. Urinary Mass Spectrometry Profiles in Age-Related Macular Degeneration. J. Clin. Med. 2022, 11, 940. [Google Scholar] [CrossRef]


| References | Comparison | Age | Male% | Source/Race | Biofluid | Technique Employed | Evaluation Standard |
|---|---|---|---|---|---|---|---|
| ROP | |||||||
| Yang (2020) | ROP patients (n = 40) | GA (31.20 ± 4.62 weeks) | 37.50 | China | Blood | UPLC-MS/MS | OPLS-DA (VIP > 1) & t-tests (p < 0.05) & Wilcoxon (p < 0.05) |
| controls (n = 41) | GA (30.96 ± 4.17 weeks) | 73.17 | |||||
| Nilsson (2021) | 47 ROP cases | Sweden | Serum | LC-MS | Repeated measures data (Spline function) | ||
| cord blood and at postnatal days 1, 7, 14, and 28, and at postmenstrual weeks 32, 36, and 40 | |||||||
| Zhou (2021) | ROP patients (n = 58) | 29.09 ± 2.23 (weeks) | 58.62 | China | Plasma | HPLC-MS/MS | Mann-Whitney U test (p < 0.05) |
| controls (n = 25) | 31.29 ± 2.33 (weeks) | 52.00 | |||||
| Zhou (2020) | ROP patients (n = 38) | GA (29.28 ± 2.42) | 55.26 | China | Plasma | UHPLC-MS | OPLS-DA (VIP >1) and t-test (p < 0.05/0.05 < p < 0.1) |
| controls (n = 24) | 30.61 ± 2.75 | 56.52 | |||||
| Ozcan (2020) | ROP patients (n = 26) | GA (28.5 ± 2.7) | Turkey | Plasma | LCMS/MS | Mann-Whitney-U test (p < 0.05) | |
| controls (n = 29) | 31.52 ± 2.6 | ||||||
| AMD | |||||||
| Mitchell (2018) | NVAMD patients (n = 100) | 79.2 | 35.00 | America | Plasma | LC-MS and LC-MS/MS | Nested feature selection |
| controls (n =192) | 71.9 | 36.00 | |||||
| Luo (2017) | NVAMD patients (n = 20) | 66.20 ± 11.51 | 55.00 | China | Plasma | UPLC-QTOF MS | PLS-DA (VIP > 1) & t-test (p < 0.05 or 0.05 < p < 0.1) |
| controls (n = 20) | 64.70 ± 11.60 | 55.00 | |||||
| Osborn (2013) | NVAMD patients (n = 26) | 76.0 ± 5.7 | Caucasian | Plasma | LC-FTMS | Multiple testing | |
| controls (n = 19) | 76.4 ± 4.8 | ||||||
| Li (2016) | PCV (n = 21) | 60.7 ± 9.4 | 62.00 | China | Serum | UPLC-MS | OPLS (VIP > 1), t-test (p < 0.05) |
| controls (n = 19) | 64.8 ± 9.2 | 53.00 | |||||
| Barca (2020) | NVAMD patients (n = 40) | 81.1 | 39.00 | France | Plasma | LC MS | t-test (p < 0.05) |
| controls (n =40) | 81.8 | 41.00 | |||||
| Liu (2020) | AMD (n =88), PCV (n = 102), PM (n = 57) | 69.84 ± 8.47 (AMD), 66.06 ± 11.42 (PCV), 55.32 ± 14.49 (PM) | 66.28 (AMD), 71.57 (PCV), 28.07 (PM) | China | Serum | GC-TOF-MS | OPLS-DA (VIP > 1.0), t-test (p < 0.05), and FC > 1.2 or <0.8 |
| controls (n = 81) | 65.83 ± 11.94 | 35.80 | |||||
| Han (2020) | nAMD patients (n =26) | 74.12 | 53.85 | China | AH | UHPLC-MS/MS | OPLS-DA (VIP > 1) & one-way variance (p < 0.05) |
| Cataract patients without AMD (n = 20) | 69.6 | 65.00 | |||||
| Deng (2021) | 127 nAMD (CNV + PCV) | 71.1 ± 8.4 | 61.00 | China | Plasma | UHPLC-MS | PLS-DA (VIP ≥ 1), FC ≥ 2 and FC ≤ 0.5, p < 0.05 |
| controls (n = 50) | 68.5 ± 9.0 | 61.00 | |||||
| Lambert (2020) | nAMD (n = 72) | 38.89 | European | Serum | NMR | one-way ANOVA | |
| controls (n = 50) | 74.96 (6.24) | 48.00 | |||||
| PDR | |||||||
| Sumarriva (2019) | PDR patients (n = 34) | 55.7 ± 10.9 | 65.60 | America | Plasma | LC-MS | PLS-DA (VIP ≥ 2) |
| NPDR patients (n = 49) | 59.4 ± 11.3 | 61.40 | |||||
| Haines (2018) | PDR (n = 9) | 41 ± 10 | America | Vitreous | UHPLC-MS | ANOVA, t-test (p < 0.05) | |
| rhegmatogenous RD (n = 25), and controls (n = 8) | 68 ± 6 (controls); 62 ± 10 (rhegmatogenous RD) | ||||||
| Zhu (2019) | PDR (n = 21) | 49 (46–56.5) | 42.86 | China | Plasma | UPLC Q-TOF-MS | t-test (p < 10−5), AUC ≥ 0.95 & PLS-DA (VIP > 1) |
| NDR (duration ≥ 10y) (n = 21) | 55 (50–58) | 42.86 | |||||
| Wang (2019) | PDR (n = 28) (Vitreous); PDR (n = 23) (AH) | 49.61 (26–65) | 42.86 | China | Vitreous & AH | GC-TOF-MS | OPLS-DA (VIP > 1), Mann-Whitney U test (p < 0.05) |
| non-diabetic patients with MH (n = 22) (Vitreous); non-diabetic patients with cataract (n = 25) (AH) | 53.95 (32–71) | 36.36 | |||||
| Paris (2015) | PDR (n = 20) | Tokyo | Vitreous | HILIC & RPLC QTOF-MS | Welch’s t test (p < 0.01, FC > 2) | ||
| controls (n = 31) | |||||||
| Barba (2010) | PDR (n = 22) | Spain | Vitreous | NMR | |||
| non-diabetic patients with MH (n = 22) | |||||||
| ABHARY (2009) | no diabetic retinopathy (n = 330) | Australia | Serum | LC-MS | Hierarchical multiple regression (p < 0.05) | ||
| PDR (n = 101) | |||||||
| Tomita (2020) | PDR (n = 43) | 58.1 ± 13.6 | 77.1 | Tokyo | Vitreous | UHPLC-MS | t-test (FDR < 0.05) |
| controls (n = 21) | 69.4 ± 7.0 | 42.1 | |||||
| Lin (2020) | PDR (n = 31) | America | Vitreous | LC/MS/MS | t-test (p < 0.05) | ||
| controls (n = 13) | |||||||
| Yun (2020) | PDR (n = 51) | 62.60 (11.60) | 60.2 | Korea | Serum | LC-MS | Logistic regression analysis |
| NPDR (n = 123) | 61.18 (11.87) | 50.29 | |||||
| Ye (2021) | PDR (n = 45) | 59.9 ± 11.3 | 55.56 | China | Fecal | UPLC-MS | PLS-DA (VIP > 1), p < 0.05, |log2(FC)| > 1 |
| diabetic patients without DR (n = 90) | 60.9 ± 9.9 | 55.56 | |||||
| Wang (2022) | PDR (n = 88) (Plasma); PDR (n = 51) (Vitreous) | 55.3 ± 9.7 (Plasma); 54.9 ± 9.2 (Vitreous) | 51.80 | China | Plasma & Vitreous | UPLC-MS/MS | FDR < 0.05, OPLS-DA (VIP > 1.0), FC > 1.2 or <0.83 and multivariate analysis |
| nondiabetic controls (n = 51) (Plasma); nondiabetic controls(n = 23) (Vitreous) | 67.0 ± 8.1 (Plasma); 67.1 ± 8.8 (Vitreous) | 36.49 | |||||
| Pathway Name | Match | p | FDR | Impact | Match Details |
|---|---|---|---|---|---|
| Plasma | |||||
| Arginine biosynthesis | 7/14 | <0.0001 | 0.0003 | 0.6244 | L-Glutamate; L-Arginine; L-Citrulline; L-Aspartate; Carbamoyl phosphate; L-Glutamine; Fumarate |
| Aminoacyl-tRNA biosynthesis | 11/48 | <0.0001 | 0.0014 | <0.0001 | L-Phenylalanine; L-Arginine; L-Glutamine; L-Aspartate; L-Methionine; L-Valine; L-Lysine; L-Tryptophan; L-Tyrosine; L-Proline; L-Glutamate |
| AH | |||||
| Aminoacyl-tRNA biosynthesis | 10/48 | <0.0001 | 0.0001 | 0.1667 | L-Phenylalanine; L-Glutamine; L-Serine; L-Methionine; L-Lysine; L-Leucine; L-Tryptophan; L-Tyrosine; L-Proline; L-Glutamate |
| Glyoxylate and dicarboxylate metabolism | 6/32 | 0.0003 | 0.0118 | 0.1455 | cis-Aconitate; L-Serine; L-Glutamate; D-Glycerate; Isocitrate; L-Glutamine |
| Vitreous | |||||
| Aminoacyl-tRNA biosynthesis | 9/48 | <0.0001 | 0.0005 | <0.0001 | L-Phenylalanine; L-Glutamine; Glycine; L-Valine; L-Alanine; L-Lysine; L-Leucine; L-Threonine; L-Proline |
| Alanine, aspartate and glutamate metabolism | 7/28 | <0.0001 | 0.0005 | 0.2484 | N-Acetyl-L-aspartate; L-Alanine; L-Glutamine; 2-Oxoglutaramate; Pyruvate; Succinate; 2-Oxoglutarate |
| Arginine biosynthesis | 5/14 | <0.0001 | 0.0009 | 0.2893 | L-Citrulline; L-Ornithine; L-Glutamine; 2-Oxoglutarate; N-Acetyl-L-glutamate |
| Glycine, serine and threonine metabolism | 7/33 | <0.0001 | 0.0009 | 0.3426 | N, N-Dimethylglycine; L-Cystathionine; Glycine; L-Threonine; D-Glycerate; Creatine; Pyruvate |
| Valine, leucine and isoleucine biosynthesis | 3/8 | 0.0014 | 0.0235 | <0.0001 | L-Threonine; L-Leucine; L-Valine |
| Glyoxylate and dicarboxylate metabolism | 5/32 | 0.0025 | 0.0346 | 0.1852 | Glycine; D-Glycerate; Acetate; Pyruvate; L-Glutamine |
| References | Discriminant Models | Discriminant Group; Precision |
|---|---|---|
| ROP | ||
| Yang (2020) | Altered metabolites | All AUC > 0.5; C3DC (AUC = 0.914, sen = 97.5%, and spe = 68.3%); glycine (AUC = 0.659, sen = 92.5%, and spe = 58.5%) |
| Zhou (2021) | Altered metabolites | The AUC values for citrulline, creatinine, arginine, and aminoadipic acid were 0.7221, 0.7000, 0.6759, and 0.6545; The combination of the 4 altered metabolites (AUC = 0.8703) |
| Zhou (2020) | Altered metabolites | 10 metabolites obtained AUC larger than 0.7 under positive ion mode; Under negative ion mode, 5 metabolites obtained AUC larger than 0.7. |
| AMD | ||
| Mitchell (2018) | 159 differential features | Accuracy = 96.1% (training set); 75.6% (test set) |
| Li (2016) | differential features | LPA (18:2), LPC (20:4), PC (20:1p/19:1), SM (d16:0/22:2), PAF (35:4), PC (16:0/22:5) and PC (18:1/20:4) are evaluated separately, AUC is greater than or equal 0.8 |
| Liu (2020) | Demographic characteristics and panel metabolites(hypoxanthine, L-2-amino-3-(1-pyrazolyl)propanoic acid, linoleic acid, maleic acid, ribonolactone) (PM vs. control); | AUC = 0.906; sen = 0.877; spe = 0.684 (PM vs. control); |
| Demographic characteristics and panel metabolites(5-hydroxylysine, caproic acid, D-tagatose, glyceraldehyde, hydroxyphenyllactic acid, L-2-amino-3-(1-pyrazolyl)propanoic acid, linoleic acid, pipecolic acid, pyruvic acid, and ribonolactone) (AMD vs. control); | AUC = 0.971; sen = 0.963; spe = 0.907 (AMD vs. control); | |
| Demographic characteristics and panel metabolites(hypoxanthine,L-2-Amino-3-(1-pyrazolyl)propanoicacid,linoleic acid, maleic acid, pipecolic acid, pyruvic acid, ribonolactone, 5-hydroxydopamine, and phenylpyruvic acid) (PCV vs. control); | AUC = 0.948; sen = 0.901; spe = 0.853 (PCV vs. control); | |
| PDR | ||
| Sumarriva (2019) | 219 differential features | Accuracy = 91.7% |
| Zhu (2019) | Fumaric acid, uridine, acetic acid, and cytidine | AUCs = 0.96, 0.95, 1.0, and 0.95, respectively |
| Wang (2019) | AH: D-2,3-dihydroxypropanoic acid, isocitric acid, fructose 6-phosphate, and L-lactic acid | (AH)AUC = 0.965, sen = 88%, spe = 95.7% |
| Vitreous: pyroglutamic acid and pyruvic acid | (Vitreous) AUC = 0.965, sen = 88%, spe = 95.7% |
| Accuracy | Sensitivity | Specificity | Precision | F1-Score | AUC (Test) | |
|---|---|---|---|---|---|---|
| neg-Han (2020) | ||||||
| Logistic-all | 0.643 | 0.500 | 0.750 | 0.600 | 0.545 | 0.578 |
| Logistic-step | 0.786 | 0.625 | 1.000 | 1.000 | 0.769 | 0.833 |
| RF | 0.929 | 1.000 | 0.800 | 0.900 | 0.947 | 0.900 |
| SVM | 0.786 | 0.800 | 0.750 | 0.889 | 0.842 | 0.744 |
| XGBoost | 0.714 | 0.889 | 0.400 | 0.727 | 0.800 | 0.644 |
| pos-Han (2020) | ||||||
| Logistic-all | 0.714 | 0.750 | 0.800 | 0.600 | 0.667 | 0.700 |
| Logistic-step | 0.929 | 1.000 | 0.900 | 0.800 | 0.889 | 0.900 |
| RF | 0.929 | 1.000 | 0.800 | 0.900 | 0.947 | 0.900 |
| SVM | 0.857 | 0.818 | 1.000 | 1.000 | 0.900 | 0.800 |
| XGBoost | 0.929 | 1.000 | 0.800 | 0.900 | 0.947 | 0.900 |
| AH-Wang (2019) | ||||||
| Logistic-all | 0.733 | 0.667 | 0.833 | 0.857 | 0.750 | 0.652 |
| Logistic-step | 0.600 | 0.556 | 0.667 | 0.714 | 0.625 | 0.643 |
| RF | 0.867 | 0.875 | 0.857 | 0.857 | 0.857 | 0.866 |
| SVM | 0.800 | 0.857 | 0.750 | 0.750 | 0.800 | 0.804 |
| XGBoost | 0.733 | 0.625 | 0.857 | 0.833 | 0.714 | 0.741 |
| Vit-Wang (2019) | ||||||
| Logistic-all | 0.556 | 0.600 | 0.500 | 0.600 | 0.600 | 0.525 |
| Logistic-step | 0.722 | 0.778 | 0.667 | 0.700 | 0.737 | 0.725 |
| RF | 0.833 | 0.750 | 0.900 | 0.857 | 0.800 | 0.825 |
| SVM | 0.778 | 0.750 | 0.800 | 0.750 | 0.750 | 0.775 |
| XGBoost | 0.778 | 0.750 | 0.800 | 0.750 | 0.750 | 0.775 |
| Yun (2020) | ||||||
| Logistic-all | 0.811 | 0.909 | 0.333 | 0.870 | 0.889 | 0.478 |
| Logistic-step | 0.792 | 0.889 | 0.250 | 0.870 | 0.879 | 0.472 |
| RF | 0.792 | 0.429 | 0.848 | 0.300 | 0.353 | 0.638 |
| SVM | 0.868 | 0.500 | 0.898 | 0.286 | 0.364 | 0.621 |
| XGBoost | 0.792 | 0.571 | 0.826 | 0.333 | 0.421 | 0.699 |
| Barca (2020) | ||||||
| Logistic-all | 0.667 | 0.600 | 0.778 | 0.818 | 0.692 | 0.671 |
| Logistic-step | 0.750 | 0.692 | 0.818 | 0.818 | 0.750 | 0.748 |
| RF | 0.667 | 0.538 | 0.818 | 0.778 | 0.636 | 0.678 |
| SVM | 0.667 | 0.727 | 0.615 | 0.615 | 0.667 | 0.671 |
| XGBoost | 0.792 | 0.692 | 0.909 | 0.900 | 0.783 | 0.801 |
Publisher’s Note: MDPI stays neutral with regard to jurisdictional claims in published maps and institutional affiliations. |
© 2022 by the authors. Licensee MDPI, Basel, Switzerland. This article is an open access article distributed under the terms and conditions of the Creative Commons Attribution (CC BY) license (https://creativecommons.org/licenses/by/4.0/).
Share and Cite
Hou, X.-W.; Wang, Y.; Ke, C.-F.; Li, M.-Y.; Pan, C.-W. Metabolomics and Biomarkers in Retinal and Choroidal Vascular Diseases. Metabolites 2022, 12, 814. https://doi.org/10.3390/metabo12090814
Hou X-W, Wang Y, Ke C-F, Li M-Y, Pan C-W. Metabolomics and Biomarkers in Retinal and Choroidal Vascular Diseases. Metabolites. 2022; 12(9):814. https://doi.org/10.3390/metabo12090814
Chicago/Turabian StyleHou, Xiao-Wen, Ying Wang, Chao-Fu Ke, Mei-Yan Li, and Chen-Wei Pan. 2022. "Metabolomics and Biomarkers in Retinal and Choroidal Vascular Diseases" Metabolites 12, no. 9: 814. https://doi.org/10.3390/metabo12090814