Guide to Metabolomics Analysis: A Bioinformatics Workflow


Abstract
:
1. Introduction
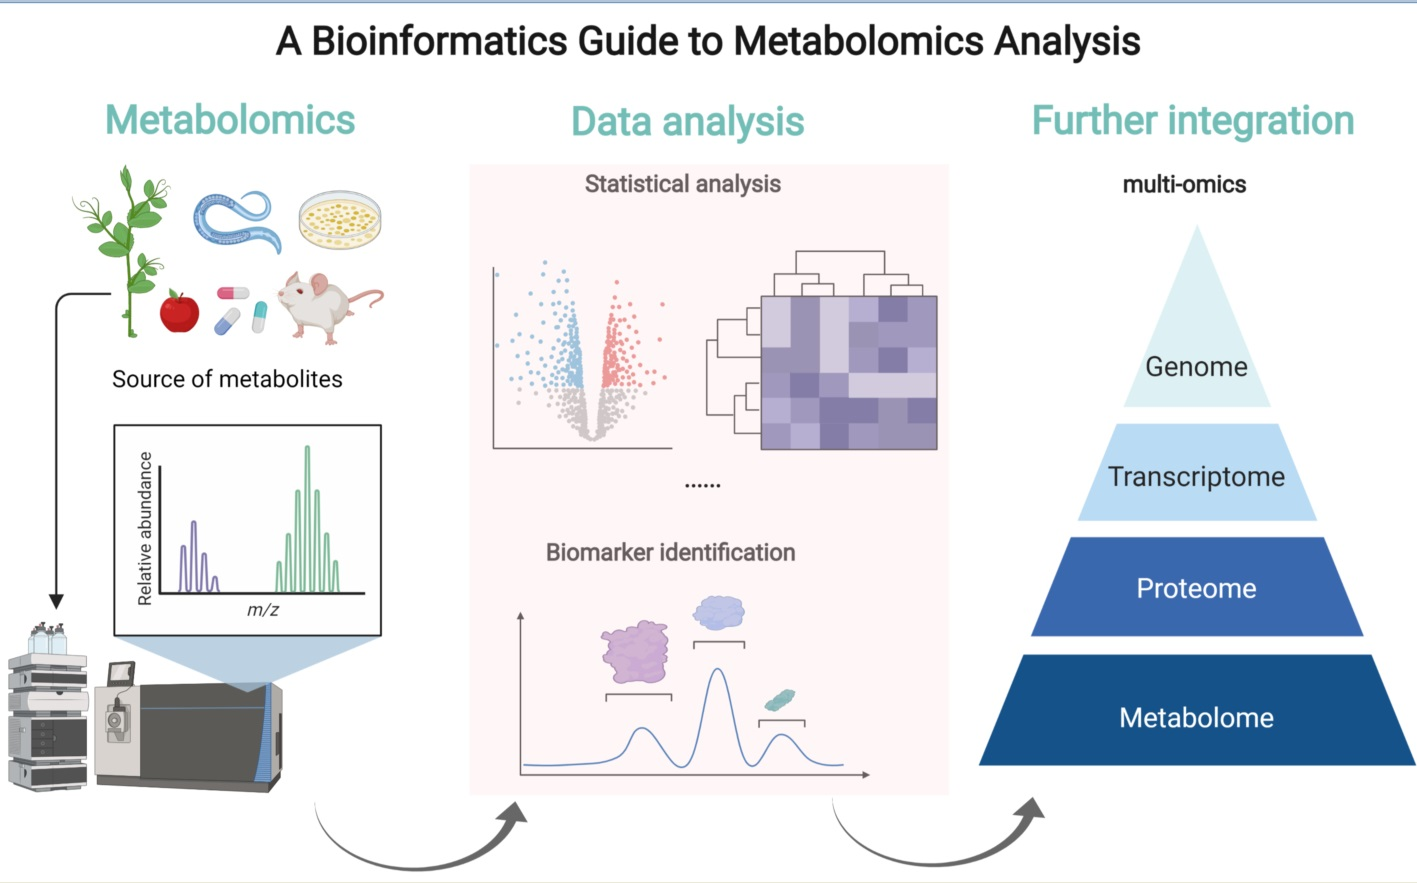
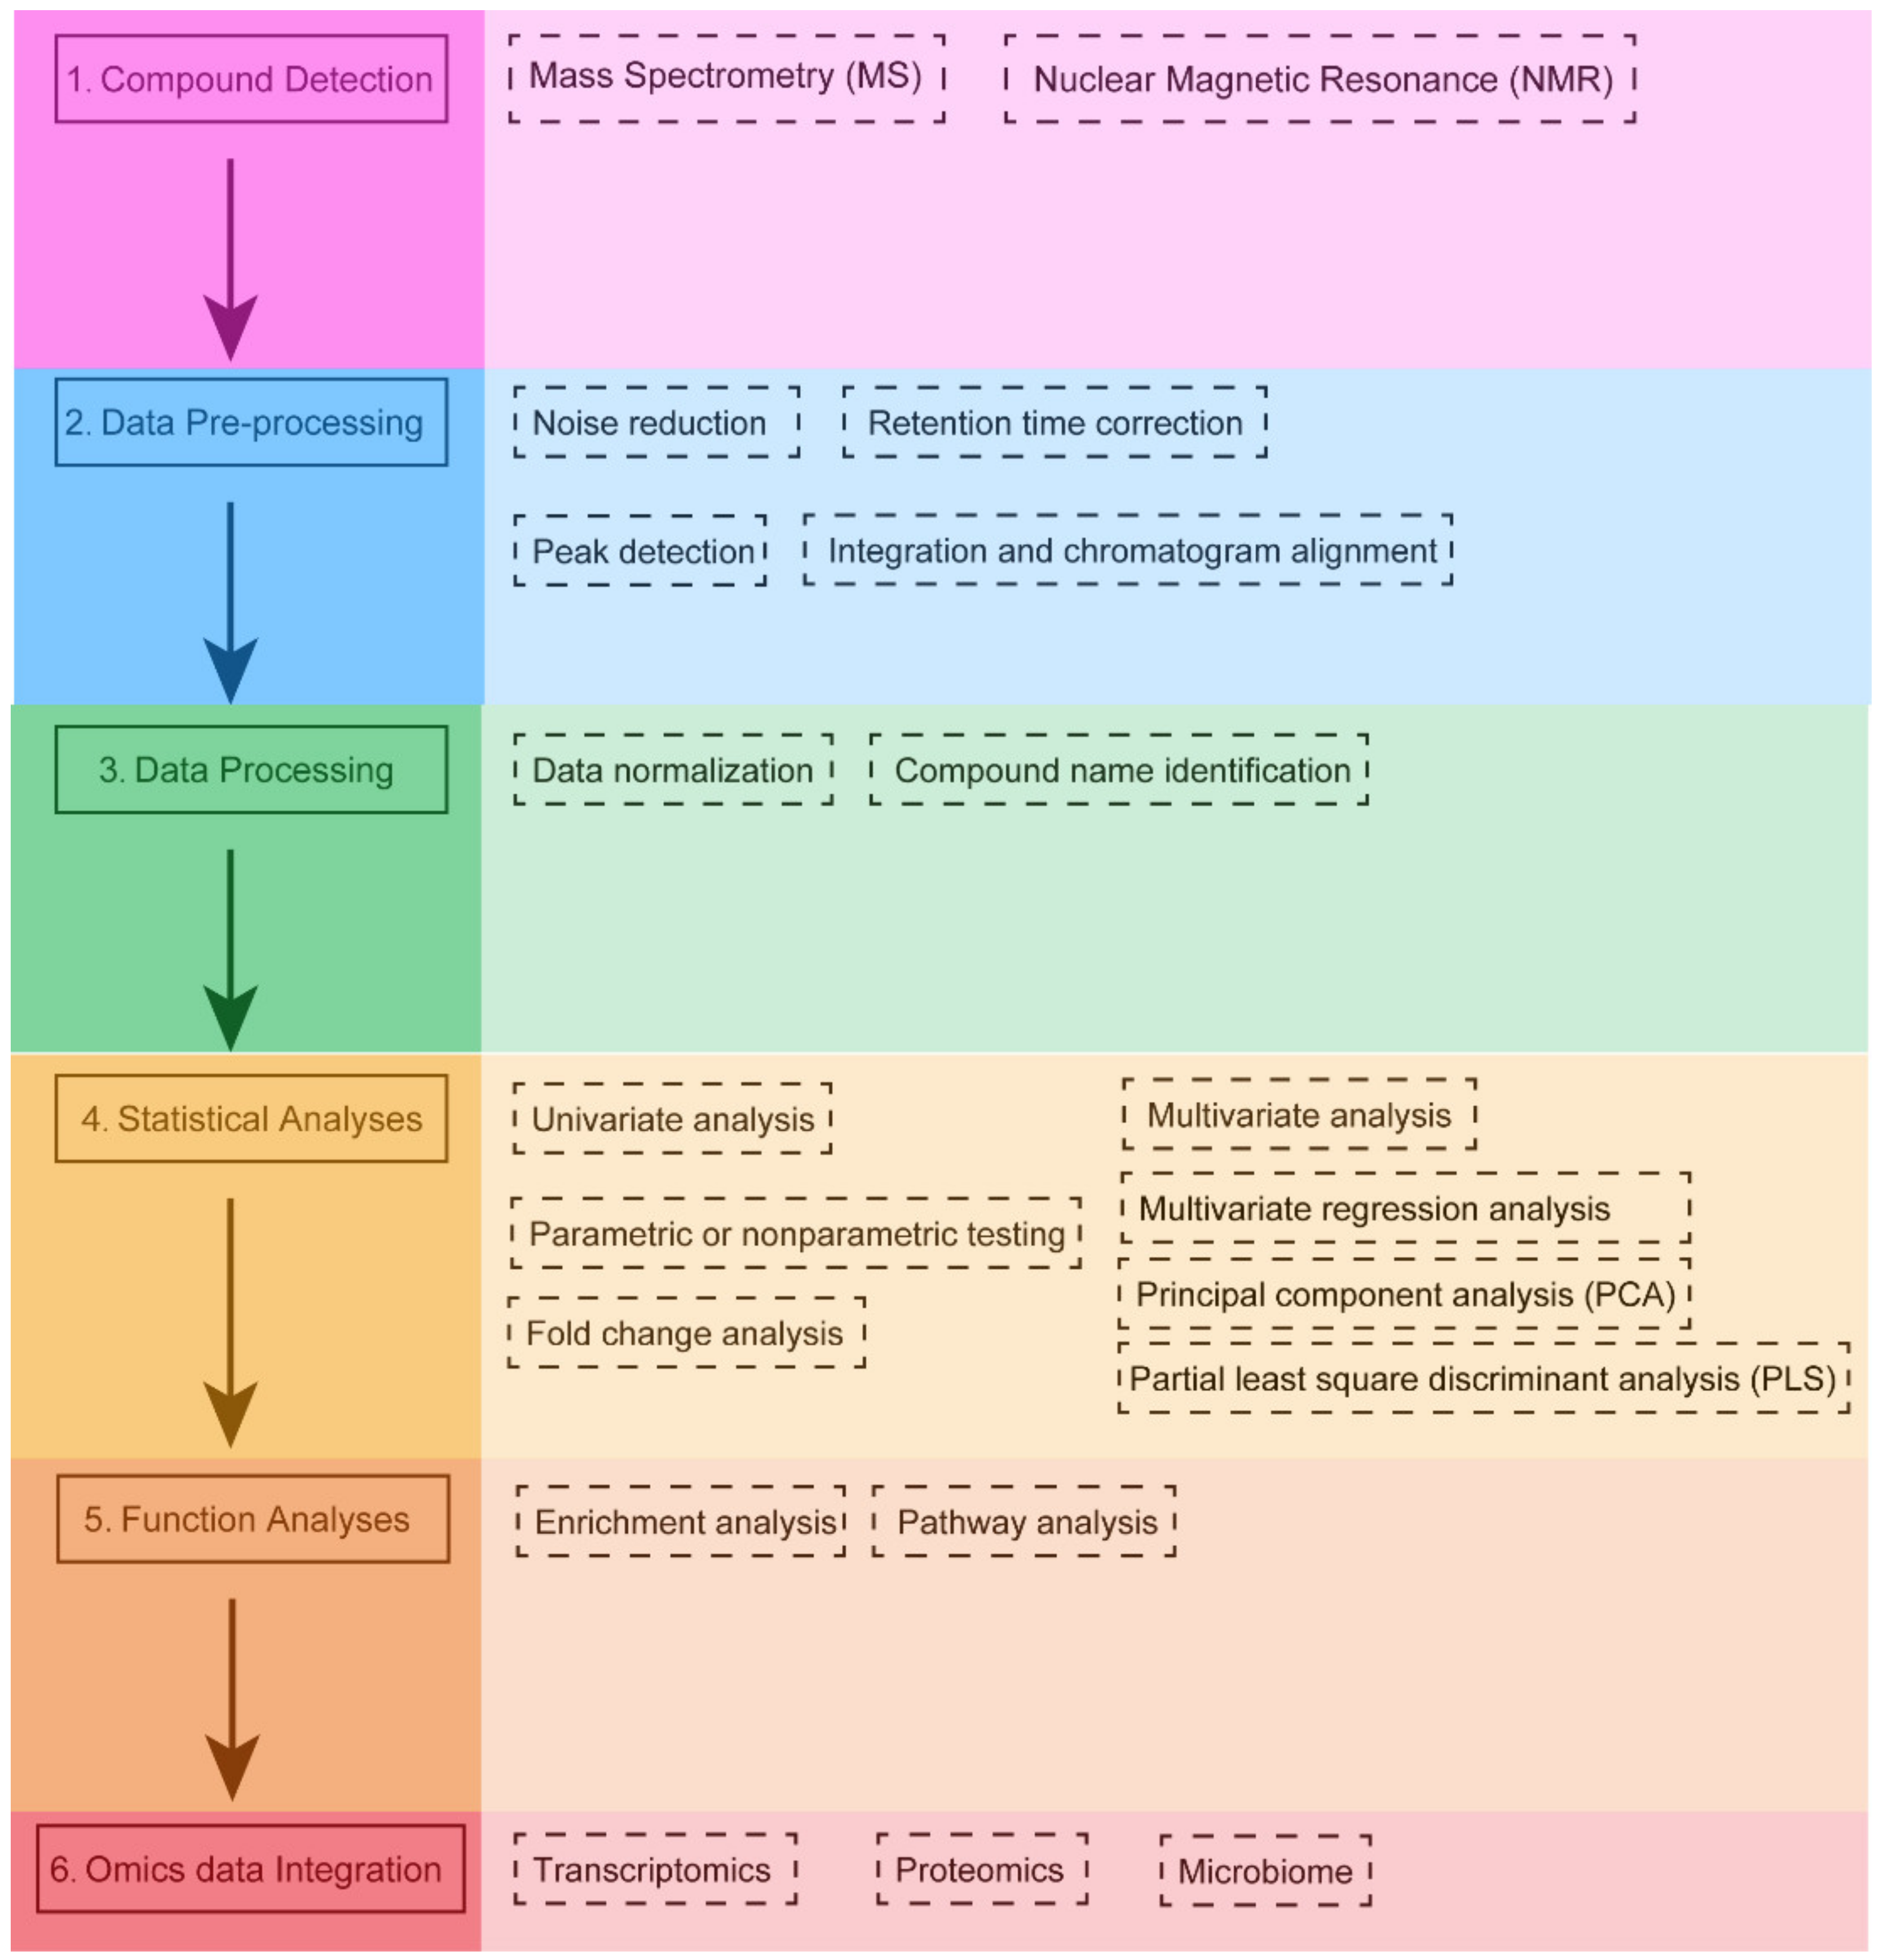
2. The Analysis Workflow of Metabolomics
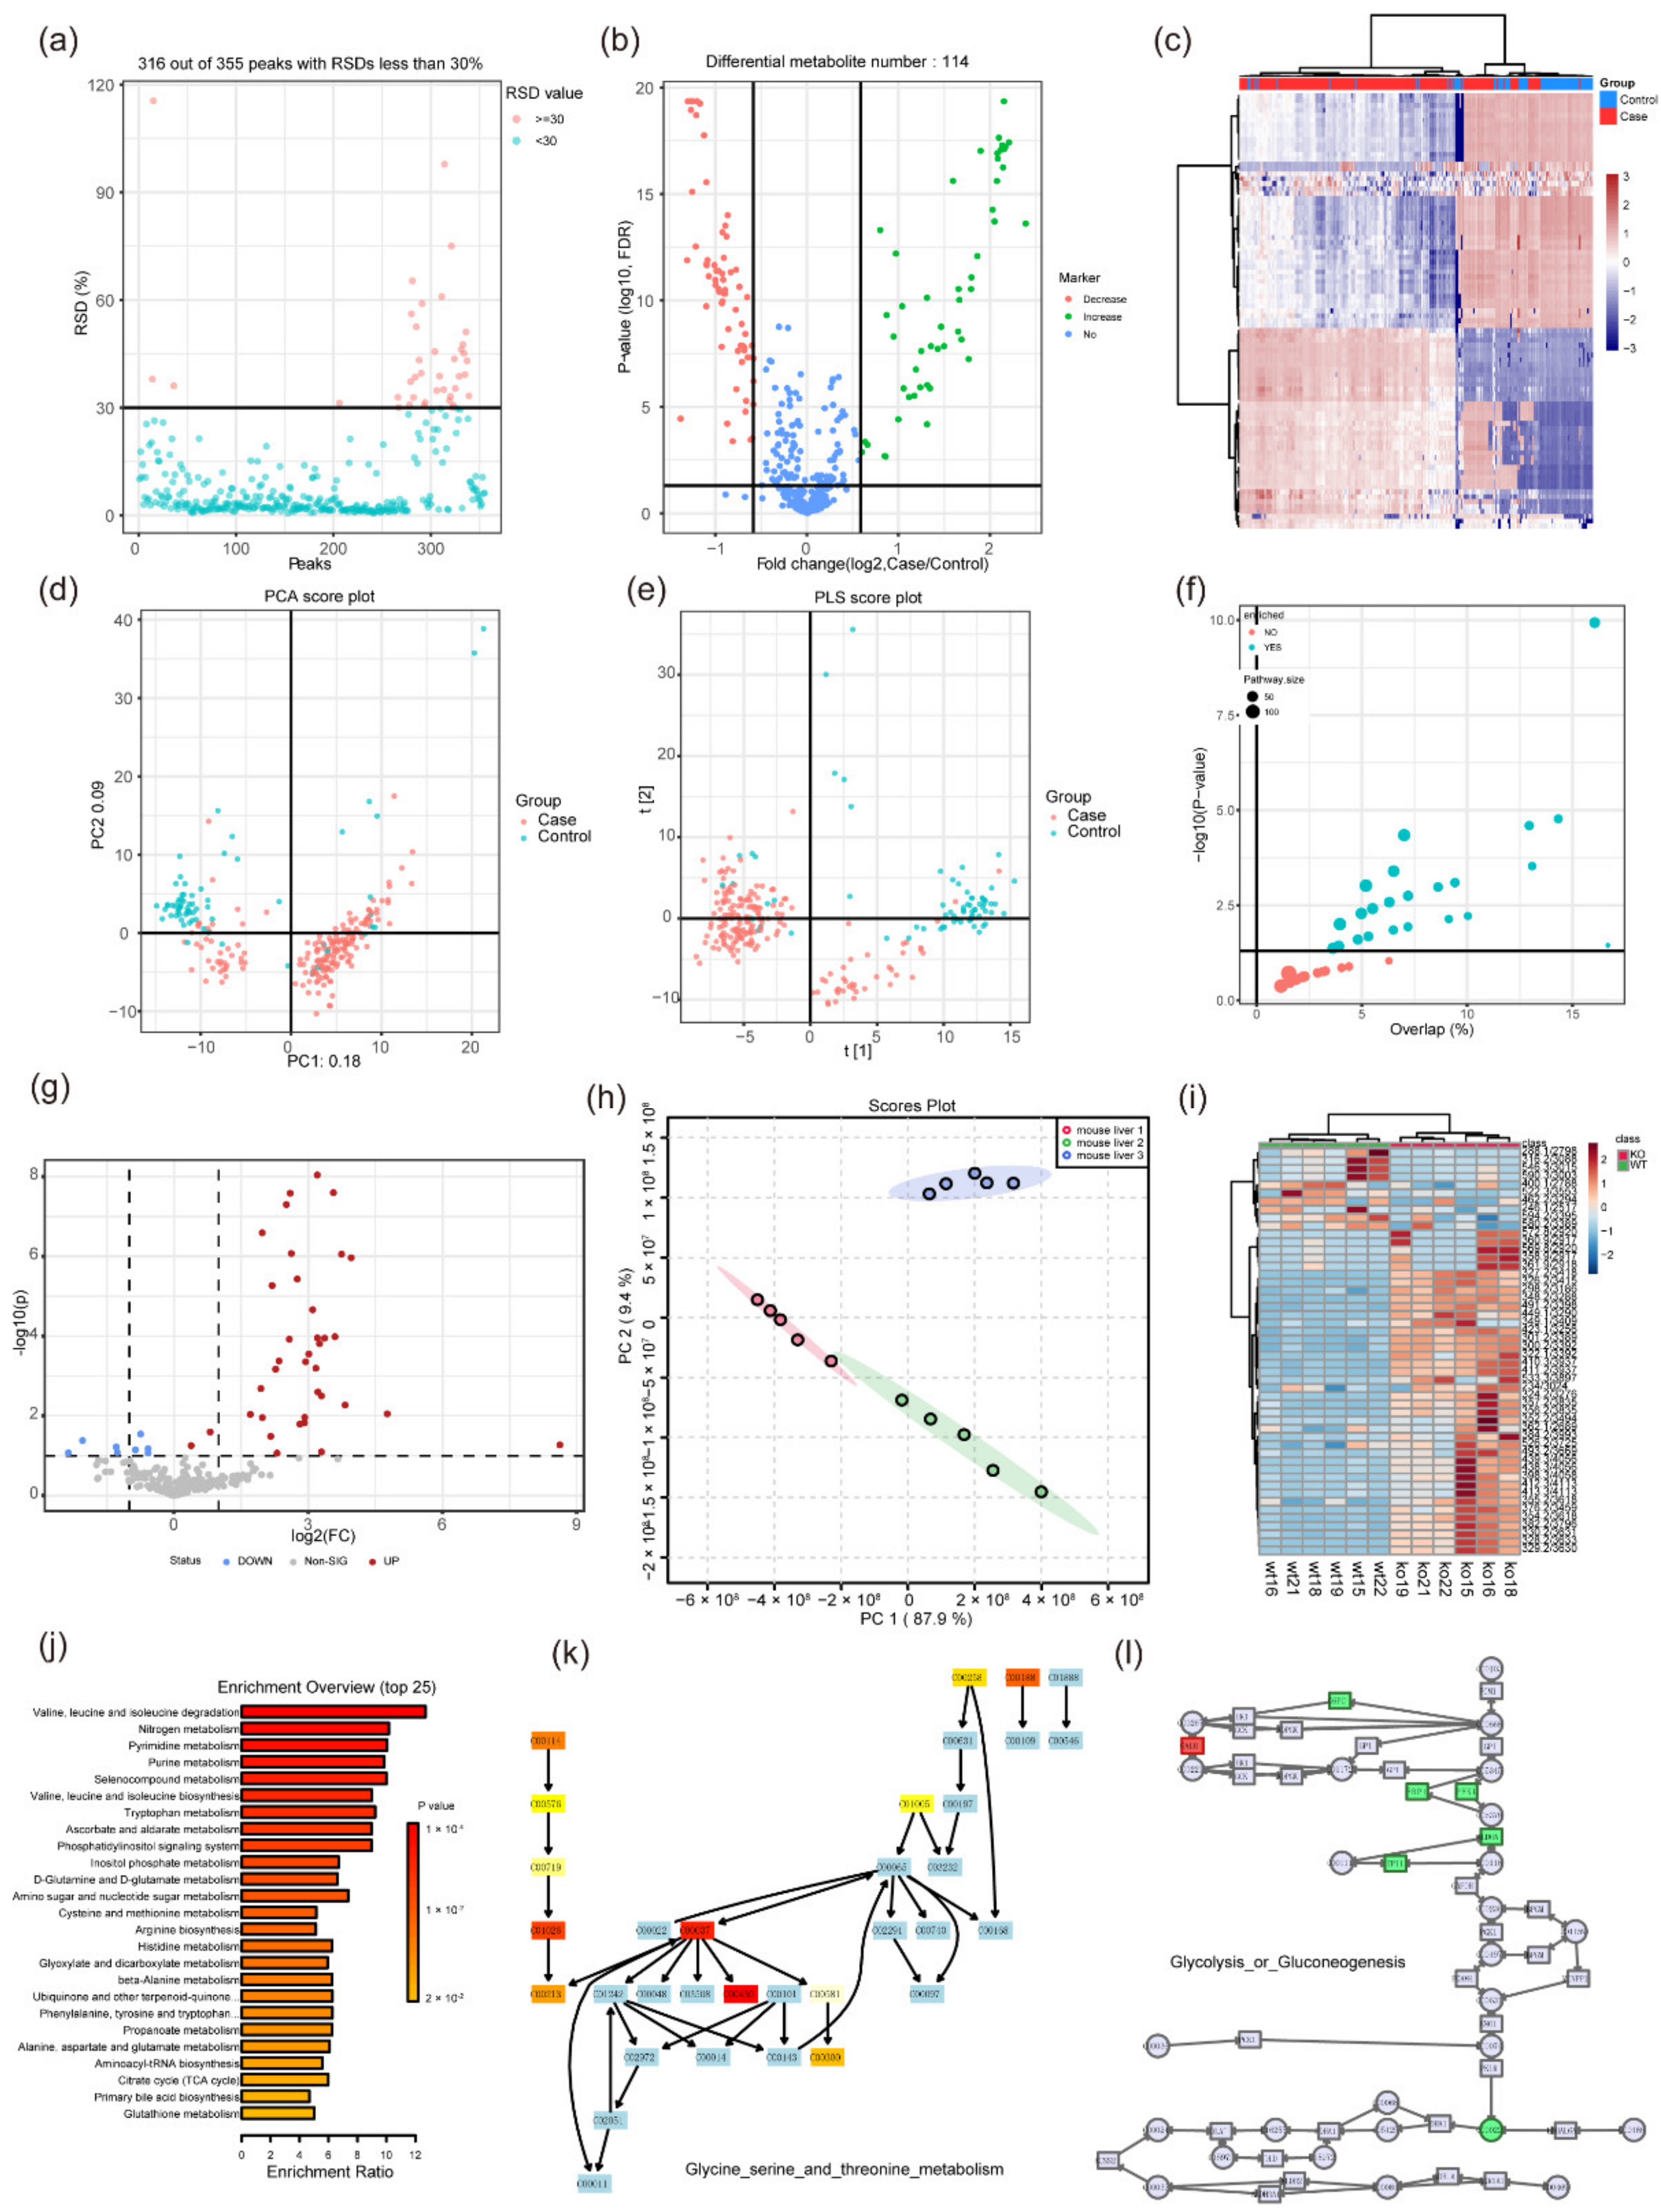
3. Statistical Analysis in Metabolomics
3.1. Univariate Analysis
3.2. Multivariate Analysis
4. Software Tools for Metabolomics Data Analysis and Integration
4.1. MS-DIAL
4.2. MZmine 3
4.3. El-MAVEN
4.4. LipidMatch
4.5. LipiDex
4.6. MetFlow
4.7. MetaboAnalyst 5.0
4.8. LipidSig
4.9. LION
4.10. METLIN
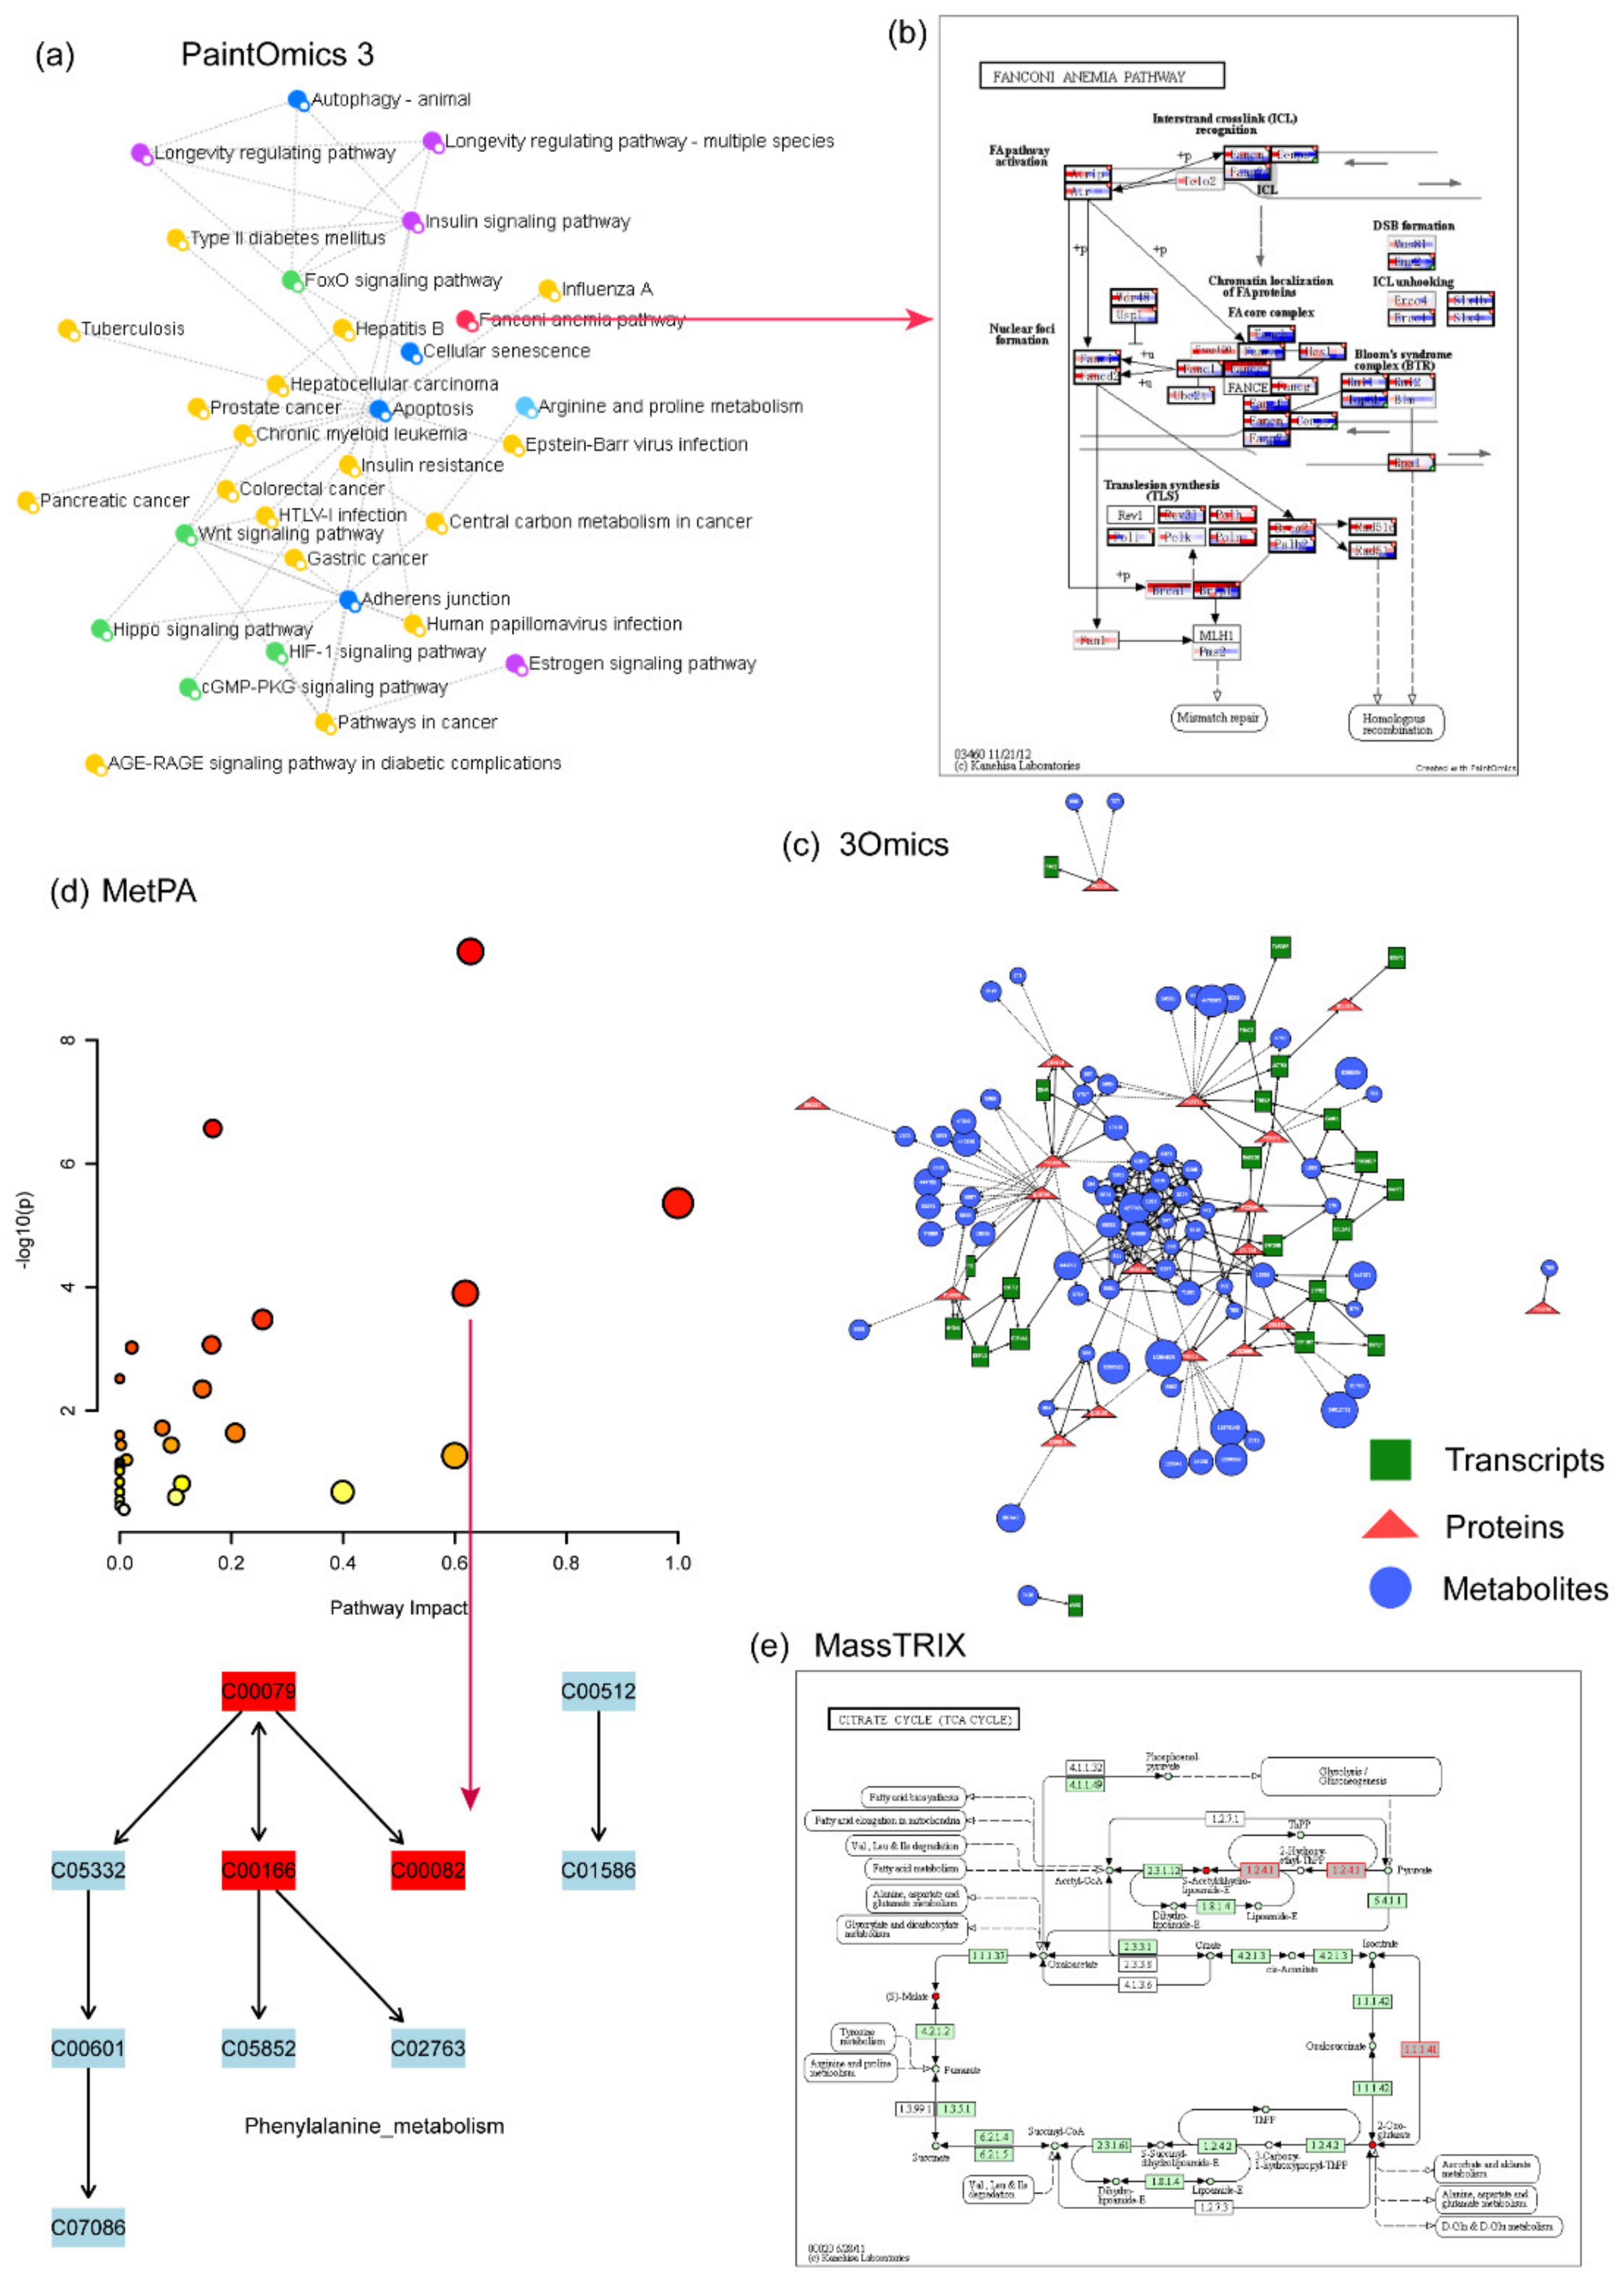
4.11. PaintOmics 3
4.12. 3Omics
4.13. IMPaLa
4.14. MetPA
4.15. MassTRIX
4.16. MetaCore™
4.17. OmicsNet
5. The Integration Algorithm of Multi-Omics Data
6. Conclusions and Prospects
Author Contributions
Funding
Institutional Review Board Statement
Informed Consent Statement
Data Availability Statement
Acknowledgments
Conflicts of Interest
References
- Patti, G.J.; Yanes, O.; Siuzdak, G. Innovation: Metabolomics: The apogee of the omics trilogy. Nat. Rev. Mol. Cell Biol. 2012, 13, 263–269. [Google Scholar] [CrossRef] [PubMed]
- Zhang, A.; Sun, H.; Wang, X. Serum metabolomics as a novel diagnostic approach for disease: A systematic review. Anal. Bioanal. Chem. 2012, 404, 1239–1245. [Google Scholar] [CrossRef] [PubMed]
- Gowda, G.A.; Zhang, S.; Gu, H.; Asiago, V.; Shanaiah, N.; Raftery, D. Metabolomics-based methods for early disease diagnostics. Expert Rev. Mol. Diagn. 2008, 8, 617–633. [Google Scholar] [CrossRef] [PubMed] [Green Version]
- Turi, K.N.; Romick-Rosendale, L.; Ryckman, K.K.; Hartert, T.V. A review of metabolomics approaches and their application in identifying causal pathways of childhood asthma. J. Allergy Clin. Immunol. 2018, 141, 1191–1201. [Google Scholar] [CrossRef] [Green Version]
- Idle, J.R.; Gonzalez, F.J. Metabolomics. Cell Metab. 2007, 6, 348–351. [Google Scholar] [CrossRef] [Green Version]
- Pacchiarotta, T.; Deelder, A.M.; Mayboroda, O.A. Metabolomic investigations of human infections. Bioanalysis 2012, 4, 919–925. [Google Scholar] [CrossRef]
- Scrivo, R.; Casadei, L.; Valerio, M.; Priori, R.; Valesini, G.; Manetti, C. Metabolomics approach in allergic and rheumatic diseases. Curr. Allergy Asthma Rep. 2014, 14, 445. [Google Scholar] [CrossRef]
- Johnson, C.H.; Patterson, A.D.; Idle, J.R.; Gonzalez, F.J. Xenobiotic metabolomics: Major impact on the metabolome. Annu. Rev. Pharmacol. Toxicol. 2012, 52, 37–56. [Google Scholar] [CrossRef]
- Fahy, E.; Subramaniam, S.; Brown, H.A.; Glass, C.K.; Merrill, A.H., Jr.; Murphy, R.C.; Raetz, C.R.; Russell, D.W.; Seyama, Y.; Shaw, W.; et al. A comprehensive classification system for lipids. J. Lipid. Res. 2005, 46, 839–861. [Google Scholar] [CrossRef] [Green Version]
- Walther, T.C.; Farese, R.V., Jr. Lipid droplets and cellular lipid metabolism. Annu. Rev. Biochem. 2012, 81, 687–714. [Google Scholar] [CrossRef] [Green Version]
- Beloribi-Djefaflia, S.; Vasseur, S.; Guillaumond, F. Lipid metabolic reprogramming in cancer cells. Oncogenesis 2016, 5, e189. [Google Scholar] [CrossRef] [PubMed]
- Musunuru, K.; Kathiresan, S. Surprises From Genetic Analyses of Lipid Risk Factors for Atherosclerosis. Circ. Res. 2016, 118, 579–585. [Google Scholar] [CrossRef] [PubMed] [Green Version]
- Musunuru, K.; Kathiresan, S. Genetics of Common, Complex Coronary Artery Disease. Cell 2019, 177, 132–145. [Google Scholar] [CrossRef] [PubMed]
- Han, X.; Gross, R.W. Global analyses of cellular lipidomes directly from crude extracts of biological samples by ESI mass spectrometry: A bridge to lipidomics. J. Lipid. Res. 2003, 44, 1071–1079. [Google Scholar] [CrossRef] [PubMed] [Green Version]
- Wenk, M.R. The emerging field of lipidomics. Nat. Rev. Drug Discov. 2005, 4, 594–610. [Google Scholar] [CrossRef]
- van Meer, G.; Voelker, D.R.; Feigenson, G.W. Membrane lipids: Where they are and how they behave. Nat. Rev. Mol. Cell Biol. 2008, 9, 112–124. [Google Scholar] [CrossRef]
- Zullig, T.; Kofeler, H.C. High Resolution Mass Spectrometry in Lipidomics. Mass Spectrom. Rev. 2021, 40, 162–176. [Google Scholar] [CrossRef] [Green Version]
- Pasikanti, K.K.; Esuvaranathan, K.; Hong, Y.; Ho, P.C.; Mahendran, R.; Raman Nee Mani, L.; Chiong, E.; Chan, E.C. Urinary metabotyping of bladder cancer using two-dimensional gas chromatography time-of-flight mass spectrometry. J. Proteome Res. 2013, 12, 3865–3873. [Google Scholar] [CrossRef]
- Pasikanti, K.K.; Esuvaranathan, K.; Ho, P.C.; Mahendran, R.; Kamaraj, R.; Wu, Q.H.; Chiong, E.; Chan, E.C. Noninvasive urinary metabonomic diagnosis of human bladder cancer. J. Proteome Res. 2010, 9, 2988–2995. [Google Scholar] [CrossRef]
- Huang, Z.; Lin, L.; Gao, Y.; Chen, Y.; Yan, X.; Xing, J.; Hang, W. Bladder cancer determination via two urinary metabolites: A biomarker pattern approach. Mol. Cell. Proteom. MCP 2011, 10, M111.007922. [Google Scholar] [CrossRef] [Green Version]
- Wittmann, B.M.; Stirdivant, S.M.; Mitchell, M.W.; Wulff, J.E.; McDunn, J.E.; Li, Z.; Dennis-Barrie, A.; Neri, B.P.; Milburn, M.V.; Lotan, Y.; et al. Bladder cancer biomarker discovery using global metabolomic profiling of urine. PLoS ONE 2014, 9, e115870. [Google Scholar] [CrossRef] [PubMed]
- Srivastava, S.; Roy, R.; Singh, S.; Kumar, P.; Dalela, D.; Sankhwar, S.N.; Goel, A.; Sonkar, A.A. Taurine—A possible fingerprint biomarker in non-muscle invasive bladder cancer: A pilot study by 1H NMR spectroscopy. Cancer Biomark. Sect. A Dis. Markers 2010, 6, 11–20. [Google Scholar] [CrossRef] [PubMed]
- Cheng, X.; Liu, X.; Liu, X.; Guo, Z.; Sun, H.; Zhang, M.; Ji, Z.; Sun, W. Metabolomics of Non-muscle Invasive Bladder Cancer: Biomarkers for Early Detection of Bladder Cancer. Front. Oncol. 2018, 8, 494. [Google Scholar] [CrossRef] [PubMed]
- Cheng, Y.; Xie, G.; Chen, T.; Qiu, Y.; Zou, X.; Zheng, M.; Tan, B.; Feng, B.; Dong, T.; He, P.; et al. Distinct urinary metabolic profile of human colorectal cancer. J. Proteome Res. 2012, 11, 1354–1363. [Google Scholar] [CrossRef]
- Chen, T.; Xie, G.; Wang, X.; Fan, J.; Qiu, Y.; Zheng, X.; Qi, X.; Cao, Y.; Su, M.; Wang, X.; et al. Serum and urine metabolite profiling reveals potential biomarkers of human hepatocellular carcinoma. Mol. Cell. Proteom. MCP 2011, 10, M110.004945. [Google Scholar] [CrossRef] [Green Version]
- Shariff, M.I.; Gomaa, A.I.; Cox, I.J.; Patel, M.; Williams, H.R.; Crossey, M.M.; Thillainayagam, A.V.; Thomas, H.C.; Waked, I.; Khan, S.A.; et al. Urinary metabolic biomarkers of hepatocellular carcinoma in an Egyptian population: A validation study. J. Proteome Res. 2011, 10, 1828–1836. [Google Scholar] [CrossRef]
- Ladep, N.G.; Dona, A.C.; Lewis, M.R.; Crossey, M.M.; Lemoine, M.; Okeke, E.; Shimakawa, Y.; Duguru, M.; Njai, H.F.; Fye, H.K.; et al. Discovery and validation of urinary metabotypes for the diagnosis of hepatocellular carcinoma in West Africans. Hepatology 2014, 60, 1291–1301. [Google Scholar] [CrossRef] [Green Version]
- Cox, I.J.; Aliev, A.E.; Crossey, M.M.; Dawood, M.; Al-Mahtab, M.; Akbar, S.M.; Rahman, S.; Riva, A.; Williams, R.; Taylor-Robinson, S.D. Urinary nuclear magnetic resonance spectroscopy of a Bangladeshi cohort with hepatitis-B hepatocellular carcinoma: A biomarker corroboration study. World J. Gastroenterol. 2016, 22, 4191–4200. [Google Scholar] [CrossRef] [Green Version]
- Chen, J.; Wang, W.; Lv, S.; Yin, P.; Zhao, X.; Lu, X.; Zhang, F.; Xu, G. Metabonomics study of liver cancer based on ultra performance liquid chromatography coupled to mass spectrometry with HILIC and RPLC separations. Anal. Chim. Acta 2009, 650, 3–9. [Google Scholar] [CrossRef]
- Shariff, M.I.; Ladep, N.G.; Cox, I.J.; Williams, H.R.; Okeke, E.; Malu, A.; Thillainayagam, A.V.; Crossey, M.M.; Khan, S.A.; Thomas, H.C.; et al. Characterization of urinary biomarkers of hepatocellular carcinoma using magnetic resonance spectroscopy in a Nigerian population. J. Proteome Res. 2010, 9, 1096–1103. [Google Scholar] [CrossRef]
- Liang, Q.; Liu, H.; Wang, C.; Li, B. Phenotypic Characterization Analysis of Human Hepatocarcinoma by Urine Metabolomics Approach. Sci. Rep. 2016, 6, 19763. [Google Scholar] [CrossRef] [PubMed] [Green Version]
- Osman, D.; Ali, O.; Obada, M.; El-Mezayen, H.; El-Said, H. Chromatographic determination of some biomarkers of liver cirrhosis and hepatocellular carcinoma in Egyptian patients. Biomed. Chromatogr. BMC 2017, 31, e3893. [Google Scholar] [CrossRef] [PubMed]
- Wu, H.; Xue, R.; Dong, L.; Liu, T.; Deng, C.; Zeng, H.; Shen, X. Metabolomic profiling of human urine in hepatocellular carcinoma patients using gas chromatography/mass spectrometry. Anal. Chim. Acta 2009, 648, 98–104. [Google Scholar] [CrossRef] [PubMed]
- Salek, R.M.; Maguire, M.L.; Bentley, E.; Rubtsov, D.V.; Hough, T.; Cheeseman, M.; Nunez, D.; Sweatman, B.C.; Haselden, J.N.; Cox, R.D.; et al. A metabolomic comparison of urinary changes in type 2 diabetes in mouse, rat, and human. Physiol. Genom. 2007, 29, 99–108. [Google Scholar] [CrossRef] [Green Version]
- Adams, S.H.; Hoppel, C.L.; Lok, K.H.; Zhao, L.; Wong, S.W.; Minkler, P.E.; Hwang, D.H.; Newman, J.W.; Garvey, W.T. Plasma acylcarnitine profiles suggest incomplete long-chain fatty acid beta-oxidation and altered tricarboxylic acid cycle activity in type 2 diabetic African-American women. J. Nutr. 2009, 139, 1073–1081. [Google Scholar] [CrossRef]
- Mihalik, S.J.; Goodpaster, B.H.; Kelley, D.E.; Chace, D.H.; Vockley, J.; Toledo, F.G.; DeLany, J.P. Increased levels of plasma acylcarnitines in obesity and type 2 diabetes and identification of a marker of glucolipotoxicity. Obesity 2010, 18, 1695–1700. [Google Scholar] [CrossRef] [Green Version]
- Ha, C.Y.; Kim, J.Y.; Paik, J.K.; Kim, O.Y.; Paik, Y.H.; Lee, E.J.; Lee, J.H. The association of specific metabolites of lipid metabolism with markers of oxidative stress, inflammation and arterial stiffness in men with newly diagnosed type 2 diabetes. Clin. Endocrinol. 2012, 76, 674–682. [Google Scholar] [CrossRef]
- Li, X.; Xu, Z.; Lu, X.; Yang, X.; Yin, P.; Kong, H.; Yu, Y.; Xu, G. Comprehensive two-dimensional gas chromatography/time-of-flight mass spectrometry for metabonomics: Biomarker discovery for diabetes mellitus. Anal. Chim. Acta 2009, 633, 257–262. [Google Scholar] [CrossRef]
- Liu, L.; Li, Y.; Guan, C.; Li, K.; Wang, C.; Feng, R.; Sun, C. Free fatty acid metabolic profile and biomarkers of isolated post-challenge diabetes and type 2 diabetes mellitus based on GC-MS and multivariate statistical analysis. J. Chromatogr. B Anal. Technol. Biomed. Life Sci. 2010, 878, 2817–2825. [Google Scholar] [CrossRef]
- Mozaffarian, D.; Cao, H.; King, I.B.; Lemaitre, R.N.; Song, X.; Siscovick, D.S.; Hotamisligil, G.S. Circulating palmitoleic acid and risk of metabolic abnormalities and new-onset diabetes. Am. J. Clin. Nutr. 2010, 92, 1350–1358. [Google Scholar] [CrossRef] [Green Version]
- Lee, Y.; Pamungkas, A.D.; Medriano, C.A.D.; Park, J.; Hong, S.; Jee, S.H.; Park, Y.H. High-resolution metabolomics determines the mode of onset of type 2 diabetes in a 3-year prospective cohort study. Int. J. Mol. Med. 2018, 41, 1069–1077. [Google Scholar] [CrossRef] [PubMed]
- Messana, I.; Forni, F.; Ferrari, F.; Rossi, C.; Giardina, B.; Zuppi, C. Proton nuclear magnetic resonance spectral profiles of urine in type II diabetic patients. Clin. Chem. 1998, 44, 1529–1534. [Google Scholar] [CrossRef] [PubMed] [Green Version]
- Suhre, K.; Meisinger, C.; Doring, A.; Altmaier, E.; Belcredi, P.; Gieger, C.; Chang, D.; Milburn, M.V.; Gall, W.E.; Weinberger, K.M.; et al. Metabolic footprint of diabetes: A multiplatform metabolomics study in an epidemiological setting. PLoS ONE 2010, 5, e13953. [Google Scholar] [CrossRef] [PubMed] [Green Version]
- Lu, J.; Zhou, J.; Bao, Y.; Chen, T.; Zhang, Y.; Zhao, A.; Qiu, Y.; Xie, G.; Wang, C.; Jia, W.; et al. Serum metabolic signatures of fulminant type 1 diabetes. J. Proteome Res. 2012, 11, 4705–4711. [Google Scholar] [CrossRef] [PubMed]
- Ferrannini, E.; Natali, A.; Camastra, S.; Nannipieri, M.; Mari, A.; Adam, K.P.; Milburn, M.V.; Kastenmuller, G.; Adamski, J.; Tuomi, T.; et al. Early metabolic markers of the development of dysglycemia and type 2 diabetes and their physiological significance. Diabetes 2013, 62, 1730–1737. [Google Scholar] [CrossRef] [Green Version]
- Floegel, A.; Stefan, N.; Yu, Z.; Muhlenbruch, K.; Drogan, D.; Joost, H.G.; Fritsche, A.; Haring, H.U.; Hrabe de Angelis, M.; Peters, A.; et al. Identification of serum metabolites associated with risk of type 2 diabetes using a targeted metabolomic approach. Diabetes 2013, 62, 639–648. [Google Scholar] [CrossRef] [Green Version]
- Fiehn, O.; Garvey, W.T.; Newman, J.W.; Lok, K.H.; Hoppel, C.L.; Adams, S.H. Plasma metabolomic profiles reflective of glucose homeostasis in non-diabetic and type 2 diabetic obese African-American women. PLoS ONE 2010, 5, e15234. [Google Scholar] [CrossRef] [Green Version]
- Hodge, A.M.; English, D.R.; O’Dea, K.; Sinclair, A.J.; Makrides, M.; Gibson, R.A.; Giles, G.G. Plasma phospholipid and dietary fatty acids as predictors of type 2 diabetes: Interpreting the role of linoleic acid. Am. J. Clin. Nutr. 2007, 86, 189–197. [Google Scholar] [CrossRef] [Green Version]
- Chow, L.S.; Li, S.; Eberly, L.E.; Seaquist, E.R.; Eckfeldt, J.H.; Hoogeveen, R.C.; Couper, D.J.; Steffen, L.M.; Pankow, J.S. Estimated plasma stearoyl co-A desaturase-1 activity and risk of incident diabetes: The Atherosclerosis Risk in Communities (ARIC) study. Metab. Clin. Exp. 2013, 62, 100–108. [Google Scholar] [CrossRef] [Green Version]
- Nakashima, K. Glycolytic and gluconeogenic metabolites and enzymes in the liver of obese-hyperglycemic mice (KK) and alloxan diabetic mice. Nagoya J. Med. Sci. 1969, 32, 143–158. [Google Scholar]
- Wood, I.S.; Stezhka, T.; Trayhurn, P. Modulation of adipokine production, glucose uptake and lactate release in human adipocytes by small changes in oxygen tension. Pflug. Arch. Eur. J. Physiol. 2011, 462, 469–477. [Google Scholar] [CrossRef] [PubMed]
- Bohm, A.; Halama, A.; Meile, T.; Zdichavsky, M.; Lehmann, R.; Weigert, C.; Fritsche, A.; Stefan, N.; Konigsrainer, A.; Haring, H.U.; et al. Metabolic signatures of cultured human adipocytes from metabolically healthy versus unhealthy obese individuals. PLoS ONE 2014, 9, e93148. [Google Scholar] [CrossRef] [PubMed]
- Lillefosse, H.H.; Clausen, M.R.; Yde, C.C.; Ditlev, D.B.; Zhang, X.; Du, Z.Y.; Bertram, H.C.; Madsen, L.; Kristiansen, K.; Liaset, B. Urinary loss of tricarboxylic acid cycle intermediates as revealed by metabolomics studies: An underlying mechanism to reduce lipid accretion by whey protein ingestion? J. Proteome Res. 2014, 13, 2560–2570. [Google Scholar] [CrossRef] [PubMed]
- Ho, J.E.; Larson, M.G.; Ghorbani, A.; Cheng, S.; Chen, M.H.; Keyes, M.; Rhee, E.P.; Clish, C.B.; Vasan, R.S.; Gerszten, R.E.; et al. Metabolomic Profiles of Body Mass Index in the Framingham Heart Study Reveal Distinct Cardiometabolic Phenotypes. PLoS ONE 2016, 11, e0148361. [Google Scholar] [CrossRef] [PubMed] [Green Version]
- Cho, K.; Moon, J.S.; Kang, J.H.; Jang, H.B.; Lee, H.J.; Park, S.I.; Yu, K.S.; Cho, J.Y. Combined untargeted and targeted metabolomic profiling reveals urinary biomarkers for discriminating obese from normal-weight adolescents. Pediatric Obes. 2017, 12, 93–101. [Google Scholar] [CrossRef]
- Newgard, C.B.; An, J.; Bain, J.R.; Muehlbauer, M.J.; Stevens, R.D.; Lien, L.F.; Haqq, A.M.; Shah, S.H.; Arlotto, M.; Slentz, C.A.; et al. A branched-chain amino acid-related metabolic signature that differentiates obese and lean humans and contributes to insulin resistance. Cell Metab. 2009, 9, 311–326. [Google Scholar] [CrossRef] [Green Version]
- Graham, S.F.; Chevallier, O.P.; Elliott, C.T.; Holscher, C.; Johnston, J.; McGuinness, B.; Kehoe, P.G.; Passmore, A.P.; Green, B.D. Untargeted metabolomic analysis of human plasma indicates differentially affected polyamine and L-arginine metabolism in mild cognitive impairment subjects converting to Alzheimer’s disease. PLoS ONE 2015, 10, e0119452. [Google Scholar] [CrossRef]
- Toledo, J.B.; Arnold, M.; Kastenmuller, G.; Chang, R.; Baillie, R.A.; Han, X.; Thambisetty, M.; Tenenbaum, J.D.; Suhre, K.; Thompson, J.W.; et al. Metabolic network failures in Alzheimer’s disease: A biochemical road map. Alzheimer’s Dement. J. Alzheimer’s Assoc. 2017, 13, 965–984. [Google Scholar] [CrossRef]
- Proitsi, P.; Kim, M.; Whiley, L.; Pritchard, M.; Leung, R.; Soininen, H.; Kloszewska, I.; Mecocci, P.; Tsolaki, M.; Vellas, B.; et al. Plasma lipidomics analysis finds long chain cholesteryl esters to be associated with Alzheimer’s disease. Transl. Psychiatry 2015, 5, e494. [Google Scholar] [CrossRef] [Green Version]
- Kim, M.; Nevado-Holgado, A.; Whiley, L.; Snowden, S.G.; Soininen, H.; Kloszewska, I.; Mecocci, P.; Tsolaki, M.; Vellas, B.; Thambisetty, M.; et al. Association between Plasma Ceramides and Phosphatidylcholines and Hippocampal Brain Volume in Late Onset Alzheimer’s Disease. J. Alzheimer’s Dis. JAD 2017, 60, 809–817. [Google Scholar] [CrossRef] [Green Version]
- Proitsi, P.; Kim, M.; Whiley, L.; Simmons, A.; Sattlecker, M.; Velayudhan, L.; Lupton, M.K.; Soininen, H.; Kloszewska, I.; Mecocci, P.; et al. Association of blood lipids with Alzheimer’s disease: A comprehensive lipidomics analysis. Alzheimer’s Dement. J. Alzheimer’s Assoc. 2017, 13, 140–151. [Google Scholar] [CrossRef] [PubMed] [Green Version]
- Snowden, S.G.; Ebshiana, A.A.; Hye, A.; An, Y.; Pletnikova, O.; O’Brien, R.; Troncoso, J.; Legido-Quigley, C.; Thambisetty, M. Association between fatty acid metabolism in the brain and Alzheimer disease neuropathology and cognitive performance: A nontargeted metabolomic study. PLoS Med. 2017, 14, e1002266. [Google Scholar] [CrossRef] [PubMed] [Green Version]
- Guiraud, S.P.; Montoliu, I.; Da Silva, L.; Dayon, L.; Galindo, A.N.; Corthesy, J.; Kussmann, M.; Martin, F.P. High-throughput and simultaneous quantitative analysis of homocysteine-methionine cycle metabolites and co-factors in blood plasma and cerebrospinal fluid by isotope dilution LC-MS/MS. Anal. Bioanal. Chem. 2017, 409, 295–305. [Google Scholar] [CrossRef] [PubMed] [Green Version]
- Paglia, G.; Stocchero, M.; Cacciatore, S.; Lai, S.; Angel, P.; Alam, M.T.; Keller, M.; Ralser, M.; Astarita, G. Unbiased Metabolomic Investigation of Alzheimer’s Disease Brain Points to Dysregulation of Mitochondrial Aspartate Metabolism. J. Proteome Res. 2016, 15, 608–618. [Google Scholar] [CrossRef] [PubMed] [Green Version]
- Koal, T.; Klavins, K.; Seppi, D.; Kemmler, G.; Humpel, C. Sphingomyelin SM(d18:1/18:0) is significantly enhanced in cerebrospinal fluid samples dichotomized by pathological amyloid-beta42, tau, and phospho-tau-181 levels. J. Alzheimer’s Dis. JAD 2015, 44, 1193–1201. [Google Scholar] [CrossRef] [PubMed] [Green Version]
- Mamas, M.; Dunn, W.B.; Neyses, L.; Goodacre, R. The role of metabolites and metabolomics in clinically applicable biomarkers of disease. Arch. Toxicol. 2011, 85, 5–17. [Google Scholar] [CrossRef] [PubMed]
- Puchades-Carrasco, L.; Lecumberri, R.; Martinez-Lopez, J.; Lahuerta, J.J.; Mateos, M.V.; Prosper, F.; San-Miguel, J.F.; Pineda-Lucena, A. Multiple myeloma patients have a specific serum metabolomic profile that changes after achieving complete remission. Clin. Cancer Res. Off. J. Am. Assoc. Cancer Res. 2013, 19, 4770–4779. [Google Scholar] [CrossRef] [Green Version]
- O’Shea, K.; Misra, B.B. Software tools, databases and resources in metabolomics: Updates from 2018 to 2019. Metabolomics 2020, 16, 36. [Google Scholar] [CrossRef]
- Mattoli, L.; Gianni, M.; Burico, M. Mass Spectrometry Based Metabolomic Analysis as a Tool for Quality Control of Natural Complex Products. Mass Spectrom. Rev. 2022. [Google Scholar] [CrossRef]
- Beisken, S.; Eiden, M.; Salek, R.M. Getting the right answers: Understanding metabolomics challenges. Expert Rev. Mol. Diagn. 2015, 15, 97–109. [Google Scholar] [CrossRef]
- Burnap, R.L. Systems and photosystems: Cellular limits of autotrophic productivity in cyanobacteria. Front. Bioeng. Biotechnol. 2015, 3, 1. [Google Scholar] [CrossRef]
- Ma, S.; Huang, J. Regularized gene selection in cancer microarray meta-analysis. BMC Bioinform. 2009, 10, 1. [Google Scholar] [CrossRef] [PubMed] [Green Version]
- Theodoridis, G.; Gika, H.G.; Wilson, I.D. Mass spectrometry-based holistic analytical approaches for metabolite profiling in systems biology studies. Mass Spectrom. Rev. 2011, 30, 884–906. [Google Scholar] [CrossRef] [PubMed]
- Ho, C.S.; Lam, C.W.; Chan, M.H.; Cheung, R.C.; Law, L.K.; Lit, L.C.; Ng, K.F.; Suen, M.W.; Tai, H.L. Electrospray ionisation mass spectrometry: Principles and clinical applications. Clin. Biochem. Rev. 2003, 24, 3–12. [Google Scholar] [PubMed]
- Pan, Z.; Raftery, D. Comparing and combining NMR spectroscopy and mass spectrometry in metabolomics. Anal. Bioanal. Chem. 2007, 387, 525–527. [Google Scholar] [CrossRef]
- Veenstra, T.D. Metabolomics: The final frontier? Genome Med. 2012, 4, 40. [Google Scholar] [CrossRef] [Green Version]
- Ebbels, T.M.; Lindon, J.C.; Coen, M. Processing and modeling of nuclear magnetic resonance (NMR) metabolic profiles. Methods Mol. Biol. 2011, 708, 365–388. [Google Scholar] [CrossRef]
- DeFeo, E.M.; Wu, C.L.; McDougal, W.S.; Cheng, L.L. A decade in prostate cancer: From NMR to metabolomics. Nat. Rev. Urol. 2011, 8, 301–311. [Google Scholar] [CrossRef]
- Vignoli, A.; Ghini, V.; Meoni, G.; Licari, C.; Takis, P.G.; Tenori, L.; Turano, P.; Luchinat, C. High-Throughput Metabolomics by 1D NMR. Angew. Chem. Int. Ed. Engl. 2019, 58, 968–994. [Google Scholar] [CrossRef]
- Chaleckis, R.; Meister, I.; Zhang, P.; Wheelock, C.E. Challenges, progress and promises of metabolite annotation for LC-MS-based metabolomics. Curr. Opin. Biotechnol. 2019, 55, 44–50. [Google Scholar] [CrossRef]
- Lai, Z.; Fiehn, O. Mass spectral fragmentation of trimethylsilylated small molecules. Mass Spectrom. Rev. 2018, 37, 245–257. [Google Scholar] [CrossRef] [PubMed]
- Wei, J.; Xiang, L.; Cai, Z. Emerging environmental pollutants hydroxylated polybrominated diphenyl ethers: From analytical methods to toxicology research. Mass Spectrom. Rev. 2021, 40, 255–279. [Google Scholar] [CrossRef] [PubMed]
- Castle, A.L.; Fiehn, O.; Kaddurah-Daouk, R.; Lindon, J.C. Metabolomics Standards Workshop and the development of international standards for reporting metabolomics experimental results. Brief. Bioinform. 2006, 7, 159–165. [Google Scholar] [CrossRef] [PubMed] [Green Version]
- Zhang, A.; Sun, H.; Wang, P.; Han, Y.; Wang, X. Modern analytical techniques in metabolomics analysis. Analyst 2012, 137, 293–300. [Google Scholar] [CrossRef] [PubMed]
- Smith, C.A.; Want, E.J.; O’Maille, G.; Abagyan, R.; Siuzdak, G. XCMS: Processing mass spectrometry data for metabolite profiling using nonlinear peak alignment, matching, and identification. Anal. Chem. 2006, 78, 779–787. [Google Scholar] [CrossRef]
- Clasquin, M.F.; Melamud, E.; Rabinowitz, J.D. LC-MS data processing with MAVEN: A metabolomic analysis and visualization engine. Curr. Protoc. Bioinform. 2012, 37, 14.11.1–14.11.23. [Google Scholar] [CrossRef] [Green Version]
- Pluskal, T.; Castillo, S.; Villar-Briones, A.; Oresic, M. MZmine 2: Modular framework for processing, visualizing, and analyzing mass spectrometry-based molecular profile data. BMC Bioinform. 2010, 11, 395. [Google Scholar] [CrossRef] [Green Version]
- Salek, R.M.; Steinbeck, C.; Viant, M.R.; Goodacre, R.; Dunn, W.B. The role of reporting standards for metabolite annotation and identification in metabolomic studies. Gigascience 2013, 2, 13. [Google Scholar] [CrossRef]
- Wishart, D.S.; Feunang, Y.D.; Marcu, A.; Guo, A.C.; Liang, K.; Vazquez-Fresno, R.; Sajed, T.; Johnson, D.; Li, C.; Karu, N.; et al. HMDB 4.0: The human metabolome database for 2018. Nucleic Acids Res. 2018, 46, D608–D617. [Google Scholar] [CrossRef]
- Guijas, C.; Montenegro-Burke, J.R.; Domingo-Almenara, X.; Palermo, A.; Warth, B.; Hermann, G.; Koellensperger, G.; Huan, T.; Uritboonthai, W.; Aisporna, A.E.; et al. METLIN: A Technology Platform for Identifying Knowns and Unknowns. Anal. Chem. 2018, 90, 3156–3164. [Google Scholar] [CrossRef] [Green Version]
- Sugimoto, M.; Kawakami, M.; Robert, M.; Soga, T.; Tomita, M. Bioinformatics Tools for Mass Spectroscopy-Based Metabolomic Data Processing and Analysis. Curr. Bioinform. 2012, 7, 96–108. [Google Scholar] [CrossRef] [PubMed]
- Reshetova, P.; Smilde, A.K.; van Kampen, A.H.; Westerhuis, J.A. Use of prior knowledge for the analysis of high-throughput transcriptomics and metabolomics data. BMC Syst. Biol. 2014, 8 (Suppl. S2), S2. [Google Scholar] [CrossRef] [PubMed] [Green Version]
- Xia, J.; Wishart, D.S. MSEA: A web-based tool to identify biologically meaningful patterns in quantitative metabolomic data. Nucleic Acids Res. 2010, 38, W71–W77. [Google Scholar] [CrossRef] [PubMed] [Green Version]
- Chong, J.; Soufan, O.; Li, C.; Caraus, I.; Li, S.; Bourque, G.; Wishart, D.S.; Xia, J. MetaboAnalyst 4.0: Towards more transparent and integrative metabolomics analysis. Nucleic Acids Res. 2018, 46, W486–W494. [Google Scholar] [CrossRef] [Green Version]
- Ogata, H.; Goto, S.; Sato, K.; Fujibuchi, W.; Bono, H.; Kanehisa, M. KEGG: Kyoto Encyclopedia of Genes and Genomes. Nucleic Acids Res. 1999, 27, 29–34. [Google Scholar] [CrossRef] [Green Version]
- Noble, W.S. How does multiple testing correction work? Nat. Biotechnol. 2009, 27, 1135–1137. [Google Scholar] [CrossRef] [Green Version]
- Antonelli, J.; Claggett, B.L.; Henglin, M.; Kim, A.; Ovsak, G.; Kim, N.; Deng, K.; Rao, K.; Tyagi, O.; Watrous, J.D.; et al. Statistical Workflow for Feature Selection in Human Metabolomics Data. Metabolites 2019, 9, 143. [Google Scholar] [CrossRef] [Green Version]
- Chen, T.; Cao, Y.; Zhang, Y.; Liu, J.; Bao, Y.; Wang, C.; Jia, W.; Zhao, A. Random forest in clinical metabolomics for phenotypic discrimination and biomarker selection. Evid.-Based Complementary Altern. Med. 2013, 2013, 298183. [Google Scholar] [CrossRef] [Green Version]
- Gromski, P.S.; Xu, Y.; Kotze, H.L.; Correa, E.; Ellis, D.I.; Armitage, E.G.; Turner, M.L.; Goodacre, R. Influence of missing values substitutes on multivariate analysis of metabolomics data. Metabolites 2014, 4, 433–452. [Google Scholar] [CrossRef] [Green Version]
- Tsugawa, H.; Cajka, T.; Kind, T.; Ma, Y.; Higgins, B.; Ikeda, K.; Kanazawa, M.; VanderGheynst, J.; Fiehn, O.; Arita, M. MS-DIAL: Data-independent MS/MS deconvolution for comprehensive metabolome analysis. Nat. Methods 2015, 12, 523–526. [Google Scholar] [CrossRef]
- Tsugawa, H.; Ikeda, K.; Takahashi, M.; Satoh, A.; Mori, Y.; Uchino, H.; Okahashi, N.; Yamada, Y.; Tada, I.; Bonini, P.; et al. A lipidome atlas in MS-DIAL 4. Nat. Biotechnol. 2020, 38, 1159–1163. [Google Scholar] [CrossRef] [PubMed]
- Agrawal, S.; Kumar, S.; Sehgal, R.; George, S.; Gupta, R.; Poddar, S.; Jha, A.; Pathak, S. El-MAVEN: A Fast, Robust, and User-Friendly Mass Spectrometry Data Processing Engine for Metabolomics. Methods Mol. Biol. 2019, 1978, 301–321. [Google Scholar] [CrossRef] [PubMed]
- Koelmel, J.P.; Kroeger, N.M.; Ulmer, C.Z.; Bowden, J.A.; Patterson, R.E.; Cochran, J.A.; Beecher, C.W.W.; Garrett, T.J.; Yost, R.A. LipidMatch: An automated workflow for rule-based lipid identification using untargeted high-resolution tandem mass spectrometry data. BMC Bioinform. 2017, 18, 331. [Google Scholar] [CrossRef] [PubMed]
- Hutchins, P.D.; Russell, J.D.; Coon, J.J. LipiDex: An Integrated Software Package for High-Confidence Lipid Identification. Cell Syst. 2018, 6, 621–625.e625. [Google Scholar] [CrossRef] [PubMed] [Green Version]
- Shen, X.; Zhu, Z.J. MetFlow: An interactive and integrated workflow for metabolomics data cleaning and differential metabolite discovery. Bioinformatics 2019, 35, 2870–2872. [Google Scholar] [CrossRef]
- Xia, J.; Psychogios, N.; Young, N.; Wishart, D.S. MetaboAnalyst: A web server for metabolomic data analysis and interpretation. Nucleic Acids Res. 2009, 37, W652–W660. [Google Scholar] [CrossRef] [Green Version]
- Xia, J.; Mandal, R.; Sinelnikov, I.V.; Broadhurst, D.; Wishart, D.S. MetaboAnalyst 2.0—A comprehensive server for metabolomic data analysis. Nucleic Acids Res. 2012, 40, W127–W133. [Google Scholar] [CrossRef] [Green Version]
- Xia, J.; Sinelnikov, I.V.; Han, B.; Wishart, D.S. MetaboAnalyst 3.0—Making metabolomics more meaningful. Nucleic Acids Res. 2015, 43, W251–W257. [Google Scholar] [CrossRef] [Green Version]
- Pang, Z.; Chong, J.; Zhou, G.; de Lima Morais, D.A.; Chang, L.; Barrette, M.; Gauthier, C.; Jacques, P.E.; Li, S.; Xia, J. MetaboAnalyst 5.0: Narrowing the gap between raw spectra and functional insights. Nucleic Acids Res. 2021, 49, W388–W396. [Google Scholar] [CrossRef]
- Lin, W.J.; Shen, P.C.; Liu, H.C.; Cho, Y.C.; Hsu, M.K.; Lin, I.C.; Chen, F.H.; Yang, J.C.; Ma, W.L.; Cheng, W.C. LipidSig: A web-based tool for lipidomic data analysis. Nucleic Acids Res. 2021, 49, W336–W345. [Google Scholar] [CrossRef]
- Molenaar, M.R.; Jeucken, A.; Wassenaar, T.A.; van de Lest, C.H.A.; Brouwers, J.F.; Helms, J.B. LION/web: A web-based ontology enrichment tool for lipidomic data analysis. Gigascience 2019, 8, giz061. [Google Scholar] [CrossRef] [PubMed] [Green Version]
- Smith, C.A.; O’Maille, G.; Want, E.J.; Qin, C.; Trauger, S.A.; Brandon, T.R.; Custodio, D.E.; Abagyan, R.; Siuzdak, G. METLIN: A metabolite mass spectral database. Ther. Drug Monit. 2005, 27, 747–751. [Google Scholar] [CrossRef] [PubMed]
- Tautenhahn, R.; Cho, K.; Uritboonthai, W.; Zhu, Z.; Patti, G.J.; Siuzdak, G. An accelerated workflow for untargeted metabolomics using the METLIN database. Nat. Biotechnol. 2012, 30, 826–828. [Google Scholar] [CrossRef] [PubMed]
- Hernandez-de-Diego, R.; Tarazona, S.; Martinez-Mira, C.; Balzano-Nogueira, L.; Furio-Tari, P.; Pappas, G.J., Jr.; Conesa, A. PaintOmics 3: A web resource for the pathway analysis and visualization of multi-omics data. Nucleic Acids Res. 2018, 46, W503–W509. [Google Scholar] [CrossRef] [Green Version]
- Kuo, T.C.; Tian, T.F.; Tseng, Y.J. 3Omics: A web-based systems biology tool for analysis, integration and visualization of human transcriptomic, proteomic and metabolomic data. BMC Syst. Biol. 2013, 7, 64. [Google Scholar] [CrossRef] [Green Version]
- Fernandez, J.M.; Hoffmann, R.; Valencia, A. iHOP web services. Nucleic Acids Res. 2007, 35, W21–W26. [Google Scholar] [CrossRef] [Green Version]
- Kamburov, A.; Cavill, R.; Ebbels, T.M.; Herwig, R.; Keun, H.C. Integrated pathway-level analysis of transcriptomics and metabolomics data with IMPaLA. Bioinformatics 2011, 27, 2917–2918. [Google Scholar] [CrossRef]
- Xia, J.; Wishart, D.S. MetPA: A web-based metabolomics tool for pathway analysis and visualization. Bioinformatics 2010, 26, 2342–2344. [Google Scholar] [CrossRef] [Green Version]
- Suhre, K.; Schmitt-Kopplin, P. MassTRIX: Mass translator into pathways. Nucleic Acids Res. 2008, 36, W481–W484. [Google Scholar] [CrossRef] [Green Version]
- Zhou, G.; Xia, J. OmicsNet: A web-based tool for creation and visual analysis of biological networks in 3D space. Nucleic Acids Res. 2018, 46, W514–W522. [Google Scholar] [CrossRef] [Green Version]
- Altmae, S.; Esteban, F.J.; Stavreus-Evers, A.; Simon, C.; Giudice, L.; Lessey, B.A.; Horcajadas, J.A.; Macklon, N.S.; D’Hooghe, T.; Campoy, C.; et al. Guidelines for the design, analysis and interpretation of ‘omics’ data: Focus on human endometrium. Hum. Reprod. Update 2014, 20, 12–28. [Google Scholar] [CrossRef] [PubMed]
- Pedersen, H.K.; Forslund, S.K.; Gudmundsdottir, V.; Petersen, A.O.; Hildebrand, F.; Hyotylainen, T.; Nielsen, T.; Hansen, T.; Bork, P.; Ehrlich, S.D.; et al. A computational framework to integrate high-throughput ‘-omics’ datasets for the identification of potential mechanistic links. Nat. Protoc. 2018, 13, 2781–2800. [Google Scholar] [CrossRef] [PubMed]
- Kieffer, D.A.; Piccolo, B.D.; Marco, M.L.; Kim, E.B.; Goodson, M.L.; Keenan, M.J.; Dunn, T.N.; Knudsen, K.E.; Martin, R.J.; Adams, S.H. Mice Fed a High-Fat Diet Supplemented with Resistant Starch Display Marked Shifts in the Liver Metabolome Concurrent with Altered Gut Bacteria. J. Nutr. 2016, 146, 2476–2490. [Google Scholar] [CrossRef] [PubMed] [Green Version]
- Hertel, J.; Harms, A.C.; Heinken, A.; Baldini, F.; Thinnes, C.C.; Glaab, E.; Vasco, D.A.; Pietzner, M.; Stewart, I.D.; Wareham, N.J.; et al. Integrated Analyses of Microbiome and Longitudinal Metabolome Data Reveal Microbial-Host Interactions on Sulfur Metabolism in Parkinson’s Disease. Cell Rep. 2019, 29, 1767–1777.e1768. [Google Scholar] [CrossRef] [PubMed] [Green Version]
- Bai, B.; Wang, X.; Li, Y.; Chen, P.C.; Yu, K.; Dey, K.K.; Yarbro, J.M.; Han, X.; Lutz, B.M.; Rao, S.; et al. Deep Multilayer Brain Proteomics Identifies Molecular Networks in Alzheimer’s Disease Progression. Neuron 2020, 105, 975–991.e977. [Google Scholar] [CrossRef]


| Name | Year | Description | Functions | |||||||
|---|---|---|---|---|---|---|---|---|---|---|
| Data Pre-Processing | Data Processing | Statistical Analyses | Pathway Enrichment Analysis | Omics Data Integration | ||||||
| Normalization | Compound Name Identification | Transcriptomics | Proteomics | Microbiome | ||||||
| Mzmine3 | 2022 | MZmine3 builds on the success of MZmine 2 with many features focused on improving the user-friendly graphical | Y | Y | Y | Y | - | - | - | - |
| MetaboAnalyst 5.0 | 2021 | Comprehensive web-based tool for comprehensive metabolomics data analysis, interpretation, and integration with other omics data. | Y | Y | Y | Y | Y | Y | - | - |
| LipidSig | 2021 | Web-based tool for lipidomic data analysis | Y | Y | Y | Y | - | - | - | - |
| MS-DIAL 4.0 | 2020 | Lipidome atlas in MS-DIAL 4.0 | Y | Y | Y | Y | - | - | - | - |
| El-MAVEN | 2019 | Fast, Robust, and User-Friendly Mass Spectrometry Data Processing Engine for Metabolomics | Y | Y | Y | - | - | - | - | - |
| MetFlow | 2019 | Interactive and integrated web server for metabolomics data cleaning and differential metabolite discovery. | Y | Y | Y | Y | Y | - | - | - |
| LION | 2019 | Web-based ontology enrichment tool for lipidomic data analysis. | - | Y | Y | Y | Y | - | - | - |
| Omicsnet | 2018 | Web-based tool for creation and visual analysis of biological networks in 3D space | - | - | - | Y | Y | Y | Y | Y |
| METLIN | 2018 | Technology platform for the identification of known and unknown metabolites and other chemical entities. | - | - | Y | - | - | - | - | - |
| PaintOmics 3 | 2018 | Web-based resource for the integrated visualization of multiple omics data types onto KEGG pathway diagrams. | - | - | - | - | Y | Y | Y | - |
| LipiDex | 2018 | Integrated Software Package for High-Confidence Lipid Identification | Y | - | Y | - | - | - | - | - |
| LipidMatch | 2017 | Automated workflow for rule-based lipid identification using untargeted high-resolution tandem mass spectrometry data | Y | - | Y | - | - | - | - | - |
| 3Omics | 2013 | One-click web tool for fast analysis and visualization of multi-omics data. | Y | Y | - | Y | Y | Y | Y | - |
| IMPaLa | 2011 | Pathway analysis of transcriptomics or proteomics and metabolomics data. | - | - | - | - | Y | Y | Y | - |
| MetPA | 2010 | Pathway analysis for metabolomics data. | Y | - | - | - | Y | - | - | - |
| MassTRIX | 2008 | Tool for high precision MS data annotation. | Y | - | Y | - | Y | - | - | - |
| MetaCoreTM | 2004 | Commercial tool for functional analysis and integrated analysis of multi-omics data. | Y | - | - | - | Y | Y | Y | - |
Publisher’s Note: MDPI stays neutral with regard to jurisdictional claims in published maps and institutional affiliations. |
© 2022 by the authors. Licensee MDPI, Basel, Switzerland. This article is an open access article distributed under the terms and conditions of the Creative Commons Attribution (CC BY) license (https://creativecommons.org/licenses/by/4.0/).
Share and Cite
Chen, Y.; Li, E.-M.; Xu, L.-Y. Guide to Metabolomics Analysis: A Bioinformatics Workflow. Metabolites 2022, 12, 357. https://doi.org/10.3390/metabo12040357
Chen Y, Li E-M, Xu L-Y. Guide to Metabolomics Analysis: A Bioinformatics Workflow. Metabolites. 2022; 12(4):357. https://doi.org/10.3390/metabo12040357
Chicago/Turabian StyleChen, Yang, En-Min Li, and Li-Yan Xu. 2022. "Guide to Metabolomics Analysis: A Bioinformatics Workflow" Metabolites 12, no. 4: 357. https://doi.org/10.3390/metabo12040357