
Optimising Fluvoxamine Maternal/Fetal Exposure during Gestation: A Pharmacokinetic Virtual Clinical Trials Study

School of Pharmacy, College of Health and Life Science, Aston University, Birmingham B4 7ET, UK
*
Author to whom correspondence should be addressed.
Metabolites 2022, 12(12), 1281; https://doi.org/10.3390/metabo12121281
Submission received: 28 November 2022
/
Revised: 9 December 2022
/
Accepted: 11 December 2022
/
Published: 16 December 2022
(This article belongs to the Special Issue Fetal–Maternal–Neonatal Metabolomics)
Abstract
:Fluvoxamine plasma concentrations have been shown to decrease throughout pregnancy. CYP2D6 polymorphisms significantly influence these changes. However, knowledge of an optimum dose adjustment according to the CYP2D6 phenotype is still limited. This study implemented a physiologically based pharmacokinetic modelling approach to assess the gestational changes in fluvoxamine maternal and umbilical cord concentrations. The optimal dosing strategies during pregnancy were simulated, and the impact of CYP2D6 phenotypes on fluvoxamine maternal and fetal concentrations was considered. A significant decrease in fluvoxamine maternal plasma concentrations was noted during gestation. As for the fetal concentration, a substantial increase was noted for the poor metabolisers (PM), with a constant level in the ultrarapid (UM) and extensive (EM) metabolisers commencing from gestation week 20 to term. The optimum dosing regimen suggested for UM and EM reached a maximum dose of 300 mg daily at gestational weeks (GW) 15 and 35, respectively. In contrast, a stable dose of 100 mg daily throughout gestation for the PM is sufficient to maintain the fluvoxamine plasma concentration within the therapeutic window (60–230 ng/mL). Dose adjustment during pregnancy is required for fluvoxamine, particularly for UM and EM, to maintain efficacy throughout the gestational period.
1. Introduction
The rates of pregnant women diagnosed with depression have been reported as high as 25%, with a higher prevalence in the second and third trimesters [1,2,3]. Proper treatment is vital because poor management may lead to a myriad of complications for the mother and the foetus, such as malnutrition due to poor diet, preterm deliveries, foetal growth retardation, and miscarriages [4]. Thus, ensuring the optimisation of doses through gestation is essential; accordingly, plasma concentration levels are used as a guide in this respect [5]. In terms of the treatment selection, the use of selective serotonin reuptake inhibitors (SSRI) such as fluoxetine, fluvoxamine, paroxetine, sertraline, citalopram, and escitalopram usage has increased over the years from 1.5% in 1996 to between 3–6% in the last decade [6,7].
Fluvoxamine is used for the treatment of several conditions, such as major depression, obsessive-compulsive disorder (OCD), and social anxiety disorder. In addition, fluvoxamine has also been used in an off-labelled manner for various indications, such as post-traumatic stress disorder (PTSD), panic disorder, binge-eating disorder, and others [8,9,10,11]. Before the Pregnancy and Lactation Labeling Final Rule (PLLR) was implemented by the United States Food and Drug Administration (USFDA) in 2015, fluvoxamine was in category C of pregnancy risk based on the adverse effects noted in the foetus in a non-clinical study on pregnant rats, but no adequate information in humans was presented in order to draw conclusions from the findings [12,13]. This has been updated to highlight that no clear associated risk of significant congenital disability or miscarriage was linked with fluvoxamine usage based on several human observational studies [14]. In the context of the post-natal period, SSRIs have been reported to lead to Post Natal Adaptation Syndrome (PNAS), in which case they cross the placenta, and this traversal may result in increased concentrations in the developing foetus, thus impacting fetal respiratory, cardiovascular, and neurological development [15,16,17]. Unfortunately, information on fluvoxamine’s efficacy and plasma concentrations in the pregnant population is lacking, particularly with respect to a large-scale and well-controlled trial, which may be due to the ethical and safety concerns surrounding recruiting pregnant women as subjects. However, despite this lack of information, a study by Westin et al. [18] highlighted that fluvoxamine plasma concentrations significantly drop in the third trimester, possibly leading to ineffective treatment. However, further research is needed due to the small number of data. In addition, the impact of pregnancy on fluvoxamine plasma concentration levels suggests the need to explore the dosing regimens in the pregnant population.
Cytochrome P450 2D6 (CYP2D6) is a highly polymorphic drug-metabolism enzyme and is the primary hepatic enzyme responsible for fluvoxamine metabolism, with fluvoxamine acid being the major metabolite that is inactive and excreted through urine [19]. In this respect, a physiologically based pharmacokinetic (PBPK) simulation showed that dose increments are required for paroxetine, an antidepressant metabolised primarily by the same hepatic enzyme, in order to maintain the plasma concentration within the therapeutic window during gestation [20]. This result relates to an analysis of therapeutic drug-monitoring (TDM) services by Westin et al. [18], which showed that the fluvoxamine dose needs to be doubled to maintain the same plasma concentration as the prenatal period based on a linear mixed model analysis. However, the model was developed without considering the physiological changes that occurred throughout pregnancy and different CYP2D6 phenotypes.
The advancement of PBPK modelling with respect to simulating virtual clinical trials has provided a platform for addressing the scarcity of pharmacokinetic data, particularly in special populations such as pregnant women [20,21,22,23,24,25,26]. The physiological changes that occur during pregnancy are complex and include changes in cardiac output, plasma volume, body fat, protein binding, hepatic enzyme processes, and the glomerular filtration rate, which can impact drug distribution and excretion and may necessitate dosing adjustment to maintain a drug’s effectiveness [27,28,29,30,31]. The application of PBPK and virtual clinical trials in guiding the dose selection for the pregnant population has been applied for at least 46 compounds, of which 33 compounds showed that dose adjustment might be needed, particularly for the drugs that were metabolised extensively by hepatic enzymes [22].
Due to a paucity of fluvoxamine-related pharmacokinetic data on the pregnant populations, we have, for the first time, applied the concept of PBPK and virtual clinical trials in assessing the influence of pregnancy on both maternal and foetal fluvoxamine plasma concentrations. Furthermore, we have identified a dosing regimen for pregnant women considering the CYP2D6 phenotype status to maintain the plasma concentration within the therapeutic window during the perinatal period. This study aimed to utilise the concept of mechanistic, pharmacokinetic modelling and virtual clinical trials to: (1) evaluate the impact of gestational changes on fluvoxamine maternal and foetal concentration levels; (2) elucidate the influence of CYP2D6 polymorphism on maternal and foetal concentrations; and (3) determine the optimal dosing adjustment strategy considering the CYP2D6 phenotype status throughout gestation.
2. Materials and Methods
This study used the PBPK modelling tool, Simcyp® Version 20 (Simcyp Ltd., Certara, Sheffield, UK), to develop and conduct virtual clinical trials on both healthy and pregnant subjects.
The Simcyp Simulator implements a minimal or full-body PBPK model. The former is a “lumped” 4-compartment model and considers systemic, portal vein, and liver concentrations with the addition of a “single adjusting compartment” representing a lump of all tissues except for the liver and portal vein. The full PBPK model is a generic, whole-body, 14-compartment model with the ability to incorporate additional compartments, such as a foeto-placental unit during pregnancy.
We implemented a 4-step workflow to develop, validate, and simulate studies with fluvoxamine (Figure 1).
2.1. Step 1: Development and Verification of Fluvoxamine Model in a Healthy Population
We used the “healthy volunteer” (HV) population group available in Simcyp® for simulation as a baseline population for non-pregnant females.
We employed the fluvoxamine compound file developed by Simcyp®, which is available in the simulator, with modifications made to a few parameters. First, the distribution model was changed from a minimal-PBPK model to a full-body PBPK distribution model with an estimation of tissue partition coefficients (Kp) to calculate the volume of distribution (Vss) using the Rogers and Rowland approach [32,33]. The calculated Vss was in line with several published studies [34,35]. The changes made to the distribution model are necessary to ensure that the tissue physiological temporal changes were considered throughout gestation when implementing the data on the pregnant population. Further, adaptations were made to the absorption rate constant (ka), fraction of dose absorbed (fa), and blood-to-plasma ratio (B/P) [36,37], with the final compound parameters detailed in Table 1.
We applied plasma concentration data from 3 single-dose and 3 multiple-dose studies to establish the fluvoxamine model and confirm modifications to the fluvoxamine compound. Thereafter, validation was conducted with 3 single-dose and 3 multiple-dose studies. In addition, we further validated the model using CYP2D6 extensive metaboliser (EM) and poor metaboliser (PM) populations with plasma concentration data published from 3 single-dose studies and 1 multiple-dose study. All studies used to develop and validate the amended fluvoxamine model are detailed in Table 2.
Virtual clinical trials were run in Simcyp® with a 10 × 10 study design. The subjects’ ages, male-to-female ratio, and dosage regimens were correlated with the study design used in the development and verification stages.
2.2. Step 2: Validation of Fluvoxamine PBPK Model in Pregnancy
After developing and verifying the fluvoxamine model in the HV population, the pregnant population model developed by Simcyp® was used for simulation. The pregnant population incorporated in the Simcyp® simulator includes the essential physiological changes that occur throughout the gestational period. The pregnant population established in Simcyp® incorporates the physiological changes in tissue composition/blood volume, renal/liver function, and temporal changes in enzyme activities throughout the maternal period, particularly with respect to CYP2D6, which plays an essential role in fluvoxamine metabolism [22,52,53].
Specifically, a gestational age-dependant function is incorporated into Simcyp Pregnancy to reflect the increase in CYP2D6 enzyme abundance throughout gestation and is based on a study by Ryu et al. [54], with the function (1) expressed as:
where GW represents gestation week. This function is then propagated within the model to alter baseline CYP2D6 expression (9.4 pmol/mg protein) [55].
CYP2D6 (fold change in activity) = 1 × (1 + 0.0163 × GW + 0.0009 × GW2)
In order to validate the fluvoxamine model in the pregnant population, we simulated fluvoxamine pharmacokinetics in pregnant populations throughout the entire gestational period, using a 10 trials x 10 patients design. A 100 mg daily oral dose was utilised, and pharmacokinetic data samples were collected on the last 24 h of every 5th GW. As for baseline, a similar study design was simulated with a healthy female population dosed with 100 mg of fluvoxamine daily. Then, we verified the simulated steady-state trough plasma concentrations with observed data from TDM services in Norway published by Westin et al. [18]. The data were collated from 3 pregnant women taking 100 mg of fluvoxamine per day, consisting of 3 serum drug concentrations at baseline and 5 serum drug concentrations during pregnancy. The data presented individually allowed for extraction and comparison with the fluvoxamine model simulated in the pregnant population.
After verifying the fluvoxamine-administration-during-pregnancy virtual trial simulation, we explored the fluvoxamine plasma concentration trend. We applied the therapeutic range for fluvoxamine recommended by Consensus Guidelines for Therapeutic Drug Monitoring in Neuropsychopharmacology: Update 2017 [5] as a guide to review the effective level of fluvoxamine plasma concentration during pregnancy as an antidepressant from the TDM perspective. The recommended range is between 60–230 ng/mL [5].
2.3. Step 3: Validation of Fluvoxamine Fetoplacental PBPK Model
In order to predict foetal exposure, we utilised the fetoplacental model within the Simcyp Pregnancy model. This incorporates an “additional” set of compartments which account for the foetal blood and foetal lumped body, with the description of transplacental clearance. Simcyp® uses a permeability-limited model for the foetoplacental compartment in Simcyp®. The model described the compound flux between the maternal, placental, and foetal clearance values with respect to the maternal-placental Cotyledon clearance values (CLPDM and CLPDF) (Figure S1).
Given the paucity of data on fluvoxamine’s transplacental permeability, we used an in vitro–in vivo extrapolation (IVIVE) method reported by Winiwarter et al. [38] that utilises hydrogen bond donors (HBD), polar surface area (PSA), and correction for placental villous surface area to yield both CLPDM and CLPDF (Table 1). The placental villous surface area was derived from a meta-analysis of reported values and calculated using Equation (2) as follows:
Placental villous surface area (m2) =
(0.135 × GW) − (0.023 × GW2) + (0.0015 × GW3) − (0.00002 × GW4)
(0.135 × GW) − (0.023 × GW2) + (0.0015 × GW3) − (0.00002 × GW4)
2.4. Step 3: Influence of CYP2D6 Phenotype and Dose Adjustment during Gestation
Considering that CYP2D6 is the main CYP enzyme involved in fluvoxamine metabolism, we validated the fluvoxamine PBPK model in terms of UM, EM, and PM CYP2D6 in healthy subjects. In addition, the various CYP2D6 metabolisers in the pregnant population in Simcyp® have been validated by Almurjan et al. [20] for the paroxetine compound. Thus, we predicted the fluvoxamine plasma concentration profile in UM, EM, and PM CYP2D6 populations to assess the impact of CYP2D6 phenotype on plasma concentrations throughout gestation. We simulated a 10 × 10 trial design throughout the entire gestational period, with pharmacokinetic data samples collected during the last 24 h of every 5th GW from a population of entirely UM, EM, or PM CYP2D6 phenotypes.
The predictions covered a range of fluvoxamine doses from 50 mg daily to a maximum of 300 mg daily, with increments of 25 mg daily and doses above 150 mg daily administered in 2 divided doses.
We assessed the influence of the CYP2D6 phenotype on pregnant women and its transference to the foetus at the starting dose of 50 mg daily and the minimum and maximum maintenance doses of 100 mg and 300 mg daily, respectively. Regarding dose adjustment, we assessed the percentage of (maternal) subjects with a peak concentration above 230 ng/mL and trough concentration below 60 ng/mL for every 5 GWs and each phenotype for every dose starting from 50 mg daily up to the maximum dose of 300 mg daily.
2.5. Prediction Performance
All the pharmacokinetics predictions made in the simulations that fell within 2-fold (0.5–2-fold) of published data were considered to represent ‘optimal’ predictive performance unless otherwise stated [59,60,61]. In addition, we verified the simulations visually using the visual predictive-checking (VPC) strategy [62]. This strategy was used to view all the simulated concentration–time profiles in steps 1, 2, and 3 in the observed/published data. The simulations were considered acceptable when the published profile overlapped and fell within the 5th and 95th percentiles of the predicted median concentration–time profile.
2.6. Data and Statistical Analysis
The data used for development and validation were extracted using WebPlotDigitizer version 4.5 (https://apps.automeris.io/wpd/) (accessed on 10 September 2022). In step 1, we conducted statistical analysis using a nonparametric, unpaired Student’s t-test to compare the observed and predicted data. In steps 2 and 4, the nonparametric one-way ANOVA with a Dunnett’s multiple comparisons post hoc test was used to compare the 5-weekly-simulated plasma concentration with the baseline (0) for maternal prediction and GW 20 for umbilical cord simulation. For the comparison between UM, EM, and PM CYP2D6 phenotypes for every 5-weekly-simulated plasma concentration in maternal and umbilical cord concentration, we used the nonparametric one-way ANOVA with a Tukey’s multiple comparisons post hoc test. The significance test was performed with p < 0.05 for steps 1, 2, and 4. A statistical analysis was run using GraphPad Prism Version 8 for Windows (GraphPad Software, La Jolla, CA, USA).
3. Results
3.1. Step 1: Development and Validation of Fluvoxamine Model in a Healthy Population
The fluvoxamine model was adapted and validated using clinical studies, which included both single- and multiple-dose studies with various dosing regimens (Table 2). The predicted pharmacokinetic parameters, including Cmax, Tmax, AUC0-t, and AUCinf, were within 0.5 to 2-fold of the reported clinical data (Table 3). Moreover, the observed profiles agree with the simulated profile for single and multiple-dose studies based on the VPC, wherein the published profiles are within the 5th and 95th percentiles of the predicted plasma-concentration profile, thereby confirming the successful development and validation of the fluvoxamine model in the healthy population.
We presented the simulated plasma concentration for all the single-dose studies used during the model’s development and validation in Figure 2, Figure 3 and Figure 4. For the comparison of the pharmacokinetic parameters in the single-dose studies, the AUCinf was not within the limit determined from the model’s validation, particularly with respect to the study by Orlando et al. [44] and the USFDA [46]. A similar pattern was observed for the AUCinf data when we compared the single-dose 50 mg and 100 mg trials conducted by De Vries et al. [39] with the spread of the individual data from the simulated profiles during the model’s development, as shown in Figure 2. However, the results showed no statistically significant difference (p > 0.05) for all three doses of Cmax and the AUCinf of the single-dose of 25 mg.
Regarding the multiple-dose study, only the Cmax and AUCinf for the study by Spigset et al. [47] were not within the 2-fold range, and this was when fluvoxamine was administered at the lowest dose at week 1 (12.5 mg twice daily for 7 days). The simulated plasma-concentration profiles and the published concentration data used during the development and verification of the multiple-dose studies are shown in Figure 5.
The validation of the predicted values overlayed with the observed plasma concentrations for the graphs of the CYP2D6 EM and PM populations are presented in Figure 6 and Figure 7. Regarding the comparison of the pharmacokinetics parameters, a few parameters that were not within the 2-fold range were only seen in the single-dose 50 mg study by Spigest et al. [49] concerning the AUCinf in both the EM and PM and the AUC0-t for the PM, as well as the Cmax for PM CYP2D6 for the single-dose 50 mg study by Carrilo et al. [48].
3.2. Step 2: Verification of Fluvoxamine Model in Pregnancy and the Impact of Pregnancy on Fluvoxamine Level
In order to verify the applicability of the model throughout gestation, we validated the predicted fluvoxamine steady-state trough plasma concentrations (Cmin) following a daily 100 mg dose throughout pregnancy, with the reported TDM trough concentrations data throughout gestation reported by Westin et al. [18] (Figure 8). The model predictions were within the range reported by Westin et al. [18], with mean plasma concentrations showing a reducing trend from GW 10 towards term (Table 4).
When compared to the baseline, Cmin and Cmax started to decrease from GW 10 by −5.13% and −5.69%, and −48.46% and −49.37% in GW 40, respectively. Furthermore, we noticed that the decrease was statistically significant compared to the baseline commencing from GW 25 and 20 onwards for the Cmin and Cmax, respectively. The trend showed that the mean of Cmin falls below the therapeutic window at GW 25 onwards. The percentage of subjects with Cmin below 60 ng/mL increased at the early stage of the 3rd trimester (GW 30) and up to 85% at GW 40. A similar trend was noted for Cmax. As for the mean, the Cmin started to fall below the therapeutic concentration at GW 20 with 59.84 ± 51.76 ng/mL.
3.3. Step 3: Validation of Fluvoxamine Fetoplacental PBPK Model
Since there is a higher risk of congenital disabilities for newborns of women treated with SSRIs, we developed and validated a fluvoxamine foetoplacental PBPK model to review the trend regarding the fluvoxamine levels in the umbilical cord. We validated the model only by the VPC with the reported values by Hostetter et al. [56], Sit et al. [57], and Rampono et al. [58]. Even though the individual observed values are sparse, the values fall within the range of the predicted cord concentrations (Figure 9).
3.4. Step 4: Impact of CYP2D6 Phenotype and Dose Adjustment during Gestation
Given the several-fold increase in the Cmax, AUC, and t½ in PM CYP2D6 compared to the EM CYP2D6 [14], we explored the impact of the CYP2D6 phenotype on the fluvoxamine levels in the pregnant population. We compared the plasma concentration levels for both the mother (GW 0–40) and umbilical cord (GW 20–40) between the UM, EM, and PM CYP2D6 phenotypes (Figure 10 and Figure 11) and the changes as compared to the baseline (0) for the mother (Table 5), while the percentage changes regarding the umbilical cord concentration from GW 20 are reported in Table 6.
We noticed a statistically significant difference between the UM and EM with respect to the PM CYP2D6 phenotype population for each 5th GW across all three doses (Figure 10). A similar pattern was seen between the UM and EM CYP2D6 populations with few exceptions, particularly in GW 20 regarding the Cmax and Cmin, when the foetoplacental PBPK model was initiated (Figure 9). However, the significant difference is minimal as compared to the PM. As for the cord concentration, the difference was significant with the PM but not between the UM and EM CYP2D6 populations across all five GWs (Figure 10). Since statistically significant differences were seen between the UM and EM CYP2D6 populations, we explored the dosing regimens for each of the CYP2D6 phenotype populations.
Looking at the concentration trend (Table 5), we identified the same pattern for both the UM and EM populations, with the concentration significantly decreased across all three doses starting from GW 15 in both the peak and trough. Whereas for the PM population, the concentration began to drop significantly from GW 25 for the peak and GW 30 for the trough, except at the 300 mg daily dose, where the decrease started to be statistically significant at GW 25. These patterns concur with the concentration trend in the general pregnant population reported in Step 2.
Moreover, for the 50 mg daily dose at GW 40, both the trough and peak levels demonstrated 60.40% and 54.77% decreases for the UM population and 59.01% and 52.76% decreases for the EM population when compared to the baseline. Whereas for the PM population, we saw 27.19% and 27.27% decreases for the trough and peak, respectively. This pattern is comparable across the 100 mg and 300 mg daily doses (Table 5).
Regarding the foetal cord level, both the trough and peak concentrations increased at full term compared to GW 20, and this transpired at all three-dose levels and CYP2D6 phenotype populations (Table 6). The PM CYP2D6 population demonstrated a significant increase across all GWs at the 50 mg daily dose (trough, 23.95% at GW 25 vs. 64.58% at full term; peak, 23.98% at GW 25 vs 60.88% at full term), 100 mg daily dose (trough, 23.95% at GW 25 vs. 64.58% at full term; peak, 23.98% at GW 25 vs. 60.87% at full term), and 300 mg daily dose (trough, 24.09% at GW 25 vs 64.82% at full term; peak, 23.92% at GW 25 vs. 61.64% at full term). Unlike the PM population, UM and EM have the same trend, in which the cord level increases until GW 30 and decreases back until the full term, with a significant difference only seen between GW 30 and GW 20 for the peak of the EM CYP2D6 population in the 50 mg daily and 100 mg daily doses (Table 6).
The percentage of subjects where the trough level falls below 60 ng/mL is more than 50% for both the UM and EM populations at doses of 50 mg daily and 100 mg daily. In contrast, with respect to the 300 mg daily dose, for the UM population, this trend started from GW 35 when the Cmin fell below 60 ng/mL for more than 50% of the subjects and did not reach 40% of the subjects for the EM population. As for the PM population, the percentage of subjects for whom the peak level rose above 230 ng/mL is more than 90% for the 300 mg daily dose; for more than 40% of the subjects, the peak level falls below 60 ng/mL (Table 5).
Since the percentage of subjects where the peak and trough levels fall outside the therapeutic windows varies between the different phenotypes of the CYP2D6 populations, we used the threshold of 20% outside of the therapeutic windows to determine the suitable dose for the pregnant population according to their phenotype (Figures S2–S7) [20,23,24].
For the UM CYP2D6 population, a fluvoxamine dose of 250 mg or 275 mg daily in the first trimester, followed by a maximum dose of 300 mg daily until the full term, is suggested to be optimum, as it corresponds to point at which the maternal concentrations are within the therapeutic windows for most of the subjects (Table 7). Nevertheless, for the maximum dose of 300 mg daily, the percentage of subjects with a Cmin below 60 ng/mL is between 21% in GW 15 to 65% in the full term, but none of the peak concentrations are above 230 ng/mL (Table 7, Figures S2 and S3).
For EM, a fluvoxamine dose of 175 mg daily is suitable up to GW 10, a 200 mg daily dose is ideal up to GW 15, and a 225 mg daily dose is advisable between GW 5 to 20, which covers the first trimester and the early second trimester. A 250 mg daily dose can be used for GW 10 to 25, while a 275 mg daily dose is effective between GW 15 to 30, covering the second trimester. As for GW 30 to full term, a maximum dose of 300 mg daily is considered the most effective since it had the most subjects where the Cmin and Cmax fell within the therapeutic range (Table 7 and Table 8; Figures S4 and S5).
With regard to PM, this approach revealed that a doe of 75 mg daily is suitable for GW 10, while a 100 mg daily dose is effective throughout pregnancy. It is also possible to increase the dose to 125 mg daily at GW 35 until labour, as the percentage of subjects for which the trough and peak fall within the therapeutic window is 8% and 9% for the trough and 19% and 16% for the peak for GW 35 and 40, respectively (Table 7, Figures S6 and S7).
We noticed a gradual increase in the clearance from GW 5 to GW 30 for both the UM and EM CYP2D6 populations, while the clearance is constant throughout pregnancy for the PM population (Figure 12 and Table 8). Likewise, the AUC remained steady throughout pregnancy for the PM population, while the AUC slightly decreased starting from GW 25 to full term for the UM and EM populations (Figure 12 and Table 8). This trend is expected since the suggested doses are higher as the pregnancy is near the full term for both UM and EM, but for PM, the recommended dose is maintained throughout the gestational period.
Based on the recommended dose, the range of the expected fluvoxamine concentration that crosses the placenta is between 5.84 ng/mL to 496.10 ng/mL across the gestational period and the CYP2D6 phenotype (Figure 12). We have seen a similar trend in both the UM and EM populations, wherein the foetal concentration increased until GW 30 and then became stagnant until labour. Whereas the cord concentrations steadily increase for the PM population until full term (Table 8).
4. Discussion
Several observational studies have demonstrated that SSRIs, including fluvoxamine, are safe to use during pregnancy, even given the possible risk of persistent pulmonary hypertension (PPHN), for which the benefit of controlling major depression may outweigh the risk depending on the patient’s situation [63,64,65,66,67,68,69]. However, the efficacy and impact of antidepressants in the pregnant population, particularly for fluvoxamine, are still lacking because no controlled trials have been conducted on the pregnant population.
Therapeutic drug monitoring (TDM) is one approach that can offer dose adjustment throughout gestation; however, this is often not considered viable or necessary for many drugs. However, the use of robust and validated mechanistic pharmacokinetic modelling allows for an assessment of any changes that occur in a drug’s PK properties during the gestational period, one which considers the physiological changes during pregnancy and offers a pragmatic solution to the following question: “what is the correct dose during gestation?” [5,20,22,23,24,25,26,70]. Although the concept has been utilised for other compounds, this is the first time it has been used to develop a fluvoxamine PBPK pregnancy model to support material dosing and foetal exposure.
4.1. Step 1: Validation of Fluvoxamine Model in Healthy Subjects
4.1.1. PBPK Model Parameters
The modification of a minimal-PBPK model to a full-body PBPK distribution model was essential to ensure that the physiological changes that occurred throughout the gestational period were considered for the PBPK pregnancy model [20,23,24,25,26]. Furthermore, the estimation of Kp developed to predict Vss using the Rogers and Rowland approach [32,33] resulted in a Vss within two-fold of the published Vd [34,35]. In addition, the ka, fa, and B/P were amended based on published data and the Simcyp® prediction [36,37]. Finally, the modifications were guided by three single-dose and two multiple-dose studies, which were further validated through another three single-dose and three multiple-dose studies incorporating healthy subjects and four single-dose studies and one multiple-dose study in CYP2D6 phenotype populations.
4.1.2. Validation in Healthy Subjects and CYP2D6 Phenotype Populations
The predicted PK parameters were within two-fold of the published PK studies, except for the AUCinf (Table 3). Furthermore, a similar pattern was seen for the individual AUCinf comparison between the observed data by De Vries et al. [39] and the prediction, which showed a statistically significant difference for the 50 mg and 100 mg formulations but not for the 25 mg formulation, the overlayed PK profile, and other PK parameters including the AUC0-t. The AUCinf is not commonly used for comparison among PK parameters, particularly in the regulatory setting, due to its reliability, specifically when the percentage differences between AUCinf and AUC0-t are more than 20%, as is the case here where the difference was not reported for the observed data, and the difference for the prediction is more than 20% [71]. Furthermore, the total number of sampling points used is crucial for an accurate estimation of AUCinf; in this situation, the number of samples used was notably different between the observed and predicted values (3 to 15 samples vs. > 100 samples), possibly overestimating the value of one over another [72].
The imperfect prediction of the lowest dose (12.5 mg twice daily) compared to that observed by Spigset et al.’s [47] study is compensated by a reliable prediction at the other three higher doses (25 mg twice daily, 50 mg twice daily, and 100 mg twice daily) (Table 3 and Figure 5). This result may be due to the dose being lower than the minimum daily dose recommended for adults, which is 50 mg administered once daily [14]. The prediction for the PM CYP2D6 population is not ideal when weighed individually with each published study. However, an assessment of the plasma concentration profile showed that the simulated profile matched all three published studies because of the wide variation between the studies (Figure 6). A similar phenomenon can be seen for the prediction of the multiple-dose study at the lowest dose (25 mg and 10 mg daily) when compared to the data observed by Christensen et al. [51], particularly for the PM population. The observed data fall in the lower range of the predicted data, which agrees with the prediction made by Britz et al. [73] for the fluvoxamine model (Figure 7).
Broader acceptance criteria, as discussed by Abduljalil et al. [74], may be considered, specifically for the PM population, since the comparisons were made between small subject samples from published works with 100 virtual patients for each simulated study and as the observed trials showed a wide variation of results. Nevertheless, the VPC strategy showed that the simulated PK profiles fall within the 5th and 95th percentiles of all the 14 studies. Therefore, these results validate the fluvoxamine PBPK model in the healthy population.
4.2. Step 2: Verification of Fluvoxamine Pregnancy Model and the Impact of Pregnancy on Fluvoxamine Concentration
4.2.1. Verification of Fluvoxamine Pregnancy Model
Based on the literature review, the study by Westin et al. [18] is the only publication (to date) containing data on the fluvoxamine plasma concentration throughout the 40-week gestational period. Thus, these were the only data used to validate the fluvoxamine PBPK pregnancy model. Using the VPC strategy, the predicted fluvoxamine plasma concentrations followed the pattern of the published data throughout the gestational period. Furthermore, the results showed that the difference compared to the baseline was significant from GW 20 and GW 25 for Cmax and Cmin, respectively, which is consistent with the published data reported by Westin et al. [18].
4.2.2. The Impact of Pregnancy on Fluvoxamine Concentration
The simulation demonstrated that out of 100 pregnancies, the Cmin for more than 50% of pregnant women falls below the minimum effective concentration of 60 ng/mL recommended by Hiemke et al. [5] for the treatment of major depression. The trend showed that the number significantly increased, particularly after GW 25 in both Cmin and Cmax, suggesting the need for fluvoxamine dose adjustment to maintain the same efficacy as pre-partum.
The possible main factor influencing the fluvoxamine concentration during the gestational period is hepatic enzyme metabolism, specifically, CYP2D6. This is because fluvoxamine is extensively metabolised in the liver, predominantly by CYP2D6, with minimal influence by CYP1A2 [14,19,47,75]. Thus, the reduction in fluvoxamine plasma concentration concurs with increasing CYP2D6 activities throughout pregnancy by 25.6% ± 58.3% at GW 14–18 to 47.8% ± 24.7% at GW 36–40 compared to the postpartum period [76]. The same trend has been reported by Wadelius et al. [77], but the study only performed the phenotyping at GW 36 instead of at every trimester. Furthermore, the increasing trend of the CYP2D6 enzyme’s activities throughout pregnancy has also been incorporated in Simcyp® and validated based on pregnancy PBPK modelling for several compounds, namely, metoprolol and paroxetine, which are reflected in this study as well [20,70].
On the other hand, the decreasing trend in the fluvoxamine plasma concentration throughout the gestational period further supports the findings of several publications that show that the contribution of the CYP1A2 enzyme to fluvoxamine metabolism is not significant compared to the CYP2D6 enzyme [19,47,48,78]. The explanation behind this is that the opposite trend between CYP2D6 and CYP1A2 activities throughout pregnancy is supposed to cancel out the impact on drug plasma concentration during pregnancy if the fractional metabolism of a drug is equal between the two enzymes, which has not been seen in this study and the study by Westin et al. [18,52,70,76,79].
Since fluvoxamine is a lipophilic drug, other physiological changes may contribute to reducing the fluvoxamine levels, such as the expansion of intravascular and extravascular volume as well as the increase in body fat throughout the gestational period [52,80]. In contrast, although fluvoxamine is a basic drug, the influence of changes in gastric pH and gastrointestinal motility on fluvoxamine absorption may be minimal compared to hepatic metabolism since fluvoxamine is highly absorbed from the gastrointestinal tract with approximately 50% bioavailability [14].
Renal changes may have minimal influence since fluvoxamine is primarily eliminated through hepatic biotransformation with no known active metabolites, and a negligible amount of fluvoxamine is excreted unchanged in the urine [19]. Moreover, studies have shown that dose adjustment is needed for hepatic but not renal impairment patients [81,82,83,84].
4.3. Step 3: Validation of Fluvoxamine Fetoplacental PBPK Model
The sparse data obtained in this study were expected since another fluvoxamine foetoplacental model developed by Matsuoka et al. [85] was validated with data solely taken from Hostetter et al. [56]. The limited information on when the samples were taken after the last dose provides a challenge in simulating optimal timing in order to offer a fair comparison. Nevertheless, we validated the fluvoxamine foetoplacental model based on three published studies which showed that all the observed data fit within the standard deviation of the predicted concentrations. In addition, our predicted concentrations are comparable to those made by Matsuoka et al. [85], particularly for the 150 mg daily doses. The fluvoxamine foetoplacental model was developed without including any specific active transport mechanism other than passive diffusion, which is similar to Matsuoka et al.’s [85] model. Thus, the CYP2D6 activity in the mother is the main factor influencing the fluvoxamine level in the foetus.
4.4. Step 4: Impact of CYP2D6 Phenotype and Dose Adjustment during Gestation
4.4.1. Impact of CYP2D6 Phenotype in the Pregnant Population
A notable difference was seen between the EM and PM CYP2D6 populations regarding the validation of the healthy subject models and the intrinsic hepatic clearance data from the verification stage in the general pregnant population. Similar information was described in the fluvoxamine prescription information, wherein there was a several-fold increase in the Cmax, AUC, and t½ in PM CYP2D6 compared to EM CYP2D6 [14]. Given the paucity of published data on fluvoxamine pharmacokinetics during pregnancy, stratified according to CYP2D6 phenotypes, the validated fluvoxamine model in healthy CYP2D6 subjects was used to support the exploration made regarding the pregnant population according to the CYP2D6 phenotype status, in addition to the validation of CYP2D6 abundance in pregnancy performed by Almurjan et al. [20] for the compound paroxetine.
4.4.2. Maternal Plasma Concentration Changes throughout Pregnancy
The significant difference in both the trough and peak between the EM and PM phenotypes in healthy subjects is comparable to the pregnant population, as demonstrated in this study (Figure 10) [48,49]. The difference between UM and EM is significant for most of the GWs across three doses but with reduced magnitude when compared with the PM. Due to this difference, we explored the fluvoxamine dosage regimen for the UM population in pregnant women. This information can also be used to investigate the difference between the UM and EM CYP2D6 phenotypes in healthy subjects because of the guidance on dose selection for the CYP2D6 phenotypes provided by the Clinical Pharmacogenetics Implementation Consortium (CPIC) and the Dutch Pharmacogenetics Working Group (DPWG); however, there are no data for the UM CYP2D6 populations for any dose recommendations, unlike the EM and PM populations [86,87].
Regarding the plasma concentration trend throughout the gestational period within each CYP2D6 phenotype, it is comparable to the general pregnant population. The distinction between each phenotype mainly corresponded to when the difference became significant, which was earlier for both the UM and EM populations as it occurred at GW 5, whereas for PM, it occurred at GW 30. The percentage changes compared to baseline also showed the same pattern, which was higher in UM and EM at more than 50%, whereas for PM, this change was only around 25%. These results were anticipated since there is no functional allele in the PM CYP2D6 population, and the physiological and alternative clearance modification changes occurring throughout the gestational period constitute the primary factor that influences the concentration levels in the PM phenotype population [88,89,90]. As for the UM and EM populations, the trends are consistent with other drugs metabolised by the CYP2D6 enzyme, such as paroxetine, metoprolol, and codeine, because the abundance of the CYP2D6 enzyme increases throughout the gestational week up to the full term for both the UM and EM phenotypes [20,70,89,91].
4.4.3. Umbilical Cord Concentration Changes throughout Pregnancy
No reported information (to date) is available to investigate the fluvoxamine foetal concentration based on the CYP2D6 phenotype. Thus, our simulation of the foetal concentration of fluvoxamine was based on the limited data used to validate the general fluvoxamine foetoplacental model. Since the foetoplacental model only focuses on the passive diffusion transfer mechanism through the placenta, the main potentiating factor in comparison between the UM, EM, and PM CYP2D6 phenotypes constitutes the CYP2D6 activities and physiological changes that occur throughout the gestational period. Generally, the factors that influence the crossing of a compound through the placenta are the physicochemical properties of the drug, physiological changes in the placenta such as blood flow, the involvement of active transport, and enzyme metabolism [92,93,94].
In the case of fluvoxamine, due to passive diffusion through lipid-soluble barriers of placental tissue membrane, cotyledons become the primary transfer pathway since fluvoxamine is a small molecule drug with base characteristics [92,93,95]. However, these characteristics did not differ between different CYP2D6 phenotypes. In addition, no data showed that fluvoxamine is transported by P-glycoproteins (P-gp), the major active efflux proteins for compound transport in the placenta [94]. Therefore, physiological changes and metabolism enzymes are the two main factors influencing fluvoxamine cord concentration.
The increasing trend in the fluvoxamine foetal concentrations in the PM population is solely due to the increase in placental blood flow throughout the gestational period since there are no active alleles of CYP2D6 [90,96]. In contrast, the cord concentration is consistent from GW 20 to full term for both the UM and EM populations, except for GW 30 for the peak of the EM population in all three doses. The consistent trend may be due to the counteractive effect that forms between an increase in the number of CYP2D6 metabolism enzymes in the mother and an increase in placenta blood flow towards full term [76,96]. The small but significant changes in the EM population for GW 30 may not be clinically significant since no evidence showed a direct correlation between foetal concentrations and the adverse reaction to the foetus [93,97]. Nevertheless, close monitoring may be needed, particularly when a high foetal concentration is expected.
4.4.4. Fluvoxamine Dosing Adjustment during Pregnancy
This study identified that a dose increment is needed for the UM and EM populations to maintain a fluvoxamine maternal concentration within the therapeutic area (60–230 ng/mL). As for the PM population, a stable dose of 100 mg daily with an optional increase to 125 mg daily at GW 35 is sufficient to maintain a patient’s fluvoxamine concentration at the optimum level. The dosing recommendation is in line with the increasing CYP2D6 activity throughout the gestational period, which is the primary enzyme metabolising fluvoxamine [19,49,78]. Moreover, the 0.75- to 2-fold difference in suggested dosage between PM and UM as well as EM was anticipated since a dose reduction of 25–50% is recommended by Hicks et al. [86] for normal subjects. The widening of the dosage gap when approaching full term is in line with the increase in CYP2D6 activity throughout the gestational period [76].
The recommended dose for the UM and EM populations reached a maximum dose at GW 15 and GW 35, respectively (Table 8). The recommendation for a maximum dose in the UM population as early as GW 15 signalled the need for close monitoring, particularly with respect to TDM and clinical effects, in order to ensure that fluvoxamine is still effective in treating major depression, while a switch of antidepressant may also be considered, which is in line with the recommendations by Hicks et al. [86], Brouwer et al. [87], and Hiemke et al. [5]. In addition, the results align with the finding by Mulder et al. [98] in which a switch of antidepressants is more often needed in the UM than in the EM CYP2D6 population but not a change of dosing regimen. The need for increments up to the maximum dose in the UM/EM populations reflects the finding uncovered by Berard et al. [99], wherein the proportion of pregnant women with depression symptoms was higher in the UM/EM than in the PM CYP2D6 population even when treated with antidepressants.
Even though the recommended dose is lower in the PM population, the AUC is approximately twice that of the UM and EM populations, which is in stark contrast to the clearance value, where an increasing trend was seen in the UM and EM populations (Figure 12). Therefore, the risk for adverse events is higher in the PM population for both the mother and foetus since fluvoxamine accumulates in the body longer due to low clearance [100]. Dose adjustment, switching, and the discontinuation of antidepressants are frequently seen in the PM population due to adverse events, as it is difficult for pregnant women who may have already suffered from morning sickness to endure further adverse drug reactions [98,99,100,101].
A similar pattern was seen in the foetal concentration, which was higher in the PM population than in both the UM and EM populations, although with a lower recommended dose. The results from six studies showed that the rate of major congenital malformations and other adverse pregnancy outcomes did not differ significantly compared to the control groups [64,65,66,67,68,69]. Nevertheless, the number of subjects was still considered too small for any informed conclusions regarding usage during pregnancy to be made [102,103]. Moreover, the safety concern regarding the use of fluvoxamine as an SSRI is the potential risk of PPHN in the newborn [63,104]. Matsuoka et al. [85] have suggested dose tapering of 25 mg a week starting from GW 36 to reduce the risk of neonatal withdrawal syndrome, especially when the mother instantaneously discontinues the drug during pregnancy.
5. Conclusions
It is always a dilemma for a prescriber to decide between prescribing or withdrawing antidepressants during the perinatal period with respect to the health of both the mother and foetus. The prescriber’s main challenge is to find a balance between the treatment benefit throughout pregnancy and the risk of drug toxicity, particularly to the embryo and foetus. The physiological changes and those related to the biotransformation of metabolic enzymes during the gestational period are crucial factors in determining future actions regarding depression treatment in pregnant women. For fluvoxamine, the primary elimination route is through the CYP2D6 metabolism enzyme, which is highly polymorphic and, thus, further complicates the dosing strategies in pregnant women. Our developed models suggest that dose increments of fluvoxamine are needed among pregnant women, particularly for the UM and EM CYP2D6 populations. Although the fluvoxamine PBPK model developed in this study demonstrated a pragmatic method for determining a suitable dose in the perinatal setting, a confirmatory clinical trial is required to verify this study’s recommendations.
Even though TDM for the usage of antidepressants and phenotype testing before the initiation of SSRIs is not a regular practice in most clinical settings, this study highlighted the opportunity of using PBPK modelling for precision dosing, particularly in special populations such as pregnant women. The application of PBPK modelling combined with pre-emptive phenotyping may bring precision dosing closer to clinical settings, thereby improving the treatment of depression in the pregnant population.
Supplementary Materials
The following supporting information can be downloaded at: https://www.mdpi.com/article/10.3390/metabo12121281/s1, Figure S1: Fetoplacental compartment permeability-limited model; Figure S2: Percentage of Ultrarapid Metaboliser (UM) population with trough concentration below 60 ng/mL; Figure S3: Percentage of UM population with trough concentration above 230 ng/mL; Figure S4: Percentage of Extensive Metaboliser (EM) population with trough concentration below 60 ng/mL; Figure S5: Percentage of EM population with trough concentration above 230 ng/mL; Figure S6: Percentage of Poor Metaboliser (PM) population with trough concentration below 60 ng/mL; Figure S7; Percentage of PM population with trough concentration above 230 ng/mL.
Author Contributions
Conceptualization, R.B. and K.B.; Methodology, R.B. and K.B.; Software, K.B.; Validation, K.B.; Formal Analysis, R.B. and K.B.; Investigation, K.B. and R.B.; Writing—Original Draft Preparation, R.B. and K.B.; Writing—Review and Editing, R.B. and K.B.; Supervision, R.B. All authors have read and agreed to the published version of the manuscript.
Funding
This research received no external funding.
Institutional Review Board Statement
Not applicable.
Informed Consent Statement
Not applicable.
Data Availability Statement
The data presented in this study are available in the article and supplementary material.
Acknowledgments
Certara UK (Simcyp Division) granted free access to the Simcyp Simulators through an academic license (subject to conditions).
Conflicts of Interest
The authors declare no conflict of interest.
References
- Gaynes, B.N.; Gavin, N.; Meltzer-Brody, S.; Lohr, K.N.; Swinson, T.; Gartlehner, G.; Brody, S.; Miller, W.C. Perinatal depression: Prevalence, screening accuracy, and screening outcomes. Evid. Rep. Technol. Assess (Summ) 2005, 1–8. [Google Scholar] [CrossRef] [Green Version]
- Okagbue, H.I.; Adamu, P.I.; Bishop, S.A.; Oguntunde, P.E.; Opanuga, A.A.; Akhmetshin, E.M. Systematic review of prevalence of antepartum depression during the trimesters of pregnancy. Open Access Maced. J. Med. Sci. 2019, 7, 1555–1560. [Google Scholar] [CrossRef] [Green Version]
- Bennett, H.A.; Einarson, A.; Taddio, A.; Koren, G.; Einarson, T.R. Prevalence of depression during pregnancy: Systematic review. Obstet. Gynecol. 2004, 103, 698–709. [Google Scholar] [CrossRef]
- Wichman, C.L.; Stern, T.A. Diagnosing and treating depression during pregnancy. Prim. Care Companion CNS Disord. 2015, 17. [Google Scholar] [CrossRef]
- Hiemke, C.; Bergemann, N.; Clement, H.W.; Conca, A.; Deckert, J.; Domschke, K.; Eckermann, G.; Egberts, K.; Gerlach, M.; Greiner, C.; et al. Consensus guidelines for therapeutic drug monitoring in neuropsychopharmacology: Update 2017. Pharmacopsychiatry 2018, 51, e1. [Google Scholar] [CrossRef] [Green Version]
- Andrade, S.E.; Raebel, M.A.; Brown, J.; Lane, K.; Livingston, J.; Boudreau, D.; Rolnick, S.J.; Roblin, D.; Smith, D.H.; Willy, M.E.; et al. Use of antidepressant medications during pregnancy: A multisite study. Am. J. Obstet. Gynecol. 2008, 198. [Google Scholar] [CrossRef]
- Molenaar, N.M.; Bais, B.; Lambregtse-van den Berg, M.P.; Mulder, C.L.; Howell, E.A.; Fox, N.S.; Rommel, A.S.; Bergink, V.; Kamperman, A.M. The international prevalence of antidepressant use before, during, and after pregnancy: A systematic review and meta-analysis of timing, type of prescriptions and geographical variability. J. Affect. Disord. 2020, 264, 82–89. [Google Scholar] [CrossRef]
- Irons, J. Fluvoxamine in the treatment of anxiety disorders. Neuropsychiatr. Dis. Treat. 2005, 1, 289–299. [Google Scholar]
- Stein, D.J.; Westenberg, H.G.M.; Yang, H.C.; Li, D.; Barbato, L.M. Fluvoxamine CR in the long-term treatment of social anxiety disorder: The 12- to 24-week extension phase of a multicentre, randomized, placebo-controlled trial. Int. J. Neuropsychoph. 2003, 6, 317–323. [Google Scholar] [CrossRef] [Green Version]
- Escalona, R.; Canive, J.M.; Calais, L.A.; Davidson, J.R. Fluvoxamine treatment in veterans with combat-related post-traumatic stress disorder. Depress. Anxiety 2002, 15, 29–33. [Google Scholar] [CrossRef]
- Milano, W.; Siano, C.; Putrella, C.; Capasso, A. Treatment of bulimia nervosa with fluvoxamine: A randomized controlled trial. Adv. Ther. 2005, 22, 278–283. [Google Scholar] [CrossRef]
- The United States Food and Drug Administration. Drug Approval Package: Luvox (Fluvoxamine Maleate) 25mg, 50mg, and 100mg Tablets. Available online: https://www.accessdata.fda.gov/drugsatfda_docs/nda/2007/021519_luvox_toc.cfm (accessed on 2 November 2021).
- The United States Food and Drug Administration. Pregnancy and Lactation Labeling (Drugs) Final Rule. Available online: https://www.fda.gov/drugs/labeling-information-drug-products/pregnancy-and-lactation-labeling-drugs-final-rule (accessed on 16 November 2021).
- The United States Food and Drug Administration. Fluvoxamine Maleate Full Prescribing Information. Available online: https://www.accessdata.fda.gov/drugsatfda_docs/label/2021/021519s018lbl.pdf (accessed on 16 November 2021).
- Byatt, N.; Deligiannidis, K.M.; Freeman, M.P. Antidepressant use in pregnancy: A critical review focused on risks and controversies. Acta Psychiatr. Scand. 2013, 127, 94–114. [Google Scholar] [CrossRef] [Green Version]
- Berard, A.; Zhao, J.P.; Sheehy, O. Antidepressant use during pregnancy and the risk of major congenital malformations in a cohort of depressed pregnant women: An updated analysis of the Quebec Pregnancy Cohort. Bmj Open 2017, 7, e013372. [Google Scholar] [CrossRef] [Green Version]
- Zakiyah, N.; Ter Heijne, L.F.; Bos, J.H.; Hak, E.; Postma, M.J.; Schuiling-Veninga, C.C.M. Antidepressant use during pregnancy and the risk of developing gestational hypertension: A retrospective cohort study. BMC Pregnancy Childbirth 2018, 18, 187. [Google Scholar] [CrossRef] [Green Version]
- Westin, A.A.; Brekke, M.; Molden, E.; Skogvoll, E.; Spigset, O. Selective serotonin reuptake inhibitors and venlafaxine in pregnancy: Changes in drug disposition. PLoS ONE 2017, 12, e0181082. [Google Scholar] [CrossRef]
- Spigset, O.; Axelsson, S.; Norstrom, A.; Hagg, S.; Dahlqvist, R. The major fluvoxamine metabolite in urine is formed by CYP2D6. Eur. J. Clin. Pharmacol. 2001, 57, 653–658. [Google Scholar] [CrossRef]
- Almurjan, A.; Macfarlane, H.; Badhan, R.K.S. Precision dosing-based optimisation of paroxetine during pregnancy for poor and ultrarapid CYP2D6 metabolisers: A virtual clinical trial pharmacokinetics study. J. Pharm. Pharmacol. 2020, 72, 1049–1060. [Google Scholar] [CrossRef]
- Zhuang, X.; Lu, C. PBPK modeling and simulation in drug research and development. Acta Pharm. Sin. B 2016, 6, 430–440. [Google Scholar] [CrossRef] [Green Version]
- Abduljalil, K.; Badhan, R.K.S. Drug dosing during pregnancy-opportunities for physiologically based pharmacokinetic models. J. Pharmacokinet. Pharmacodyn. 2020, 47, 319–340. [Google Scholar] [CrossRef]
- Almurjan, A.; Macfarlane, H.; Badhan, R.K.S. The application of precision dosing in the use of sertraline throughout pregnancy for poor and ultrarapid metabolizer CYP 2C19 subjects: A virtual clinical trial pharmacokinetics study. Biopharm. Drug Dispos. 2021, 42, 252–262. [Google Scholar] [CrossRef]
- Badhan, R.K.S.; Gittins, R. Precision dosing of methadone during pregnancy: A pharmacokinetics virtual clinical trials study. J. Subst. Abuse Treat. 2021, 130, 108521. [Google Scholar] [CrossRef]
- Olafuyi, O.; Badhan, R.K.S. Dose optimization of chloroquine by pharmacokinetic modeling during pregnancy for the treatment of zika virus infection. J. Pharm. Sci. 2019, 108, 661–673. [Google Scholar] [CrossRef] [Green Version]
- Badhan, R.K.S.; Macfarlane, H. Quetiapine dose optimisation during gestation: A pharmacokinetic modelling study. J. Pharm. Pharmacol. 2020, 72, 670–681. [Google Scholar] [CrossRef]
- Qasqas, S.A.; McPherson, C.; Frishman, W.H.; Elkayam, U. Cardiovascular pharmacotherapeutic considerations during pregnancy and lactation. Cardiol. Rev. 2004, 12, 240–261. [Google Scholar] [CrossRef]
- Murphy, M.M.; Scott, J.M.; McPartlin, J.M.; Fernandez-Ballart, J.D. The pregnancy-related decrease in fasting plasma homocysteine is not explained by folic acid supplementation, hemodilution, or a decrease in albumin in a longitudinal study. Am. J. Clin. Nutr. 2002, 76, 614–619. [Google Scholar] [CrossRef] [Green Version]
- Cheung, C.K.; Lao, T.; Swaminathan, R. Urinary excretion of some proteins and enzymes during normal pregnancy. Clin. Chem. 1989, 35, 1978–1980. [Google Scholar] [CrossRef]
- Feghali, M.; Venkataramanan, R.; Caritis, S. Pharmacokinetics of drugs in pregnancy. Semin. Perinatol. 2015, 39, 512–519. [Google Scholar] [CrossRef] [Green Version]
- Davison, J.M.; Dunlop, W. Renal hemodynamics and tubular function normal human pregnancy. Kidney Int. 1980, 18, 152–161. [Google Scholar] [CrossRef] [Green Version]
- Rodgers, T.; Leahy, D.; Rowland, M. Physiologically based pharmacokinetic modeling 1: Predicting the tissue distribution of moderate-to-strong bases. J. Pharm. Sci. 2005, 94, 1259–1276. [Google Scholar] [CrossRef]
- Rodgers, T.; Rowland, M. Physiologically based pharmacokinetic modelling 2: Predicting the tissue distribution of acids, very weak bases, neutrals and zwitterions. J. Pharm. Sci. 2006, 95, 1238–1257. [Google Scholar] [CrossRef]
- Mylan. Faverin 50 mg Film-Coated Tablets, Summary of Product Characteristics (SPC). Available online: https://www.medicines.org.uk/emc/product/1169/smpc#gref (accessed on 12 October 2021).
- Vezmar, S.; Miljkovic, B.; Vucicevic, K.; Timotijevic, I.; Prostran, M.; Todorovic, Z.; Pokrajac, M. Pharmacokinetics and efficacy of fluvoxamine and amitriptyline in depression. J. Pharmacol. Sci. 2009, 110, 98–104. [Google Scholar] [CrossRef]
- Ezuruike, U.; Zhang, M.; Pansari, A.; De Sousa Mendes, M.; Pan, X.; Neuhoff, S.; Gardner, I. Guide to development of compound files for PBPK modeling in the Simcyp population-based simulator. CPT Pharmacomet. Syst. Pharmacol. 2022, 11, 805–821. [Google Scholar] [CrossRef]
- Turner, D.; Musther, H.; Jamei, M.; Rostami-Hodjegan, A. A Mechanistic Model for the Prediction of Equilibrium Blood-to-Plasma Concentration Ratio (B/P) in Human Blood: Basic and Neutral Drugs. In Proceedings of the AAPS Annual Meeting and Exposition, Washington, DC, USA, 23–27 October 2011. [Google Scholar]
- Winiwarter, S.; Bonham, N.M.; Ax, F.; Hallberg, A.; Lennernas, H.; Karlen, A. Correlation of human jejunal permeability (in vivo) of drugs with experimentally and theoretically derived parameters. A multivariate data analysis approach. J. Med. Chem. 1998, 41, 4939–4949. [Google Scholar] [CrossRef]
- De Vries, M.H.; Van Harten, J.; Van Bemmel, P.; Raghoebar, M. Pharmacokinetics of fluvoxamine maleate after increasing single oral doses in healthy subjects. Biopharm. Drug Dispos. 1993, 14, 291–296. [Google Scholar] [CrossRef]
- Van Harten, J.; Van Bemmel, P.; Dobrinska, M.R.; Ferguson, R.K.; Raghoebar, M. Bioavailability of fluvoxamine given with and without food. Biopharm. Drug Dispos. 1991, 12, 571–576. [Google Scholar] [CrossRef]
- Bahrami, G.; Mohammadi, B. Rapid and sensitive bioanalytical method for measurement of fluvoxamine in human serum using 4-chloro-7-nitrobenzofurazan as pre-column derivatization agent: Application to a human pharmacokinetic study. J. Chromatogr. B 2007, 857, 322–326. [Google Scholar] [CrossRef]
- de Vries, M.H.; Raghoebar, M.; Mathlener, I.S.; van Harten, J. Single and multiple oral dose fluvoxamine kinetics in young and elderly subjects. Ther. Drug Monit. 1992, 14, 493–498. [Google Scholar] [CrossRef]
- Fleishaker, J.C.; Hulst, L.K. A pharmacokinetic and pharmacodynamic evaluation of the combined administration of alprazolam and fluvoxamine. Eur. J. Clin. Pharmacol. 1994, 46, 35–39. [Google Scholar] [CrossRef]
- Orlando, R.; De Martin, S.; Andrighetto, L.; Floreani, M.; Palatini, P. Fluvoxamine pharmacokinetics in healthy elderly subjects and elderly patients with chronic heart failure. Br. J. Clin. Pharmacol. 2010, 69, 279–286. [Google Scholar] [CrossRef] [Green Version]
- Debree, H.; Vanderschoot, J.B.; Post, L.C. Fluvoxamine maleate - Disposition in man. Eur. J. Drug Metab. Pharmacokinet. 1983, 8, 175–179. [Google Scholar] [CrossRef]
- The United States Food and Drug Administration. Clinical Pharmacology and Biopharmaceutics Review for Luvox Extended-Release; US FDA: Silver Spring, MD, USA, 2008.
- Spigset, O.; Granberg, K.; Hagg, S.; Soderstrom, E.; Dahlqvist, R. Non-linear fluvoxamine disposition. Br. J. Clin. Pharmacol. 1998, 45, 257–263. [Google Scholar] [CrossRef]
- Carrillo, J.A.; Dahl, M.L.; Svensson, J.O.; Alm, C.; Rodriguez, I.; Bertilsson, L. Disposition of fluvoxamine in humans is determined by the polymorphic CYP2D6 and also by the CYP1A2 activity. Clin. Pharmacol. Ther. 1996, 60, 183–190. [Google Scholar] [CrossRef]
- Spigset, O.; Granberg, K.; Hagg, S.; Norstrom, A.; Dahlqvist, R. Relationship between fluvoxamine pharmacokinetics and CYP2D6/CYP2C19 phenotype polymorphisms. Eur. J. Clin. Pharmacol. 1997, 52, 129–133. [Google Scholar] [CrossRef]
- Hartter, S.; Grozinger, M.; Weigmann, H.; Roschke, J.; Hiemke, C. Increased bioavailability of oral melatonin after fluvoxamine coadministration. Clin. Pharmacol. Ther. 2000, 67, 1–6. [Google Scholar] [CrossRef]
- Christensen, M.; Tybring, G.; Mihara, K.; Yasui-Furokori, N.; Carrillo, J.A.; Ramos, S.I.; Andersson, K.; Dahl, M.L.; Bertilsson, L. Low daily 10-mg and 20-mg doses of fluvoxamine inhibit the metabolism of both caffeine (cytochrome P4501A2) and omeprazole (cytochrome P4502C19). Clin. Pharmacol. Ther. 2002, 71, 141–152. [Google Scholar] [CrossRef]
- Gaohua, L.; Abduljalil, K.; Jamei, M.; Johnson, T.N.; Rostami-Hodjegan, A. A pregnancy physiologically based pharmacokinetic (p-PBPK) model for disposition of drugs metabolized by CYP1A2, CYP2D6 and CYP3A4. Br. J. Clin. Pharmacol. 2012, 74, 873–885. [Google Scholar] [CrossRef] [Green Version]
- Abduljalil, K. Predicting Drug Pharmacokinetics in Pregnancy, Fetal, and Lactation Using PBPK; 2020. [Google Scholar]
- Ryu, R.J.; Eyal, S.; Easterling, T.R.; Caritis, S.N.; Venkataraman, R.; Hankins, G.; Rytting, E.; Thummel, K.; Kelly, E.J.; Risler, L.; et al. Pharmacokinetics of metoprolol during pregnancy and lactation. J. Clin. Pharmacol. 2016, 56, 581–589. [Google Scholar] [CrossRef] [Green Version]
- Achour, B.; Russell, M.R.; Barber, J.; Rostami-Hodjegan, A. Simultaneous quantification of the abundance of several cytochrome P450 and uridine 5′-diphospho-glucuronosyltransferase enzymes in human liver microsomes using multiplexed targeted proteomics. Drug Metab. Dispos. 2014, 42, 500–510. [Google Scholar] [CrossRef]
- Hostetter, A.; Ritchie, J.C.; Stowe, Z.N. Amniotic fluid and umbilical cord blood concentrations of antidepressants in three women. Biol. Psychiatry 2000, 48, 1032–1034. [Google Scholar] [CrossRef]
- Sit, D.; Perel, J.M.; Wisniewski, S.R.; Helsel, J.C.; Luther, J.F.; Wisner, K.L. Mother-infant antidepressant concentrations, maternal depression, and perinatal events. J. Clin. Psychiatry 2011, 72, 994–1001. [Google Scholar] [CrossRef] [Green Version]
- Rampono, J.; Simmer, K.; Ilett, K.F.; Hackett, L.P.; Doherty, D.A.; Elliot, R.; Kok, C.H.; Coenen, A.; Forman, T. Placental transfer of SSRI and SNRI antidepressants and effects on the neonate. Pharmacopsychiatry 2009, 42, 95–100. [Google Scholar] [CrossRef]
- Edginton, A.N.; Schmitt, W.; Willmann, S. Development and evaluation of a generic physiologically based pharmacokinetic model for children. Clin. Pharmacokinet. 2006, 45, 1013–1034. [Google Scholar] [CrossRef]
- Ginsberg, G.; Hattis, D.; Russ, A.; Sonawane, B. Physiologically based pharmacokinetic (PBPK) modeling of caffeine and theophylline in neonates and adults: Implications for assessing children’s risks from environmental agents. J. Toxicol. Environ. Health A 2004, 67, 297–329. [Google Scholar] [CrossRef]
- Parrott, N.; Davies, B.; Hoffmann, G.; Koerner, A.; Lave, T.; Prinssen, E.; Theogaraj, E.; Singer, T. Development of a physiologically based model for oseltamivir and simulation of pharmacokinetics in neonates and infants. Clin. Pharmacokinet. 2011, 50, 613–623. [Google Scholar] [CrossRef]
- he United States Food and Drug Administration. Summary minutes of the Advisory Committee for Pharmaceutical Science and Clinical Pharmacology; 2012. [Google Scholar]
- The United States Food and Drug Administration. FDA Drug Safety Communication: Selective Serotonin Reuptake Inhibitor (SSRI) Antidepressant Use during Pregnancy and Reports of a Rare Heart and Lung Condition in Newborn Babies. Available online: https://www.fda.gov/drugs/drug-safety-and-availability/fda-drug-safety-communication-selective-serotonin-reuptake-inhibitor-ssri-antidepressant-use-during (accessed on 16 November 2021).
- Einarson, A.; Choi, J.; Einarson, T.R.; Koren, G. Incidence of major malformations in infants following antidepressant exposure in pregnancy: Results of a large prospective cohort study. Can. J. Psychiatry 2009, 54, 242–246. [Google Scholar] [CrossRef] [Green Version]
- Furu, K.; Kieler, H.; Haglund, B.; Engeland, A.; Selmer, R.; Stephansson, O.; Valdimarsdottir, U.A.; Zoega, H.; Artama, M.; Gissler, M.; et al. Selective serotonin reuptake inhibitors and venlafaxine in early pregnancy and risk of birth defects: Population based cohort study and sibling design. BMJ 2015, 350, h1798. [Google Scholar] [CrossRef] [Green Version]
- McElhatton, P.R.; Garbis, H.M.; Elefant, E.; Vial, T.; Bellemin, B.; Mastroiacovo, P.; Arnon, J.; Rodriguez-Pinilla, E.; Schaefer, C.; Pexieder, T.; et al. The outcome of pregnancy in 689 women exposed to therapeutic doses of antidepressants. A collaborative study of the European Network of Teratology Information Services (ENTIS). Reprod. Toxicol. 1996, 10, 285–294. [Google Scholar] [CrossRef]
- Kulin, N.A.; Pastuszak, A.; Sage, S.R.; Schick-Boschetto, B.; Spivey, G.; Feldkamp, M.; Ormond, K.; Matsui, D.; Stein-Schechman, A.K.; Cook, L.; et al. Pregnancy outcome following maternal use of the new selective serotonin reuptake inhibitors - A prospective controlled multicenter study. JAMA-J. Am. Med. Assoc. 1998, 279, 609–610. [Google Scholar] [CrossRef]
- Sivojelezova, A. Fluvoxamine (Luvox (TM)) use in pregnancy. Clin. Pharmacol. Ther. 2004, 75, 25. [Google Scholar] [CrossRef]
- Malm, H.; Artama, M.; Gissler, M.; Ritvanen, A. Selective serotonin reuptake inhibitors and risk for major congenital anomalies reply. Obstet. Gynecol. 2012, 119, 183. [Google Scholar] [CrossRef]
- Abduljalil, K.; Pansari, A.; Jamei, M. Prediction of maternal pharmacokinetics using physiologically based pharmacokinetic models: Assessing the impact of the longitudinal changes in the activity of CYP1A2, CYP2D6 and CYP3A4 enzymes during pregnancy. J. Pharmacokinet. Pharmacodyn. 2020, 47, 361–383. [Google Scholar] [CrossRef]
- European Medicines Agency. Guideline on the Investigation of Bioequivalence. Available online: https://www.ema.europa.eu/en/documents/scientific-guideline/guideline-investigation-bioequivalence-rev1_en.pdf (accessed on 26 November 2011).
- Noe, D.A. Criteria for reporting noncompartmental estimates of half-life and area under the curve extrapolated to infinity. Pharm. Stat. 2020, 19, 101–112. [Google Scholar] [CrossRef]
- Britz, H.; Hanke, N.; Volz, A.K.; Spigset, O.; Schwab, M.; Eissing, T.; Wendl, T.; Frechen, S.; Lehr, T. Physiologically-Based Pharmacokinetic Models for CYP1A2 Drug-Drug Interaction Prediction: A Modeling Network of Fluvoxamine, Theophylline, Caffeine, Rifampicin, and Midazolam. CPT Pharmacomet. Syst. Pharmacol. 2019, 8, 296–307. [Google Scholar] [CrossRef] [Green Version]
- Abduljalil, K.; Cain, T.; Humphries, H.; Rostami-Hodjegan, A. Deciding on success criteria for predictability of pharmacokinetic parameters from in vitro studies: An analysis based on in vivo observations. Drug Metab. Dispos. 2014, 42, 1478–1484. [Google Scholar] [CrossRef]
- Miura, M.; Ohkubo, T. Identification of human cytochrome P450 enzymes involved in the major metabolic pathway of fluvoxamine. Xenobiotica 2007, 37, 169–179. [Google Scholar] [CrossRef]
- Tracy, T.S.; Venkataramanan, R.; Glover, D.D.; Caritis, S.N.; National Institute for Child Health; Human Development Network of Maternal-Fetal-Medicine Units. Temporal changes in drug metabolism (CYP1A2, CYP2D6 and CYP3A Activity) during pregnancy. Am. J. Obstet. Gynecol. 2005, 192, 633–639. [Google Scholar] [CrossRef]
- Wadelius, M.; Darj, E.; Frenne, G.; Rane, A. Induction of CYP2D6 in pregnancy. Clin. Pharmacol. Ther. 1997, 62, 400–407. [Google Scholar] [CrossRef]
- Spigset, O.; Hagg, S.; Soderstrom, E.; Dahlqvist, R. Lack of correlation between fluvoxamine clearance and CYP1A2 activity as measured by systemic caffeine clearance. Eur. J. Clin. Pharmacol. 1999, 54, 943–946. [Google Scholar] [CrossRef]
- Yu, T.; Campbell, S.C.; Stockmann, C.; Tak, C.; Schoen, K.; Clark, E.A.; Varner, M.W.; Spigarelli, M.G.; Sherwin, C.M. Pregnancy-induced changes in the pharmacokinetics of caffeine and its metabolites. J. Clin. Pharmacol. 2016, 56, 590–596. [Google Scholar] [CrossRef] [Green Version]
- Dawes, M.; Chowienczyk, P.J. Drugs in pregnancy. Pharmacokinetics in pregnancy. Best Pract. Res. Clin. Obstet. Gynaecol. 2001, 15, 819–826. [Google Scholar] [CrossRef] [Green Version]
- van Harten, J.; Duchier, J.; Devissaguet, J.P.; van Bemmel, P.; de Vries, M.H.; Raghoebar, M. Pharmacokinetics of fluvoxamine maleate in patients with liver cirrhosis after single-dose oral administration. Clin. Pharmacokinet. 1993, 24, 177–182. [Google Scholar] [CrossRef]
- Orlando, R.; Padrini, R.; Perazzi, M.; De Martin, S.; Piccoli, P.; Palatini, P. Liver dysfunction markedly decreases the inhibition of cytochrome P450 1A2-mediated theophylline metabolism by fluvoxamine. Clin. Pharmacol. Ther. 2006, 79, 489–499. [Google Scholar] [CrossRef]
- van Harten, J. Overview of the pharmacokinetics of fluvoxamine. Clin. Pharmacokinet. 1995, 29 (Suppl. 1), 1–9. [Google Scholar] [CrossRef]
- DeVane, C.L.; Gill, H.S. Clinical pharmacokinetics of fluvoxamine: Applications to dosage regimen design. J. Clin. Psychiatry 1997, 58 (Suppl. 5), 7–14. [Google Scholar]
- Matsuoka, S.; Hori, S.; Satoh, H.; Nagamatsu, T.; Fujii, T.; Sawada, Y. Quantitative prediction of fetal plasma concentration of fluvoxamine during dosage-tapering to the mother. Placenta 2017, 58, 74–81. [Google Scholar] [CrossRef]
- Hicks, J.K.; Bishop, J.R.; Sangkuhl, K.; Muller, D.J.; Ji, Y.; Leckband, S.G.; Leeder, J.S.; Graham, R.L.; Chiulli, D.L.; A, L.L.; et al. Clinical Pharmacogenetics Implementation Consortium (CPIC) Guideline for CYP2D6 and CYP2C19 Genotypes and Dosing of Selective Serotonin Reuptake Inhibitors. Clin. Pharmacol. Ther. 2015, 98, 127–134. [Google Scholar] [CrossRef] [Green Version]
- Brouwer, J.; Nijenhuis, M.; Soree, B.; Guchelaar, H.J.; Swen, J.J.; van Schaik, R.H.N.; Weide, J.V.; Rongen, G.; Buunk, A.M.; de Boer-Veger, N.J.; et al. Dutch Pharmacogenetics Working Group (DPWG) guideline for the gene-drug interaction between CYP2C19 and CYP2D6 and SSRIs. Eur. J. Hum. Genet. 2022, 30, 1114–1120. [Google Scholar] [CrossRef]
- Tasnif, Y.; Morado, J.; Hebert, M.F. Pregnancy-related pharmacokinetic changes. Clin. Pharmacol. Ther. 2016, 100, 53–62. [Google Scholar] [CrossRef]
- Hodge, L.S.; Tracy, T.S. Alterations in drug disposition during pregnancy: Implications for drug therapy. Expert Opin. Drug Metab. Toxicol. 2007, 3, 557–571. [Google Scholar] [CrossRef]
- Anderson, G.D. Pregnancy-induced changes in pharmacokinetics: A mechanistic-based approach. Clin. Pharmacokinet. 2005, 44, 989–1008. [Google Scholar] [CrossRef]
- Badaoui, S.; Hopkins, A.M.; Rodrigues, A.D.; Miners, J.O.; Sorich, M.J.; Rowland, A. Application of Model Informed Precision Dosing to Address the Impact of Pregnancy Stage and CYP2D6 Phenotype on Foetal Morphine Exposure. AAPS J. 2021, 23, 15. [Google Scholar] [CrossRef]
- Giaginis, C.; Theocharis, S.; Tsantili-Kakoulidou, A. Current toxicological aspects on drug and chemical transport and metabolism across the human placental barrier. Expert Opin. Drug Metab. Toxicol. 2012, 8, 1263–1275. [Google Scholar] [CrossRef]
- Ewing, G.; Tatarchuk, Y.; Appleby, D.; Schwartz, N.; Kim, D. Placental transfer of antidepressant medications: Implications for postnatal adaptation syndrome. Clin. Pharmacokinet. 2015, 54, 359–370. [Google Scholar] [CrossRef] [Green Version]
- Evseenko, D.; Paxton, J.W.; Keelan, J.A. Active transport across the human placenta: Impact on drug efficacy and toxicity. Expert Opin. Drug Metab. Toxicol. 2006, 2, 51–69. [Google Scholar] [CrossRef]
- Wishart, D.S.; Feunang, Y.D.; Guo, A.C.; Lo, E.J.; Marcu, A.; Grant, J.R.; Sajed, T.; Johnson, D.; Li, C.; Sayeeda, Z.; et al. DrugBank 5.0: A major update to the DrugBank database for 2018. Nucleic Acids Res. 2018, 46, D1074–D1082. [Google Scholar] [CrossRef]
- Browne, V.A.; Julian, C.G.; Toledo-Jaldin, L.; Cioffi-Ragan, D.; Vargas, E.; Moore, L.G. Uterine artery blood flow, fetal hypoxia and fetal growth. Philos. Trans. R. Soc. Lond. B Biol. Sci. 2015, 370, 20140068. [Google Scholar] [CrossRef] [Green Version]
- Schoretsanitis, G.; Westin, A.A.; Stingl, J.C.; Deligiannidis, K.M.; Paulzen, M.; Spigset, O. Antidepressant transfer into amniotic fluid, umbilical cord blood breast milk: A systematic review combined analysis. Prog. Neuro-Psychopharmacol. Biol. Psychiatry 2021, 107, 110228. [Google Scholar] [CrossRef]
- Mulder, H.; Wilmink, F.W.; Beumer, T.L.; Tamminga, W.J.; Jedema, J.N.; Egberts, A.C. The association between cytochrome P450 2D6 genotype and prescription patterns of antipsychotic and antidepressant drugs in hospitalized psychiatric patients: A retrospective follow-up study. J. Clin. Psychopharmacol. 2005, 25, 188–191. [Google Scholar] [CrossRef]
- Berard, A.; Gaedigk, A.; Sheehy, O.; Chambers, C.; Roth, M.; Bozzo, P.; Johnson, D.; Kao, K.; Lavigne, S.; Wolfe, L.; et al. Association between CYP2D6 Genotypes and the Risk of Antidepressant Discontinuation, Dosage Modification and the Occurrence of Maternal Depression during Pregnancy. Front. Pharmacol. 2017, 8, 402. [Google Scholar] [CrossRef] [Green Version]
- Rau, T.; Wohlleben, G.; Wuttke, H.; Thuerauf, N.; Lunkenheimer, J.; Lanczik, M.; Eschenhagen, T. CYP2D6 genotype: Impact on adverse effects and nonresponse during treatment with antidepressants-a pilot study. Clin. Pharmacol. Ther. 2004, 75, 386–393. [Google Scholar] [CrossRef]
- Misri, S.; Eng, A.B.; Abizadeh, J.; Blackwell, E.; Spidel, A.; Oberlander, T.F. Factors impacting decisions to decline or adhere to antidepressant medication in perinatal women with mood and anxiety disorders. Depress. Anxiety 2013, 30, 1129–1136. [Google Scholar] [CrossRef]
- COVID-19 Treatment Guidelines Panel. Coronavirus Disease 2019 (COVID-19) Treatment Guidelines. National Institutes of Health. Available online: https://www.covid19treatmentguidelines.nih.gov/ (accessed on 26 October 2021).
- Womersley, K.; Ripullone, K.; Agius, M. What are the risks associated with different Selective Serotonin Re-uptake Inhibitors (SSRIs) to treat depression and anxiety in pregnancy? An evaluation of current evidence. Psychiatr. Danub. 2017, 29, 629–644. [Google Scholar]
- The Medicines Healthcare products Regulatory Agency United Kingdom. Guidance: Selective Serotonin Reuptake Inhibitors (SSRIs) and Serotonin and Noradrenaline Reuptake Inhibitors (SNRIs): Use and Safety. Available online: https://www.gov.uk/government/publications/ssris-and-snris-use-and-safety/selective-serotonin-reuptake-inhibitors-ssris-and-serotonin-and-noradrenaline-reuptake-inhibitors-snris-use-and-safety#safety-concerns-with-ssrisnri-use-in-pregnancy (accessed on 17 November 2021).
Figure 1.
A 4-step workflow for fluvoxamine gestational model’s development.

Figure 2.
Comparison between simulated trial and observed data for (A) Cmax and (B) AUCinf from De Vries et al. [39]. Coloured data points arranged vertically represent the predicted and observed data for each dose; horizontal lines on the coloured data points represent the mean and standard deviation (SD). * p < 0.05.

Figure 3.
Single-dose studies simulated through model development. (A) Single-dose 25 mg; (B) Single-dose 50 mg; (C) Single-dose 100 mg. Solid lines represent the mean predicted concentration-time profile, with dotted lines representing the 5th and 95th percentile ranges. Solid circles represent observed clinical data from each study. Van Harten et al. (1991)a represents the 50 mg fed study [40]; Van Harten et al. (1991)b represents the 50 mg fast study [40]. Bahrami and Mohammadi (2007)a represents the 100 mg test formulation study [41]; Bahrami and Mohammadi (2007)b represents the 100 mg reference formulation study [41].

Figure 4.
Single-dose studies simulated in model validation stage. (A) Single-dose 50 mg [44]; (B) Single-dose 100 mg [45,46]. Solid lines represent the mean predicted concentration-time profile, with dotted lines representing the 5th and 95th percentile ranges. Solid circles represent observed clinical data from each study.

Figure 5.
Multiple-dose studies simulated in model development and validation. (A) Multiple-dose 50 mg twice daily from day 4 to day 31 [42]; (B) multiple-dose 50 mg daily for 3 days followed by 100 mg daily for 7 days [43]; (C) multiple-dose 12.5 mg twice daily for week 1, 25 mg twice daily for week 2, 50 mg twice daily for week 3, and 100 mg twice daily for week 4 [47]; (D) multiple-dose 100 mg daily for 10 days [46]. Solid lines represent the mean predicted concentration-time profile, with dotted lines representing the 5th and 95th percentile ranges. Solid circles represent observed clinical data from each study, with error bars indicating SD. USFDA (2008)a represents a bioavailability study with prototype D [46]; USFDA (2008)b represents a bioavailability study with prototype C [46].

Figure 6.
Simulated single-dose studies in model validation for CYP2D6 phenotype. (A) Single-dose 50 mg in EM CYP2D6 population [48,49,50,51]; (B) single-dose 50 mg in PM CYP2D6 population [48,49,50]; (C) single-dose 25 mg in PM CYP2D6 population [51]; solid lines represent the mean predicted concentration-time profile, with dotted lines representing the 5th and 95th percentile ranges. Solid circles represent observed clinical data from each study, with error bars indicating SD.

Figure 7.
Predicted maximum concentration and steady-state concentration for single-dose and multiple-dose studies. (A) EM CYP2D6 phenotype population; (B) PM CYP2D6 phenotype population; solid circles arranged vertically represent the predicted values for each dose. Horizontal lines on the coloured data points represent the mean and SD. Red, open circles represent the observed individual data from Christensen et al. [51]. Cmax, maximum concentration for single-dose; Css, average trough concentration at steady-state for Day 6 and Day 7.

Figure 8.
Predicted steady-state Cmin fluvoxamine maternal concentration. Green, open circles represent the post-dose trough concentration sampled at 24 h post-dose and assembled every 5 GWs throughout the maternity period. Red, open circles represent reported plasma concentrations collected from 3 pregnant women from Westin et al. [18]. ‘0’ refers to the baseline predicted in the non-pregnant female population. The grey shaded region represents the fluvoxamine therapeutic window (TW).

Figure 9.
Simulated fluvoxamine foetal (umbilical cord) concentrations. Doses were administered to steady-state with sampling on the final 30-h period of GW 40. Solid circles represent individual predicted cord concentrations. Coloured open circles represent the observed umbilical cord concentrations from Hostetter et al. [56], Sit et al. [57] and Rampono et al. [58],. Horizontal lines on the coloured data points represent the mean and SD.

Figure 10.
Simulated fluvoxamine maternal concentrations in CYP2D6 phenotype population. (A) 50 mg daily; (B) 100 mg daily; (C) 300 mg daily. Coloured solid circles represent individual, predicted maternal concentrations. Cmax, maximum concentration; Cmin, minimum concentration. Horizontal lines on the coloured solid circles represent mean and standard deviations. The shaded region represents the fluvoxamine TW. Comparison between each CYP2D6 phenotype for every 5 GWs showed statistically significant difference except between UM and EM at GW labelled as ‘ns’, p > 0.05.

Figure 11.
Simulated fluvoxamine umbilical cord concentrations in CYP2D6 phenotype population. (A) 50 mg daily; (B) 100 mg daily; (C) 300 mg daily. Coloured solid circles represent individual, predicted umbilical cord concentrations. Cmax, maximum concentration; Cmin, minimum concentration. Horizontal lines on the coloured solid circles represent mean and standard deviations. Comparing each CYP2D6 phenotype for every 5 GWs starting from GW 20 showed a statistically significant difference when compared with PM and a non-statistically significant difference between UM and EM at GW 25 for 300 mg daily—labelled as ‘*’; p < 0.05.

Figure 12.
Predicted clearance, area-under-the-curve, and cord concentration based on the recommended doses. (A) Clearance; (B) area-under-the-curve; (C) umbilical cord concentration. Top and bottom horizontal lines in (A,B) represent standard deviations. Coloured, closed circles in (C) are the predicted individual cord concentrations. Horizontal lines on the coloured, solid circles in (C) represent the mean. Dashed horizontal lines in (C) represent the range of simulated cord concentrations throughout gestational periods and all three CYP2D6 phenotypes (5 ng/mL to 500 ng/mL).


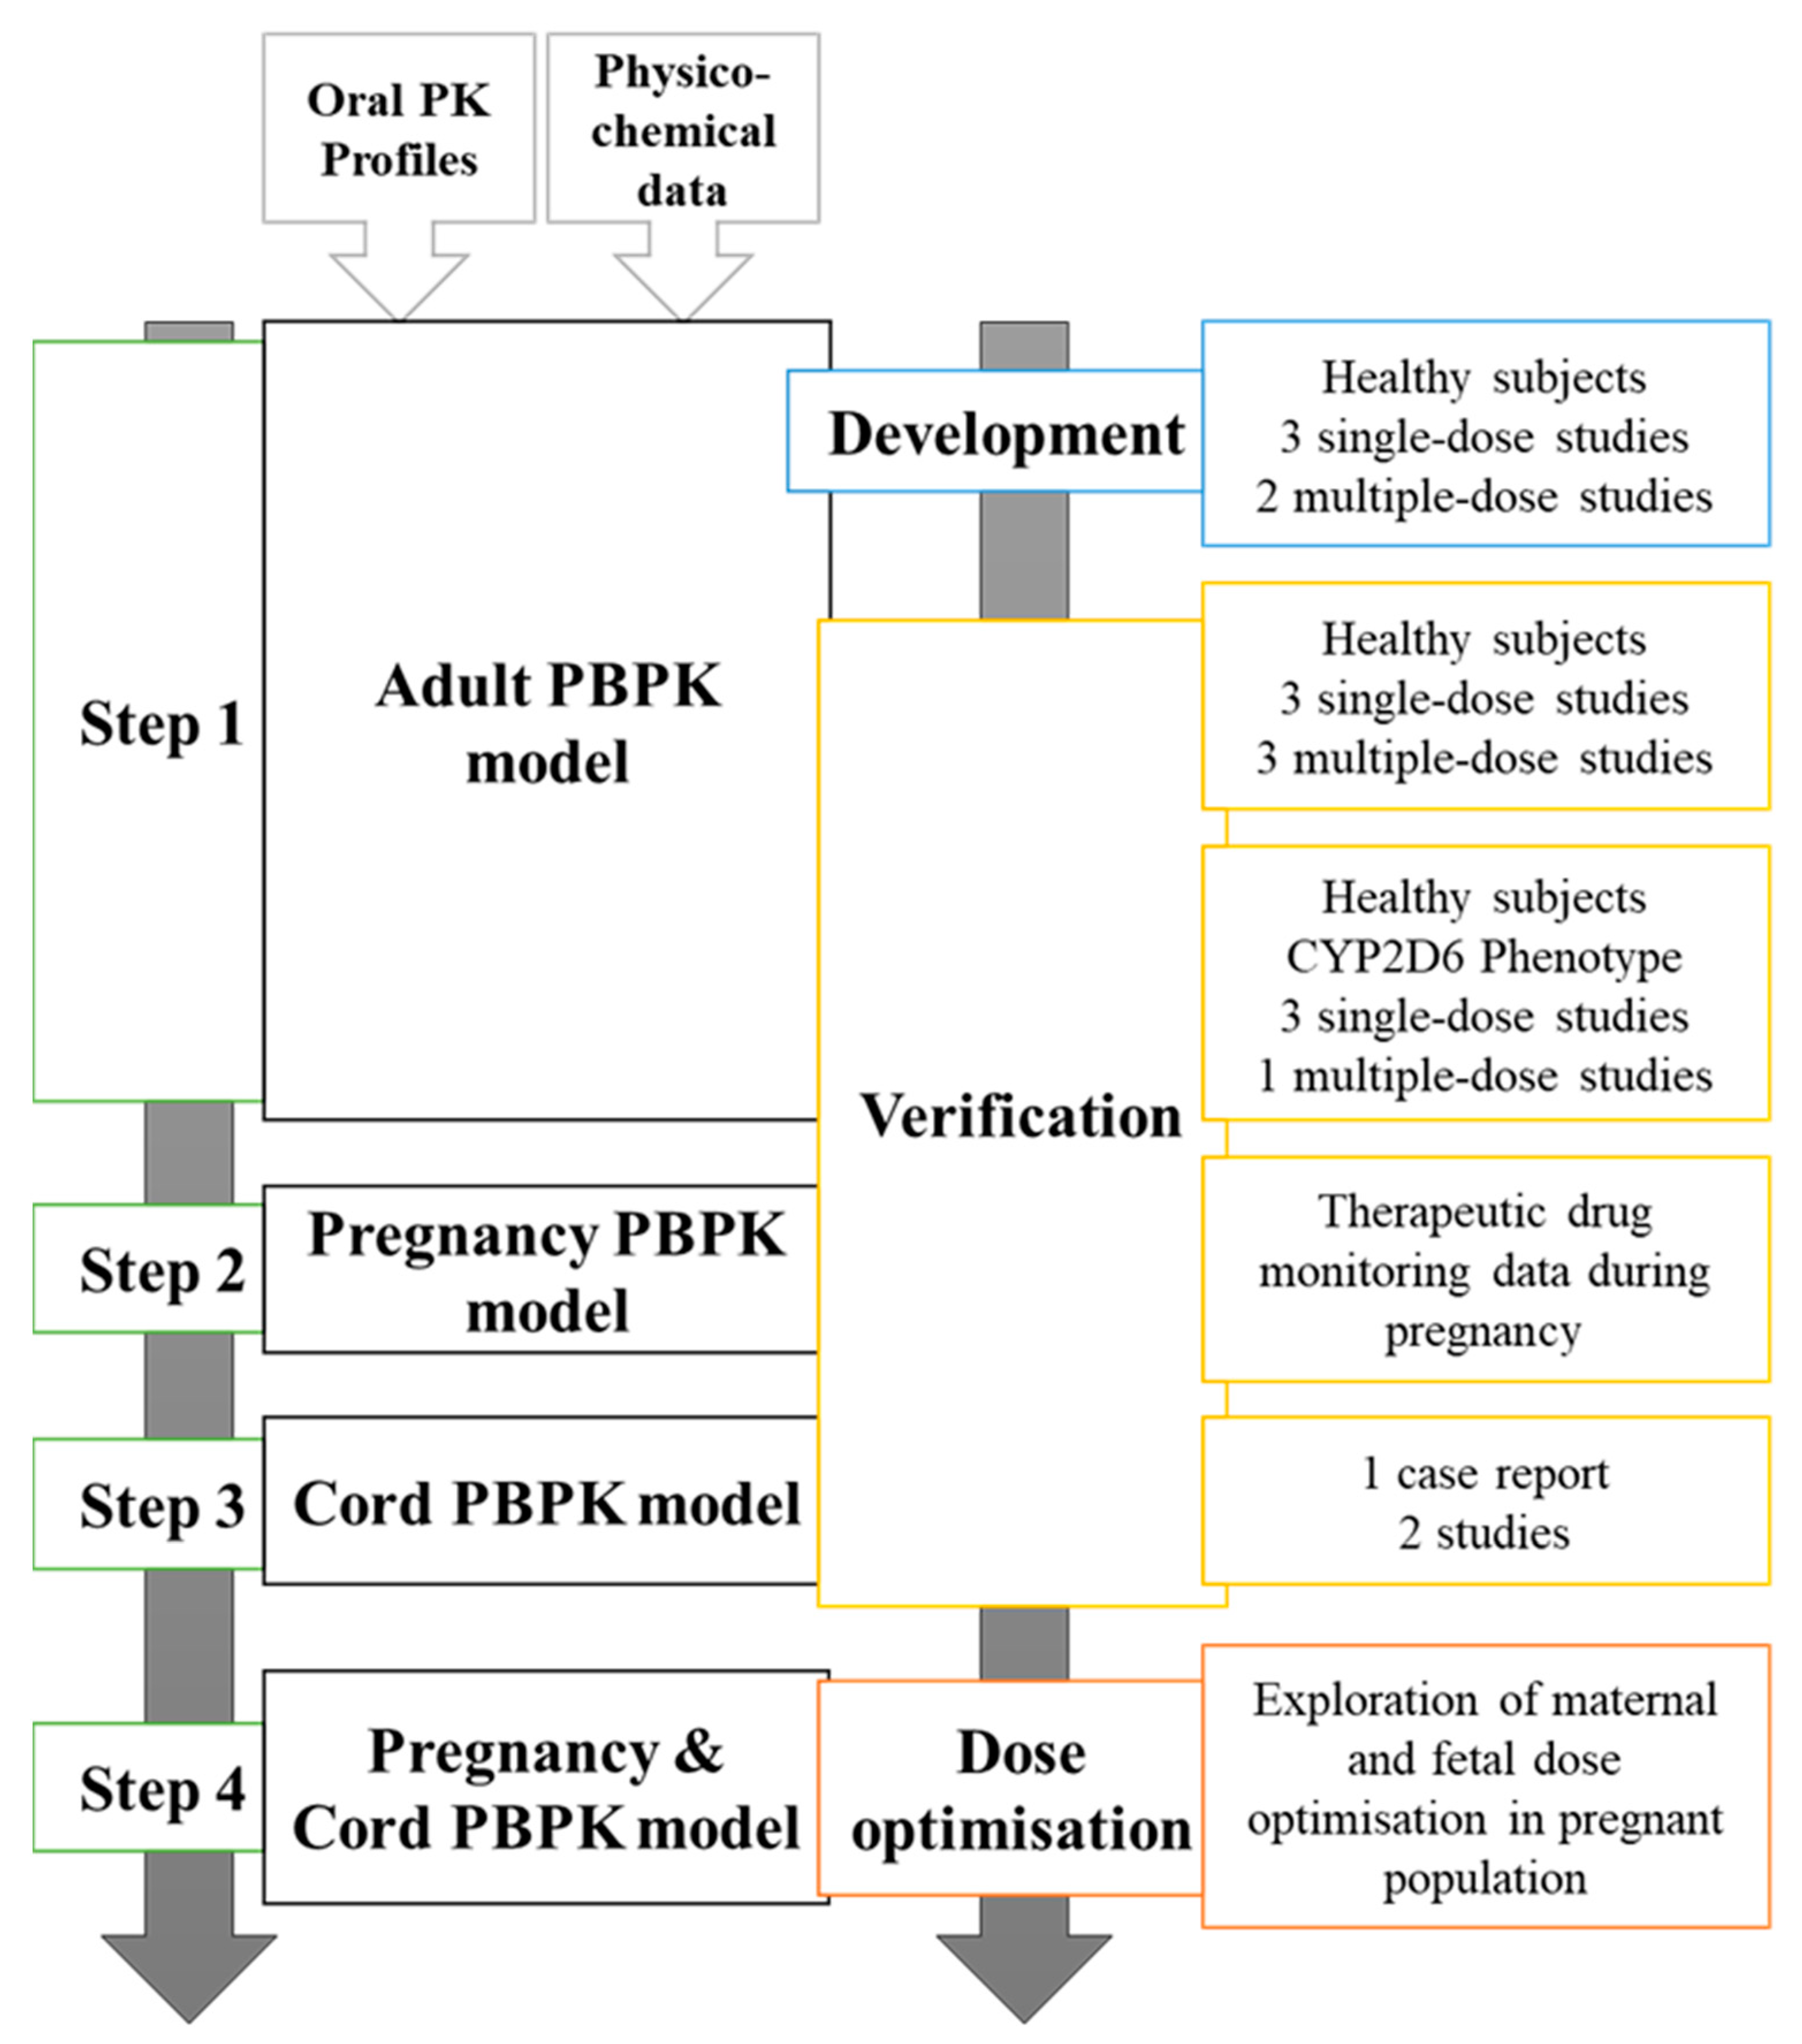
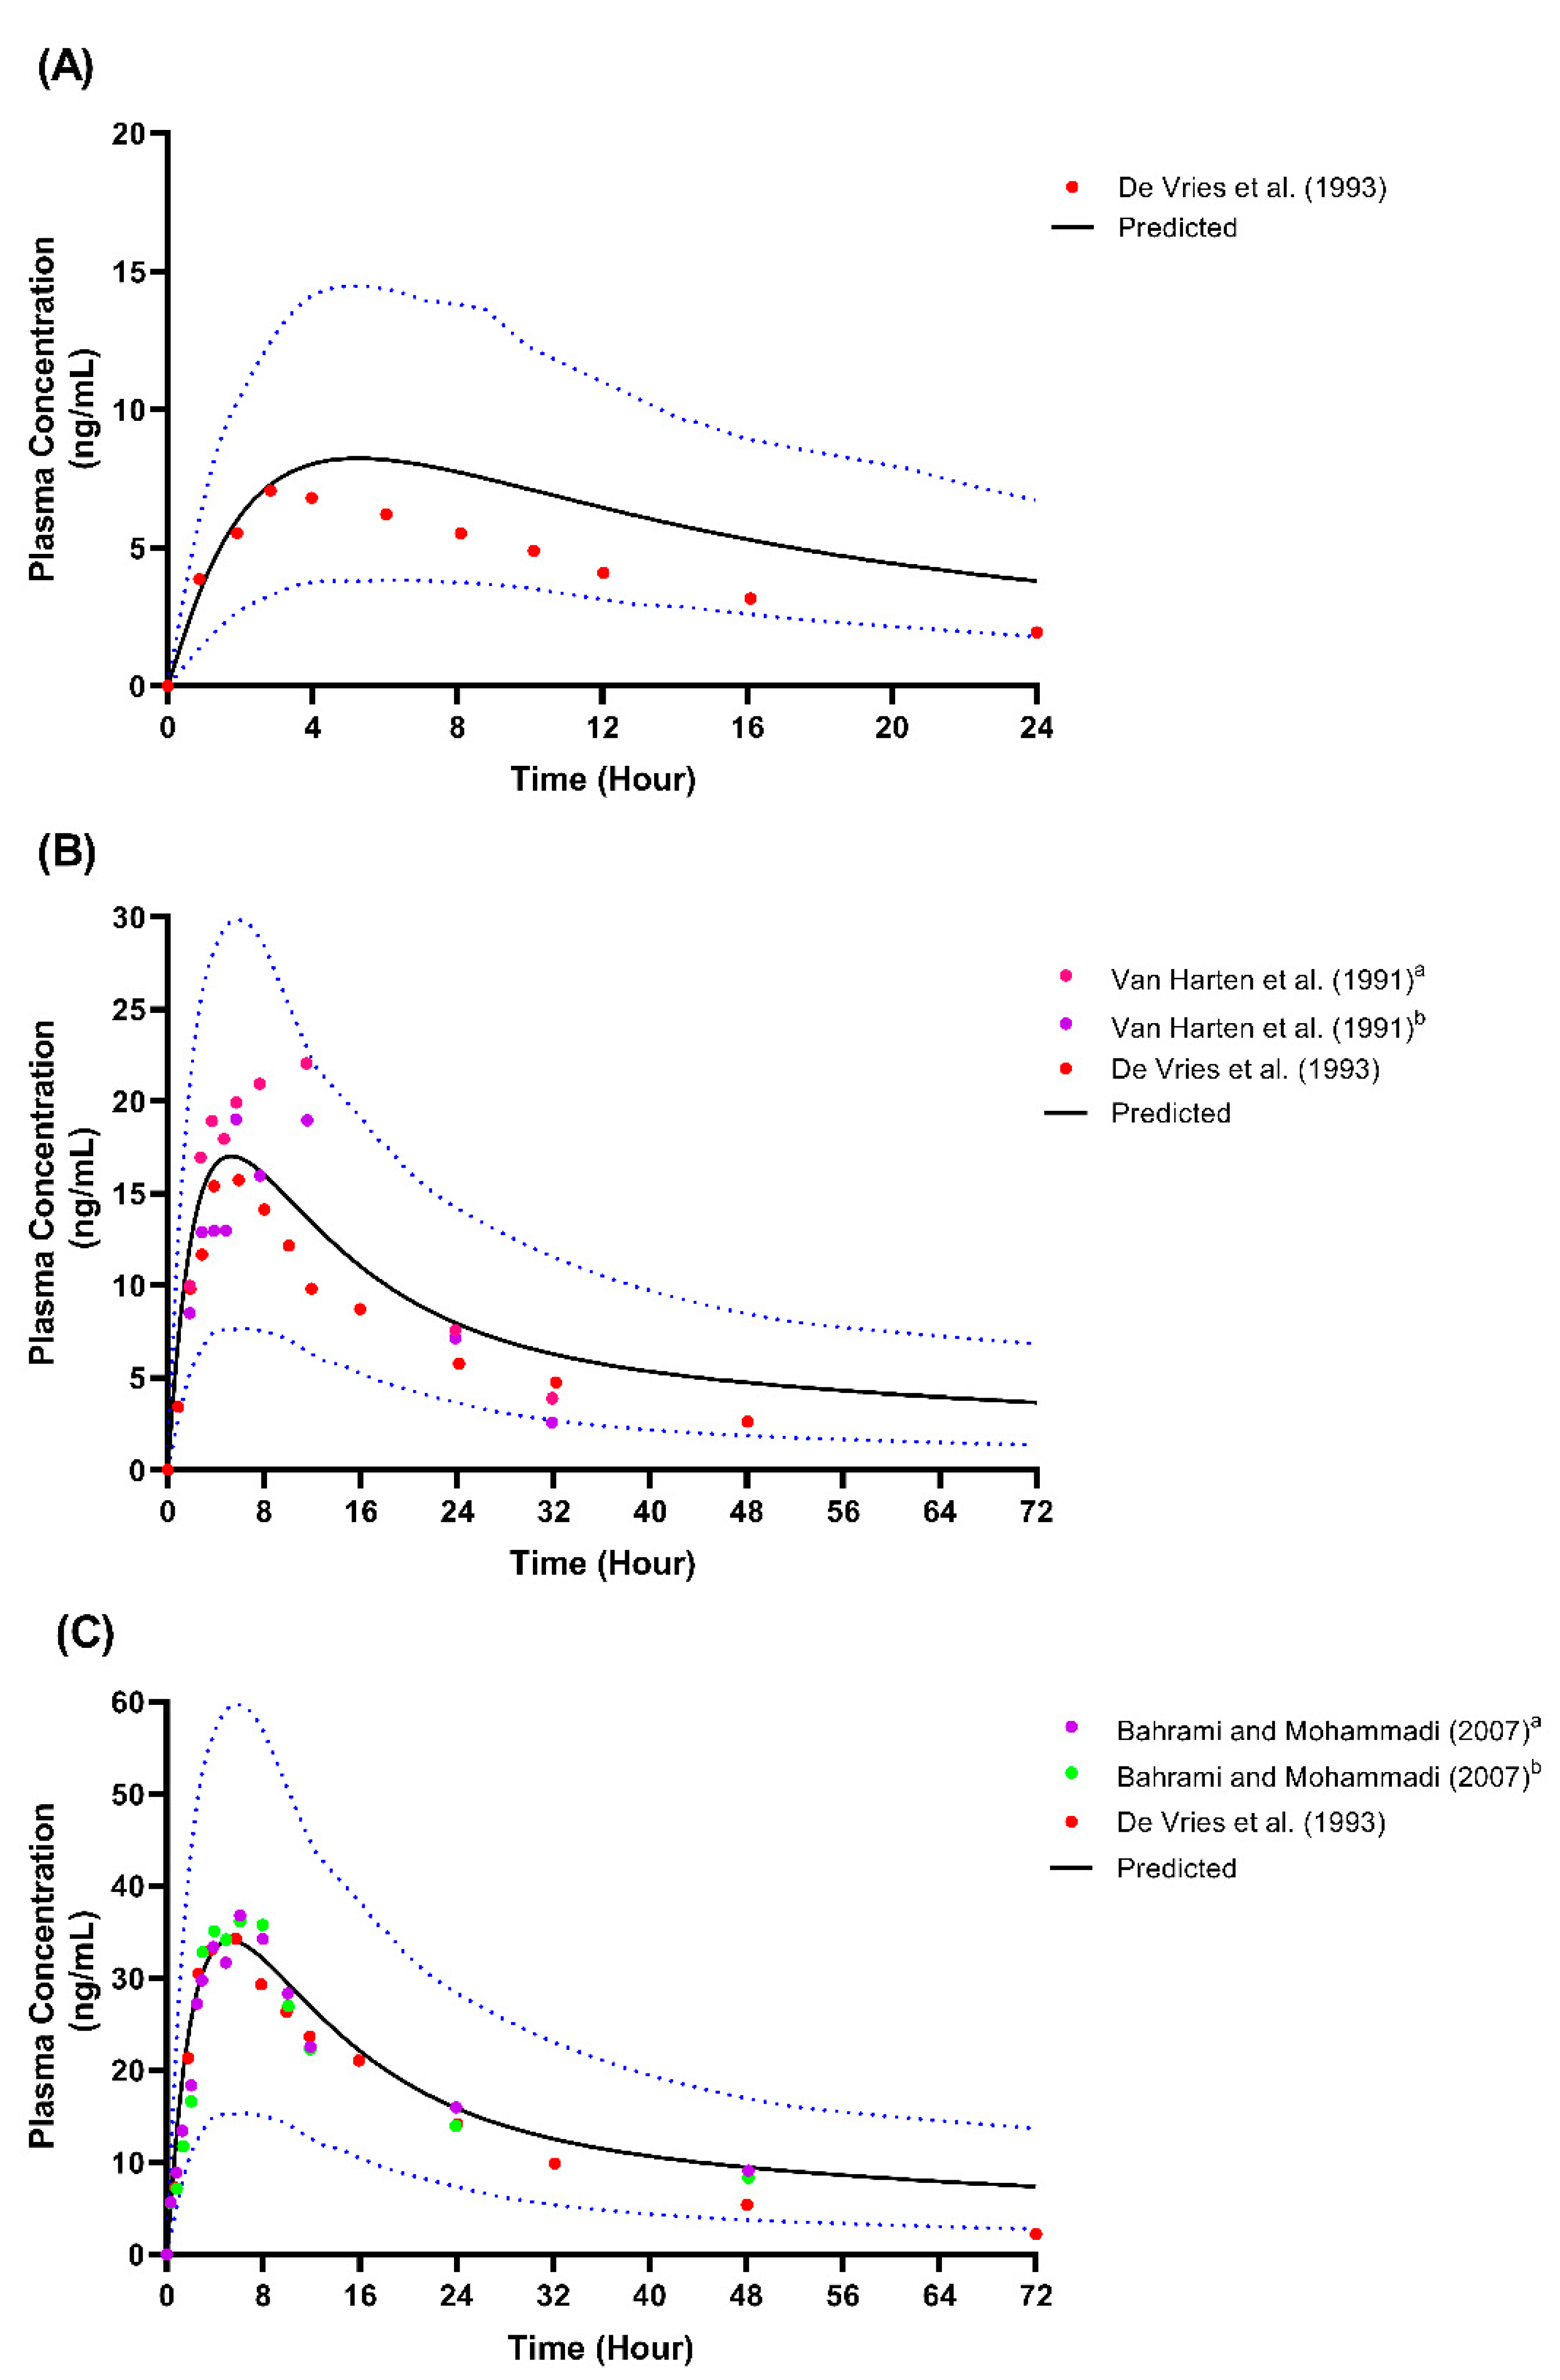
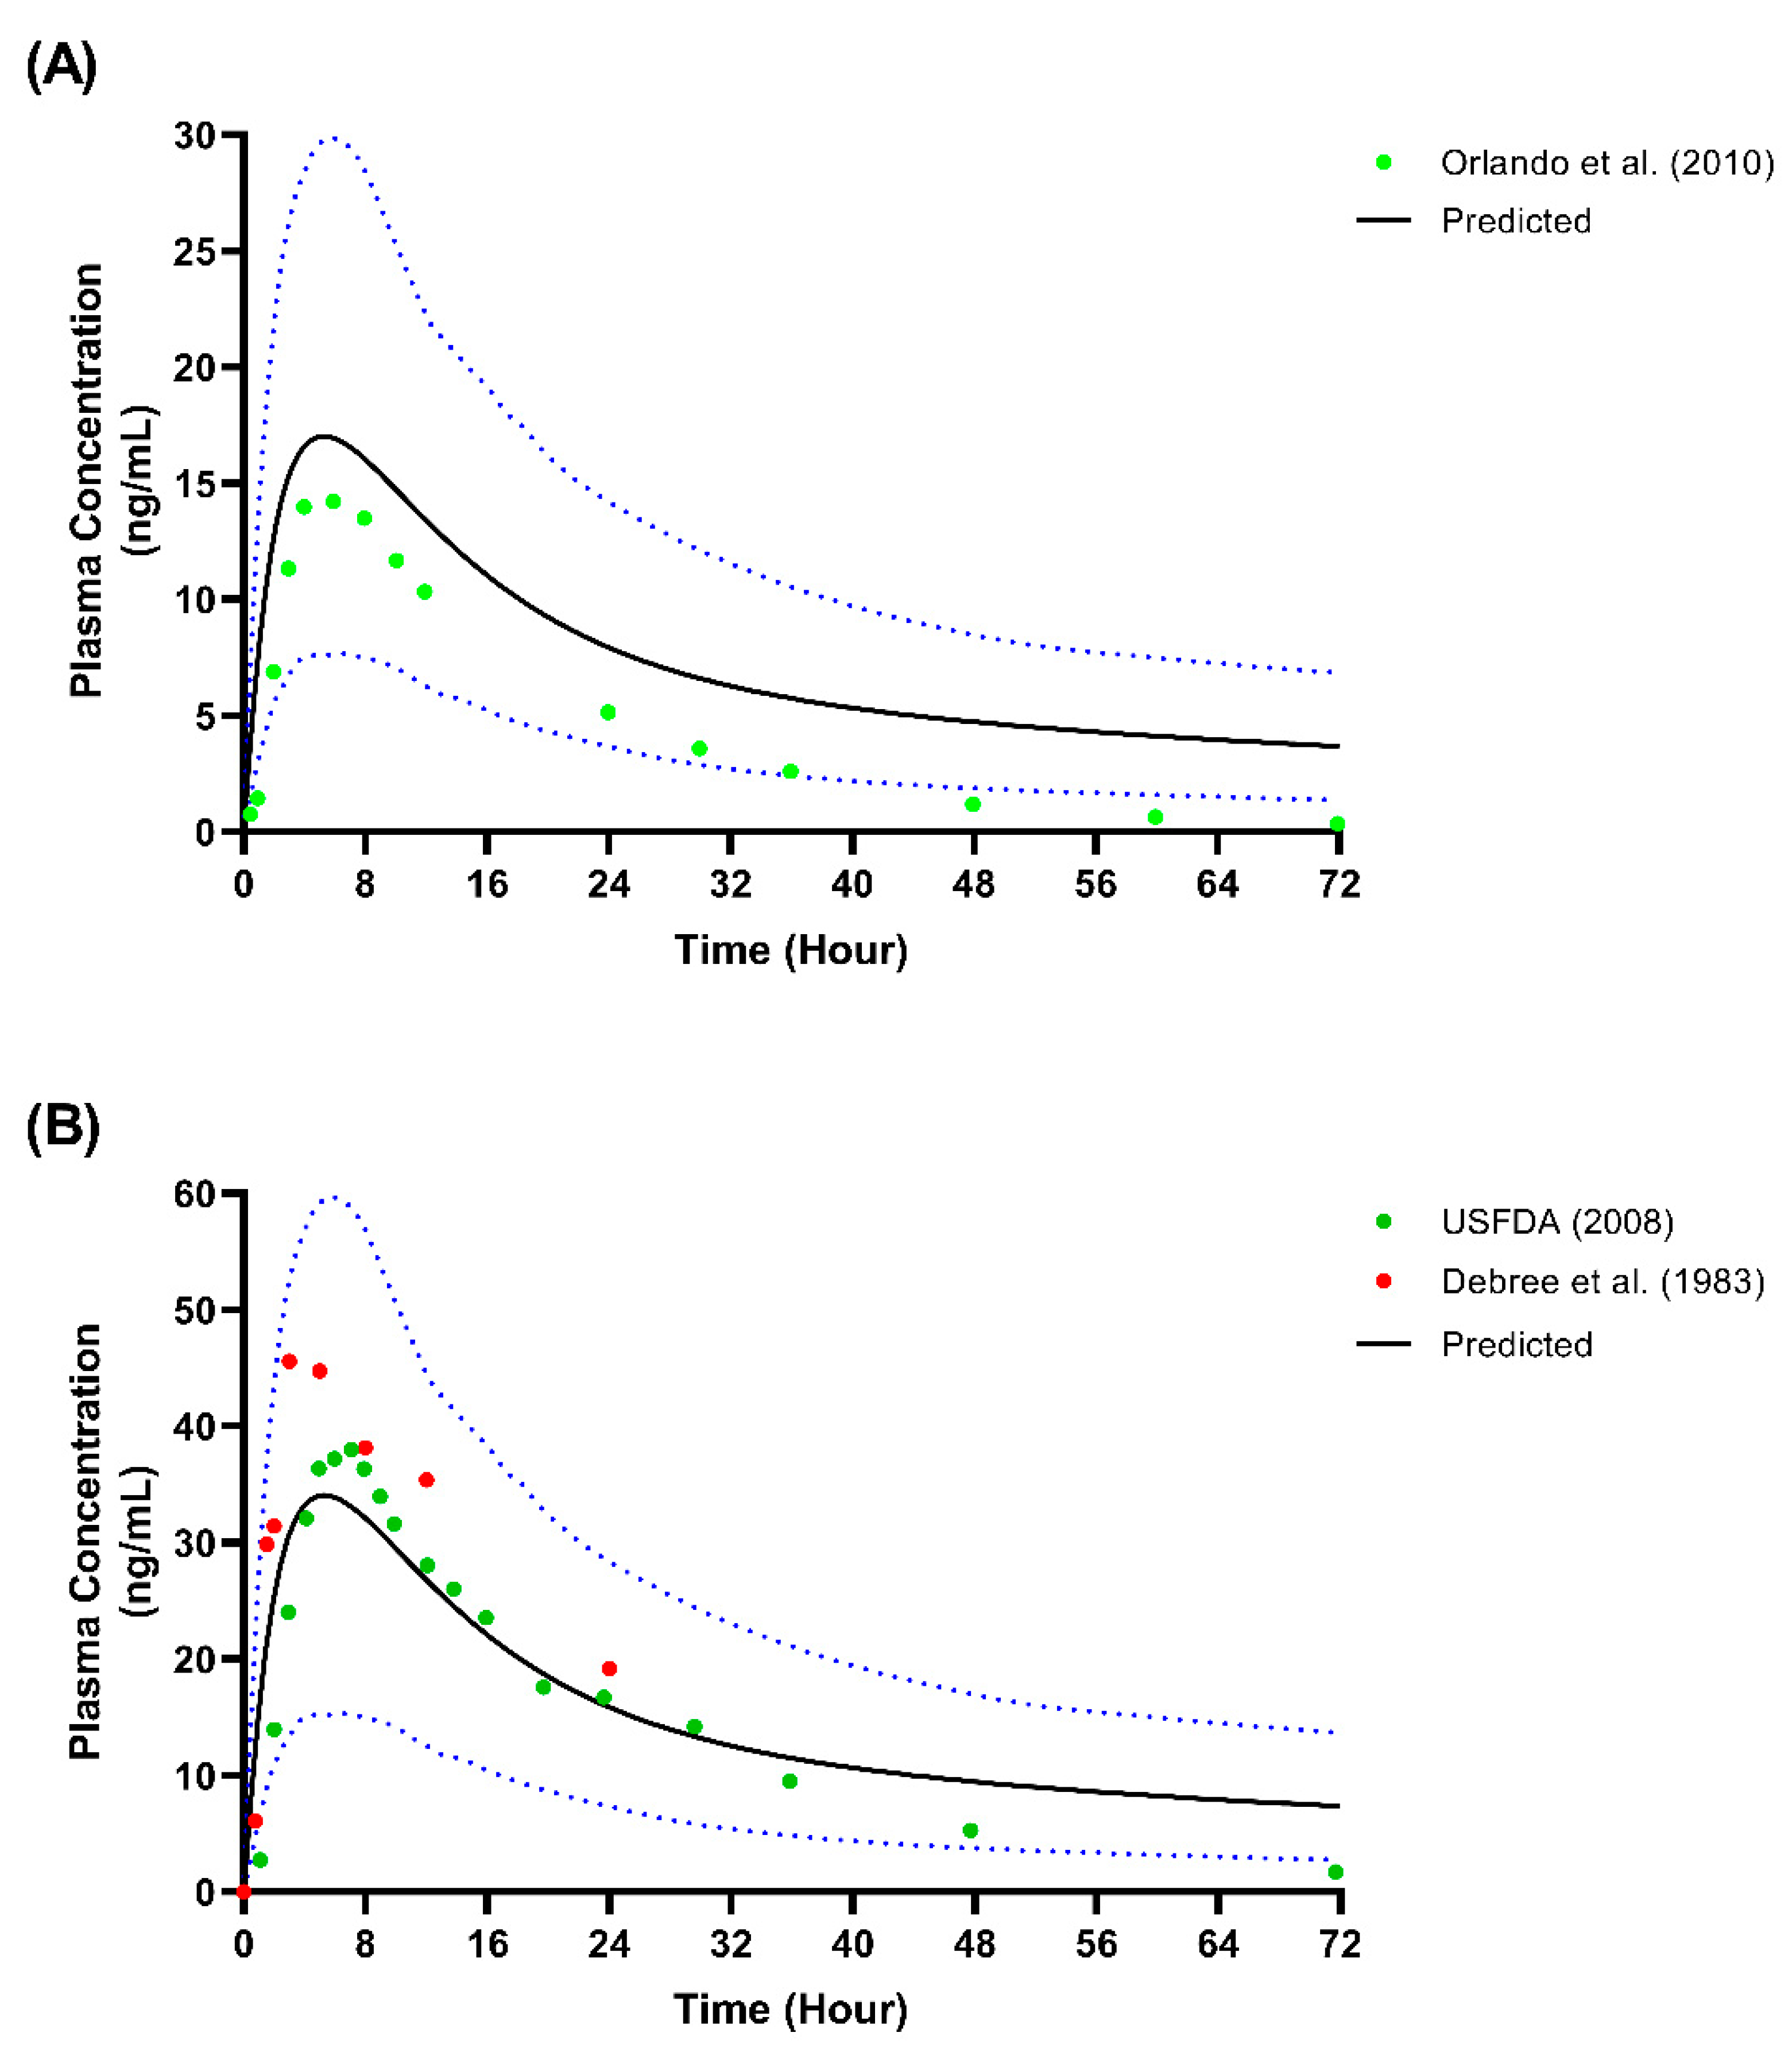
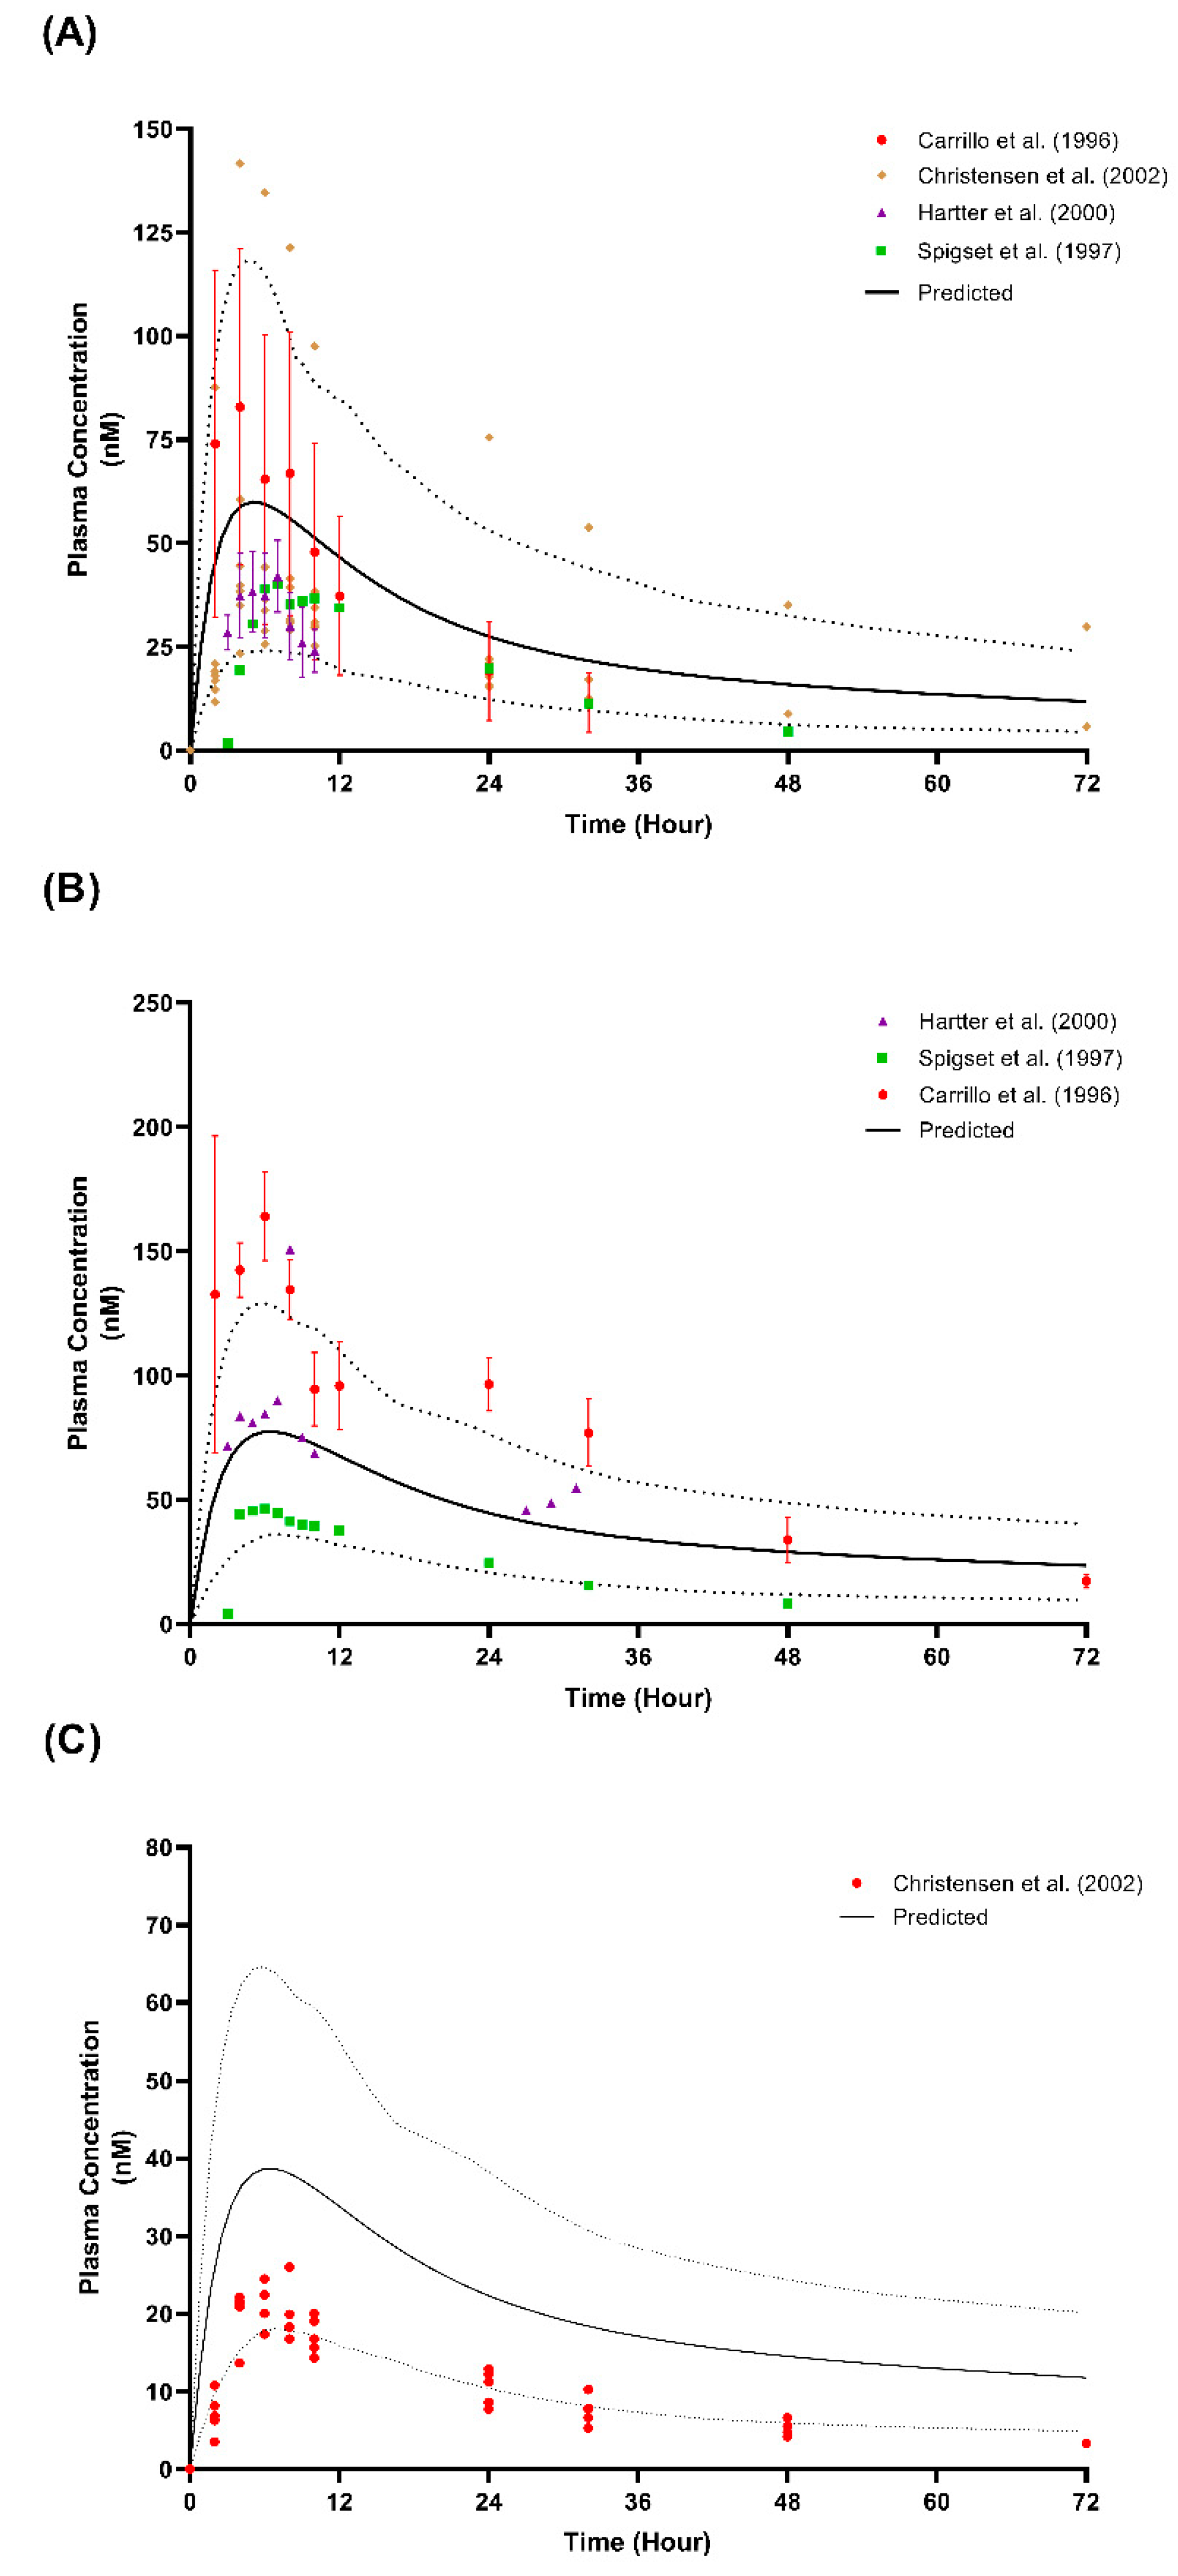
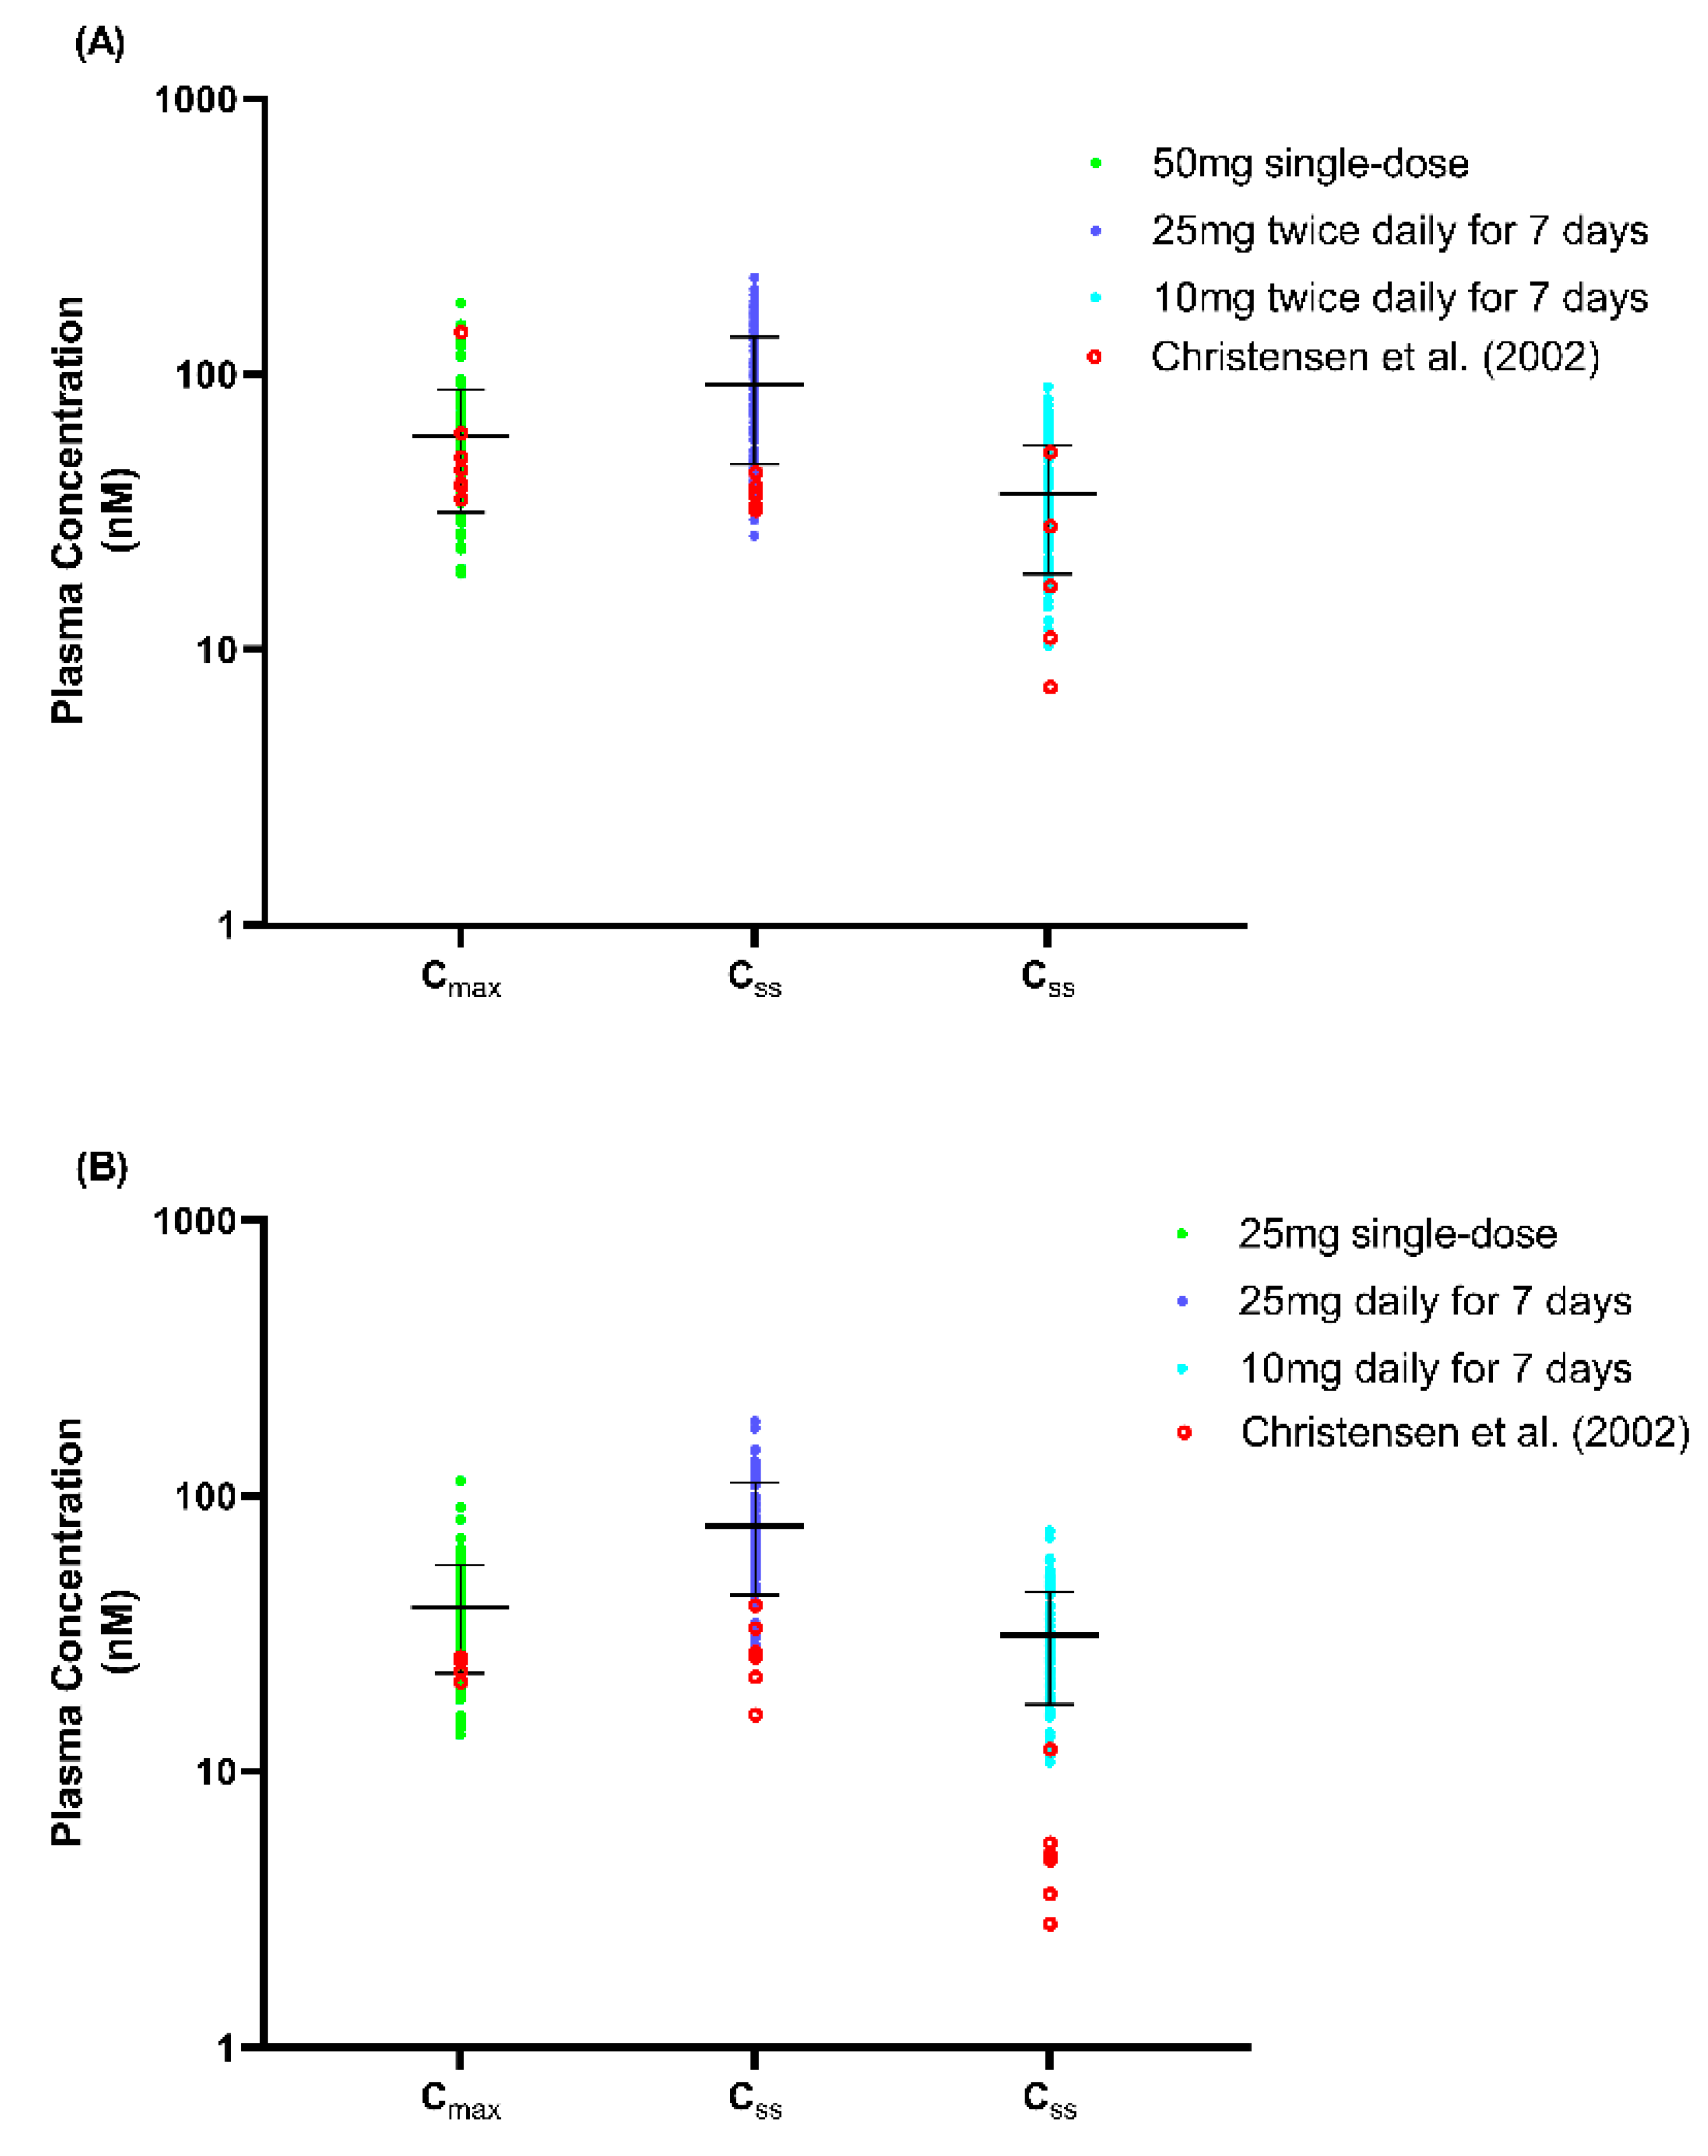
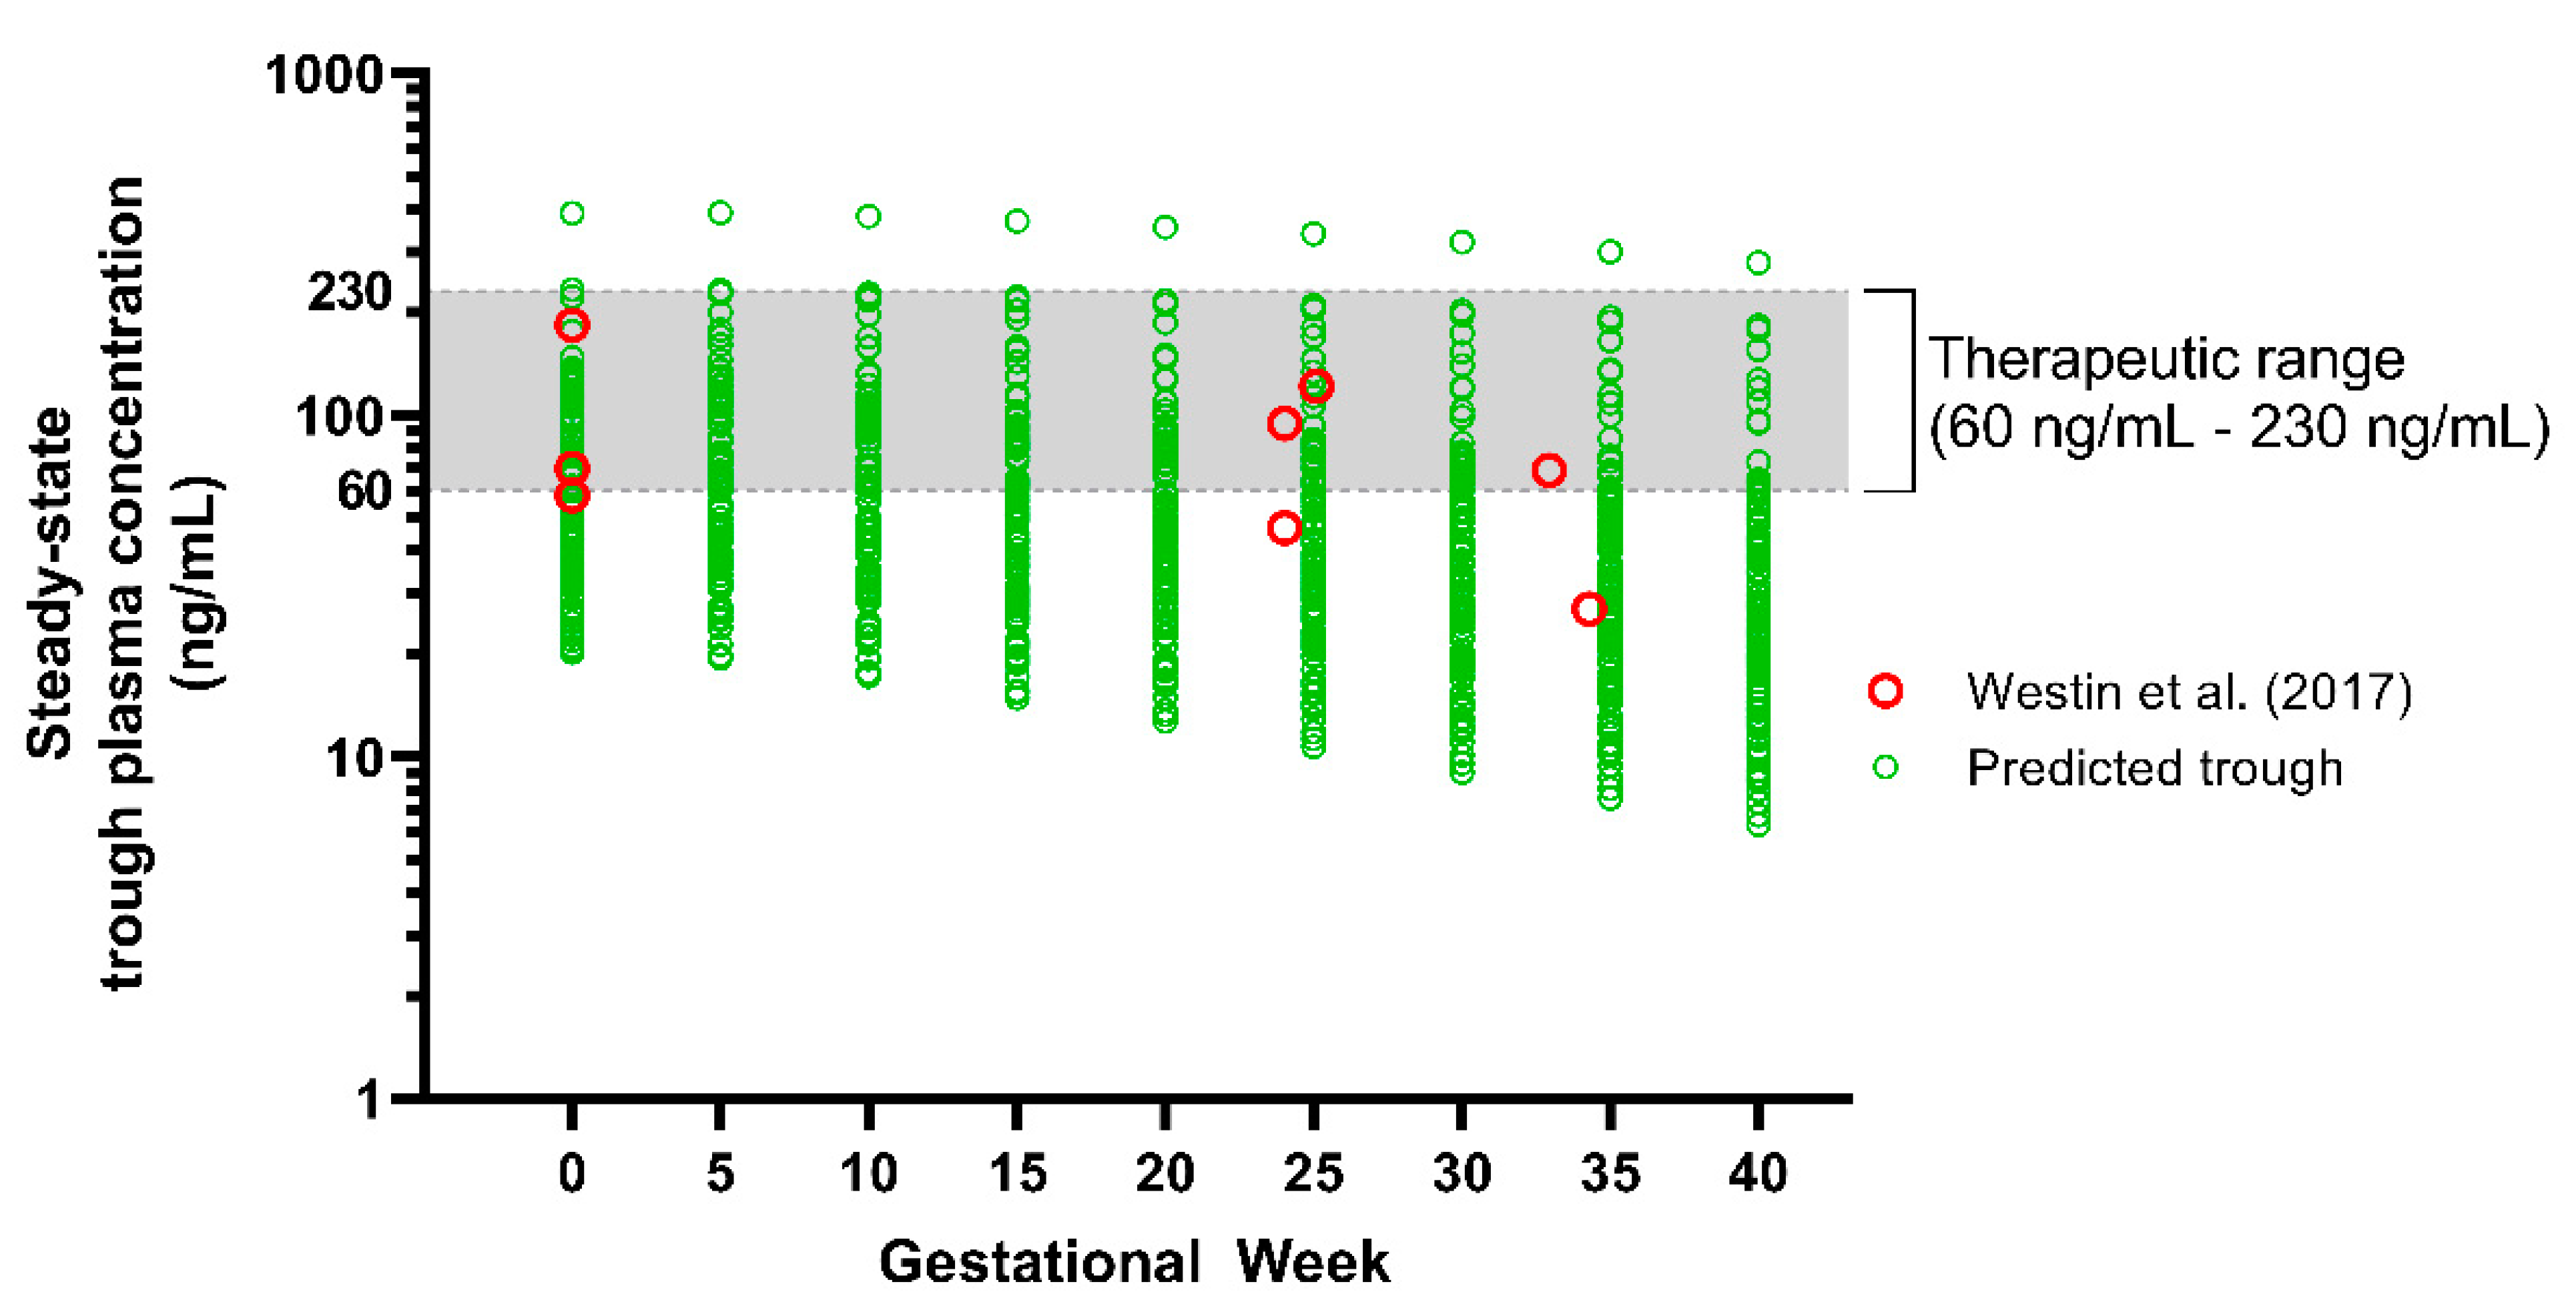
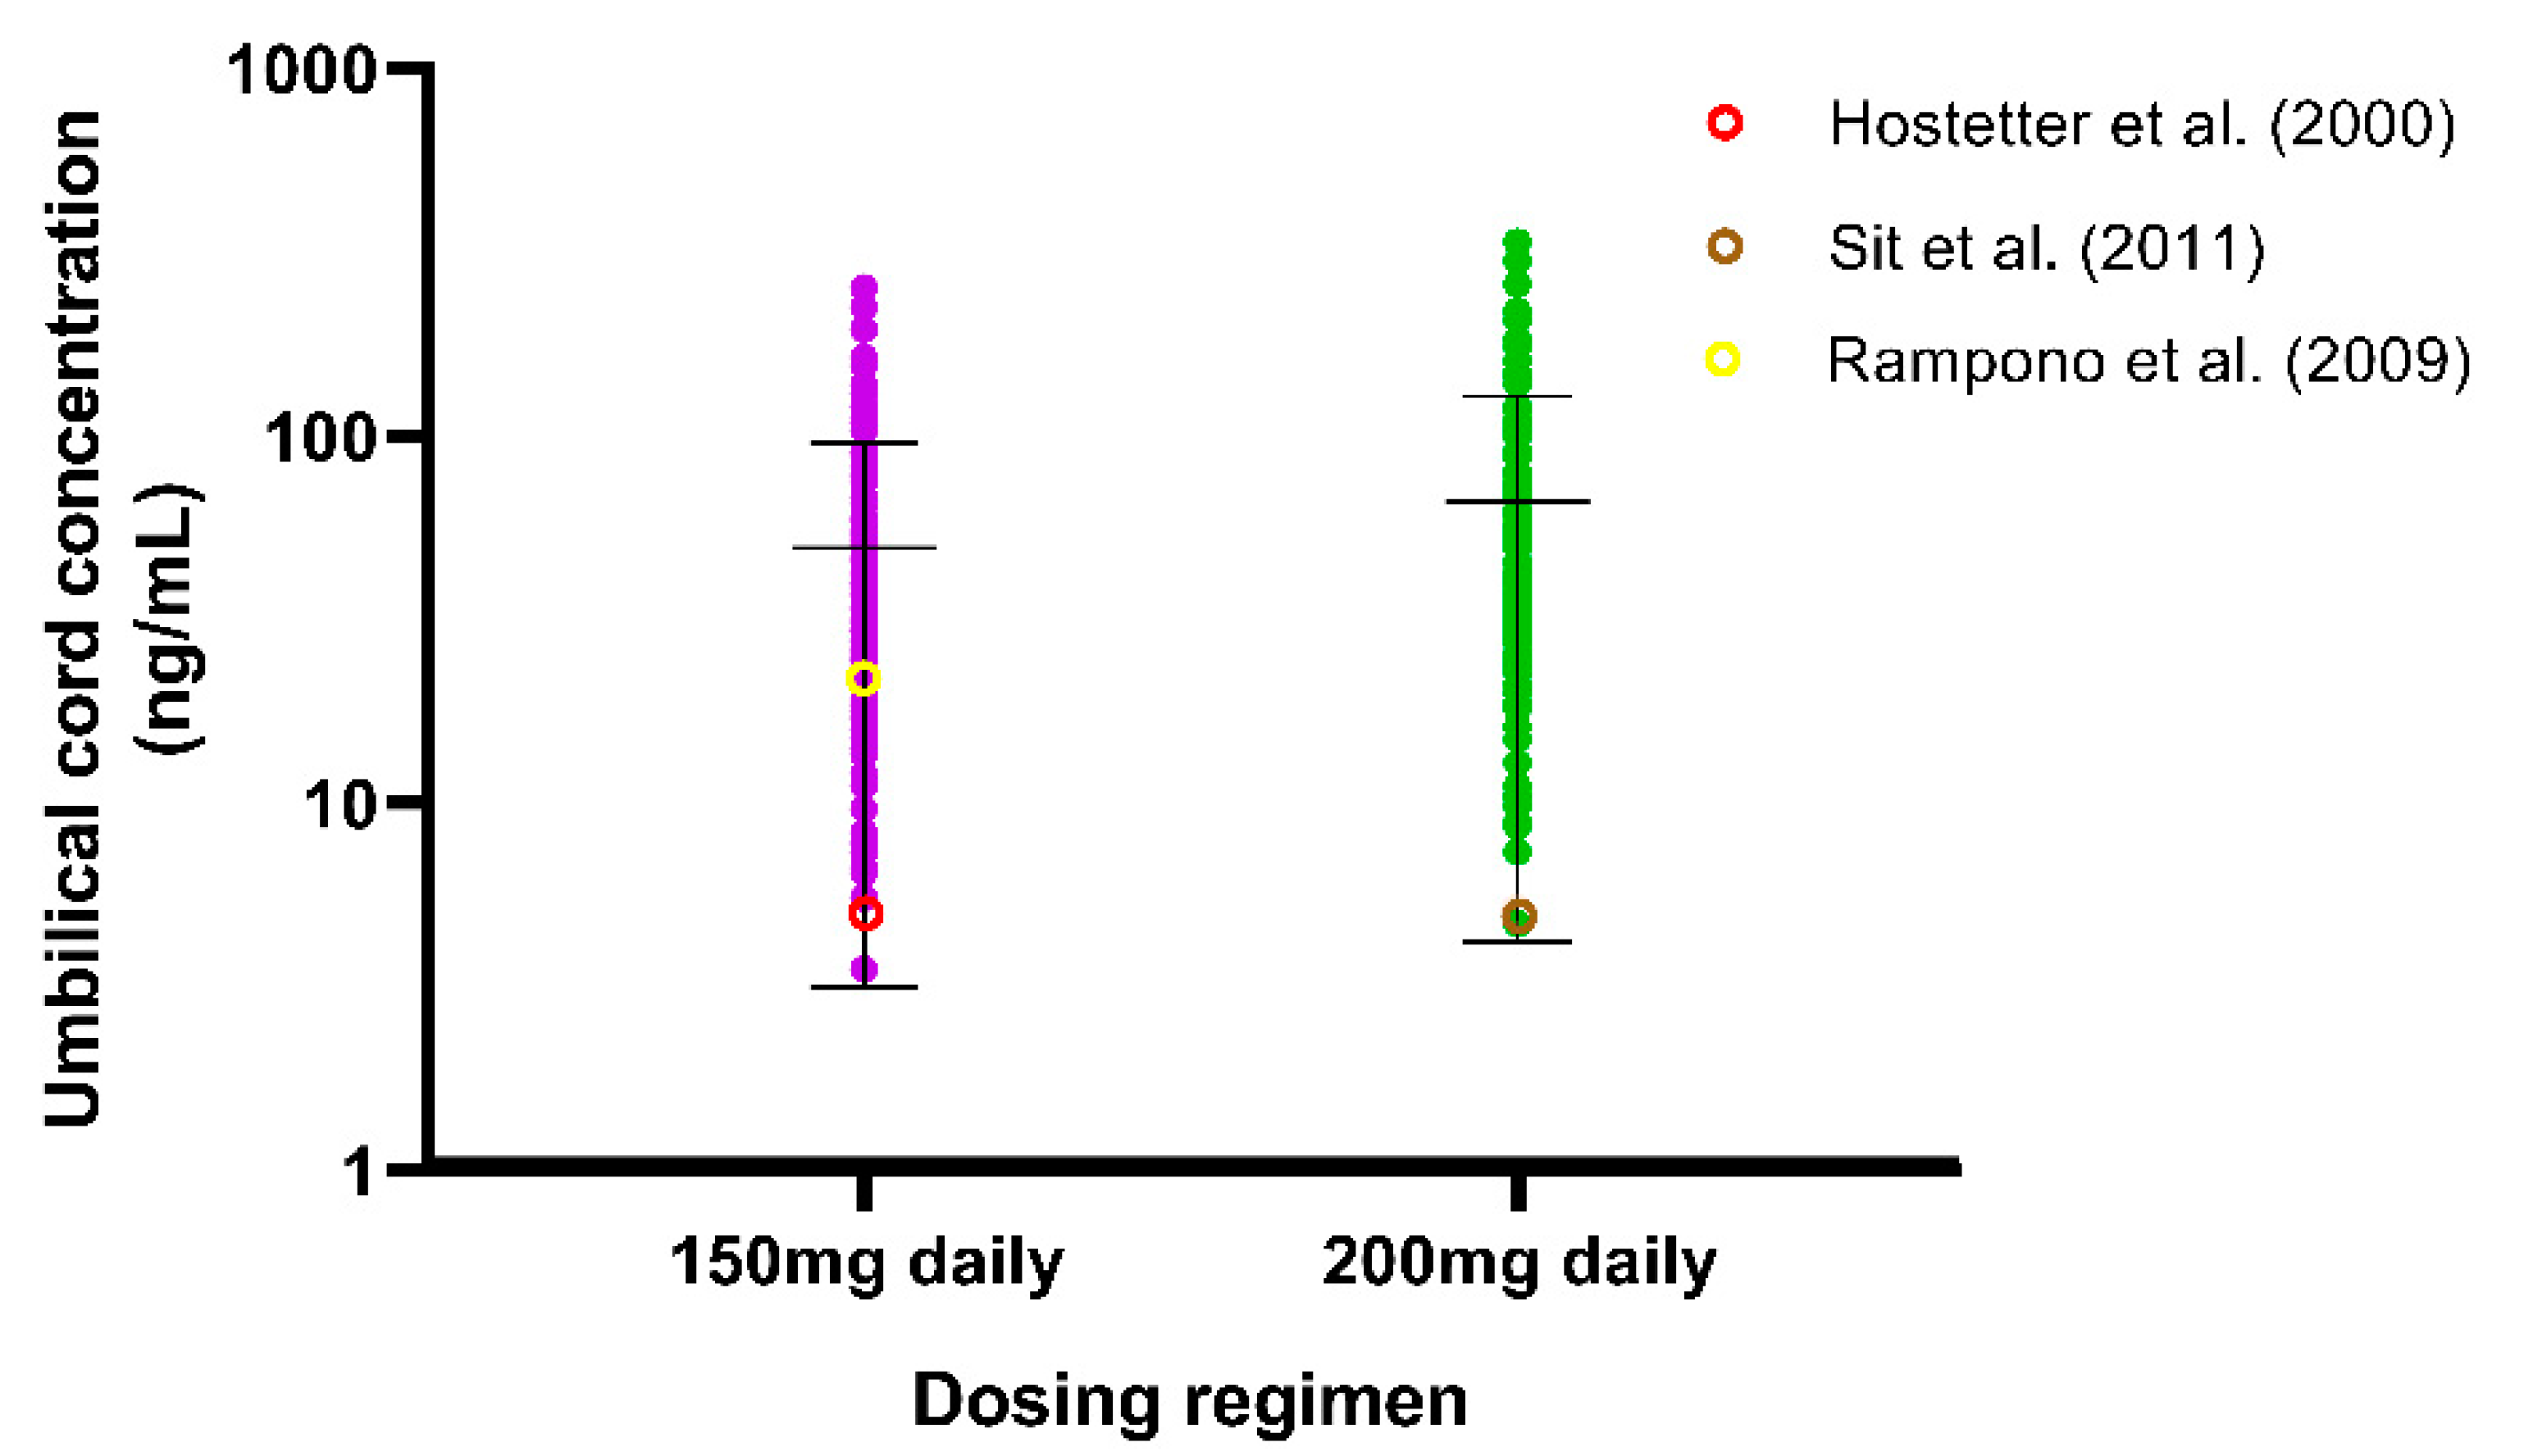
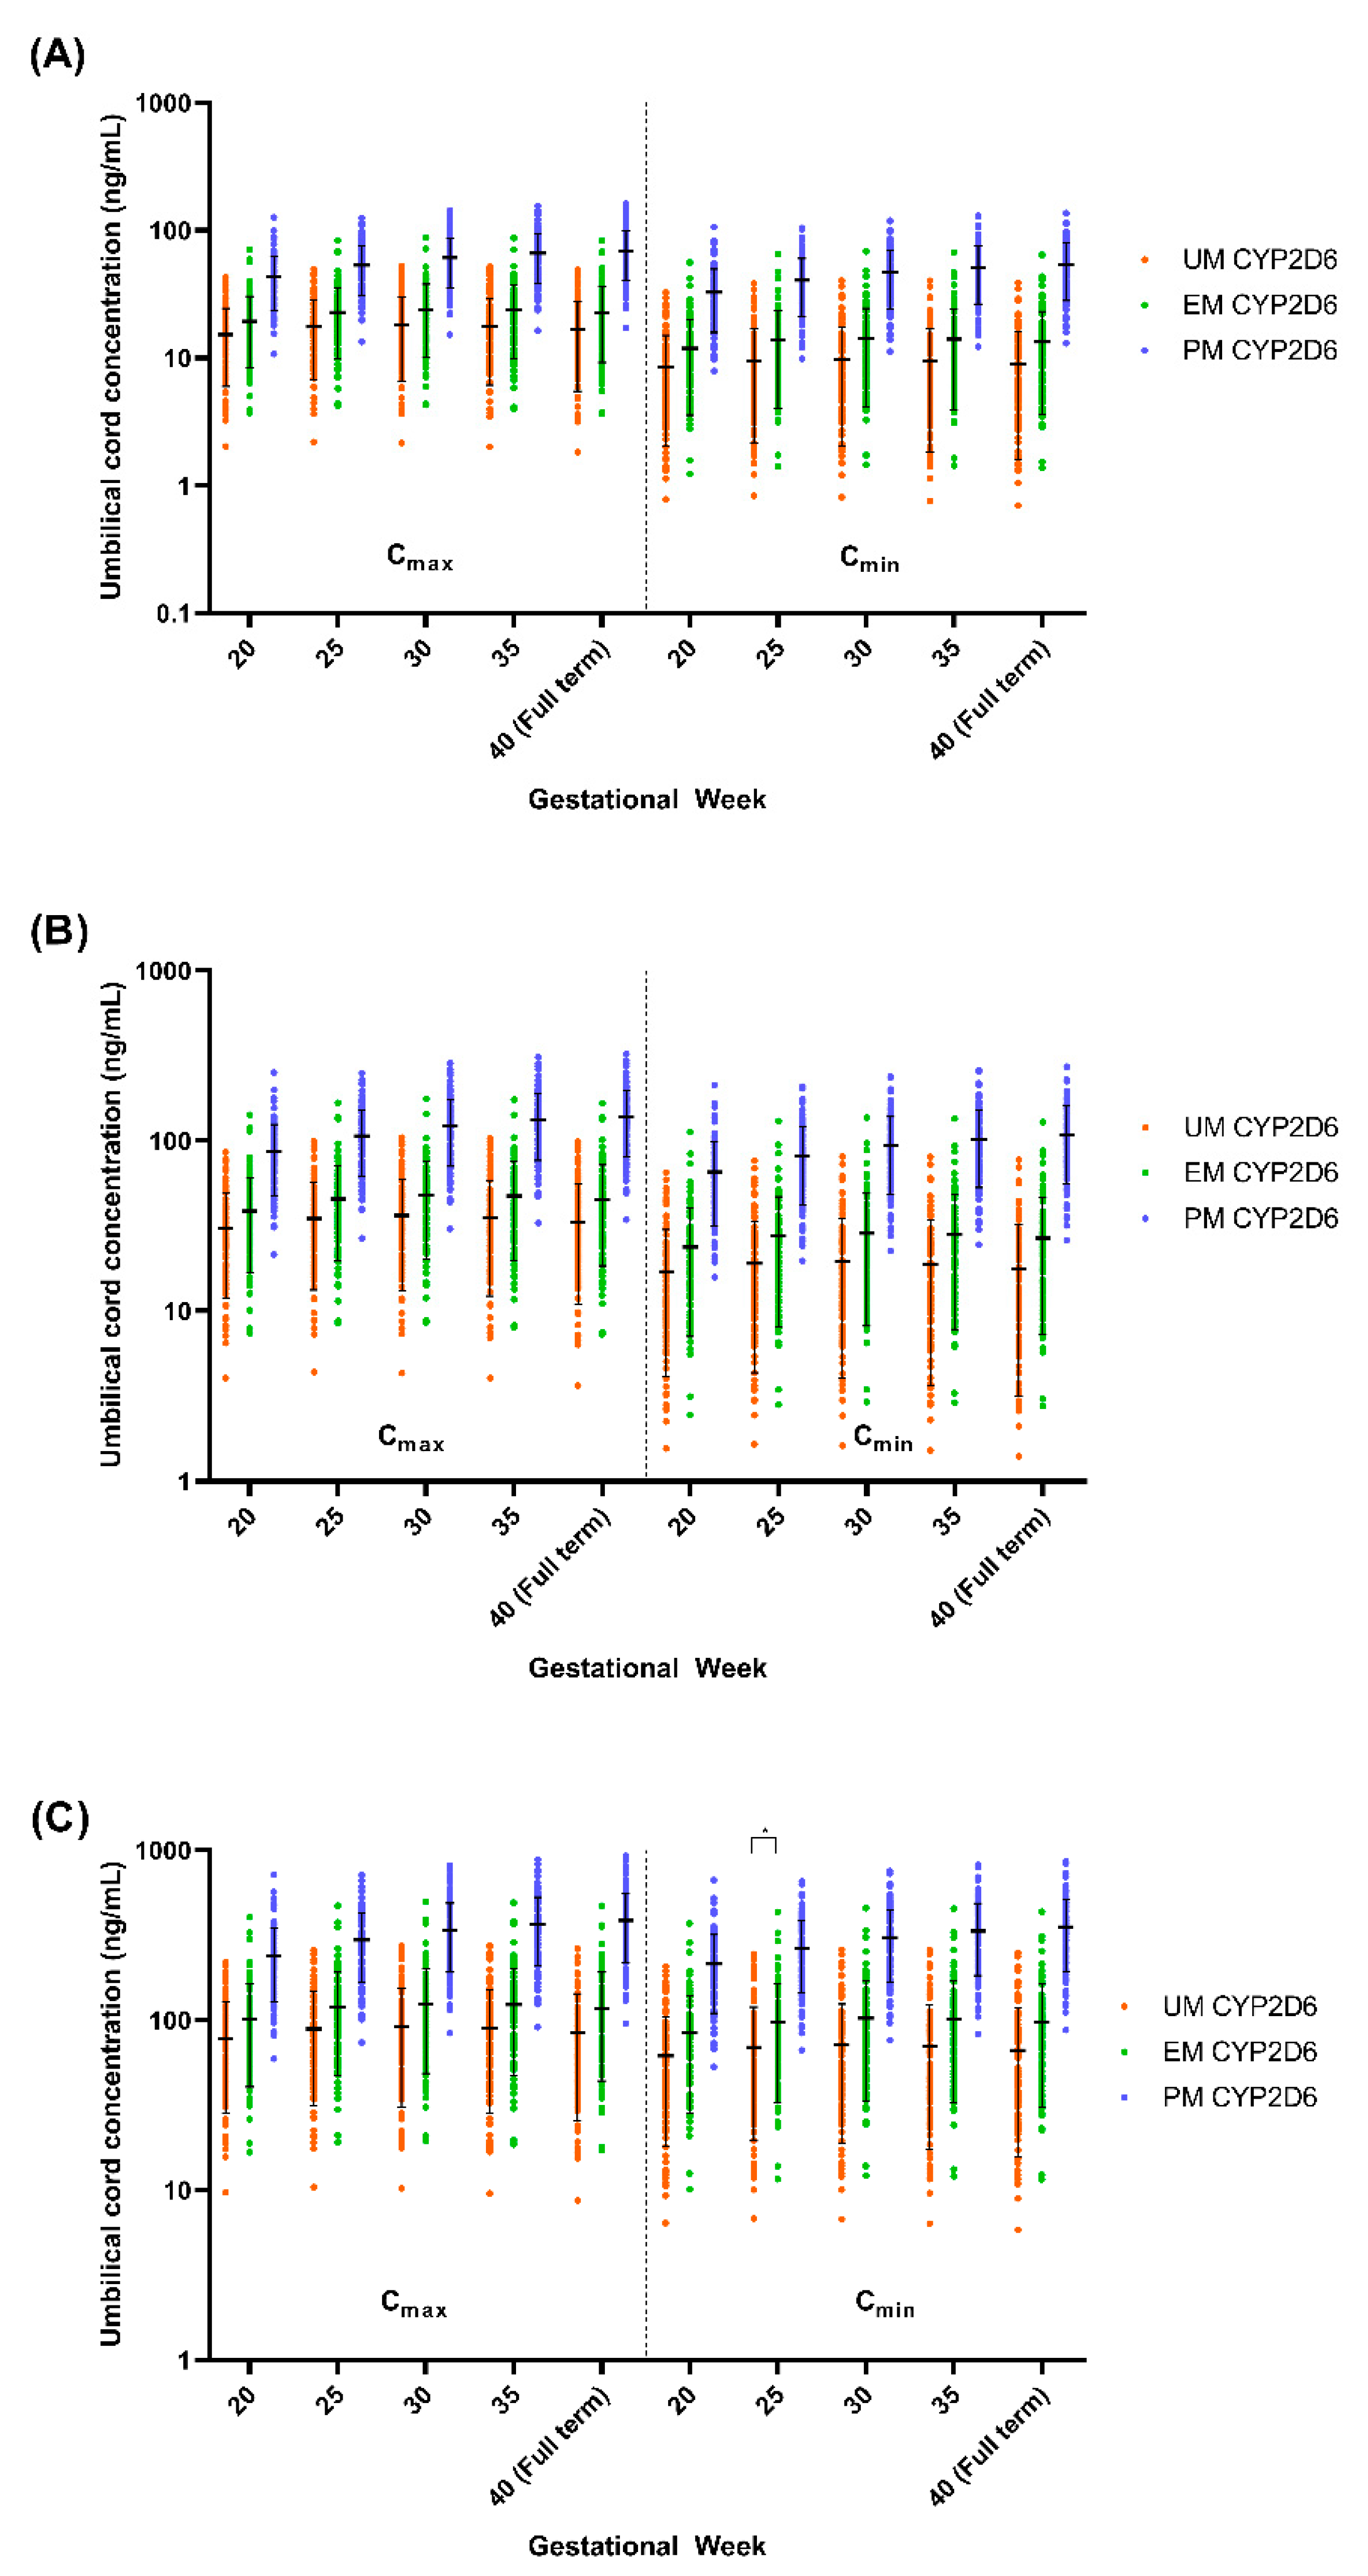
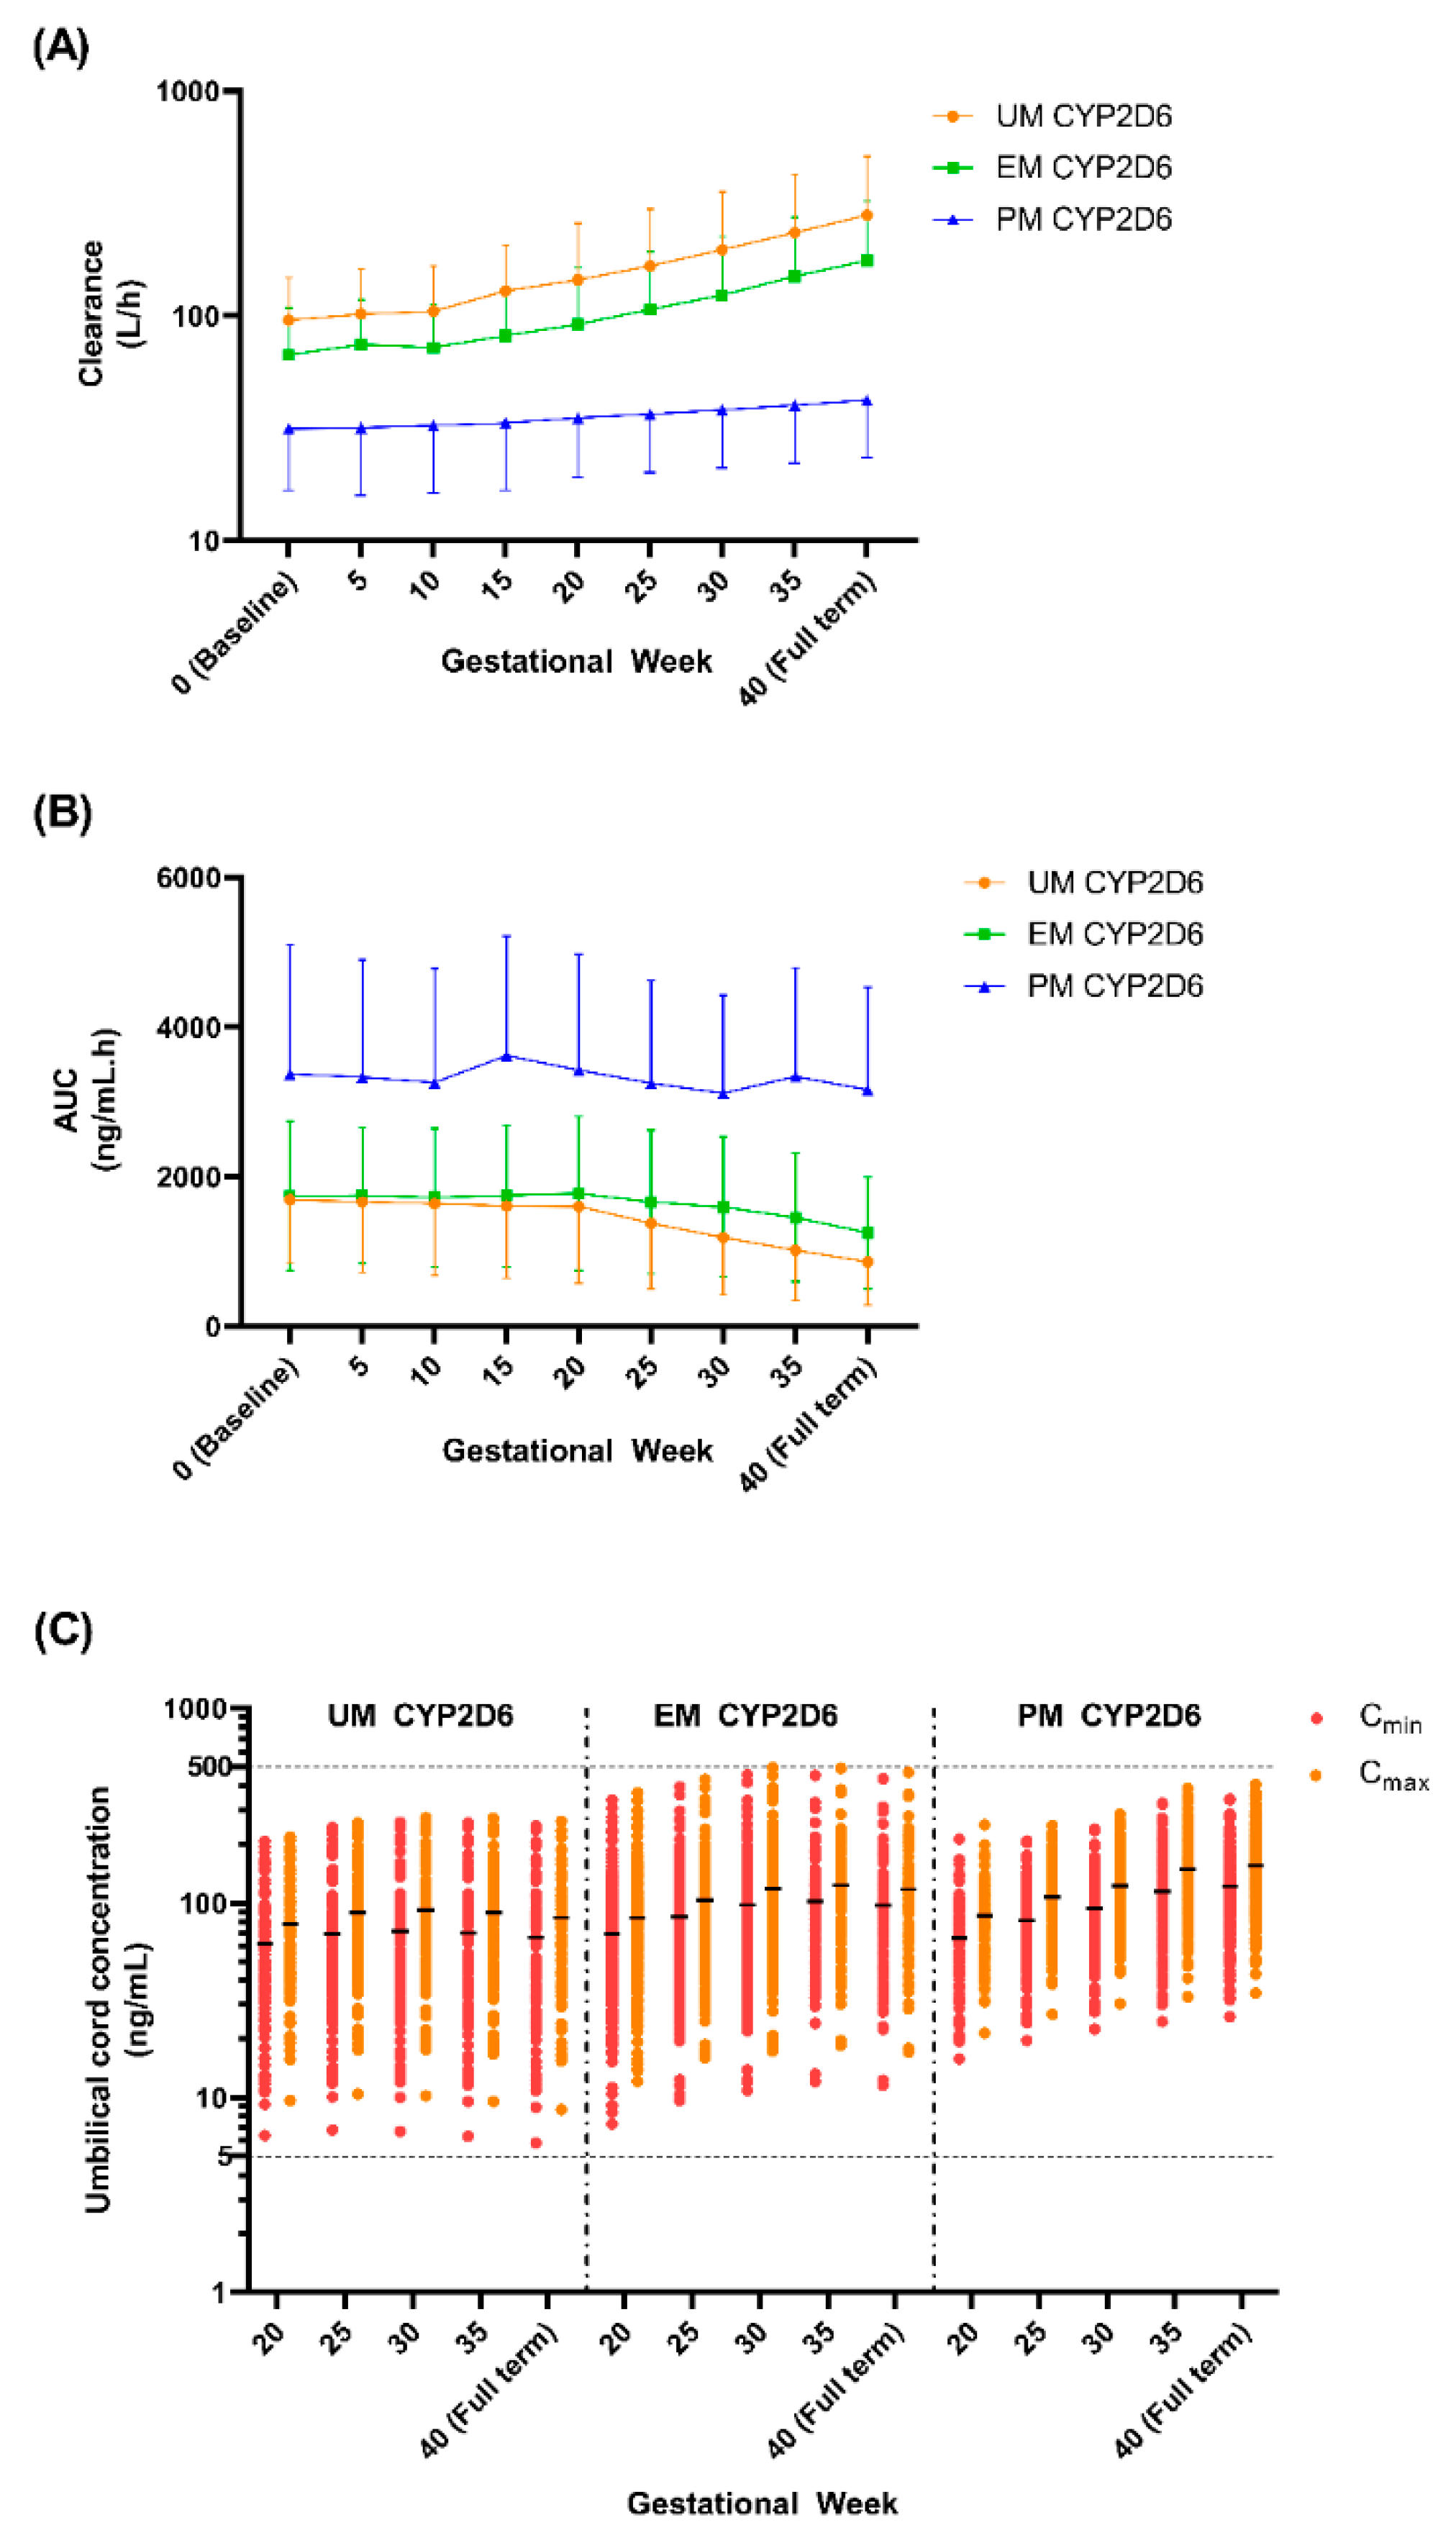
Table 1.
Fluvoxamine compound parameters determined through a full PBPK model.
| Parameters | Fluvoxamine | Notes |
|---|---|---|
| Compound type | Monoprotic Base | |
| Molecular weight (g/mol) | 318.3 | |
| Log P | 3 | |
| pKa 1 | 8.7 | |
| fu | 0.14 | |
| B/P | 0.826 | Predicted in Simcyp® based on Log P, plasma pH, haematocrit, and fu [36,37] |
| Vss (L/kg) | 35.48 | Full PBPK model with Kp scalar of 13 |
| Kp | 13 | Estimated using Simcyp® parameter estimation function |
| ka (h−1) | 0.15 | Optimised through sensitivity analysis [14] |
| fa | 0.8 | Optimised through sensitivity analysis [14] |
| Lag time (h) | 0 | |
| Absorption Model | First Order | |
| Distribution Model | Full PBPK | |
| CLPDM and CLPDF | 0.253 | Predicted from HBD and PSA information using [38] |
Log P, partition coefficient; B/P, blood-to-plasma ratio; fu, unbound fraction; Vss, steady-state volume of distribution; Kp, tissue partition coefficient; ka, absorption rate constant; fa, extent of absorption; CLPDM, maternal–placental permeability clearance; CLPDF, placental–foetal permeability clearance; HBD, hydrogen bond donor; PSA, polar surface area.
Table 2.
Published data used in fluvoxamine model development and validation.
| Study | Study Design | Number of Subjects | Age 1 (Years) | Dosing Regimen |
|---|---|---|---|---|
| Studies used for Model Development | ||||
| De Vries et al. [39] | Crossover with 7 days washout between each dose | 12 healthy males | 22–41 | 25 mg/50 mg/100 mg single-dose under fasted conditions |
| Van Harten et al. [40] | Crossover with 7 days washout between each period | 8 healthy males and 4 healthy females | 18–30 | 50 mg single-dose under fed and fasted conditions |
| Bahrami and Mohammadi [41] | Crossover bioequivalence study with 3 weeks washout period | 24 healthy males | 27.2 ± 3.1 | 100 mg single-dose |
| de Vries et al. [42] | Multiple-dose | 3 healthy males and 3 healthy females | 25–31 | 50 mg on day 1, followed by 50 mg twice daily from day 4 to day 31 |
| Fleishaker and Hulst [43] | Multiple-dose | 10 healthy males and 10 healthy females | 20–44 | 50 mg daily for 3 days, followed by 100 mg daily for 7 days |
| Studies used for Model Validation | ||||
| Orlando et al. [44] | Single-dose | 10 healthy males | 35 ± 7 | 50 mg single-dose under fasted condition |
| Debree at al. [45] | Single-dose | 9 healthy males and 1 healthy female | 20–25 | 100 mg single-dose under fasted condition |
| USFDA [46] | Single-dose Study code: S1141107 | 15 healthy males and 13 healthy females | 20.3–44.7 | 100 mg single-dose under fasted condition |
| Spigset et al. [47] | Multiple-dose | 10 healthy males | 28.9 ± 5.2 | 12.5 mg twice daily for 1st week, followed by 25 mg twice daily for 2nd week, 50 mg twice daily for 3rd week, and 100 mg twice daily for 4th week |
| USFDA [46] | Multiple-dose Study code: 1098001 | 12 healthy males with EM CYP2D6 | 19–43 | 100 mg daily for 10 days under fasting conditions |
| USFDA [46] | Multiple-dose Study code: 1098002 | 12 healthy males with EM CYP2D6 | 21–44 | 100 mg daily for 10 days under fasting conditions |
| Studies used for validation with CYP2D6 EM and PM population | ||||
| Carrillo et al. [48] | Single-dose | EM: 3 healthy males and 2 healthy females; PM: 2 healthy males and 1 healthy female | EM: 26–40 PM: 31–49 | 50 mg single-dose under fasting conditions |
| Spigset et al. [49] | Single-dose | EM: 7 healthy males and 3 healthy females; PM: 5 healthy males | EM: 28.7 ± 8.1 PM: 24.0 ± 1.6 | 50 mg single-dose under fasting conditions |
| Hartter et al. [50] | Single-dose | EM: 4 healthy males; PM: 1 healthy male | 34–55 | 50 mg single-dose |
| Christensen et al. [51] | Single-dose and Multiple-dose | EM: 7 healthy subjects; PM: 5 healthy subjects | 22–45 | Period 1: EM—50 mg single-dose PM—25 mg single-dose Period 2: EM—25 mg twice daily for 7 days PM—25 mg daily for 7 days Period 3: EM—10 mg twice daily for 7 days PM—10 mg daily for 7 days |
1 Age represented by range or mean ± SD.
Table 3.
Pharmacokinetics of single- and multiple-dose studies (predicted and observed).
| References | Dosing | PK Parameters | Observed | Predicted | Predicted/ Observed |
|---|---|---|---|---|---|
| Model Development | |||||
| Geometric Mean (Range) | |||||
| De Vries et al. [39] | Single dose 25 mg | Cmax (ng/mL) | 8.80 (4.70–13.00) | 7.77 (3.19–20.49) | 0.88 |
| AUCinf (ng/mL·h) | 209.00 (117.00–425.00) | 230.67 (97.76–571.74) | 1.10 | ||
| Tmax (h) 1 | 5.00 (1.00–8.00) | 5.66 (3.40–13.35) | 1.13 | ||
| Single dose 50 mg | Cmax (ng/mL) | 17.00 (8.40–28.00) | 16.00 (6.39–40.97) | 0.94 | |
| AUCinf (ng/mL·h) | 448.00 (166.00–1115.00) | 719.24 (254.16–3113.83) | 1.61 | ||
| Tmax (h) 1 | 4.80 (2.00–8.00) | 5.67 (3.40–13.40) | 1.03 | ||
| Single dose 100 mg | Cmax (ng/mL) | 36.00 (21.00–60.00) | 32.01 (12.78–81.95) | 0.89 | |
| AUCinf (ng/mL·h) | 927.00 (325.00–2146.00) | 1693.24 (585.86–10825.67) | 1.83 | ||
| Tmax (h) 1 | 4.50 (3.00–6.00) | 5.68 (3.40–13.35) | 1.04 | ||
| Van Harten et al. [40] | Single dose 50 mg—Fast | Cmax (ng/mL) | 15.40 (7.50–27.00) | 16.00 (6.39–40.97) | 1.04 |
| AUC0–32 h (ng/mL·h) | 237.00 (102.00–571.00) | 324.19 (139.89–710.72) | 1.37 | ||
| Tmax (h) 1 | 6.00 (3.00–12.00) | 5.67 (3.40–13.35) | 0.95 | ||
| Single dose 50 mg—Fed | Cmax (ng/mL) | 15.50 (10.00–32.00) | 16.00 (6.39–40.97) | 1.03 | |
| AUC0–32 h (ng/mL·h) | 223.00 (65.00–587.00) | 324.19 (139.89–710.72) | 1.45 | ||
| Tmax (h) 1 | 7.00 (2.00–12.00) | 5.67 (3.40–13.35) | 0.81 | ||
| de Vries et al. [42] | Single dose 50 mg—Day 1 | Cmax (ng/mL) | 30.00 (13.10) | 17.82 (9.63) | 0.59 |
| AUCinf (ng/mL·h) | 652.00 (319.00) | 882.08 (717.30) | 1.35 | ||
| Tmax (h)1 | 6.00 (4.00–8.00) | 5.63 (3.25–14.50) | 0.94 | ||
| Multiple doses of 50 mg twice daily from Day 4 to Day 31 | Cmax (ng/mL) | 93.00 (96.16) | 81.55 (60.34) | 0.88 | |
| AUC0–12 h (ng/mL·h) | 873.00 (782.44) | 920.77 (707.31) | 1.05 | ||
| Tmax (h) 1 | 5.00 (1.00–10.00) | 3.48 (2.65–4.20) | 0.70 | ||
| Arithmetic Mean (SD) | |||||
| Fleishaker and Hulst [43] | Single dose 50 mg—Day 1 | Cmax (ng/mL) | 21.50 (4.89) | 16.77 (6.70) | 0.78 |
| AUC0–24 h (ng/mL·h) | 328.00 (84.60) | 283.65 (107.45) | 0.86 | ||
| Tmax (h) | 5.70 (1.49) | 5.67 (1.45) | 0.99 | ||
| Multiple doses of 50 mg daily for 3 days followed by 100 mg daily for the 7 days | Cmax (ng/mL) | 99.30 (35.00) | 80.32 (36.45) | 0.81 | |
| AUC0–24 h (ng/mL·h) | 1762.00 (737.00) | 1614.20 (786.04) | 0.92 | ||
| Tmax (h) | 7.95 (4.91) | 4.75 (0.78) | 0.60 | ||
| Bahrami and Mohammadi [41] | Single dose 100 mg—Test | Cmax (ng/mL) | 46.20 (29.00) | 34.65 (13.94) | 0.75 |
| AUC0–48 h (ng/mL·h) | 866.20 (480.00) | 872.88 (351.91) | 1.01 | ||
| AUCinf (ng/mL·h) | 1308.00 (781.00) | 1641.58 (902.86) | 1.26 | ||
| Tmax (h) | 5.30 (2.00) | 5.68 (1.45) | 1.07 | ||
| Single dose 100 mg—Reference | Cmax (ng/mL) | 48.50 (28.00) | 34.65 (13.94) | 0.71 | |
| AUC0–48 h (ng/mL·h) | 802.20 (360.00) | 872.88 (351.91) | 1.09 | ||
| AUCinf (ng/mL·h) | 1224.90 (430.00) | 1641.58 (902.86) | 1.34 | ||
| Tmax (h) | 5.60 (2.10) | 5.68 (1.45) | 1.01 | ||
| Model Validation | |||||
| Arithmetic Mean (SD) | |||||
| Orlando et al. [44] | Single dose 50 mg | Cmax (ng/mL) | 15.00 (3.00) | 17.32 (6.97) | 1.15 |
| AUCinf (ng/mL·h) | 304.00 (84.00) | 820.98 (452.53) | 2.70 | ||
| Tmax (h) 2 | 5.00 (4.00–8.00) | 5.47 (3.40–13.40) | 1.08 | ||
| Geometric Mean (SD) | |||||
| Debree et al. [45] | Single dose 100 mg | Cmax (ng/mL) | 49.30 (17.00) | 32.01 (13.94) | 0.65 |
| AUC0–24 h (ng/mL·h) | 523.90 (122.90) | 545.44 (228.11) | 1.04 | ||
| AUCinf (ng/mL·h) | 817.00 (194.30) | 958.18 (472.25) | 1.17 | ||
| Tmax (h) 1 | 5.00 (2.00–8.00) | 5.68 (3.40–13.40) | 1.14 | ||
| Arithmetic Mean (SD) | |||||
| USFDA [46] | Single dose 100 mg | Cmax (ng/mL) | 41.88 (18.99) | 34.65 (13.94) | 0.83 |
| AUCinf (ng/mL·h) | 959.33 (520.71) | 2071.01 (1435.11) | 2.16 | ||
| Tmax (h) 1 | 6.00 (4.00–16.00) | 5.68 (3.40–13.35) | 0.95 | ||
| Spigset et al. [47] | Week 1—12.5 mg twice daily for 7 days | Cmax (nmol/L) | 25.10 (9.40) | 57.96 (29.62) | 2.31 |
| AUC12 h (nmol.hr/L) | 236.00 (95.00) | 652.00 (339.68) | 2.76 | ||
| Week 1—25 mg twice daily for 7 days | Cmax (nmol/L) | 76.30 (22.10) | 107.53 (60.63) | 1.41 | |
| AUC12 h (nmol.hr/L) | 745.00 (258.00) | 1457.38 (795.37) | 1.96 | ||
| Week 1—50 mg twice daily for 7 days | Cmax (nmol/L) | 244.00 (97.90) | 261.50 (141.94) | 1.07 | |
| AUC12 h (nmol/L·hr) | 2391.00 (949.00) | 2960.86 (1643.50) | 1.24 | ||
| Week 1—100 mg twice daily for 7 days | Cmax (nmol/L) | 738.00 (314.00) | 439.88 (254.36) | 0.60 | |
| AUC12 h (nmol·hr/L) | 7545.00 (3239.00) | 5943.80 (3317.30) | 0.79 | ||
| USFDA [46] | Multiple doses of 100 mg daily for 10 days (Prot. C) | Cmax (ng/mL) | 107.00 (73.52) | 79.41 (31.39) | 0.74 |
| AUC0–24 h (ng/mL·h) | 1738.55 (1392.42) | 1587.74 (669.76) | 0.91 | ||
| Multiple doses of 100 mg daily for 10 days (Prot. D) | Cmax (ng/mL) | 129.59 (62.86) | 85.97 (42.84) | 0.66 | |
| AUC0–24 h (ng/mL·h) | 2109.30 (1085.63) | 1677.97 (905.71) | 0.80 | ||
| Model validation for EM and PM CYP2D6 Phenotype population | |||||
| Carrillo et al. [48] | Single dose 50 mg -EM CYP2D6 | Cmax (nmol/L) | 85.90 (42.50) | 61.03 (28.98) | 0.71 |
| AUC0–32 h (nmol/L·h) 3 | 1097.90 (180.35) | 1220.62 (55.36) | 1.11 | ||
| AUCinf (nmol/L·h) | 1352.00 (733.00) | 2065.41 (1033.85) | 1.53 | ||
| Tmax (h) | 4.4 (2.1) | 5.57 (1.52) | 1.27 | ||
| Single dose 50 mg -PM CYP2D6 | Cmax (nmol/L) | 178.10 (27.50) | 78.81 (33.53) | 0.44 | |
| AUC0–72 h (nmol/L·h) 3 | 4648.59 (237.46) | 2889.62 (118.60) | 0.62 | ||
| AUCinf (nmol/L·h) | 5290.00 (332.00) | 6287.38 (2990.77) | 1.19 | ||
| Tmax (h) | 4.60 (2.30) | 7.01 (1.82) | 1.52 | ||
| Spigset et al. [49] | Single dose 50 mg -EM CYP2D6 | Cmax (nmol/L) | 44.50 (12.30) | 61.03 (28.98) | 1.37 |
| AUC0–48 h (nmol/L·h) 3 | 870.00 (110.00) | 1530.00 (70.00) | 1.76 | ||
| AUCinf (nmol/L·h) | 1000.00 (410.00) | 2610.00 (1280.00) | 2.61 | ||
| Tmax (h) | 7.80 (2.40) | 5.57 (1.52) | 0.71 | ||
| Single dose 50 mg -PM CYP2D6 | Cmax (nmol/L) | 50.40 (17.80) | 78.81 (33.53) | 1.56 | |
| AUC0–48 h (nmol/L·h) 3 | 1090.00 (160.00) | 2280.00 (90.00) | 2.09 | ||
| AUCinf (nmol/L·h) | 1310.00 (670.00) | 4950.00 (2220.00) | 3.78 | ||
| Tmax (h) | 6.60 (2.10) | 7.01 (1.82) | 1.06 | ||
| Hartter et al. [50] | Single dose 50 mg -EM CYP2D6 | Cmax (ng/mL) | 13.00 (3.7) | 19.43 (9.22) | 1.49 |
| AUC0–28 h (mcg/L·h) | 185.50 (33.60) | 360.58 (163.21) | 1.94 | ||
| Single dose 50 mg -PM CYP2D6 4 | Cmax (ng/mL) | 48.00 | 25.09 (10.67) | 0.52 | |
| AUC0–28 h (mcg/L·h) | 612.00 | 512.06 (206.59) | 0.84 | ||
| Chtistensen et al. [51] | Single dose 50 mg -EM CYP2D6 | Cmax (nmol/L) | 58.14 (37.90) | 61.03 (28.98) | 1.05 |
| Single dose 25 mg -PM CYP2D6 | Cmax (nmol/L) | 23.20 (2.28) | 39.41 (16.76) | 1.70 | |
AUCinf, area-under-the-curve to infinity; AUC0-t, area-under-the-curve to the last time point; AUCt, area-under-the-curve for the total hour at steady-state; Cmax, maximum plasma concentration; Tmax, time to reach maximum plasma concentration. 1—Arithmetic mean (range); 2—median; 3—the AUC0-t was calculated from the published graph; 4—only 1 subject, so no standard deviation was reported.
Table 4.
Predicted fluvoxamine plasma-concentration across the maternity period.
| Pharmacokinetic Metric | Gestational Week (GW) | ||||||||
|---|---|---|---|---|---|---|---|---|---|
| 0 (Baseline) | 5 | 10 | 15 | 20 | 25 | 30 | 35 | 40 (Full Term) | |
| Steady-state Cmin (ng/mL) | 75.23 (52.73) | 76.34 (56.97) | 71.37 (55.5) | 65.72 (53.73) | 59.84 (51.76) | 54.04 (49.62) | 48.52 (47.31) | 43.32 (44.8) | 38.4 (42.05) |
| % change from baseline | 0 | 1.48 | −5.13 | −12.64 | −20.46 | −28.17 | −35.50 | −42.42 | −48.96 |
| p-value 1 | 0.9998 | 0.9966 | 0.6707 | 0.1718 | 0.0215 | 0.0016 | <0.0001 | <0.0001 | |
| % Cmin < 60 ng/mL 2 (%) | 46 | 48 | 54 | 58 | 66 | 68 | 74 | 80 | 85 |
| Steady-state Cmax (ng/mL) | 112.5 (64.17) | 113.1 (67.3) | 106.1 (65.56) | 97.87 (63.45) | 89.09 (61.06) | 80.29 (58.43) | 71.85 (55.61) | 64.03 (52.63) | 56.96 (49.53) |
| % change from baseline | 0 | 0.53 | −5.69 | −13.00 | −20.81 | −28.63 | −36.13 | −43.08 | −49.37 |
| p-value 1 | >0.9999 | 0.9739 | 0.3875 | 0.0385 | 0.0012 | <0.0001 | <0.0001 | <0.0001 | |
| % Cmax < 60 ng/mL 2 (%) | 17 | 20 | 23 | 29 | 38 | 45 | 56 | 60 | 67 |
Cmin, trough plasma-concentration; Cmax, maximum plasma-concentration; 1 p-value: statistical significance test between each GW with baseline; 2 Efficacy threshold (60–230 ng/mL) as recommended in Consensus Guidelines for Therapeutic Drug Monitoring in Neuropsychopharmacology: Update 2017 [5]; Mean (SD).
Table 5.
Summary of predicted fluvoxamine plasma concentrations during gestation.
| Gestational Week (GW) | |||||||||||
|---|---|---|---|---|---|---|---|---|---|---|---|
| Daily Dose | Phenotype | Pharmacokinetic Metric | 0 (Baseline) | 5 | 10 | 15 | 20↓ | 25 | 30 | 35 | 40 (Full Term) |
| 50 mg | UM CYP2D6 | Steady-state Cmin (ng/mL) | 20.34 (11.28) | 20.19 (13.18) | 18.19 (12.16) | 16.04 (10.99) | 15.90 (11.52) | 13.43 (9.68) | 11.40 (8.40) | 9.61 (7.21) | 8.05 (6.15) |
| % change from baseline | −0.72 | −10.55 | −21.13 | −21.82 | −33.94 | −43.93 | −52.75 | −60.40 | |||
| p-value 1 | 0.9999 | 0.5661 | 0.0229 | 0.0171 | <0.0001 | <0.0001 | <0.0001 | <0.0001 | |||
| % Cmin < 60 ng/mL 2 | 100 | 98 | 98 | 99 | 100 | 100 | 100 | 100 | 100 | ||
| Steady-state Cmax (ng/mL) | 35.82 (16.28) | 35.09 (17.59) | 31.98 (16.38) | 28.49 (14.99) | 28.57 (16.75) | 24.98 (14.64) | 21.80 (13.08) | 18.86 (11.57) | 16.20 (10.16) | ||
| % change from baseline | −2.04 | −10.72 | −20.47 | −20.24 | −30.27 | −39.15 | −47.34 | −54.77 | |||
| p-value 1 | 0.9995 | 0.3221 | 0.0037 | 0.0043 | <0.0001 | <0.0001 | <0.0001 | <0.0001 | |||
| % Cmax > 230 ng/mL2 | 0 | 0 | 0 | 0 | 0 | 0 | 0 | 0 | 0 | ||
| EM CYP2D6 | Steady-state Cmin (ng/mL) | 30.14 (19.33) | 28.07 (16.06) | 25.80 (15.07) | 23.27 (13.90) | 22.36 (14.29) | 19.69 (12.66) | 17.00 (11.05) | 14.54 (9.56) | 12.36 (8.20) | |
| % change from baseline | −6.87 | −14.40 | −22.80 | −25.82 | −34.67 | −43.61 | −51.75 | −59.01 | |||
| p-value 1 | 0.8536 | 0.1452 | 0.0033 | 0.0006 | <0.0001 | <0.0001 | <0.0001 | <0.0001 | |||
| % Cmin < 60 ng/mL 2 | 93 | 95 | 98 | 98 | 97 | 98 | 99 | 100 | 100 | ||
| Steady-state Cmax (ng/mL) | 46.99 (23.79) | 44.73 (20.46) | 41.44 (19.29) | 37.65 (17.91) | 36.64 (18.90) | 32.91 (17.07) | 29.11 (15.27) | 25.53 (13.55) | 22.20 (11.94) | ||
| % change from baseline | −4.81 | −11.80 | −19.89 | −22.02 | −29.96 | −38.04 | −45.68 | −52.76 | |||
| p-value 1 | 0.9358 | 0.1602 | 0.0019 | 0.0004 | <0.0001 | <0.0001 | <0.0001 | <0.0001 | |||
| % Cmax > 230 ng/mL 2 | 0 | 0 | 0 | 0 | 0 | 0 | 0 | 0 | 0 | ||
| PM CYP2D6 | Steady-state Cmin (ng/mL) | 68.51 (36.54) | 67.54 (32.65) | 66.21 (31.92) | 64.58 (30.97) | 60.80 (29.70) | 57.69 (26.25) | 55.29 (25.09) | 52.68 (23.83) | 49.88 (22.49) | |
| % change from baseline | −1.43 | −3.37 | −5.75 | −11.26 | −15.80 | −19.30 | −23.10 | −27.19 | |||
| p-value 1 | 0.9997 | 0.9944 | 0.9102 | 0.302 | 0.0564 | 0.0102 | 0.0011 | <0.0001 | |||
| % Cmin < 60 ng/mL 2 | 44 | 45 | 48 | 50 | 58 | 60 | 65 | 65 | 69 | ||
| Steady-state Cmax (ng/mL) | 90.43 (40.94) | 89.40 (37.15) | 87.17 (36.23) | 84.38 (35.04) | 80.17 (34.19) | 76.21 (30.35) | 73.03 (29.04) | 69.54 (27.62) | 65.77 (26.08) | ||
| % change from baseline | −1.14 | −3.60 | −6.68 | −11.34 | −15.72 | −19.24 | −23.10 | −27.27 | |||
| p-value 1 | 0.9997 | 0.9848 | 0.7071 | 0.164 | 0.0184 | 0.0018 | <0.0001 | <0.0001 | |||
| % Cmax > 230 ng/mL2 | 2 | 1 | 1 | 1 | 1 | 0 | 0 | 0 | 0 | ||
| 100 mg | UM CYP2D6 | Steady-state Cmin (ng/mL) | 40.70 (22.58) | 40.41 (26.40) | 36.41 (24.34) | 32.11 (22.01) | 31.82 (23.08) | 26.89 (19.39) | 22.82 (16.82) | 19.23 (14.45) | 16.11 (12.31) |
| % change from baseline | −0.72 | −10.55 | −21.13 | −21.82 | −33.94 | −43.93 | −52.75 | −60.41 | |||
| p-value 1 | 0.9999 | 0.5666 | 0.023 | 0.0172 | <0.0001 | <0.0001 | <0.0001 | <0.0001 | |||
| % Cmin < 60 ng/mL 2 | 78 | 78 | 84 | 92 | 90 | 94 | 94 | 97 | 99 | ||
| Steady-state Cmax (ng/mL) | 71.70 (32.59) | 70.23 (35.22) | 64.01 (32.80) | 57.02 (30.01) | 57.18 (33.54) | 49.99 (29.32) | 43.63 (26.19) | 37.75 (23.18) | 32.42 (20.34) | ||
| % change from baseline | −2.04 | −10.72 | −20.46 | −20.24 | −30.27 | −39.15 | −47.34 | −54.77 | |||
| p-value 1 | 0.9995 | 0.3225 | 0.0038 | 0.0043 | <0.0001 | <0.0001 | <0.0001 | <0.0001 | |||
| % Cmax > 230 ng/mL 2 | 0 | 0 | 0 | 0 | 0 | 0 | 0 | 0 | 0 | ||
| EM CYP2D6 | Steady-state Cmin (ng/mL) | 60.33 (38.70) | 56.19 (32.17) | 51.64 (30.17) | 46.57 (27.84) | 44.76 (28.65) | 39.42 (25.37) | 34.03 (22.14) | 29.11 (19.15) | 24.73 (16.43) | |
| % change from baseline | −6.87 | −14.40 | −22.81 | −25.82 | −34.66 | −43.60 | −51.75 | −59.01 | |||
| p-value 1 | 0.8538 | 0.1455 | 0.0033 | 0.0006 | <0.0001 | <0.0001 | <0.0001 | <0.0001 | |||
| % Cmin < 60 ng/mL 2 | 60 | 62 | 72 | 78 | 78 | 83 | 89 | 96 | 97 | ||
| Steady-state Cmax (ng/mL) | 94.04 (47.64) | 89.52 (40.96) | 82.95 (38.62) | 75.34 (35.85) | 73.35 (37.87) | 65.87 (34.20) | 58.27 (30.60) | 51.09 (27.15) | 44.43 (23.91) | ||
| % change from baseline | −4.81 | −11.80 | −19.89 | −22.01 | −29.96 | −38.04 | −45.67 | −52.75 | |||
| p-value 1 | 0.9359 | 0.1607 | 0.0019 | 0.0004 | <0.0001 | <0.0001 | <0.0001 | <0.0001 | |||
| % Cmax > 230 ng/mL 2 | 2 | 1 | 1 | 1 | 1 | 0 | 0 | 0 | 0 | ||
| PM CYP2D6 | Steady-state Cmin (ng/mL) | 137.03 (73.09) | 135.07 (65.31) | 132.41 (63.84) | 129.15 (61.95) | 121.60 (59.40) | 115.38 (52.50) | 110.58 (50.17) | 105.37 (47.66) | 99.77 (44.98) | |
| % change from baseline | −1.43 | −3.37 | −5.75 | −11.26 | −15.80 | −19.30 | −23.10 | −27.19 | |||
| p-value 1 | 0.9997 | 0.9944 | 0.9103 | 0.302 | 0.0565 | 0.0102 | 0.0011 | <0.0001 | |||
| % Cmin < 60 ng/mL 2 | 7 | 7 | 7 | 7 | 11 | 11 | 13 | 17 | 19 | ||
| Steady-state Cmax (ng/mL) | 180.86 (81.88) | 178.80 (74.3) | 174.34 (72.45) | 168.77 (70.08) | 160.34 (68.38) | 152.43 (60.71) | 146.05 (58.08) | 139.08 (55.23) | 131.54 (52.17) | ||
| % change from baseline | −1.14 | −3.60 | −6.69 | −11.34 | −15.72 | −19.24 | −23.10 | −27.27 | |||
| p-value 1 | 0.9997 | 0.9848 | 0.707 | 0.1641 | 0.0184 | 0.0018 | <0.0001 | <0.0001 | |||
| % Cmax > 230 ng/mL 2 | 22 | 18 | 15 | 13 | 16 | 7 | 4 | 4 | 4 | ||
| 300 mg | UM CYP2D6 | Steady-state Cmin (ng/mL) | 146.24 (76.37) | 144.43 (87.69) | 130.69 (81.21) | 115.76 (73.81) | 114.73 (77.53) | 97.84 (65.77) | 83.65 (57.51) | 70.98 (49.80) | 59.88 (42.77) |
| % change from baseline | −1.24 | −10.63 | −20.84 | −21.55 | −33.09 | −42.80 | −51.46 | −59.06 | |||
| p-value 1 | 0.9997 | 0.4863 | 0.0144 | 0.0103 | <0.0001 | <0.0001 | <0.0001 | <0.0001 | |||
| % Cmin < 60 ng/mL 2 | 9 | 13 | 15 | 21 | 28 | 32 | 38 | 51 | 65 | ||
| Steady-state Cmax (ng/mL) | 184.13 (87.29) | 180.98 (97.07) | 164.56 (90.20) | 146.38 (82.30) | 146.20 (89.44) | 126.68 (77.14) | 109.74 (68.24) | 94.32 (59.82) | 80.52 (52.01) | ||
| % change from baseline | −1.72 | −10.63 | −20.50 | −20.60 | −31.20 | −40.40 | −48.78 | −56.27 | |||
| p-value 1 | 0.9996 | 0.378 | 0.0062 | 0.0058 | <0.0001 | <0.0001 | <0.0001 | <0.0001 | |||
| % Cmax > 230 ng/mL 2 | 28 | 31 | 22 | 13 | 15 | 10 | 6 | 6 | 2 | ||
| EM CYP2D6 | Steady-state Cmin (ng/mL) | 209.09 (124.25) | 196.46 (103.95) | 181.21 (97.8) | 164.03 (90.56) | 157.89 (95.00) | 139.86 (84.78) | 121.61 (74.65) | 104.83 (65.14) | 89.70 (56.41) | |
| % change from baseline | −6.04 | −13.33 | −21.55 | −24.48 | −33.11 | −41.84 | −49.86 | −57.10 | |||
| p-value 1 | 0.8938 | 0.1619 | 0.0034 | 0.0006 | <0.0001 | <0.0001 | <0.0001 | <0.0001 | |||
| % Cmin < 60 ng/mL 2 | 5 | 3 | 4 | 5 | 11 | 13 | 20 | 25 | 38 | ||
| Steady-state Cmax (ng/mL) | 249.43 (134.54) | 236.20 (114.15) | 218.50 (107.52) | 198.28 (99.70) | 192.26 (105.20) | 171.75 (94.46) | 150.93 (83.85) | 131.50 (73.82) | 113.68 (64.51) | ||
| % change from baseline | −5.30 | −12.40 | −20.51 | −22.92 | −31.14 | −39.49 | −47.28 | −54.42 | |||
| p-value 1 | 0.917 | 0.1583 | 0.0023 | 0.0005 | <0.0001 | <0.0001 | <0.0001 | <0.0001 | |||
| % Cmax > 230 ng/mL 2 | 50 | 47 | 37 | 27 | 25 | 21 | 16 | 9 | 3 | ||
| PM CYP2D6 | Steady-state Cmin (ng/mL) | 446.83 (223.35) | 441.25 (200.60) | 432.13 (196.01) | 420.84 (190.08) | 396.98 (182.97) | 377.01 (161.66) | 361.44 (154.58) | 344.51 (146.93) | 326.3 (138.77) | |
| % change from baseline | −1.25 | −3.29 | −5.82 | −11.16 | −15.63 | −19.11 | −22.90 | −26.97 | |||
| p-value 1 | 0.9997 | 0.9936 | 0.8757 | 0.2526 | 0.0398 | 0.006 | 0.0005 | <0.0001 | |||
| % Cmin < 60 ng/mL 2 | 0 | 0 | 0 | 0 | 0 | 0 | 0 | 0 | 0 | ||
| Steady-state Cmax (ng/mL) | 500.13 (236.64) | 494.14 (213.61) | 482.70 (208.5) | 468.46 (201.93) | 443.69 (195.69) | 421.55 (173.34) | 403.91 (165.78) | 384.70 (157.60) | 363.99 (148.84) | ||
| % change from baseline | −1.20 | −3.49 | −6.33 | −11.28 | −15.71 | −19.24 | −23.08 | −27.22 | |||
| p-value 1 | 0.9997 | 0.9902 | 0.7867 | 0.1985 | 0.0257 | 0.0031 | 0.0002 | <0.0001 | |||
| % Cmax > 230 ng/mL 2 | 94 | 93 | 93 | 93 | 90 | 89 | 87 | 86 | 81 | ||
Cmin, trough plasma concentration; Cmax, maximum plasma concentration; 1 p-value: statistical significance test between each GW with respect to baseline; 2 efficacy threshold (60–230 ng/mL) as recommended in Consensus Guidelines for Therapeutic Drug Monitoring in Neuropsychopharmacology: Update 2017 [5]; mean (SD); ↓, initiation of foetoplacental PBPK model.
Table 6.
Summary of simulated fluvoxamine umbilical cord concentrations during gestation.
| Gestational Week (GW) | |||||||
|---|---|---|---|---|---|---|---|
| Daily Dose | Phenotype | Pharmacokinetic Metric | 20 | 25 | 30 | 35 | 40 (Full Term) |
| 50 mg | UM CYP2D6 | Steady-state Cmin (ng/mL) | 8.60 (6.46) | 9.61 (7.34) | 9.84 (7.70) | 9.54 (7.63) | 8.98 (7.31) |
| % change from GW-20 | 11.69 | 14.40 | 10.96 | 4.43 | |||
| p-value * | 0.7359 | 0.5769 | 0.7761 | 0.9888 | |||
| Steady-state Cmax (ng/mL) | 15.36 (9.22) | 17.65 (10.80) | 18.35 (11.55) | 17.88 (11.56) | 16.8 (11.13) | ||
| % change from GW-20 | 14.91 | 19.48 | 16.42 | 9.39 | |||
| p-value * | 0.3882 | 0.1715 | 0.3036 | 0.7637 | |||
| EM CYP2D6 | Steady-state Cmin (ng/mL) | 11.90 (8.25) | 13.76 (9.60) | 14.28 (10.08) | 14.02 (9.99) | 13.34 (9.58) | |
| % change from GW-20 | 15.71 | 20.08 | 17.88 | 12.13 | |||
| p-value * | 0.4456 | 0.2287 | 0.3151 | 0.6341 | |||
| Steady-state Cmax (ng/mL) | 19.37 (10.81) | 22.79 (12.78) | 24 (13.63) | 23.71 (13.64) | 22.58 (13.16) | ||
| % change from GW-20 | 17.67 | 23.92 | 22.42 | 16.58 | |||
| p-value * | 0.1931 | 0.041 | 0.0594 | 0.2244 | |||
| PM CYP2D6 | Steady-state Cmin (ng/mL) | 33.00 (16.85) | 40.91 (19.52) | 47.10 (22.46) | 51.39 (24.44) | 54.31 (25.74) | |
| % change from GW-20 | 23.95 | 42.72 | 55.71 | 64.58 | |||
| p-value * | 0.0424 | <0.0001 | <0.0001 | <0.0001 | |||
| Steady-state Cmax (ng/mL) | 43.22 (19.21) | 53.59 (22.26) | 61.42 (25.56) | 66.47 (27.65) | 69.54 (28.91) | ||
| % change from GW-20 | 23.98 | 42.11 | 53.78 | 60.88 | |||
| p-value * | 0.0139 | <0.0001 | <0.0001 | <0.0001 | |||
| 100 mg | UM CYP2D6 | Steady-state Cmin (ng/mL) | 17.22 (12.94) | 19.23 (14.69) | 19.69 (15.43) | 19.10 (15.28) | 17.98 (14.63) |
| % change from GW-20 | 11.68 | 14.39 | 10.95 | 4.41 | |||
| p-value * | 0.7365 | 0.5781 | 0.777 | 0.9889 | |||
| Steady-state Cmax (ng/mL) | 30.75 (18.46) | 35.33 (21.62) | 36.73 (23.13) | 35.8 (23.15) | 33.63 (22.29) | ||
| % change from GW-20 | 14.90 | 19.47 | 16.42 | 9.38 | |||
| p-value * | 0.3889 | 0.1721 | 0.3042 | 0.7647 | |||
| EM CYP2D6 | Steady-state Cmin (ng/mL) | 23.81 (16.54) | 27.55 (19.23) | 28.59 (20.2) | 28.07 (20.02) | 26.70 (19.20) | |
| % change from GW-20 | 15.71 | 20.07 | 17.86 | 12.11 | |||
| p-value * | 0.4463 | 0.2297 | 0.3164 | 0.6357 | |||
| Steady-state Cmax (ng/mL) | 38.77 (21.65) | 45.63 (25.60) | 48.05 (27.31) | 47.47 (27.33) | 45.20 (26.36) | ||
| % change from GW-20 | 17.67 | 23.92 | 22.42 | 16.58 | |||
| p-value * | 0.1935 | 0.0412 | 0.0598 | 0.2253 | |||
| PM CYP2D6 | Steady-state Cmin (ng/mL) | 66.00 (33.70) | 81.81 (39.04) | 94.20 (44.93) | 102.77 (48.89) | 108.63 (51.48) | |
| % change from GW-20 | 23.95 | 42.72 | 55.71 | 64.58 | |||
| p-value * | 0.0425 | <0.0001 | <0.0001 | <0.0001 | |||
| Steady-state Cmax (ng/mL) | 86.44 (38.42) | 107.18 (44.52) | 122.84 (51.12) | 132.93 (55.31) | 139.06 (57.81) | ||
| % change from GW-20 | 23.98 | 42.11 | 53.78 | 60.87 | |||
| p-value * | 0.0139 | <0.0001 | <0.0001 | <0.0001 | |||
| 300 mg | UM CYP2D6 | Steady-state Cmin (ng/mL) | 62.05 (43.4) | 69.96 (49.76) | 72.27 (52.72) | 70.72 (52.68) | 67.06 (50.82) |
| % change from GW-20 | 12.75 | 16.48 | 13.98 | 8.08 | |||
| p-value * | 0.6345 | 0.4114 | 0.5583 | 0.892 | |||
| Steady-state Cmax (ng/mL) | 78.68 (49.54) | 89.65 (57.41) | 92.71 (61.00) | 90.21 (60.84) | 84.94 (58.56) | ||
| % change from GW-20 | 13.95 | 17.84 | 14.66 | 7.96 | |||
| p-value * | 0.4771 | 0.2612 | 0.4329 | 0.8636 | |||
| EM CYP2D6 | Steady-state Cmin (ng/mL) | 83.97 (54.74) | 97.78 (64.14) | 102.33 (67.94) | 101.33 (67.89) | 97.10 (65.53) | |
| % change from GW-20 | 16.45 | 21.87 | 20.67 | 15.63 | |||
| p-value * | 0.3650 | 0.1401 | 0.1708 | 0.3843 | |||
| Steady-state Cmax (ng/mL) | 101.77 (60.36) | 119.11 (70.95) | 124.76 (75.21) | 123.01 (75.01) | 117.28 (72.28) | ||
| % change from GW-20 | 17.04 | 22.59 | 20.87 | 15.24 | |||
| p-value * | 0.2577 | 0.0774 | 0.112 | 0.3306 | |||
| PM CYP2D6 | Steady-state Cmin (ng/mL) | 215.23 (103.83) | 267.09 (120.31) | 307.70 (138.54) | 335.79 (150.74) | 354.74 (158.57) | |
| % change from GW-20 | 24.09 | 42.96 | 56.01 | 64.82 | |||
| p-value * | 0.0274 | <0.0001 | <0.0001 | <0.0001 | |||
| Steady-state Cmax (ng/mL) | 239.62 (110.43) | 296.94 (127.87) | 340.49 (146.82) | 369.09 (159.08) | 387.32 (166.69) | ||
| % change from GW-20 | 23.92 | 42.10 | 54.03 | 61.64 | |||
| p-value * | 0.0194 | <0.0001 | <0.0001 | <0.0001 | |||
Cmin, trough umbilical cord concentration; Cmax, maximum umbilical cord concentration; * p-value: statistical significance test between each GW with GW-20; mean (SD).
Table 7.
Percentage of subjects with trough and peak outside the therapeutic window.
| Phenotype | Dose | Pharmacokinetic Metric | Gestational Week | ||||||||
|---|---|---|---|---|---|---|---|---|---|---|---|
| 0 | 5 | 10 | 15 | 20 | 25 | 30 | 35 | 40 | |||
| UM CYP2D6 | 50 mg | Cmin < 60 ng/mL | 100 | 98 | 98 | 99 | 100 | 100 | 100 | 100 | 100 |
| Cmax > 230 ng/mL | 0 | 0 | 0 | 0 | 0 | 0 | 0 | 0 | 0 | ||
| 75 mg | Cmin < 60 ng/mL | 94 | 94 | 96 | 97 | 93 | 97 | 98 | 100 | 100 | |
| Cmax > 230 ng/mL | 0 | 0 | 0 | 0 | 0 | 0 | 0 | 0 | 0 | ||
| 100 mg | Cmin < 60 ng/mL | 78 | 78 | 84 | 92 | 90 | 94 | 94 | 97 | 99 | |
| Cmax > 230 ng/mL | 0 | 0 | 0 | 0 | 0 | 0 | 0 | 0 | 0 | ||
| 125 mg | Cmin < 60 ng/mL | 67 | 67 | 72 | 79 | 81 | 89 | 94 | 94 | 95 | |
| Cmax > 230 ng/mL | 0 | 2 | 1 | 0 | 1 | 0 | 0 | 0 | 0 | ||
| 150 mg | Cmin < 60 ng/mL | 55 | 61 | 66 | 70 | 72 | 82 | 89 | 94 | 94 | |
| Cmax > 230 ng/mL | 1 | 2 | 2 | 2 | 1 | 1 | 1 | 0 | 0 | ||
| 175 mg | Cmin < 60 ng/mL | 40 | 46 | 50 | 58 | 55 | 67 | 74 | 80 | 88 | |
| Cmax > 230 ng/mL | 1 | 2 | 2 | 2 | 2 | 1 | 0 | 0 | 0 | ||
| 200 mg | Cmin < 60 ng/mL | 29 | 32 | 37 | 49 | 40 | 53 | 67 | 74 | 80 | |
| Cmax > 230 ng/mL | 7 | 5 | 3 | 2 | 5 | 2 | 1 | 0 | 0 | ||
| 225 mg | Cmin < 60 ng/mL | 27 | 27 | 32 | 43 | 37 | 49 | 58 | 68 | 77 | |
| Cmax > 230 ng/mL | 8 | 8 | 6 | 3 | 7 | 4 | 2 | 1 | 0 | ||
| 250 mg | Cmin < 60 ng/mL | 15 | 16 | 25 | 32 | 33 | 38 | 51 | 64 | 72 | |
| Cmax > 230 ng/mL | 15 | 14 | 8 | 7 | 9 | 6 | 2 | 2 | 1 | ||
| 275 mg | Cmin < 60 ng/mL | 11 | 15 | 20 | 28 | 30 | 37 | 43 | 55 | 68 | |
| Cmax > 230 ng/mL | 24 | 22 | 14 | 8 | 11 | 6 | 6 | 2 | 1 | ||
| 300 mg | Cmin < 60 ng/mL | 9 | 13 | 15 | 21 | 28 | 32 | 38 | 51 | 65 | |
| Cmax > 230 ng/mL | 28 | 31 | 22 | 13 | 15 | 10 | 6 | 6 | 2 | ||
| EM CYP2D6 | 50 mg | Cmin < 60 ng/mL | 93 | 95 | 98 | 98 | 97 | 98 | 99 | 100 | 100 |
| Cmax > 230 ng/mL | 0 | 0 | 0 | 0 | 0 | 0 | 0 | 0 | 0 | ||
| 75 mg | Cmin < 60 ng/mL | 80 | 86 | 90 | 92 | 91 | 96 | 97 | 97 | 98 | |
| Cmax > 230 ng/mL | 1 | 0 | 0 | 0 | 0 | 0 | 0 | 0 | 0 | ||
| 100 mg | Cmin < 60 ng/mL | 60 | 62 | 72 | 78 | 78 | 83 | 89 | 96 | 97 | |
| Cmax > 230 ng/mL | 2 | 1 | 1 | 1 | 1 | 0 | 0 | 0 | 0 | ||
| 125 mg | Cmin < 60 ng/mL | 40 | 46 | 53 | 61 | 61 | 74 | 80 | 84 | 93 | |
| Cmax > 230 ng/mL | 4 | 3 | 3 | 2 | 3 | 2 | 0 | 0 | 0 | ||
| 150 mg | Cmin < 60 ng/mL | 32 | 34 | 41 | 48 | 50 | 58 | 73 | 79 | 83 | |
| Cmax > 230 ng/mL | 8 | 4 | 4 | 3 | 3 | 3 | 3 | 1 | 0 | ||
| 175 mg | Cmin < 60 ng/mL | 19 | 13 | 19 | 24 | 35 | 41 | 46 | 55 | 74 | |
| Cmax > 230 ng/mL | 9 | 6 | 5 | 4 | 3 | 3 | 3 | 2 | 0 | ||
| 200 mg | Cmin < 60 ng/mL | 12 | 7 | 10 | 16 | 22 | 34 | 42 | 46 | 55 | |
| Cmax > 230 ng/mL | 16 | 12 | 8 | 6 | 5 | 3 | 3 | 3 | 2 | ||
| 225 mg | Cmin < 60 ng/mL | 10 | 5 | 7 | 10 | 20 | 24 | 36 | 42 | 48 | |
| Cmax > 230 ng/mL | 22 | 15 | 12 | 9 | 10 | 5 | 3 | 3 | 3 | ||
| 250 mg | Cmin < 60 ng/mL | 7 | 5 | 5 | 7 | 15 | 20 | 25 | 39 | 43 | |
| Cmax > 230 ng/mL | 34 | 24 | 17 | 14 | 17 | 13 | 5 | 3 | 3 | ||
| 275 mg | Cmin < 60 ng/mL | 6 | 4 | 5 | 5 | 12 | 16 | 22 | 36 | 42 | |
| Cmax > 230 ng/mL | 45 | 34 | 26 | 17 | 21 | 15 | 11 | 3 | 3 | ||
| 300 mg | Cmin < 60 ng/mL | 5 | 3 | 4 | 5 | 11 | 13 | 20 | 25 | 38 | |
| Cmax > 230 ng/mL | 50 | 47 | 37 | 27 | 25 | 21 | 16 | 9 | 3 | ||
| PM CYP2D6 | 50 mg | Cmin < 60 ng/mL | 44 | 45 | 48 | 50 | 58 | 60 | 65 | 65 | 69 |
| Cmax > 230 ng/mL | 2 | 1 | 1 | 1 | 1 | 0 | 0 | 0 | 0 | ||
| 75 mg | Cmin < 60 ng/mL | 18 | 19 | 20 | 21 | 23 | 26 | 30 | 33 | 37 | |
| Cmax > 230 ng/mL | 4 | 4 | 4 | 4 | 3 | 3 | 3 | 3 | 2 | ||
| 100 mg | Cmin < 60 ng/mL | 7 | 7 | 7 | 7 | 11 | 11 | 13 | 17 | 19 | |
| Cmax > 230 ng/mL | 22 | 18 | 15 | 13 | 16 | 7 | 4 | 4 | 4 | ||
| 125 mg | Cmin < 60 ng/mL | 2 | 2 | 2 | 3 | 4 | 5 | 6 | 8 | 9 | |
| Cmax > 230 ng/mL | 45 | 47 | 44 | 43 | 29 | 24 | 21 | 19 | 16 | ||
| 150 mg | Cmin < 60 ng/mL | 1 | 2 | 2 | 2 | 2 | 2 | 2 | 3 | 4 | |
| Cmax > 230 ng/mL | 64 | 65 | 59 | 57 | 46 | 45 | 44 | 36 | 28 | ||
| 175 mg | Cmin < 60 ng/mL | 0 | 0 | 0 | 0 | 0 | 0 | 0 | 1 | 1 | |
| Cmax > 230 ng/mL | 65 | 68 | 68 | 65 | 56 | 47 | 45 | 41 | 37 | ||
| 200 mg | Cmin < 60 ng/mL | 0 | 0 | 0 | 0 | 0 | 0 | 0 | 0 | 0 | |
| Cmax > 230 ng/mL | 76 | 73 | 72 | 72 | 67 | 65 | 60 | 57 | 47 | ||
| 225 mg | Cmin < 60 ng/mL | 0 | 0 | 0 | 0 | 0 | 0 | 0 | 0 | 0 | |
| Cmax > 230 ng/mL | 81 | 78 | 77 | 76 | 73 | 69 | 69 | 66 | 61 | ||
| 250 mg | Cmin < 60 ng/mL | 0 | 0 | 0 | 0 | 0 | 0 | 0 | 0 | 0 | |
| Cmax > 230 ng/mL | 85 | 87 | 86 | 82 | 81 | 79 | 76 | 72 | 69 | ||
| 275 mg | Cmin < 60 ng/mL | 0 | 0 | 0 | 0 | 0 | 0 | 0 | 0 | 0 | |
| Cmax > 230 ng/mL | 91 | 93 | 91 | 89 | 86 | 86 | 82 | 79 | 74 | ||
| 300 mg | Cmin < 60 ng/mL | 0 | 0 | 0 | 0 | 0 | 0 | 0 | 0 | 0 | |
| Cmax > 230 ng/mL | 94 | 93 | 93 | 93 | 90 | 89 | 87 | 86 | 81 | ||
Cmin, trough umbilical cord concentration; Cmax, maximum umbilical cord concentration; the red column indicates the percentage of subjects where the trough and peak outside the therapeutic window (60–230 ng/mL) is more than 20%.
Table 8.
Summary of recommended daily dose, predicted clearance, area-under-the-curve, and umbilical cord concentrations based on the recommended doses.
Table 8.
Summary of recommended daily dose, predicted clearance, area-under-the-curve, and umbilical cord concentrations based on the recommended doses.
| Gestational Week (GW) | |||||||||||
|---|---|---|---|---|---|---|---|---|---|---|---|
| Phenotype | Pharmacokinetic Metric | 0 (Baseline) | 5 | 10 | 15 | 20↓ | 25 | 30 | 35 | 40 (Full Term) | |
| UM CYP2D6 | Recommended daily dose (mg) | 250 | 250 | 275 | 300 | 300 | 300 | 300 | 300 | 300 | |
| CL (L/h) | 95.69 (51.51) | 101.60 (59.00) | 104.50 (62.05) | 128.70 (77.43) | 144.40 (113.00) | 166.70 (131.00) | 196.90 (157.80) | 234.20 (190.80) | 279.90 (231.30) | ||
| AUC (ng/mL·h) | 1691.00 (836.10) | 1665.00 (944.40) | 1640.00 (958.40) | 1611.00 (959.20) | 1603.00 (1025.00) | 1380.00 (877.50) | 1189.00 (772.30) | 1017.00 (673.40) | 863.70 (582.30) | ||
| Cord concentration | Cmin (ng/mL) | 61.49 (43.49) | 69.33 (49.85) | 71.62 (52.80) | 70.08 (52.74) | 66.45 (50.88) | |||||
| Cmax (ng/mL) | 77.97 (49.70) | 88.84 (57.58) | 91.86 (61.15) | 89.38 (60.98) | 84.16 (58.68) | ||||||
| EM CYP2D6 | Recommended daily dose (mg) | 175, 200 | 175, 200, 225 | 175, 200, 225, 250 | 200, 225, 250, 275 | 225, 250, 275 | 250, 275 | 275, 300 | 300 | 300 | |
| CL (L/h) | 66.97 (41.10) | 74.37 (43.17) | 72.33 (39.38) | 81.45 (45.32) | 91.63 (72.31) | 106.60 (86.12) | 123.40 (101.50) | 149.60 (124.70) | 175.90 (148.80) | ||
| AUC (ng/mL·h) | 1743.00 (994.60) | 1751.00 (905.60) | 1724.00 (922.30) | 1749.00 (944.70) | 1776.00 (1029.00) | 1664.00 (960.70) | 1595.00 (933.00) | 1453.00 (855.50) | 1251.00 (744.90) | ||
| Cord concentration | Cmin (ng/mL) | 69.28 (46.30) | 84.98 (56.66) | 97.57 (65.93) | 101.50 (68.97) | 97.40 (66.77) | |||||
| Cmax (ng/mL) | 83.83 (51.01) | 103.40 (62.61) | 118.80 (72.98) | 123.10 (76.28) | 117.50 (73.72) | ||||||
| PM CYP2D6 | Recommended daily dose (mg) | 75, 100 | 75, 100 | 75, 100 | 100, | 100 | 100 | 100 | 100, 125 | 100, 125 | |
| CL (L/h) | 31.44 (14.72) | 31.77 (15.88) | 32.48 (16.22) | 33.39 (16.68) | 35.11 (16.04) | 36.57 (16.46) | 38.12 (17.11) | 39.97 (17.85) | 42.18 (18.78) | ||
| AUC (ng/mL·h) | 3373.00 (1723.00) | 3331.00 (1564.00) | 3257.00 (1527.00) | 3618.00 (1598.00) | 3422.00 (1545.00) | 3251.00 (1367.00) | 3116.00 (1308.00) | 3340.00 (1452.00) | 3162.00 (1372.00) | ||
| Cord concentration | Cmin (ng/mL) | 65.60 (33.83) | 81.33 (39.24) | 93.67 (45.16) | 115.00 (56.94) | 121.50 (59.97) | |||||
| Cmax (ng/mL) | 86.10 (38.67) | 106.80 (44.91) | 122.40 (51.55) | 149.00 (65.13) | 155.90 (68.07) | ||||||
Mean (SD); Cmin, trough concentration; Cmax, maximum concentration; CL, clearance; AUC, Area-under-the-curve; ↓, initiation of foetoplacental PBPK model.
Publisher’s Note: MDPI stays neutral with regard to jurisdictional claims in published maps and institutional affiliations. |
© 2022 by the authors. Licensee MDPI, Basel, Switzerland. This article is an open access article distributed under the terms and conditions of the Creative Commons Attribution (CC BY) license (https://creativecommons.org/licenses/by/4.0/).
Share and Cite
MDPI and ACS Style
Burhanuddin, K.; Badhan, R. Optimising Fluvoxamine Maternal/Fetal Exposure during Gestation: A Pharmacokinetic Virtual Clinical Trials Study. Metabolites 2022, 12, 1281. https://doi.org/10.3390/metabo12121281
AMA Style
Burhanuddin K, Badhan R. Optimising Fluvoxamine Maternal/Fetal Exposure during Gestation: A Pharmacokinetic Virtual Clinical Trials Study. Metabolites. 2022; 12(12):1281. https://doi.org/10.3390/metabo12121281
Chicago/Turabian StyleBurhanuddin, Khairulanwar, and Raj Badhan. 2022. "Optimising Fluvoxamine Maternal/Fetal Exposure during Gestation: A Pharmacokinetic Virtual Clinical Trials Study" Metabolites 12, no. 12: 1281. https://doi.org/10.3390/metabo12121281
Note that from the first issue of 2016, this journal uses article numbers instead of page numbers. See further details here.